
 Submit a Paper
 Propose a Special lssue
 Open Access
ARTICLE
A Fine-Grained Recognition Model based on Discriminative Region Localization and Efficient Second-Order Feature Encoding
1 College of Computer and Information Engineering, Nanjing Tech University, Nanjing, 211816, China
2 School of Software, Nanjing University of Information Science and Technology, Nanjing, 210044, China
3 School of Automation, Nanjing University of Information Science and Technology, Nanjing, 210044, China
4 School of Computer Science, Nanjing University of Information Science and Technology, Nanjing, 210044, China
* Corresponding Author: Xiaorui Zhang. Email:
(This article belongs to the Special Issue: Advances in Image Recognition: Innovations, Applications, and Future Directions)
Computers, Materials & Continua 2026, 87(1), 37 https://doi.org/10.32604/cmc.2025.072626
Received 31 August 2025; Accepted 18 November 2025; Issue published 10 February 2026
 View Full Text
 Download PDF
Abstract
Discriminative region localization and efficient feature encoding are crucial for fine-grained object recognition. However, existing data augmentation methods struggle to accurately locate discriminative regions in complex backgrounds, small target objects, and limited training data, leading to poor recognition. Fine-grained images exhibit “small inter-class differences,” and while second-order feature encoding enhances discrimination, it often requires dual Convolutional Neural Networks (CNN), increasing training time and complexity. This study proposes a model integrating discriminative region localization and efficient second-order feature encoding. By ranking feature map channels via a fully connected layer, it selects high-importance channels to generate an enhanced map, accurately locating discriminative regions. Cropping and erasing augmentations further refine recognition. To improve efficiency, a novel second-order feature encoding module generates an attention map from the fourth convolutional group of Residual Network 50 layers (ResNet-50) and multiplies it with features from the fifth group, producing second-order features while reducing dimensionality and training time. Experiments on Caltech-University of California, San Diego Birds-200-2011 (CUB-200-2011), Stanford Car, and Fine-Grained Visual Classification of Aircraft (FGVC Aircraft) datasets show state-of-the-art accuracy of 88.9%, 94.7%, and 93.3%, respectively.Keywords
Fine-grained recognition aims to provide a more detailed and specific classification of similar objects or categories. Its applications span various fields such as everyday life, commerce, security, and nature conservation [1]. For example, precise identification of various bird species helps scientists monitor populations and develop conservation strategies in around bird conservation. In the business world, accurately identifying different product types and specifications can provide customers with tailored recommendations, increasing sales. However, fine- grained images often come with complex backgrounds, and the target objects to be identified occupy a relatively small proportion of the image, making existing methods time- consuming to train and limited in their ability to achieve high recognition accuracy. Therefore, there is the need to develop faster and more accurate fine-grained recognition methods.
In the field of computer vision, fine-grained recognition has always been a difficult topic, leading academics to suggest a variety of approaches to deal with this challenging issue. For instance, there are frequently just a few high-quality image samples available due to the high expense of physical work. Moreover, fine-grained samples follow a long-tail distribution [2], where there are many samples in the “head classes” with few categories, and fewer samples in the “tail classes” with many categories [3]. This distribution frequently results in models that identify head classes well but tail classes poorly. Researchers have proposed data augmentation techniques [4] to expand datasets. However, these methods have limitations. Some cropped samples contain only background regions. Erased samples may remove discriminative regions. Consequently, these methods generate many ineffective augmented samples, reducing augmentation effectiveness. Additionally, fine-grained images [5,6] from different categories often exhibit subtle differences only in some local regions, i.e., characterized by small inter-class differences. Traditional first-order features [4] frequently fail to capture these subtle differences, as they are extracted from isolated local regions of the image and do not account for the spatial relationships or contextual information. To distinguish subtle differences, researchers have introduced second-order feature encoding methods, which compute the covariance or correlation matrix between first-order features. By capturing the joint distribution of first-order features, second-order features reveal the interdependencies between features within local regions, thereby highlighting subtle variations that may be overlooked when considering the image. Nevertheless, traditional second-order features encoding methods are computationally expensive due to their high dimensionality and the need for two rounds of feature extraction, resulting in time-consuming training processes.
To address the above challenges, this study proposes a fine-grained recognition model based on discriminative region localization and efficient second-order feature encoding. Firstly, considering the complexity of back- grounds and the small proportion of objects in images, this study designs a data augmentation method to ensure accurate localization of discriminative regions. This method solves the issue of inaccurate localization of discriminative regions caused by complex backgrounds and small proportion of objects in images by using the weight matrix of the fully connected layer to rank the importance of each channel, with a channel of the feature map representing a portion of the image. By selecting channels with higher importance, the method further accurately localizes the discriminative regions. Second, a efficient second-order feature encoding module is designed in this study. To reduce computational complexity and minimize training time, this module conducts a one-round feature extraction and feature down- sampling based on a single CNN for second-order feature encoding. This lessens the issue of training taking a long period because of high-dimensional second-order features that are present in conventional techniques. In brief, the following sums up our contributions.
• We propose an importance ranking algorithm for localizing discriminative regions. This algorithm utilizes a weight matrix from the fully connected layer, where higher value corresponds to channels with greater importance for fine-grained image recognition. Channels with higher importance represent image regions that are more advantageous for recognition. By selecting and combining these channels based on their importance using the weight matrix, we generate an enhanced image that accurately localizes discriminative regions essential for fine-grained recognition. This approach effectively addresses the challenge of localizing discriminative regions in images with complex backgrounds and small target object proportions.
• We design a new, efficient second-order feature encoding module. This module reduces the dimensionality of the features extracted by the fourth convolutional group of ResNet-50 and calculates the covariance matrix between these reduced features and these extracted by the fifth convolutional group to generate second-order features. The fourth convolutional group, with its shallower layers and smaller receptive field, captures features rich in edges, textures, and color, directly reflecting the local structure of the image. In contrast, the fifth convolutional group, with its larger receptive field and deeper layers, aggregates information to produce features with richer semantic content. By employing a single CNN for both feature extraction and dimensionality reduction in one pass, this method significantly shortens training time and reduces computational complexity.
The rest of this paper is structured as follows: Section 2 reviews the related work; Section 3 presents the proposed method; Section 4 provides the quantitative and visual results, along with comparisons to related studies; and Section 5 summarizes the main contributions of this research and offers suggestions for future work.
Fine-grained recognition tasks are critical in various fields, including daily life, commerce, security, and nature conservation. Due to the inherent challenges of these tasks, they have been the focus of extensive research over the past few decades. This section provides a detailed review of related work, organized into three key aspects: network structure, data augmentation, and second-order feature encoding.
Single-channel and dual-channel CNNs are the two most common network models used in fine-grained recognition applications. A variation of the single-channel CNN, the dual-channel CNN consists of two CNN networks, or feature extractors. It extracts the information about interactions between various regions from the feature maps that the two CNN networks extracted using bilinear pooling procedures [7]. In 2015, Lin et al. [8] proposed a novel dual-channel CNN model for extracting high-order features from images. This model multiplied the features outputted by two parallel networks, M-Net and D-Net, and pooled them to obtain an image descriptor, thereby enhancing feature representation capability. In 2017, Lin et al. utilized the pooling outputs of the dual-channel CNN for feature extraction and located feature interactions under certain rules to obtain second-order features. However, the results of the experiments indicated that the bilinear CNN needed two feature extraction rounds, which resulted in lengthy training periods. Furthermore, a significant amount of redundant data was included in the second-order features that were produced following feature interaction. The authors made an effort to lessen superfluous features without compromising identification accuracy, however the results were not very pleasing. Although the dual-channel CNN can capture interaction information between different regions in feature maps, it requires two rounds of feature extraction, resulting in prolonged training time. In this study, we apply dimensionality reduction and down sampling to the features outputted by the fourth convolutional group of ResNet-50, ensuring that the feature dimensions from the fourth and fifth convolutional groups are consistent. Then, we encode the features from the fourth and fifth convolutional groups using the efficient second-order feature encoding method proposed in this study. By employing a single CNN for one round of feature extraction, we effectively shorten training time. For further details, please refer to Section 3.1 in this paper.
Data augmentation is a method that takes original samples and applies a few adjustments to create new ones. Its goal is to increase the dataset’s size to mitigate the overfitting issue brought on by a lack of training data. Tran et al. [9] analyzed data augmentation strategies from the perspective of Bayesian methods, learning missing data from the distribution of the training set to perform data augmentation. However, this method does not specifically focus on discriminative regions. Hu et al. [10] employed a single channel to guide the generation of augmented samples through cropping and erasing, treating discriminative and background regions equally. Cropping and erasing may unintentionally eliminate discriminative regions when the fraction of objects to be identified is low, making it impossible to increase the number of samples containing discriminative regions in a targeted manner. Chen et al. [11] randomly sampled a batch and applied two types of data augmentation to each image in the batch, producing two views. They aimed to bring different views of the same image closer together in latent space and keep views of different images far apart. This method could not guarantee that augmented samples must contain discriminative regions since it did not distinguish between discriminative and background regions, even though restricting augmented samples with loss functions made them more rational and realistic. Current data augmentation methods in fine-grained recognition research increase sample numbers but primarily rely on simple geometric transformations. These methods treat both target object regions and background regions equally, without focusing on discriminative regions. As a result, some augmented samples may consist solely of background regions, generating ineffective samples and weakening the model’s generalization ability. To address this issue, this study proposes an importance-ranking algorithm for localizing discriminative regions. This algorithm leverages the weight matrix of the fully connected layer to rank the importance of each channel in the feature map. Since each channel corresponds to a specific part of the image, selecting and combing channels with higher importance allows for precise localization of discriminative regions. This ensures that the augmented samples generated through data augmentation contain meaningful discriminative regions, thereby enhancing the effectiveness of the new samples.
2.3 Second-Order Feature Encoding
The distinctions between object categories in fine-grained recognition tasks are often so slight that they cannot always be made out, not even with convolutional features. Several techniques for computing second-order features have emerged to capture the minor distinctions between features of different categories. Second-order feature encoding methods combine first-order features, such as by taking the outer product of features [12,13]. Second-order features can capture interactions between features and express nonlinear relationships. Lin et al. [8] extracted features from images using two separate CNNs. To acquire second-order features, they multiplied the feature values in distinct channels at the same place in the two feature maps. The capacity to represent features is improved by these second-order features, which are the sum of the features from two CNN paths. Gao et al. proposed a compact bilinear pooling method, which effectively reduces feature dimensions compared to conventional bilinear pooling methods, albeit with a slight decrease in performance. Kong and Fowlkes [14] introduced the LRBP model, which addresses the issue of excessively high dimensionality of fused second-order features and the need for large parameter quantities in linear classifiers through two successive approximation operations: low-rank approximation of parameter matrices and shared projection. Cui et al. [15] proposed the Kernel Pooling framework, which captures second-order information between features and is versatile. Paschali et al. [16] proposed the bilinear attention pooling method, which randomly selects a channel from the features outputted by the fourth convolutional group of ResNet-50 and multiplies it channel-wise with features from the fifth convolutional group to obtain second-order feature [17]. Nevertheless, the second-order features could not always improve discriminative region features because of the randomness of the selection process. Although second-order features can capture local structures and texture information, offering stronger feature representation and improved classification performance, traditional second-order feature encoding methods require two CNNs to extract first-order features from images and combine them. This leads to longer training time and high-dimensional fused features. Therefore, this study applies dimensionality reduction, down sampling, and filtering to the features outputted by the fourth convolutional group of ResNet-50 to generate an attention map. This attention map is then multiplied channel-wise and pixel-wise with the features from the fifth convolutional group to produce second-order features. By performing feature extraction only once and reducing the dimensionality and complexity of the features, we shorten training time and alleviate the issue of excessively high dimensionality in fused second-order features.
In this section, we present a novel fine-grained recognition model, termed sfeModel, which based on discriminative region localization and efficient second-order feature encoding. To localize discriminative regions, we propose an importance-ranking algorithm. Additionally, we design an efficient second-order feature encoding module to reduce the dimensionality of second-order features and shorten training time. The following subsections will provide a detailed overview of the model from four aspects: Architecture, Efficient Second-Order Feature Encoding, Discriminative Region Localization, and Data Augmentation.
In order to reduce training time and mitigate the difficulties caused by small object proportions and complex backgrounds in fine-grained images, sfeModel uses ResNet-50 as the backbone network and integrates a data augmentation module and an effective second-order feature encoding module, as shown in Fig. 1. The efficient second-order feature encoding module utilizes a single CNN for one round of feature extraction. It reduces and down samples the convolutional features outputted by the fourth convolutional group to generate an attention map, then performs elementwise multiplication between the attention map and the convolutional features of the fifth convolutional group at corresponding positions to obtain second-order features. Rather than treating background and discriminative regions equally, the data augmentation module uses the significance ranking method to localize discriminative regions, guaranteeing that supplemented samples contain discriminative regions.
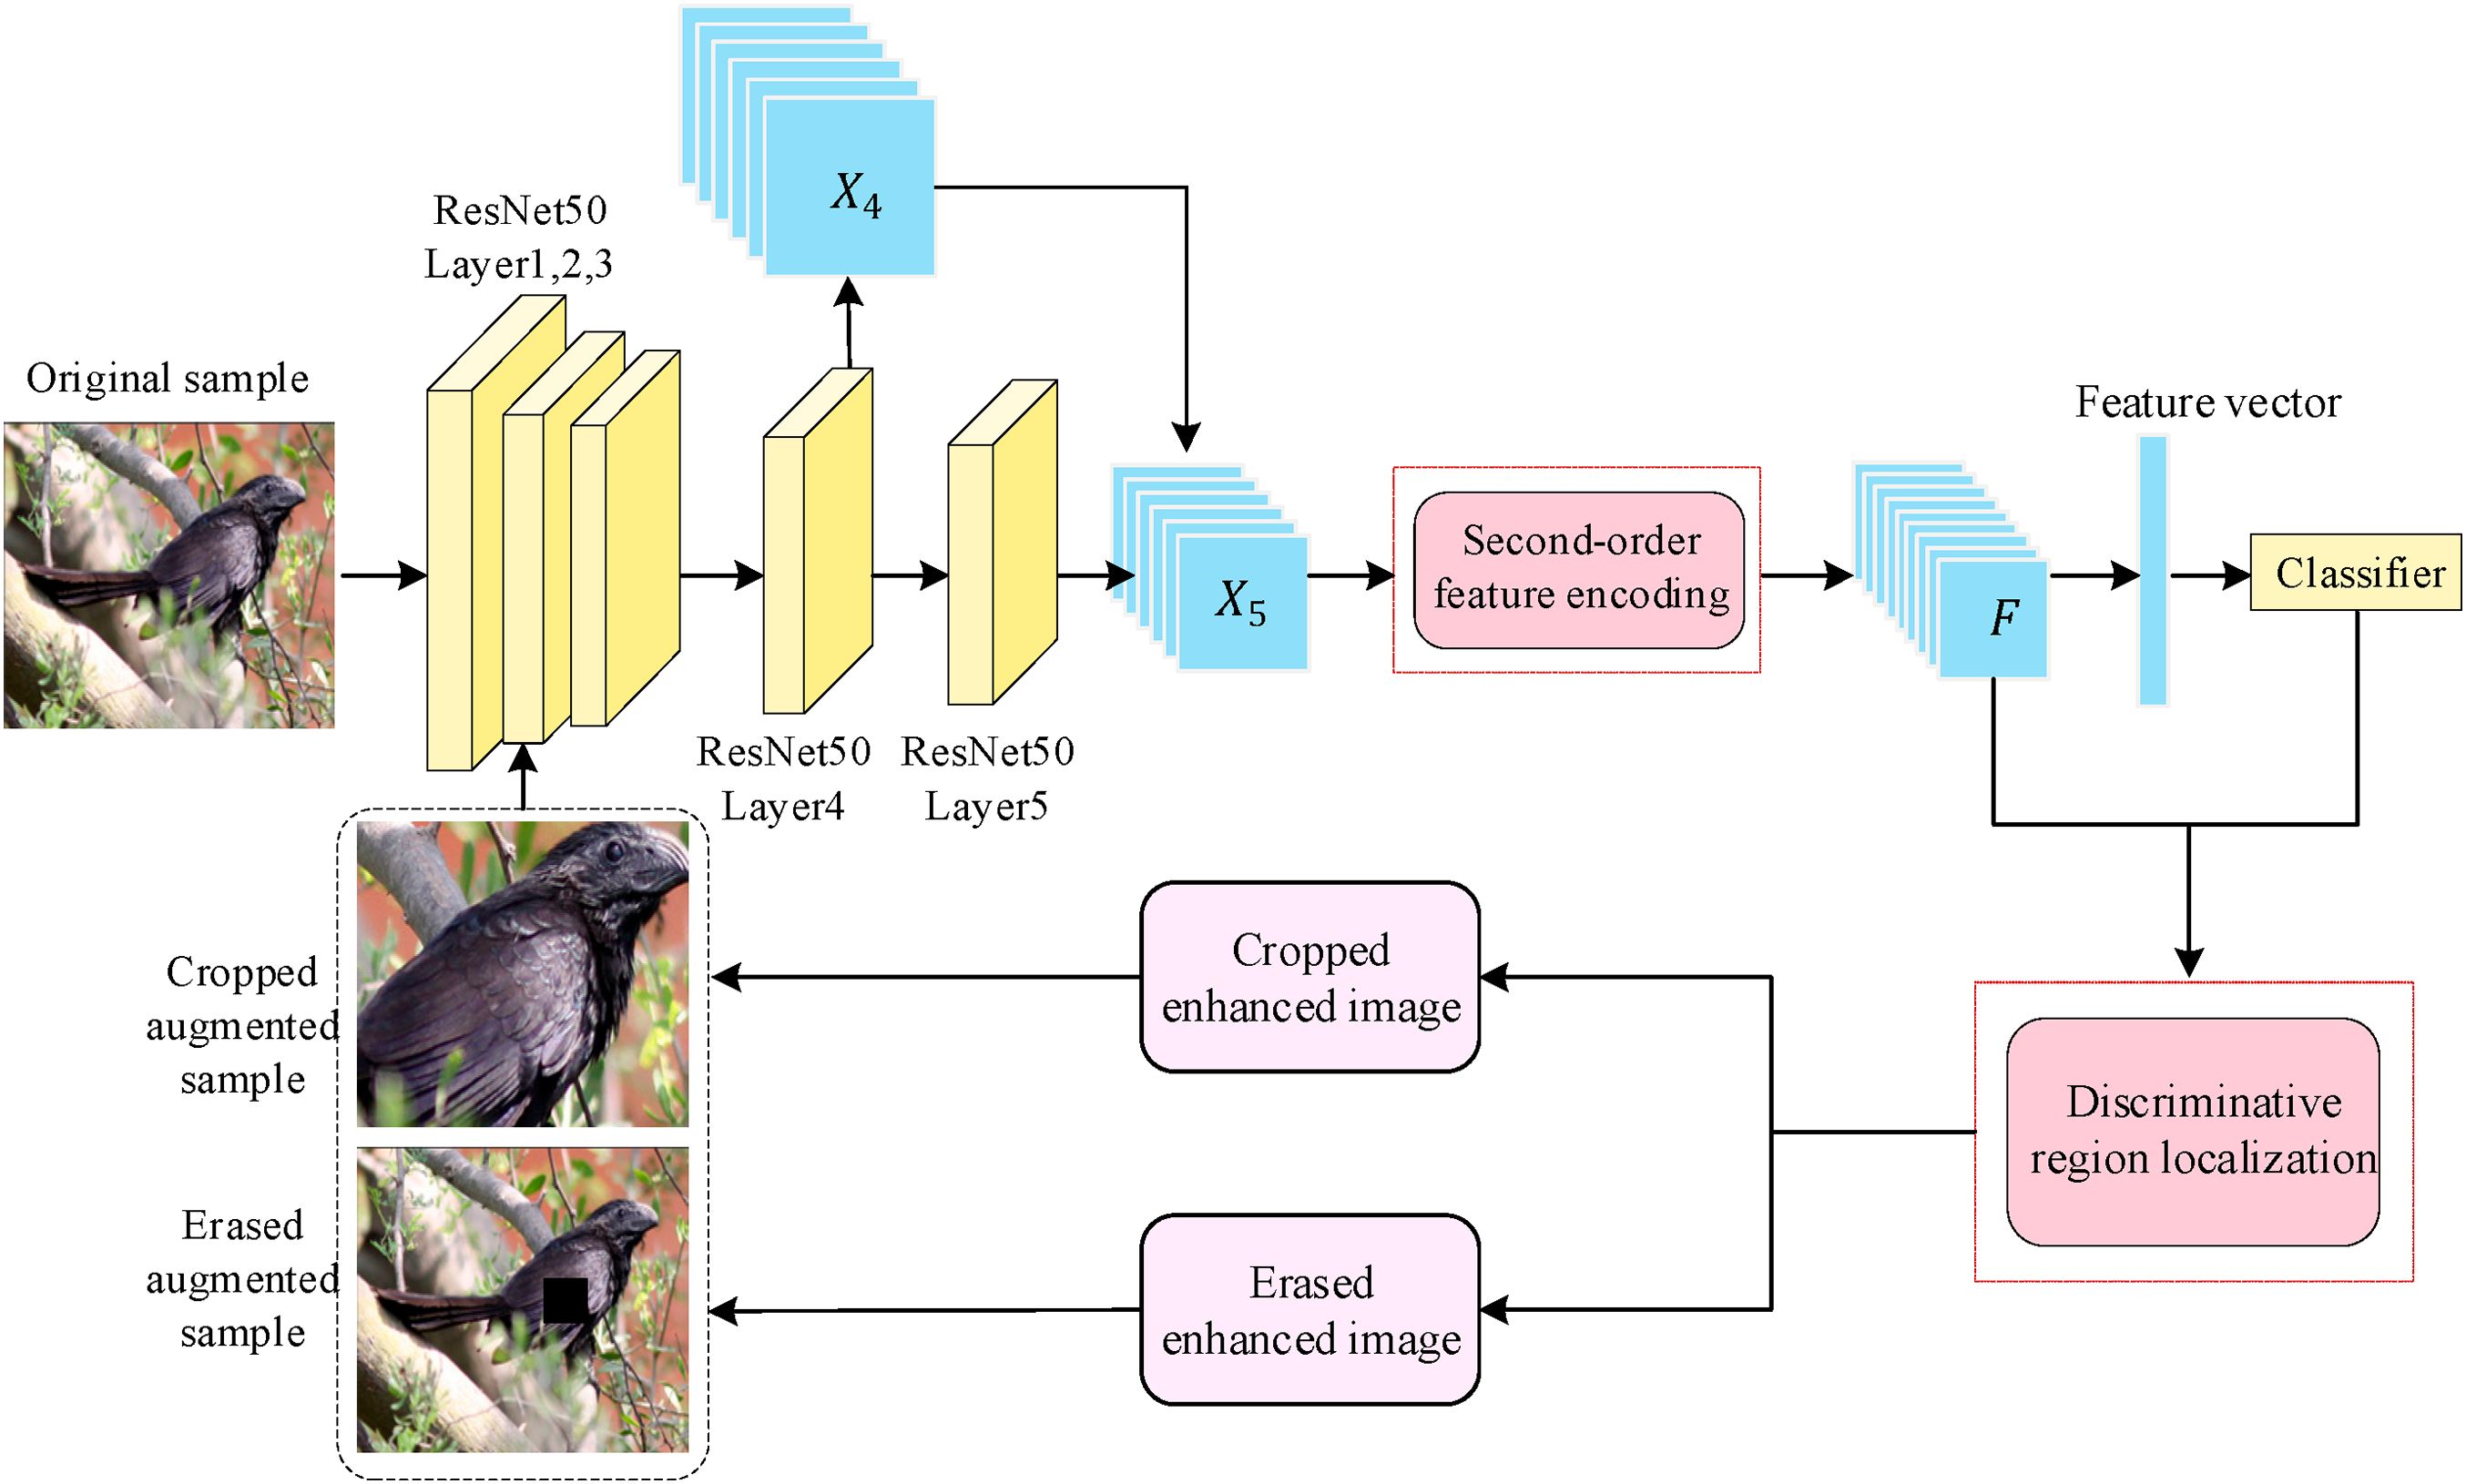
Figure 1: Overall network architecture diagram
The sfeModel reduces training time and increases identification accuracy by combining the effective second-order feature encoding module and the data augmentation module. This helps to efficiently handle the obstacles presented by complicated background and small object proportions in images.
3.2 Efficient Second-Order Feature Encoding
Previous studies have shown that second-order feature encoding can effectively capture local structural and textural information, thereby enhancing feature representation and classification performance. In contrast, traditional aggregation methods such as summation or averaging rely solely on first-order statistics. As illustrated in Fig. 2, let the convolutional features outputted by the fourth convolutional group and the fifth convolutional group be denoted as
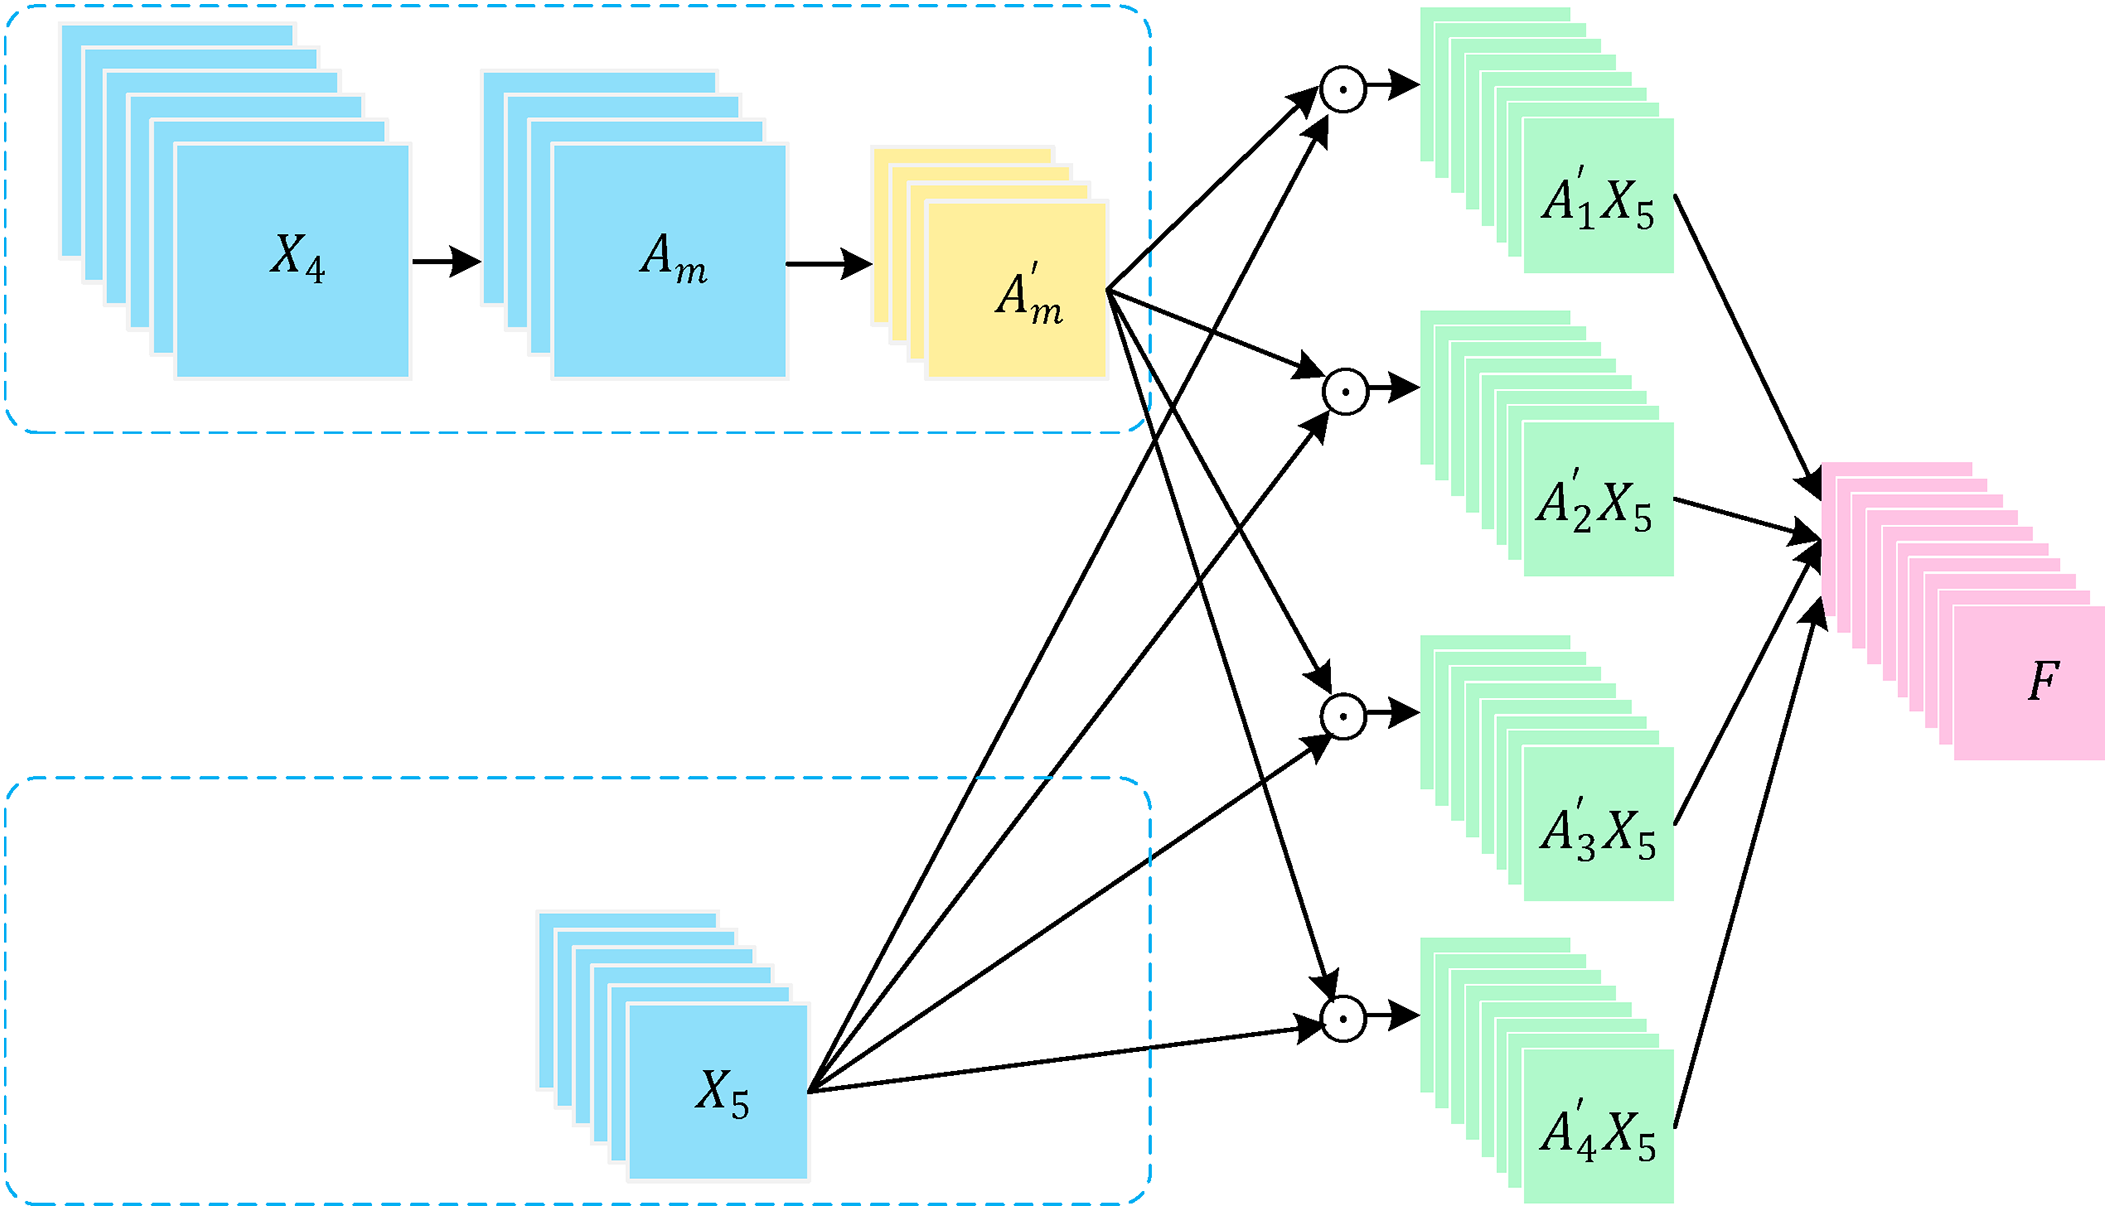
Figure 2: Diagram of second-order feature encoding process
In this context, F represents second-order features,
3.3 Discriminative Region Localization
Through the second-order feature encoding module described in Section 3.1, we obtain a second-order feature map
The classifier is implemented by fully connected layers and a soft max layer. The fully connected layers use a weight matrix to map the dimension-reduced feature vector
As shown in Fig. 3, based on the weight matrix
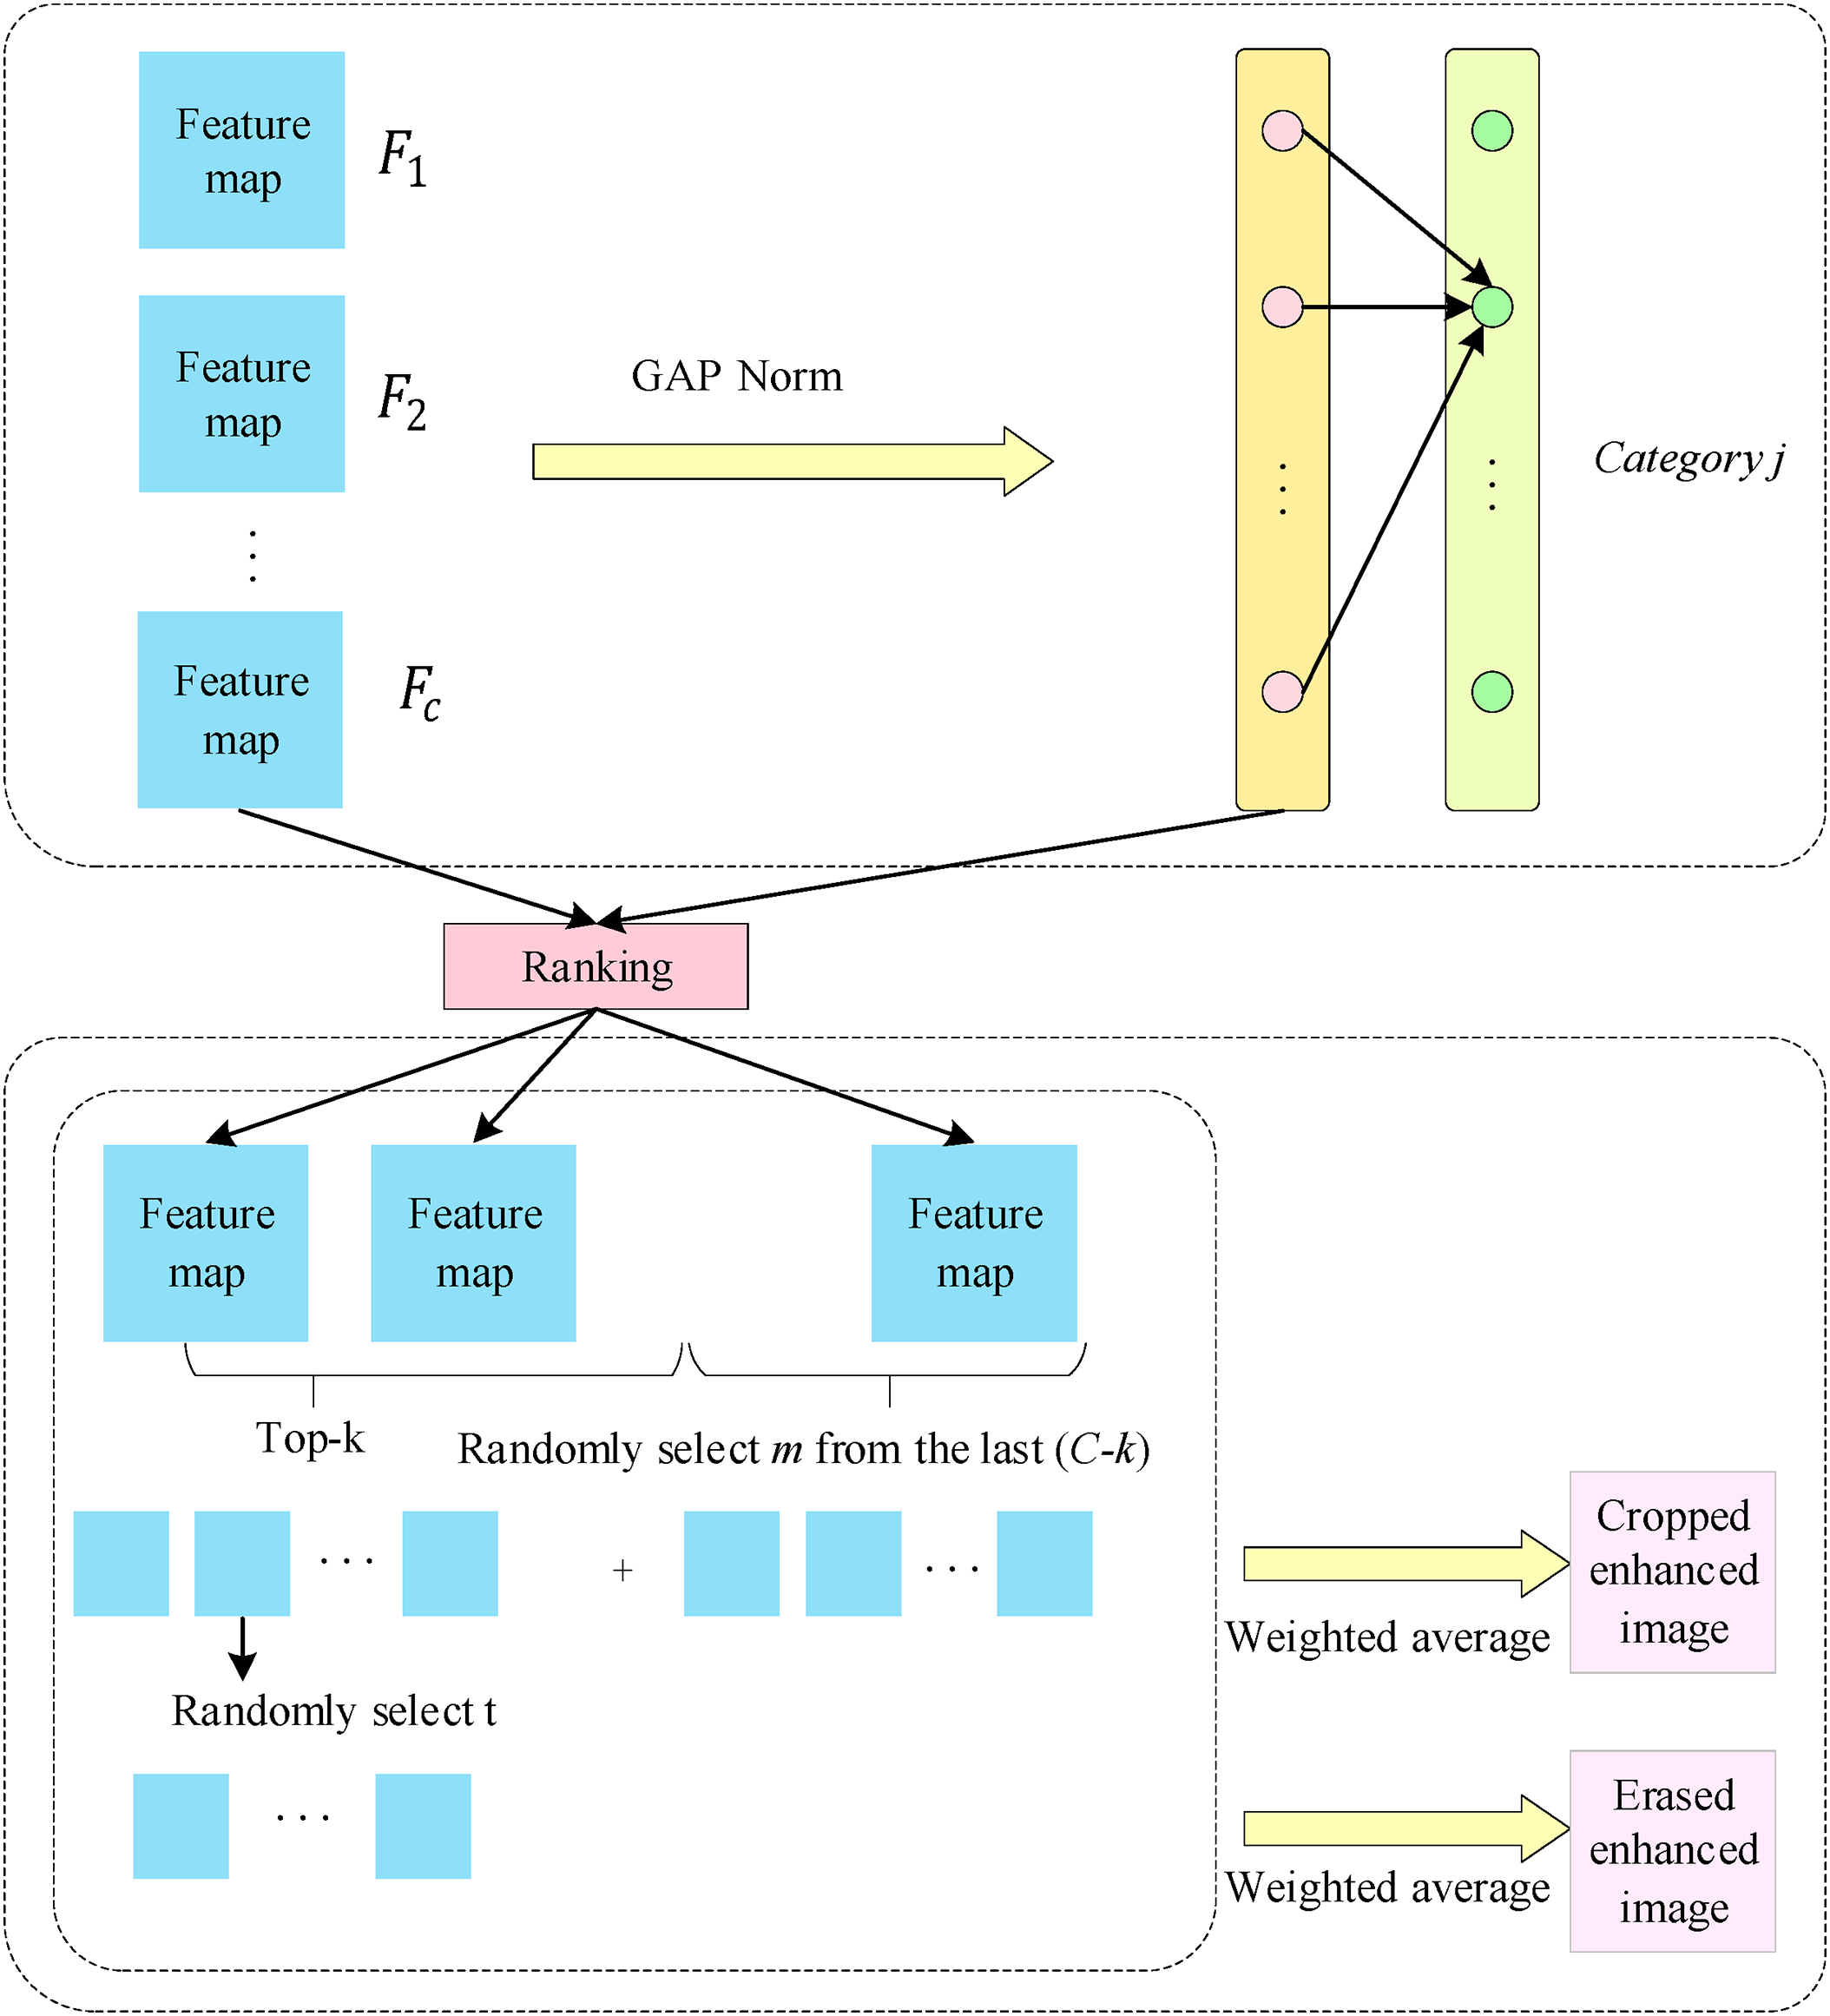
Figure 3: Discriminative region localization maps
where
As illustrated in Fig. 4, region cropping is the technique of selecting discriminative regions from the original sample image, enlarging them to match the original image’s size, and then feeding the regions into a CNN network for training. The procedure described in Section 3.3 yields the cropped enhancement image, whose length and width are both less than those of the original image. To match the size of the original image, the cropped enhanced image is first up sampled. Then, the cropping mask
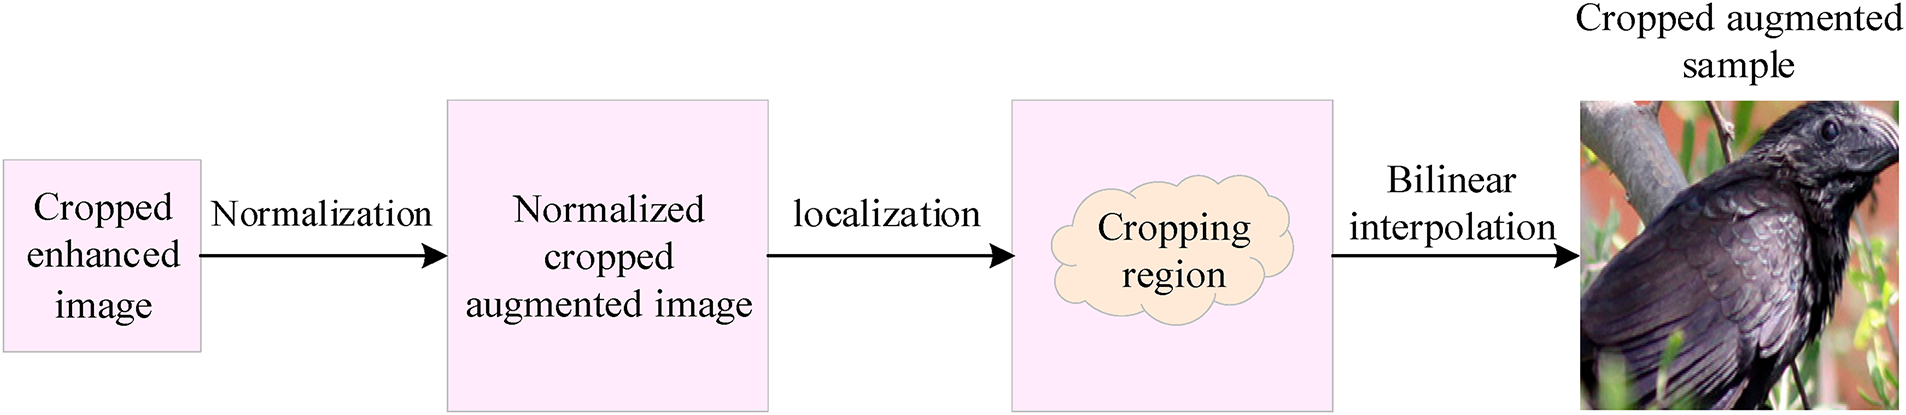
Figure 4: Flowchart of region cropping process
where
Region erasure refers to randomly erasing parts of discriminative regions from the original image and using the erased image as an augmented sample for training, as shown in Fig. 5. The dimensions of the erased enhanced image are less than those of the original image, and it can be obtained by following the instructions in Section 4.2. First, the erased enhancement image is up sampled to the same size as the original image, and then the erasure mask of pixels in the erased enhancement image, denoted as
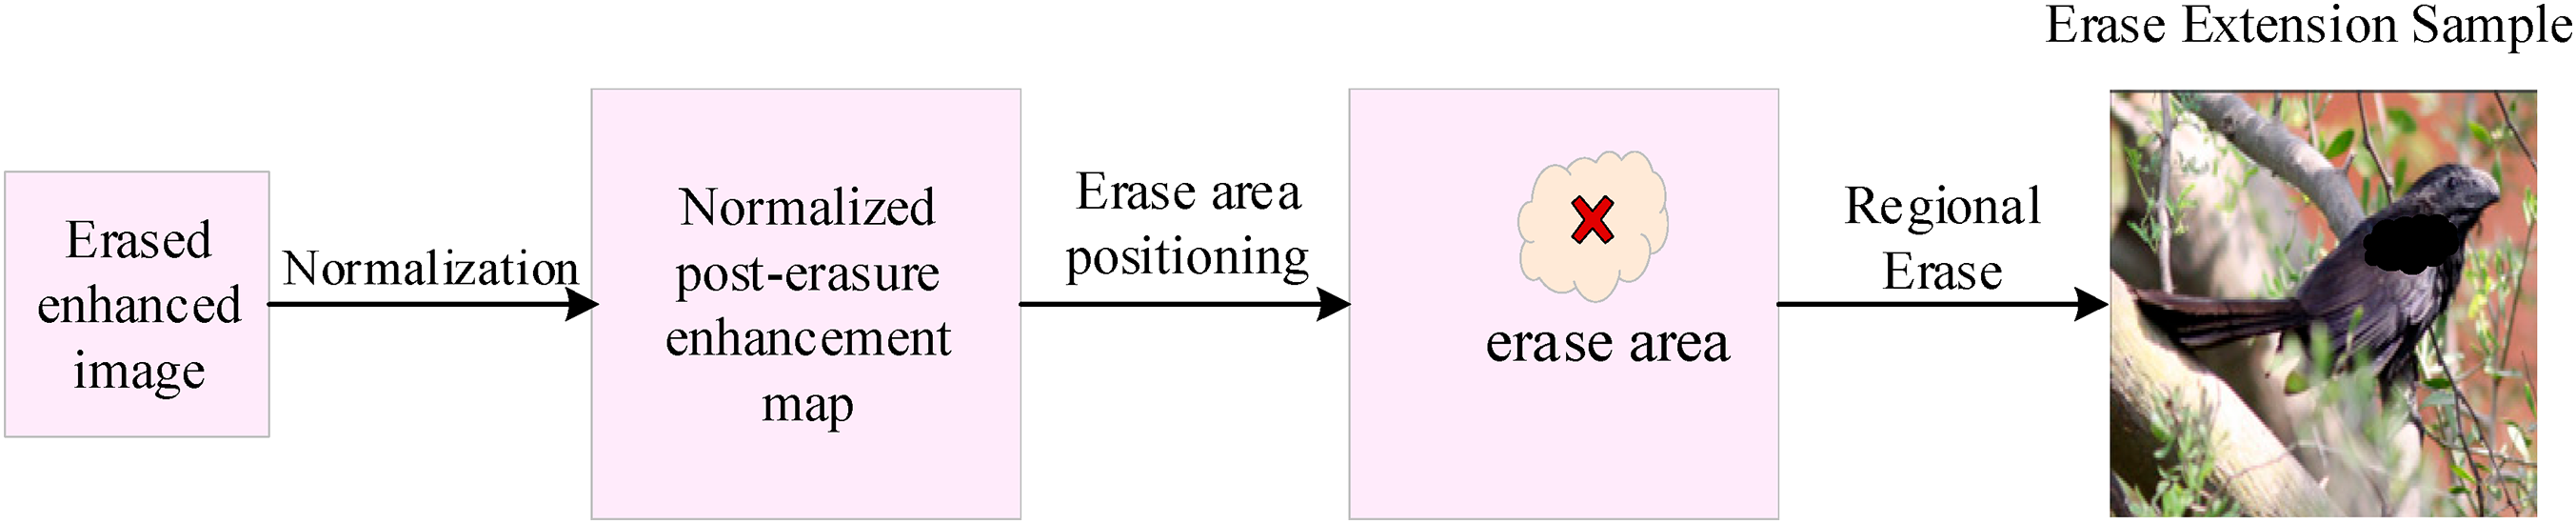
Figure 5: Flowchart of region erasure process
where
This section provides an analysis of the experimental details and results of the proposed solution. Through ablation studies and comparative experiments with state-of-the-art methods, we validate the effectiveness of our approach. Additionally, to visually illustrate the impact of different image regions on the outcome, we conducted visualization experiments. The following subsections will provide a detailed explanation of the dataset, evaluation metrics, experimental procedures, and results.
This study conducts experiments on three datasets including CUB-200-2011, Stanford Cars, and FGVC Aircraft. For region cropping and region erasure, the threshold θ was randomly sampled uniformly between 0.2 and 0.4.
For the objects that need to be classified, each of the three datasets has part annotation points, bounding box annotations, and category labels. All trials, however, simply use the object’s category labels. For the objects that need to be classified, each of the three datasets provides part annotation points and bounding box annotations in addition to category labels. It is important to emphasize that in all our experiments, only the image data and category labels were used for both training and testing; no bounding boxes, part annotations, or other localization signals were utilized at any stage. This ensures a fair comparison with other weakly-supervised methods and demonstrates our model’s capability to autonomously locate discriminative regions.
Table 1 displays the specifics of the three datasets. CUB-200-2011 dataset comprises 11,788 images of 200 bird species, with a nearly 1:1 ratio between the training and test sets. Because birds usually have small bodies, the bird item takes up a small amount of the image. Furthermore, birds frequently rest on elaborate tree branches or structures, creating background that are varied and complicated. Furthermore, birds differ significantly in appearance while they are in various stances, including flying, standing, and spreading their wings. As a result, this dataset is generally acknowledged to be difficult for tasks involving recognition. Stanford Cars dataset comprises 16,185 images of 196 car models, with a nearly 1:1 ratio between the training and test sets. The images are captured from multiple angles, leading to significant variations in the proportions of the objects across different images.
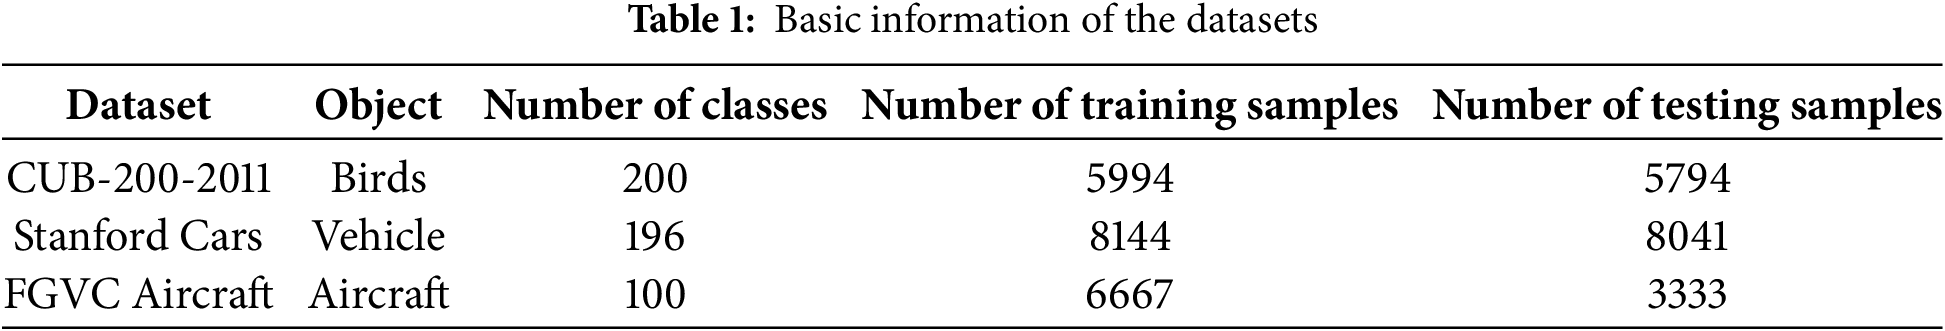
FGVC Aircraft dataset comprises 10,000 images of aircraft. It can be categorized into four levels of granularity: Manufacturer, Family, Variant, and Model. This research employs the Variant level, where the 10,000 aircraft images are divided into 100 different categories. The ratio of training set to test set is approximately 2:1.
This study uses ACC (Accuracy) as the evaluation metric. ACC is calculated as the proportion of correctly predicted samples to the total number of testing samples, as shown in Eq. (7):
where
PyTorch 1.0 was utilized to train this study. An i7-10700 CPU and an NVIDIA GeForce RTX 2070 GPU were part of the experimental configuration. ResNet-50, which was initially trained using pre-trained weights from ImageNet, was used as the backbone network. During the training process, the momentum coefficient was set to 0.9, the weight decay parameter was set to 1e−5, and the initial learning rate of the network was set to 1e−3. The learning rate was multiplied by 0.9 every two epochs. The batch size for training samples was set to 10. For region cropping and region erasure, the thresholds
The loss function is the cross-entropy loss, as shown in Eq. (8). Although this study rarely introduces noise during data augmentation, a small weight is still assigned to augmented samples through a series of comparative experiments. In Eq. (8), when
here,
Since normalizing the modulus reduces the value of the cross-entropy loss and slows down the convergence speed of the model, this study adopts the approach of multiplying the modulus by a hyperparameter s to normalize the modulus to a larger value. Here, s is set to 100, as shown in Eq. (9).
To reduce random error, this study trains for 80 epochs on each dataset and conducts five tests. The average of the five test results is taken as the result.
Using the Stanford Cars dataset, we ran our initial tests with qualitative analysis. The curves representing training and validation accuracy and loss as epochs vary are depicted in Fig. 6a,b, respectively. In Fig. 6a, the vertical axis denotes accuracy; in Fig. 6b, it reflects the loss value. The horizontal axis in both cases indicates the number of epochs. The validation curves closely track the training curves, indicating stable convergence and good generalization without severe overfitting.
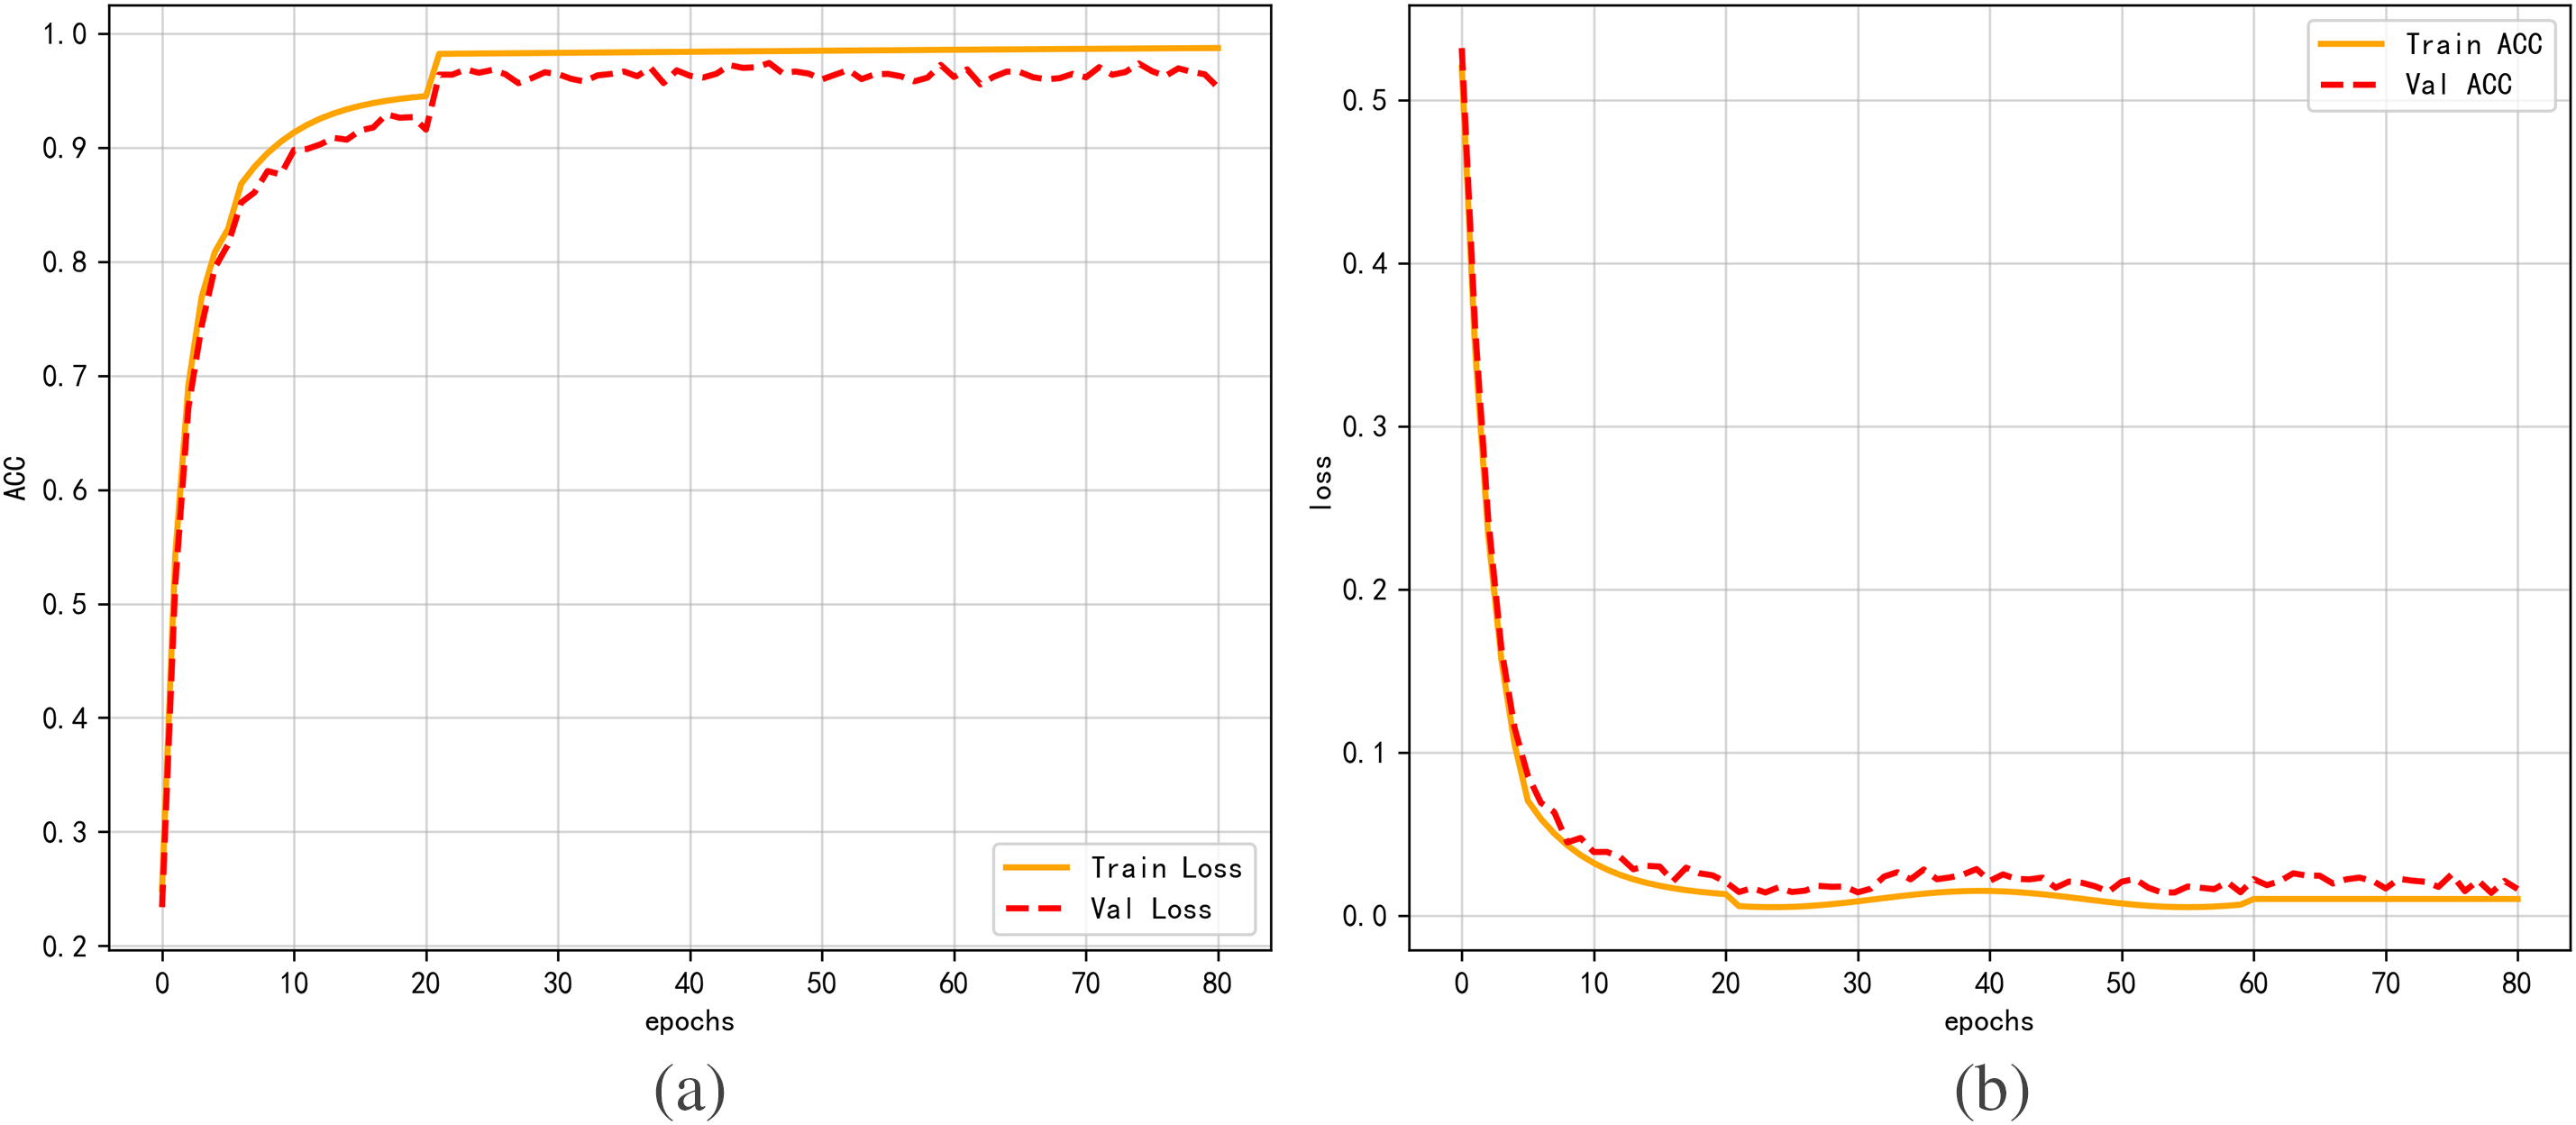
Figure 6: Diagram of the proposed model’s training process. (a) Training and validation accuracy. (b) Training and validation loss
Over the course of training, the loss value progressively approaches 0 and the model’s accuracy gradually increases with more epochs, gradually nearing 1. The model exhibits rapid convergence in the first twenty epochs, followed by a gradual flattening in the following epochs, and finally stabilization, as seen by the figures. This suggests that the model put forward in this study has a very high degree of stability.
To demonstrate the effectiveness of the proposed method in this study, we retrained the model on the same training set after removing the second-order feature encoding module and data augmentation module. Similarly, the model was trained for 80 epochs. Fig. 7a,b respectively shows the curves of training and validation accuracy and loss of the model as epochs change after removing the second-order feature encoding module and data augmentation module. During training, the model’s accuracy improves with increasing epochs, gradually approaching 0.94, and the loss value decreases with increasing epochs, gradually approaching 0.15. Upon comparing Figs. 6 and 7, it is evident that in the absence of second-order feature encoding and data augmentation, the accuracy significantly declines by 5 percentage points and the loss value increases by 15 percentage points, even though the model gradually stabilizes after training for 20 epochs. This demonstrates how well the second-order feature encoding and data augmentation techniques are suggested for this model work.
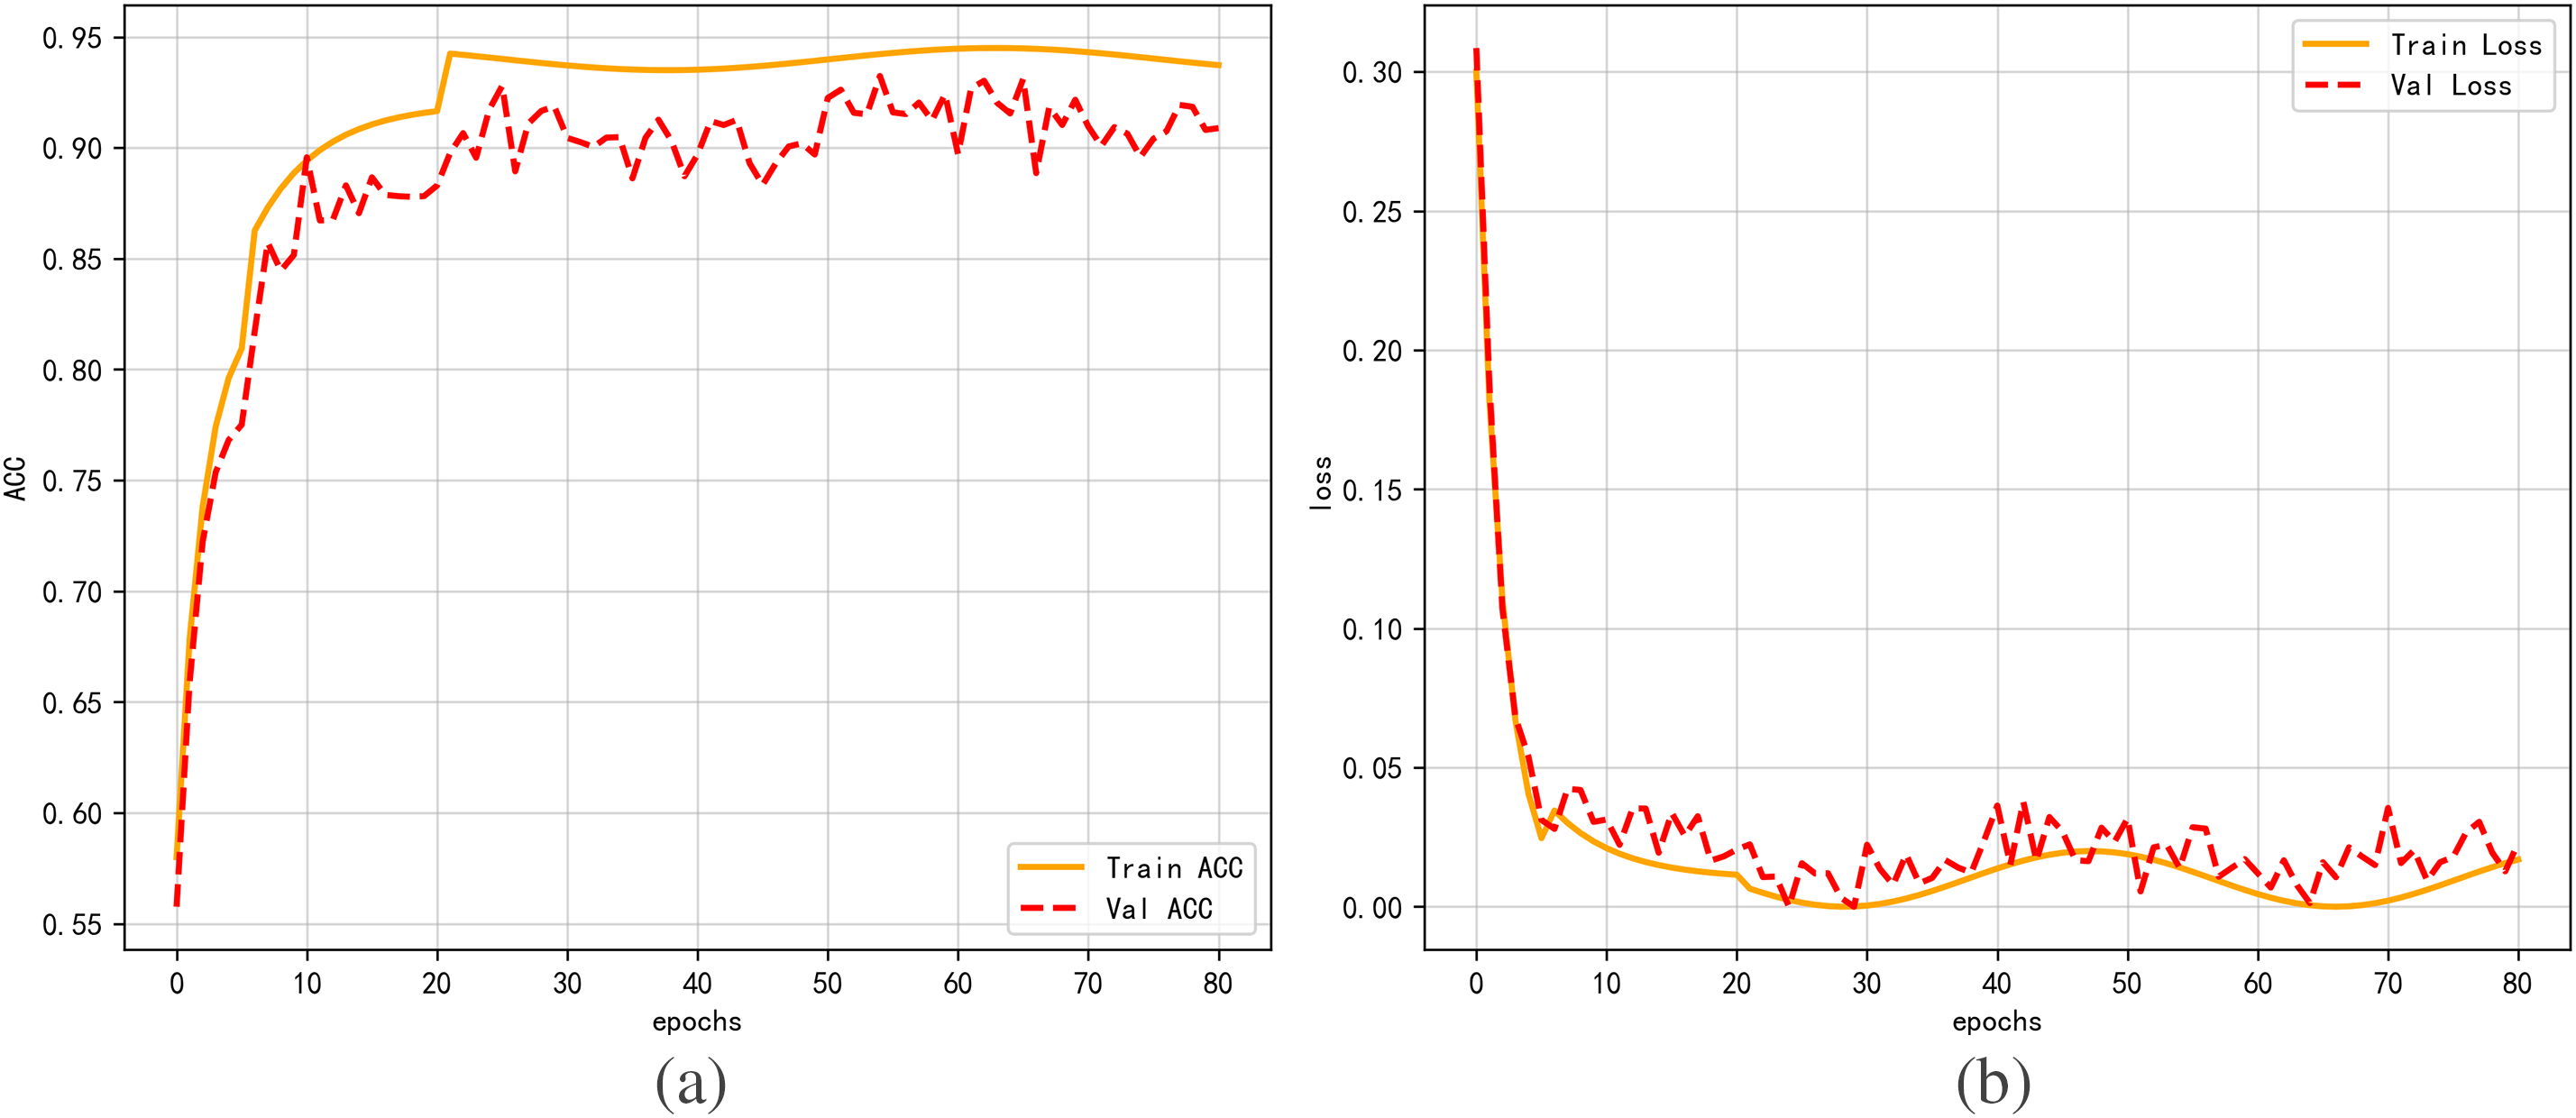
Figure 7: Diagram of the model’s training process without the second-order feature encoding and data augmentation modules. (a) Training and validation accuracy. (b) Training and validation loss
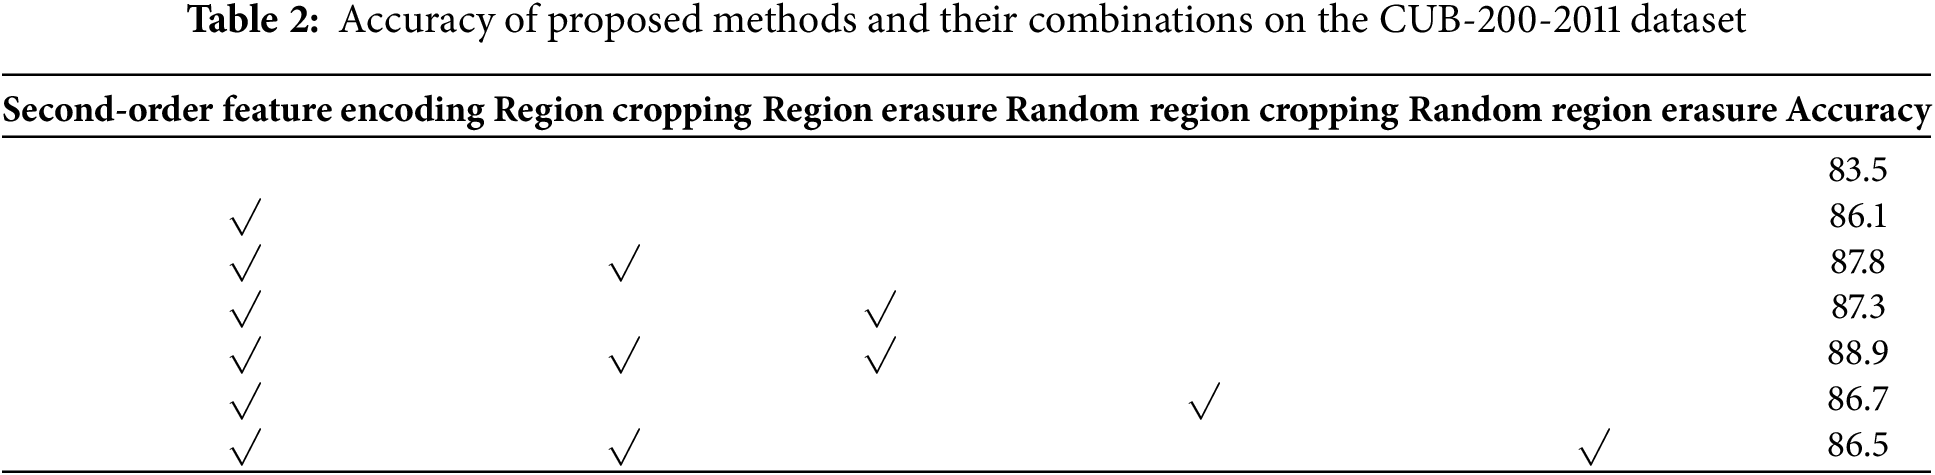
Next, the CUB-200-2011 dataset was subjected to trials in quantitative analysis in this study. The accuracy results obtained on the CUB-200-2011 dataset using both ResNet-50 alone and ResNet-50 with the inclusion of the second-order feature encoding module are shown in Table 2’s first and second rows. After the second-order feature encoding module was included, the accuracy rose from 83.5% to 86.1%, showing a 2.6 percentage point improvement and demonstrating the second-order encoding module’s efficacy. Table 2’s third row, which is an improvement of 1.7 percentage points over the second row, illustrates how successful the region cropping strategy is. The efficacy of the region erasure method is demonstrated by the fourth row, which exhibits an improvement of 1.1 percentage points over the third row. Comparatively, for fine-grained recognition tasks, the region cropping method outperforms the region erasure method. The accuracy results achieved with the region cropping approach suggested in this study and the random region cropping method are shown in Table 2’s third and sixth rows, respectively. When the two are compared, accuracy is not significantly improved by the random region cropping method; instead, it barely improved by 0.6 percentage points. The efficacy of the region cropping strategy suggested in this study was further demonstrated by the fact that it outperformed the random region cropping method by 1.1 percentage points. The region erasing method suggested in this study performs better than the random region erasure method, as can also be seen by comparing the fifth and seventh rows.
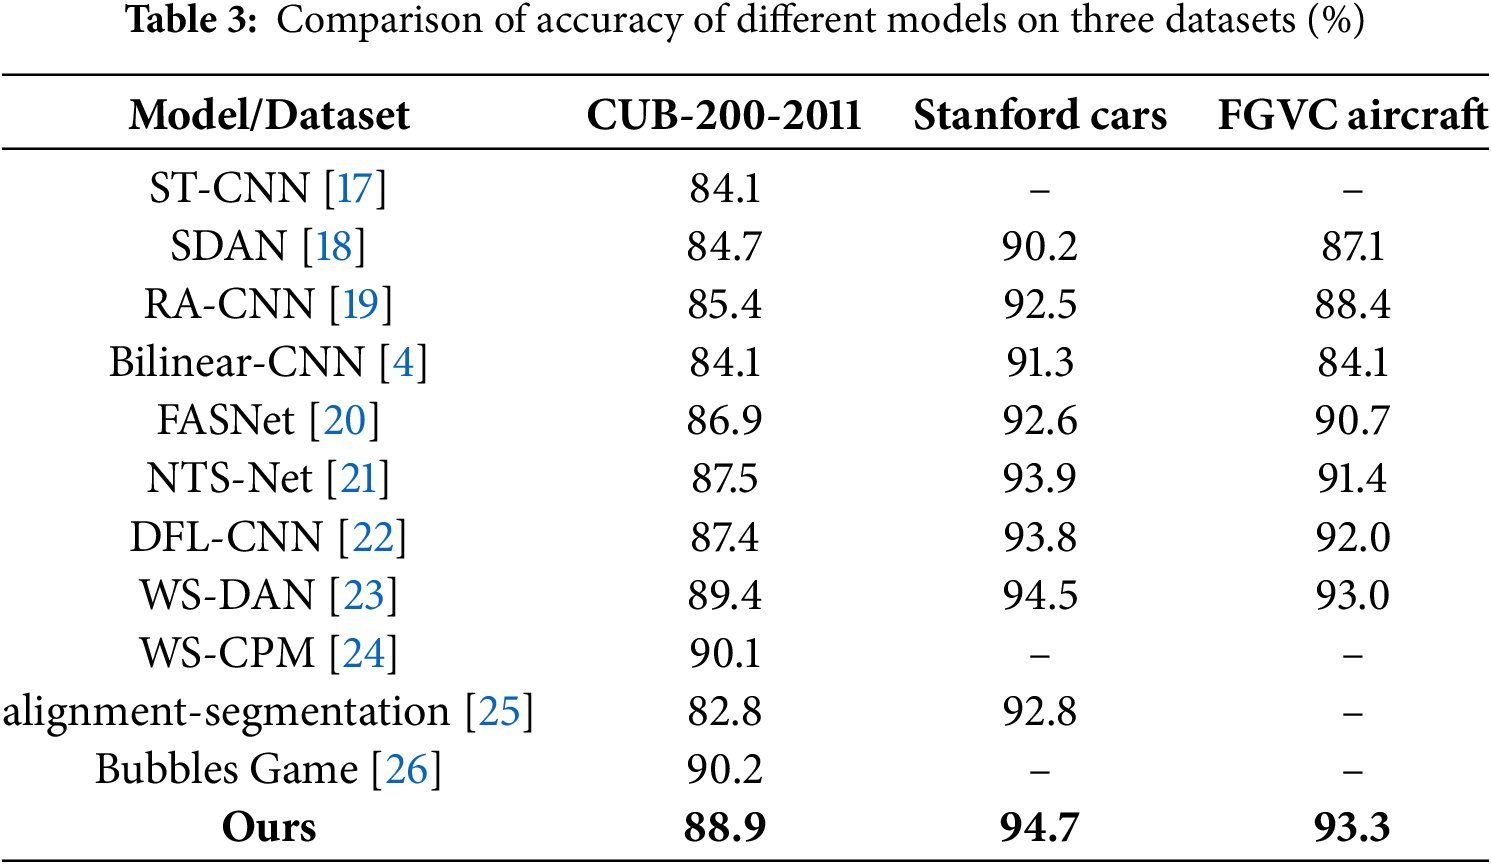
Comparative tests on the three datasets covered in part 4.1 are presented in this part, with specific results displayed in Table 3. The accuracy of the model suggested in this study on the three datasets is shown in Table 3’s last row. The accuracy of other models is referenced from the original papers of these methods, and bold numbers indicate the highest accuracy achieved by all models on that dataset. “-” denotes that the original paper did not conduct experiments on the corresponding dataset. CUB-200-2011: CUB-200-2011 is a fine-grained bird classification dataset jointly created by the California Institute of Technology and UCSD, containing 11788 images, widely used in computer vision tasks such as image classification and object detection. Stanford Cars:The Stanford Cars dataset is a fine-grained classification dataset containing 196 type of car images, primarily used for image classification tasks. FGVC aircraft: FGVC aircraft is a fine-grained classification dataset focused on aircraft model recognition, containing 10000 high-definition aircraft images. If the editor has other more suitable formatting methods, the author also accepts them.
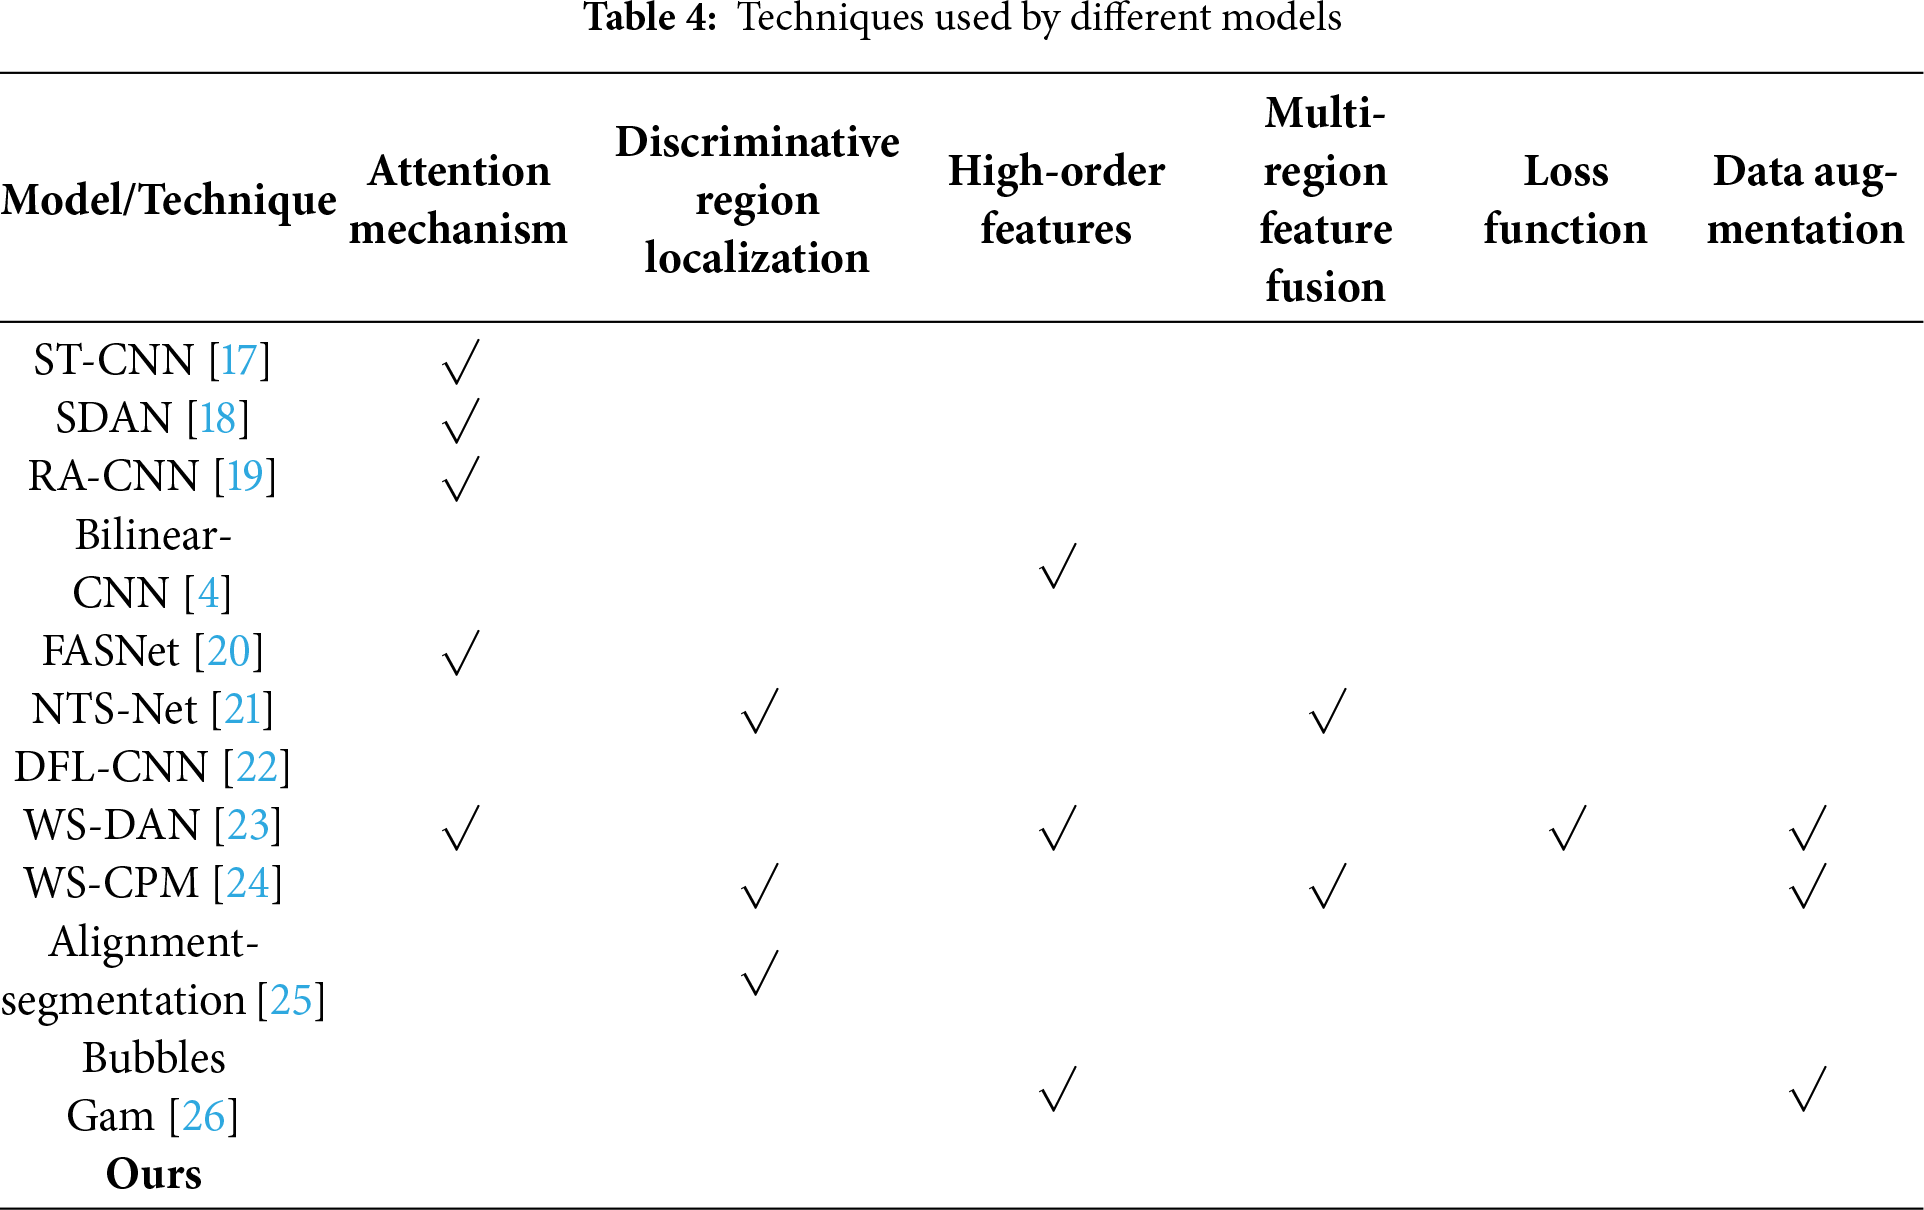
The techniques used by the 10 fine-grained recognition models in Table 3 can be classified into 6 categories: (1) attention mechanism; (2) discriminative region localization; (3) high-order features; (4) multi-region feature fusion; (5) loss functions; and (6) data augmentation. The specific details are shown in Table 4. Analysis of Tables 3 and 4 leads to the following conclusions.
(a) compared to the WS-DAN and WS-CPM models, the accuracy of the proposed model in the CUB-200-2011 dataset is lower. Images in the CUB-200-2011 collection primarily feature highly detailed backgrounds of branches, flowers, and grass, with the avian items taking up a comparatively tiny percentage of the total image. Furthermore, birds differ significantly in look when they are in various stances. The WS-CPM model detects discriminative local regions, extracts features using part feature extractors, fuse features from multiple regions, and optimizes the loss function. The WS-DAN model combines central loss and cross-entropy loss as the loss function and uses bilinear attention pooling to extract high-order features of different portions. This suggests that in situations when the objects of interest represent a small fraction of the image, the background is complex, and there is high intra-class variance, local feature extraction and optimal loss functions can greatly increase recognition accuracy. (b) Compared to the other nine models listed in Table 4, the proposed model achieved the highest accuracy on the Stanford Cars and FGVC Aircraft datasets. While the suggested model does not make use of attention mechanisms, CNN networks are able to discriminatively localize regions by nature. Additionally, the suggested model prioritizes each channel, allowing for variance in chopped enhanced samples as well as the localization of object discriminative regions during region cropping. Erasing regions with discriminative features during region erasure makes the network more efficient in its search for additional discriminative features, improving the model’s resilience and generalization capacity and leading to more accurate data augmentation. (c) Both WS-DAN, WS-CPM, and the proposed model utilize data augmentation techniques. When compared to the other models in Table 3, these three models attain higher accuracy. This shows that for fine-grained recognition problems with limited training data. data augmentation is a very effective approach. Higher recognition accuracy can be attained by augmenting the data to increase the number of samples.
4.4.3 Visualization Experiment
To provide an intuitive comparison of how different models allocate their attention, we visualized the class activation maps for both the baseline model and our proposed model. Fig. 8 presents these visualization results. The first row shows the original input images. The second and third rows display the attention heatmaps generated by the baseline model and our proposed model, respectively. In the heatmaps, red regions indicate higher attention weight, while blue regions indicate lower attention. The comparison clearly shows that our model more accurately localizes the discriminative regions of the objects (e.g., the bird’s head and body) while paying less attention to the background, thereby reducing its deceptive influence.
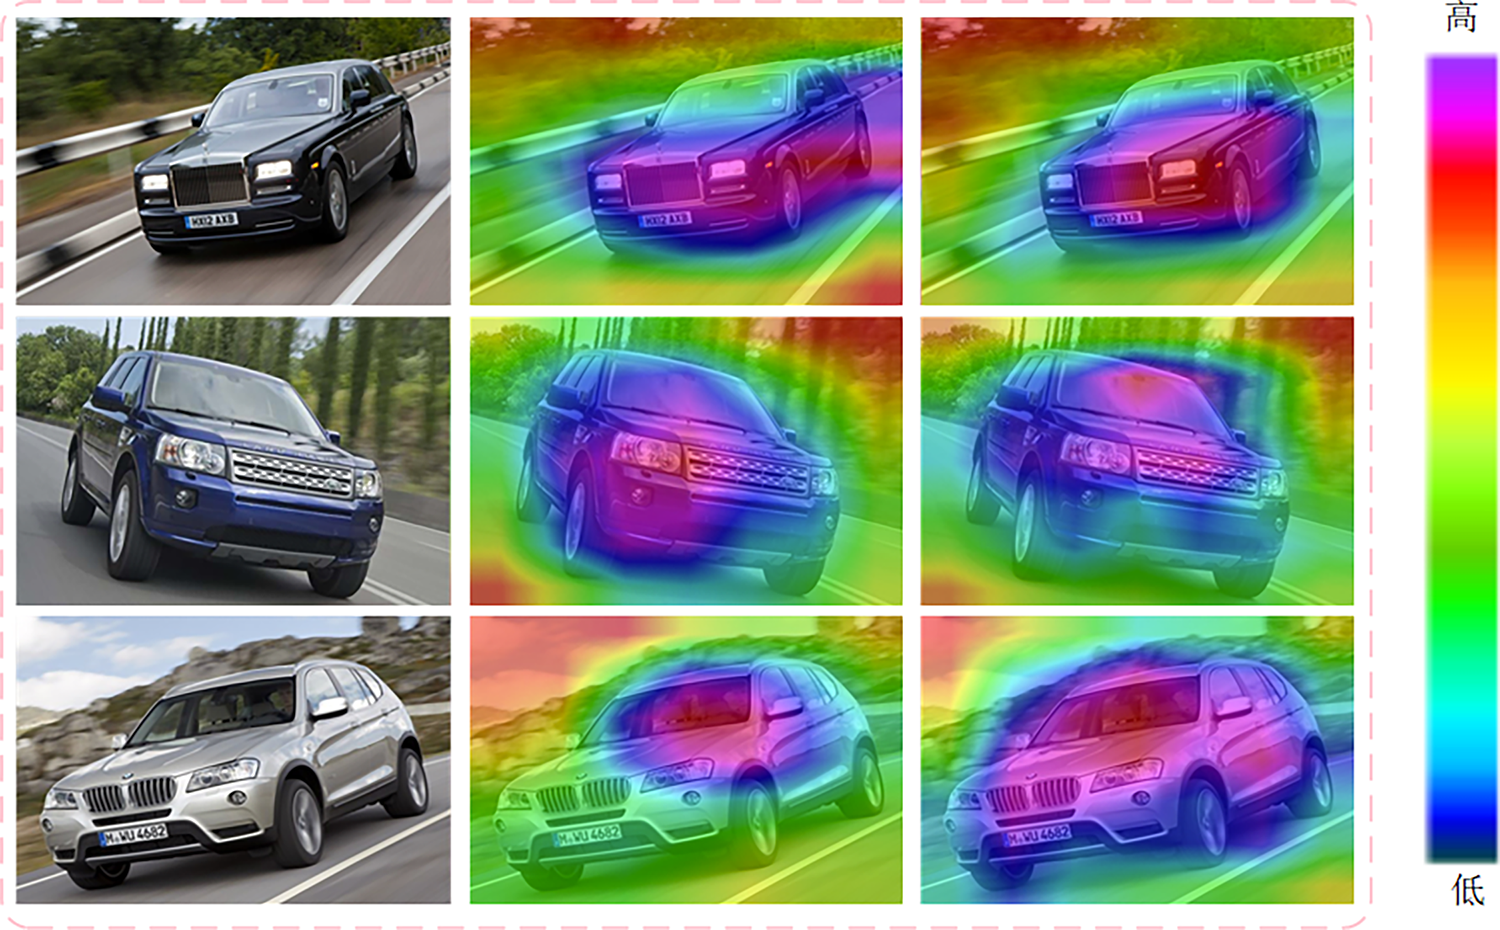
Figure 8: Visualization results
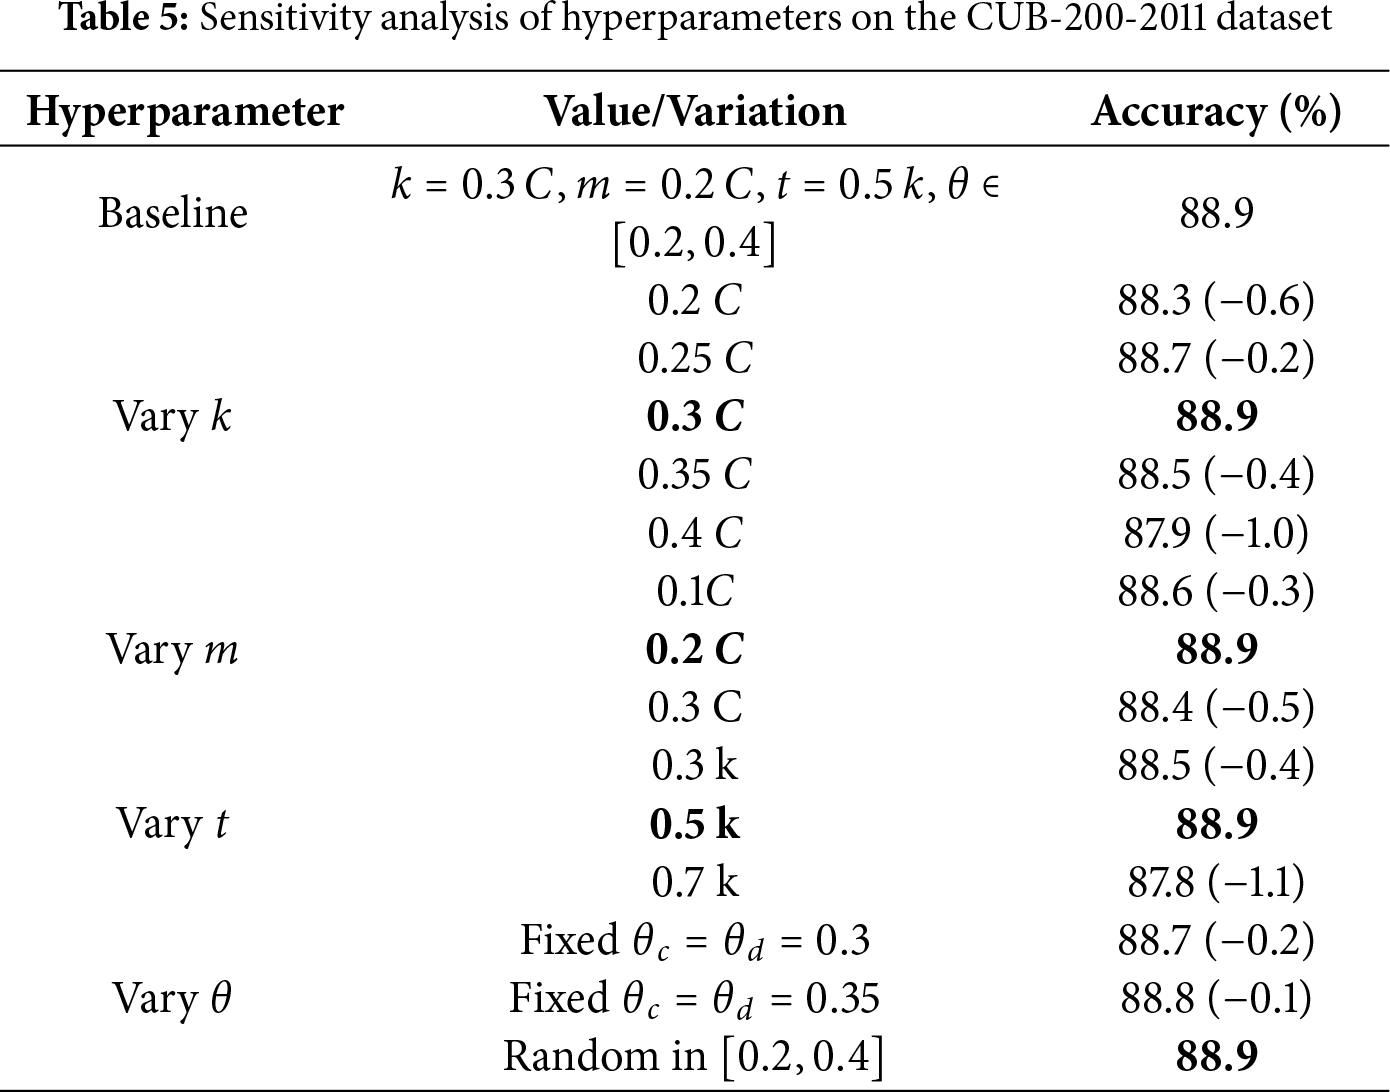
4.4.4 Hyperparameter Sensitivity Analysis
To evaluate the robustness of our model, we conducted a sensitivity analysis on the CUB-200-2011 dataset, varying the key hyperparameters
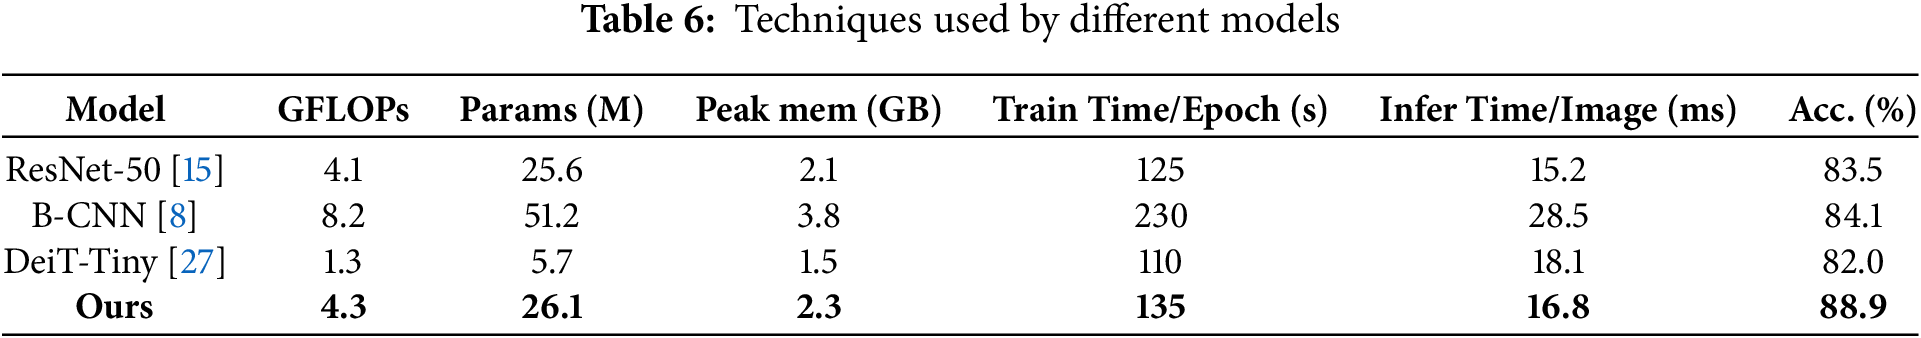
A key motivation of our work is to achieve high recognition accuracy with significantly lower computational cost and training time compared to dual-stream Bilinear CNNs. To quantitatively verify this, we compared our proposed model with several baselines on the following six key indicators. Six key indicators are explained in detail as follows: GFLOPs: Its full name is Giga Floating point Operations Per Second, representing the billion floating-point operations required for a single forward propagation of the model, used to measure computational complexity. Params (M) (number of parameters, in millions): The scale of parameters that the model needs to learn, reflecting the complexity and storage requirements of the model. Peak Mem (GB): The maximum memory usage during model runtime. Train Time/Epoch (s) (training time per round, seconds): The average time required to fully traverse the training set once, used to evaluate training efficiency. Infer Time/Image (ms): The average time required to predict a single image, measuring inference speed. Acc (%) (accuracy): The classification accuracy of the model on the test set is the core performance indicator. The three baseline models we have selected are as follows. (i) a plain ResNet-50, representing a standard first-order model; (ii) a Bilinear CNN (B-CNN) [8] constructed with two ResNet-50 backbones, representing a classic second-order approach; and (iii) a lightweight Vision Transformer, DeiT-Tiny [27], as a modern baseline. All models were evaluated under the same hardware and software configuration (NVIDIA GeForce RTX 2070 GPU, PyTorch 1.0) on the CUB-200-2011 dataset with an input size of 224 × 224. The results are summarized in Table 6.
This study proposes a fine-grained recognition model, sfeModel, based on discriminative region localization and efficient second-order feature encoding. By selecting channels with higher importance, the model accurately localizes discriminative regions, ensuring that the augmented samples contain critical discriminative information. The efficient second-order feature encoding module requires only single round feature extraction, followed by feature dimension reduction and down sampling, effectively reducing training time. Experimental results demonstrate that this model generates fewer ineffective augmented samples, leading to improved recognition accuracy.
Based on the current research, we identify the following future research directions grounded in the present work’s limitations, such as the dependency on the initial weight matrix for region localization and the computational burden of second-order features: (1) Advanced Discriminative Region Localization: Future work should explore moving beyond reliance on the classifier’s weight matrix for region discovery [23,28]. One promising direction involves developing an attention-based decoupling module to explicitly model the relationship between the weight matrix and feature channels, potentially through a lightweight Transformer architecture. Such a module could autonomously generate attention maps more closely aligned with discriminative parts, ultimately producing higher-quality augmented samples and improving localization accuracy without manual annotation. (2) Long-Tail Recognition Enhancement: Addressing class imbalance requires dedicated strategies for long-tail recognition [20,24]. A two-stage training strategy could be developed, where general features are first learned from all data, followed by a balanced meta-learning phase simulating few-shot scenarios for tail classes. Additionally, tail-class-focused data augmentation techniques should be investigated, leveraging discriminative regions to strategically oversample and enhance tail-class images. These approaches aim to significantly improve recognition accuracy for underrepresented classes. (3) Efficient Second-Order Feature Encoding: To address computational complexity, future research should explore sparse second-order encoding schemes [20,22]. A potential solution involves implementing a gating network to calculate confidence scores for local features, enabling selective participation of only the top-k most informative features in second-order computations. This approach, possibly combined with low-rank approximation techniques, could substantially reduce FLOPs and memory usage while preserving the performance benefits of second-order statistics. (4) Furthermore, we acknowledge the importance of in-depth evaluation under long-tail settings, as raised by the reviewer. A comprehensive investigation into model performance on rare versus frequent classes, potentially using metrics like macro-F1 and per-class accuracy analysis, constitutes an independent and significant research direction. We have already initiated research dedicated to addressing the long-tail challenge
Acknowledgement: We are grateful to Nanjing Tech University and Nanjing University of Information Science and Technology for providing study environment and computing equipment.
Funding Statement: This study was supported, in part, by the National Nature Science Foundation of China under Grant 62272236, 62376128 and 62306139; in part, by the Natural Science Foundation of Jiangsu Province under Grant BK20201136, BK20191401.
Author Contributions: Conceptualization, Yingying Wang, Wei Sun, Shiyu Zhou, Haoming Zhang and Pengpai Wang; methodology, Yingying Wang; software, Yingying Wang; validation, Xiaorui Zhang; formal analysis, Yingying Wang; resources, Wei Sun and Shiyu Zhou; data curation, Yingying Wang; writing—original draft preparation, Yingying Wang; writing—review and editing, Yingying Wang, Xiaorui Zhang, Wei Sun, Shiyu Zhou, Haoming Zhang and Pengpai Wang; visualization, Yingying Wang; supervision, Xiaorui Zhang, Wei Sun, Shiyu Zhou, Haoming Zhang and Pengpai Wang; project administration, Xiaorui Zhang and Yingying Wang; funding acquisition, Xiaorui Zhang. All authors reviewed the results and approved the final version of the manuscript.
Availability of Data and Materials: The data that support the findings of this study are available from the corresponding author, [Xiaorui Zhang], upon reasonable request.
Ethics Approval: Not applicable.
Conflicts of Interest: The authors declare no conflicts of interest to report regarding the present study.
References
1. Xu X, Yang CC, Xiao Y, Kong JL. A fine-grained recognition neural network with high-order feature maps via graph-based embedding for natural bird diversity conservation. Int J Environ Res Public Health. 2023;20(6):4294–314. doi:10.3390/ijerph20064924. [Google Scholar] [PubMed] [CrossRef]
2. Huang S, Xu Z, Tao D, Zhang Y. Part-stacked CNN for fine-grained visual categorization. In: Proceedings of the IEEE Conference on Computer Vision and Pattern Recognition; 2016 Jun 27–30; Las Vegas, NV, USA. p. 1173–82. [Google Scholar]
3. Shroff P, Chen T, Wei Y, Wang Z. Focus longer to see better: recursively refined attention for fine-grained image classification. In: Proceedings of the IEEE/CVF Conference on Computer Vision and Pattern Recognition Workshops; 2020 Jun 13–19; Seattle, WA, USA; 2020. p. 868–9. [Google Scholar]
4. Sun W, Dai G, Zhang XR, He X, Chen X. TBE-Net: a three-branch embedding network with part-aware ability and feature complementary learning for vehicle re-identification. IEEE Trans Intell Transp Syst. 2021;23(9):14557–69. doi:10.1109/tits.2021.3130403. [Google Scholar] [CrossRef]
5. Liang M, Huang S, Liu W. Dynamic semantic structure distillation for low-resolution fine-grained recognition. Pattern Recognit. 2024;148:110216. doi:10.1016/j.patcog.2023.110216. [Google Scholar] [CrossRef]
6. Shi S, Li W, Zhang Y, He J, Gong B, et al. ResMaster: mastering high-resolution image generation via structural and fine-grained guidance. In: Proceedings of the AAAI Conference on Artificial Intelligence; 2025 Feb 25–Mar 4; Philadelphia, PA, USA. Palo Alto, CA, USA: AAAI Press; 2025. p. 6887–95. [Google Scholar]
7. Zheng Q, Zhao P, Wang H, Elhanashi A, Saponara S. Fine-grained modulation classification using multi-scale radio transformer with dual-channel representation. IEEE Communicat Letters. 2025;26(6):1298–302. doi:10.1109/lcomm.2022.3145647. [Google Scholar] [CrossRef]
8. Lin TY, RoyChowdhury A, Maji S. Bilinear CNN models for fine-grained visual recognition. In: Proceedings of the IEEE International Conference on Computer Vision (ICCV); 2015 Dec 7–13; Santiago, Chile. Piscataway, NJ, USA: IEEE; 2015. p. 1449–57. [Google Scholar]
9. Tran T, Pham T, Carneiro G, Palmer L, Reid I. A Bayesian data augmentation approach for learning deep models. Adv Neural Inf Process Syst. 2017;30:1–10. [Google Scholar]
10. Hu T, Qi H, Huang Q, Lu Y. See better before looking closer: weakly supervised data augmentation network for fine-grained visual classification. arXiv:1901.09891. 2019. [Google Scholar]
11. Chen T, Kornblith S, Norouzi M, Hinton G. A simple framework for contrastive learning of visual representations. In: Proceedings of the 38th International Conference on Machine Learning(PMLR); 2020 Jul 13–18; Vienna, Austria. p. 1597–607. [Google Scholar]
12. Li P, Xie J, Wang Q, Zuo W. Is second-order information helpful for large-scale visual recognition?. In: Proceedings of the IEEE International Conference on Computer Vision; 2017 Oct 22–29; Venice, Italy. Piscataway, NJ, USA: IEEE; 2017. p. 2070–8. [Google Scholar]
13. Sikdar A, Liu Y, Kedarisetty S, Zhao Y, Ahmed A, et al. Interweaving insights: high-order feature interaction for fine-grained visual recognition. Int J Comput Vis. 2025;133(4):1755–79. doi:10.1007/s11263-024-02260-y. [Google Scholar] [PubMed] [CrossRef]
14. Kong S, Fowlkes C. Low-rank bilinear pooling for fine-grained classification. In: Proceedings of the IEEE Conference on Computer Vision and Pattern Recognition (CVPR); 2017 Jul 21–26; Honolulu, HI, USA. Piscataway, NJ, USA: IEEE; 2017. p. 365–74. [Google Scholar]
15. Cui Y, Zhou F, Wang J, Liu X, Lin Y, et al. Kernel pooling for convolutional neural networks. In: Proceedings of the IEEE Conference on Computer Vision and Pattern Recognition; 2017 Jul 21–26; Honolulu, HI, USA. Piscataway, NJ, USA: IEEE; 2017. p. 2921–30. [Google Scholar]
16. Paschali M, Simson W, Roy AG, Naeem MF, Göbl R, et al. Data augmentation with manifold exploring geometric transformations for increased performance and robustness. arXiv:1901.04420. 2019. [Google Scholar]
17. Tang H, Yuan C, Li Z, Tang J. Learning attention-guided pyramidal features for few-shot fine-grained recognition. Pattern Recognit. 2022;130:108792. doi:10.1016/j.patcog.2022.108792. [Google Scholar] [CrossRef]
18. Zhu L, Chen T, Yin J, See S, Liu J. Learning Gabor texture features for fine-grained recognition. arXiv:1603.06765. 2023. [Google Scholar]
19. Fu J, Zheng H, Mei T. Look closer to see better: recurrent attention convolutional neural network for fine-grained image recognition. In: Proceedings of the IEEE Conference on Computer Vision and Pattern Recognition; 2017 Jul 21–26; Honolulu, HI, USA. Piscataway, NJ, USA: IEEE; 2017. p. 4438–46. [Google Scholar]
20. Pu Y, Han Y, Wang Y, Feng J, Deng C, et al. Fine-grained recognition with learnable semantic data augmentation. In: Proceedings of the 6th International Conference on Control and Computer Vision (ICCCV); 2024 Jun 13–15; Tianjin, China. Tianjin, China: Tianjin University of Technology and Education; 2024. p. 5209–17. [Google Scholar]
21. Yang Z, Luo T, Wang D, Hu Z, Gao J, et al. Learning to navigate for fine-grained classification. In: Proceedings of the European Conference on Computer Vision (ECCV); 2018 Sep 8–14; Munich, Germany. Cham, Switzerland: Springer; 2018. p. 420–35. [Google Scholar]
22. Wang Y, Morariu VI, Davis S. Learning a discriminative filter bank within a CNN for fine-grained recognition. In: Proceedings of the IEEE Conference on Computer Vision and Pattern Recognition; 2018 Jun 18–22; Salt Lake City, UT, USA. Piscataway, NJ, USA: IEEE; 2018. p. 4148–57. [Google Scholar]
23. Ge W, Lin X, Yu Y. Weakly supervised complementary parts models for fine-grained image classification from the bottom up. In: Proceedings of the IEEE/CVF Conference on Computer Vision and Pattern Recognition; 2019 Jun 16–20; Long Beach, CA, USA. Piscataway, NJ, USA: IEEE; 2019. p. 3034–43. [Google Scholar]
24. Zhang S, Li Z, Yan S, He X, Sun J. Distribution alignment: a unified framework for long-tail visual recognition. In: Proceedings of the IEEE/CVF Conference on Computer Vision and Pattern Recognition; 2021 Jun 19–25; Nashville, TN, USA. Piscataway, NJ, USA: IEEE; 2021. p. 2361–70. [Google Scholar]
25. Krause J, Jin H, Yang J, Fei-Fei L. Fine-grained recognition without part annotations. In: Proceedings of the IEEE Conference on Computer Vision and Pattern Recognition (CVPR); 2015 Jun 7–12; Boston, MA, USA. Piscataway, NJ, USA: IEEE; 2015. p. 5546–55. [Google Scholar]
26. Deng J, Krause J, Fei-Fei L. Fine-grained crowdsourcing for fine-grained recognition. In: Proceedings of the IEEE Conference on Computer Vision and Pattern Recognition; 2013 Jun 23–28; Portland, OR, USA. Piscataway, NJ, USA: IEEE; 2013. p. 580–7. [Google Scholar]
27. Touvron H, Cord M, Douze M, Massa F, Sablayrolles A, et al. Training data-efficient image transformers & distillation through attention. In: Proceedings of the 38th International Conference on Machine Learning (PMLR); 2021 Jul 18–24; Vienna, Austria. p. 10347–57. [Google Scholar]
28. Zha Z, Tang H, Sun Y, Tang J. Boosting few-shot fine-grained recognition with background suppression and foreground alignment. In: Proceedings of the European Conference on Computer Vision (ECCV); 2023 Sep 25–29; Tel Aviv, Israel. Cham, Switzerland: Springer; 2023. p. 3947–61. [Google Scholar]
Cite This Article
 Copyright © 2026 The Author(s). Published by Tech Science Press.
This work is licensed under a Creative Commons Attribution 4.0 International License , which permits unrestricted use, distribution, and reproduction in any medium, provided the original work is properly cited.
 Downloads
 Citation Tools