
 Submit a Paper
 Propose a Special lssue
 Open Access
ARTICLE
The Missing Data Recovery Method Based on Improved GAN
1 College of Automation, Nanjing University of Posts and Telecommunications, Nanjing, 210023, China
2 State Grid Jiashan Power Supply Company, Jiaxing, 314100, China
* Corresponding Author: Song Deng. Email:
Computers, Materials & Continua 2026, 87(1), 45 https://doi.org/10.32604/cmc.2025.072777
Received 03 September 2025; Accepted 24 November 2025; Issue published 10 February 2026
 View Full Text
 Download PDF
Abstract
Accurate and reliable power system data are fundamental for critical operations such as grid monitoring, fault diagnosis, and load forecasting, underpinned by increasing intelligentization and digitalization. However, data loss and anomalies frequently compromise data integrity in practical settings, significantly impacting system operational efficiency and security. Most existing data recovery methods require complete datasets for training, leading to substantial data and computational demands and limited generalization. To address these limitations, this study proposes a missing data imputation model based on an improved Generative Adversarial Network (BAC-GAN). Within the BAC-GAN framework, the generator utilizes Bidirectional Long Short-Term Memory (BiLSTM) networks and Multi-Head Attention mechanisms to capture temporal dependencies and complex relationships within power system data. The discriminator employs a Convolutional Neural Network (CNN) architecture to integrate local features with global structures, effectively mitigating the generation of implausible imputations. Experimental results on two public datasets demonstrate that the BAC-GAN model achieves superior data recovery accuracy compared to five state-of-the-art and classical benchmark methods,with an average improvement of 17.7% in reconstruction accuracy. The proposed method significantly enhances the accuracy of grid fault diagnosis and provides reliable data support for the stable operation of smart grids, showing great potential for practical applications in power systems.Keywords
Driven by increasing intelligence and digitization in power systems, modern grid data have grown significantly in complexity. The widespread deployment of sensors, smart meters, and IoT devices enables real-time collection and transmission of operational, power delivery, weather, and business data [1–3], supporting enhanced grid monitoring and management [4]. However, data integrity is frequently compromised by missing or incomplete values resulting from equipment failures and communication network issues [5]. This data loss severely impacts critical functions including real-time monitoring, fault diagnosis, and load forecasting [6]. A notable example is the 2018 California grid outage, where missing monitoring data from substations significantly hampered fault diagnosis and restoration efforts, ultimately affecting approximately 200,000 households and businesses [7]. Consequently, effective recovery of missing data is essential for ensuring power system reliability and security.
Methods for recovering missing data in power systems are broadly classified as statistical, machine learning (ML), and deep learning (DL) approaches. Statistical methods encompass techniques such as linear interpolation [8], multiple imputation [9], and regression imputation [10]. Time-series specific approaches include the ARMA model (combining autoregressive (AR) and moving average (MA) components) for prediction [11], ARIMA for non-stationary time series recovery [12], and spatial interpolation using Delaunay triangulation [13]. While these methods primarily infer missing values based on underlying statistical characteristics, they often struggle to effectively capture the complex nonlinear dynamics and temporal dependencies inherent in power system data due to its intricate nature.
As recognition of power system data complexity grows, machine learning (ML) has been increasingly adopted for missing data imputation. Compared to statistical methods, ML excels at automatically learning intricate data patterns. For instance, K-Nearest Neighbors (KNN) has been applied to impute missing wind power data [14], hybrid approaches combine statistical and ML techniques like kernel canonical correlation analysis to enhance accuracy [15], and random forest-based multiple imputation algorithms have been developed [16]. However, ML methods typically depend on explicit feature engineering. Given the high dimensionality, nonlinearity, and complex temporal dependencies inherent in power system data, these approaches often struggle to capture deep underlying relationships, limiting their effectiveness in complex scenarios.
Deep learning (DL) advances beyond conventional ML by employing sophisticated neural architectures to autonomously extract latent patterns and correlations from raw data. Representative approaches include: bidirectional RNNs (M-RNN) for data stream interpolation [17]; GRU-D models incorporating masking and time intervals [18]; graph networks enhanced with sparse spatiotemporal attention for improved robustness to sparsity [19]; conditional score diffusion models for time series imputation [20]; Gaussian mixture models parameterized via maximum likelihood estimation [21]; and denoising autoencoders for missing data handling [22]. Despite these innovations, DL-based imputation methods remain challenged by complex missing patterns and limitations in model robustness.
To address these challenges, generative adversarial networks (GANs) have emerged as a promising approach for missing data imputation, leveraging their strong generative capabilities to produce realistic and plausible imputation results. Notably, GAIN (Generative Adversarial Imputation Network) [23] introduced a GAN-based framework that generates high-quality imputations through adversarial training. However, the GAIN model exhibits two key limitations for power system applications: (1) Its reliance on fully connected neural networks hinders effective capture of long-term temporal dependencies essential for complex power system time series characterized by strong periodicity and temporal correlations, and (2) It inadequately models local data correlations, limiting its ability to exploit local patterns and variation trends inherent in power system data.
To overcome these limitations, this paper proposes BAC-GAN (Bidirectional LSTM with Multi-Head Attention and CNN-based Discriminator Generative Adversarial Network), an enhanced GAN architecture for power system data imputation. The generator integrates bidirectional long short-term memory (BiLSTM) networks with multi-head attention (MA) mechanisms to capture complex temporal dependencies. Simultaneously, the discriminator employs a convolutional neural network (CNN) architecture to effectively model local features and global structures, mitigating the generation of implausible imputations.
The principal contributions are:
• We propose BAC-GAN, a novel generative adversarial network framework incorporating Bidirectional LSTM with Multi-Head Attention and a CNN-based Discriminator, specifically designed for high-accuracy imputation of missing data in power systems.
• The generator integrates Bidirectional LSTM (BiLSTM) networks with a Multi-Head Attention (MA) mechanism to comprehensively capture complex long-term temporal dependencies, while the discriminator employs a Convolutional Neural Network (CNN) architecture to effectively model local features and integrate them with global structural context, thereby ensuring the plausibility of generated imputations.
• Comprehensive experimental evaluation on two public power system datasets demonstrates that BAC-GAN achieves significantly superior imputation accuracy compared to five state-of-the-art and classical benchmark methods.
The remainder of this paper is organized as follows. Section 2 provides prerequisite knowledge. Section 3 highlights the BAC-GAN model. Section 4 presents experimental analysis. The conclusions are shown in Section 5.
Consider a
Based on this, a new random variable
The power system data matrix is
Given the temporal and high-dimensional nature of power system data, this paper proposes a missing data recovery model named BAC-GAN (as shown in Fig. 1), which is based on an improved Generative Adversarial Network.
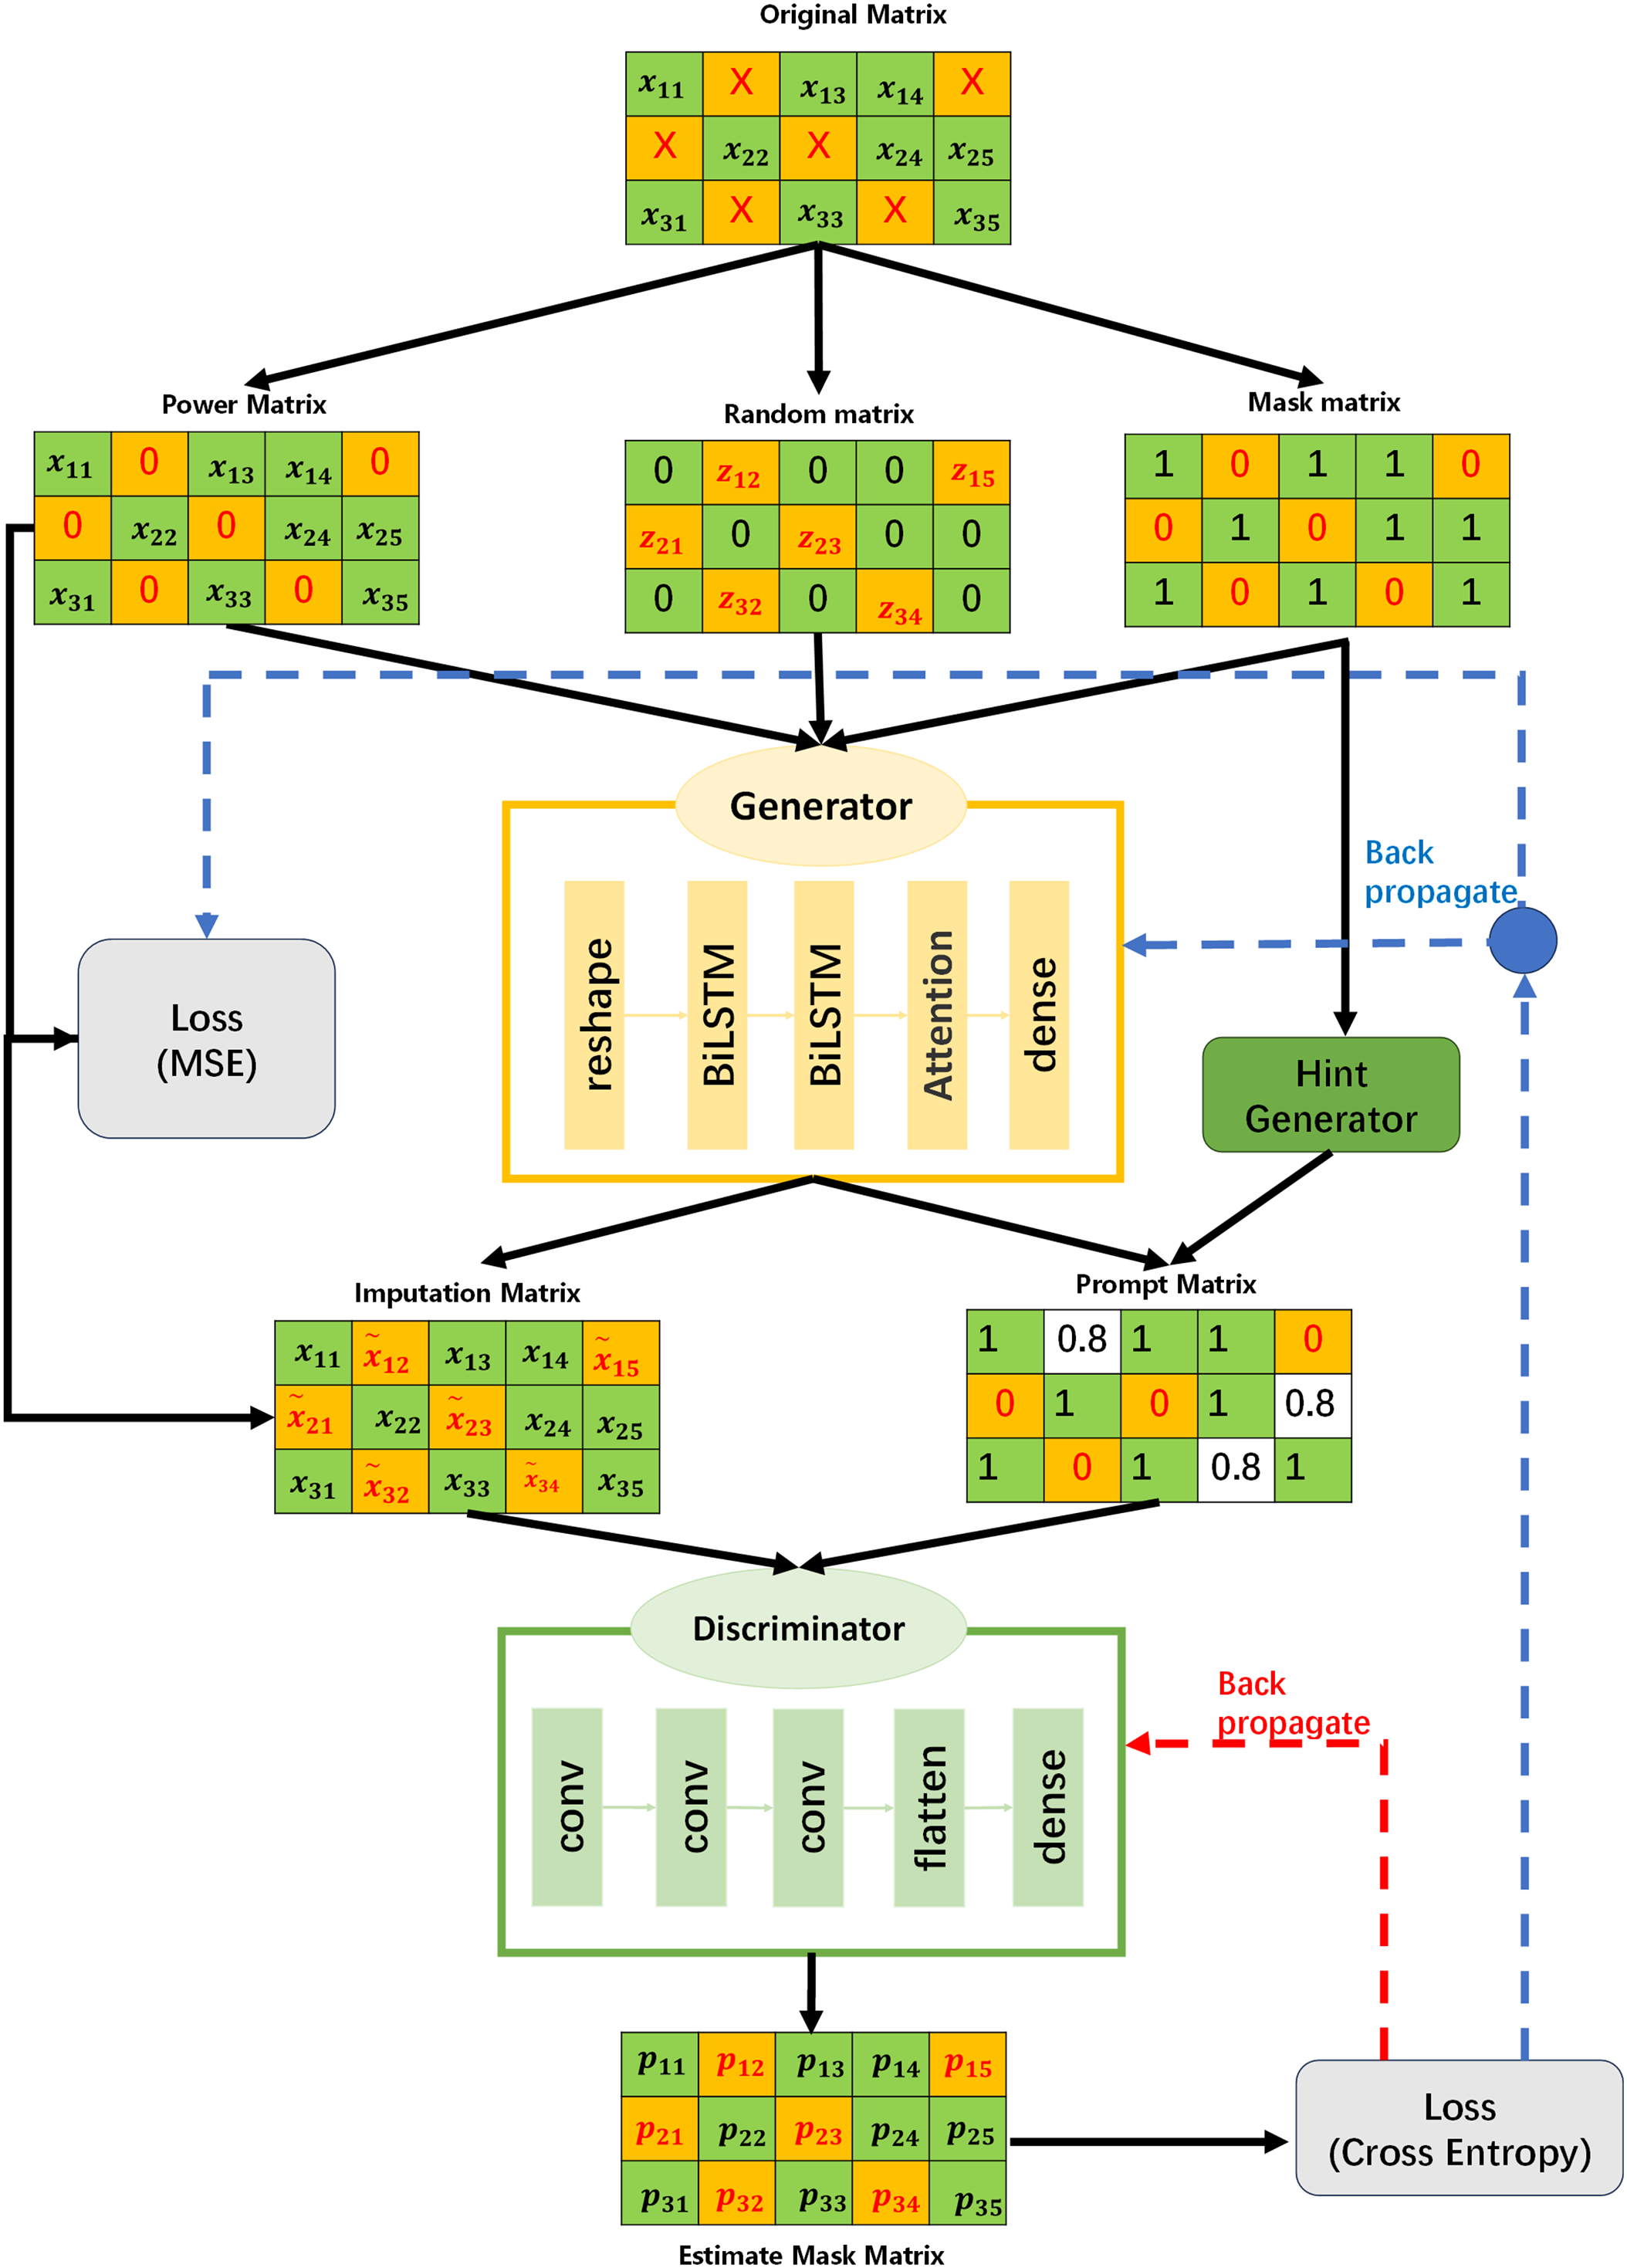
Figure 1: Recovery model
The generator adopts a structure that combines BiLSTM with a multi-head attention mechanism. BiLSTM integrates historical information and future trends through its bidirectional information flow mechanism, aiding in a comprehensive understanding of the dynamic characteristics of time series data. The multi-head attention mechanism captures global dependencies and key time points in the sequence through weighted allocation, further enhancing the model’s ability to model temporal features and compensating for BiLSTM’s limitations in capturing global contextual information.
The discriminator employs a CNN architecture. Power system data often exhibit high dimensionality, containing multivariate information such as voltage, current, frequency, and load. CNNs can capture local correlations and underlying structures within the data. When processing high-dimensional data, the CNN models interdependencies among variables through multi-channel input mechanisms, reducing the impact of redundant information. This provides more reliable feedback signals to the generator, prompting it to continuously optimize the imputation performance. Through adversarial training between the generator and the discriminator, high-precision recovery of missing data is ultimately achieved.
Conventional generators typically employ fully connected networks, which fail to effectively capture bidirectional temporal dependencies and global features, resulting in low-quality imputed data. To address this issue, this paper proposes a generator architecture based on a BiLSTM and multi-head attention mechanism.The core of our temporal modeling is a two-layer BiLSTM. This stacked design aims to learn hierarchical temporal representations: the first BiLSTM layer processes the input sequence and generates preliminary hidden states containing fundamental bidirectional patterns; the second BiLSTM layer builds upon this foundation to model more complex and abstract long-term dependencies at a higher level of feature abstraction. This hierarchical processing enables the network to capture intricate temporal dynamics that might be missed by a single-layer BiLSTM. Subsequently, the output from the second BiLSTM layer is fed into a single-layer multi-head attention mechanism. We employ a single attention layer not for deep feature transformation, but to serve as a powerful global weighting and aggregation module. Its function is to reweight the temporal features refined by the BiLSTM, identifying and emphasizing the most critical time steps across the entire sequence from multiple representation subspaces. This single-layer structure effectively captures global contextual relationships while avoiding the computational overhead and overfitting risks associated with multi-layer attention stacking. The detailed structure is illustrated in Fig. 2.
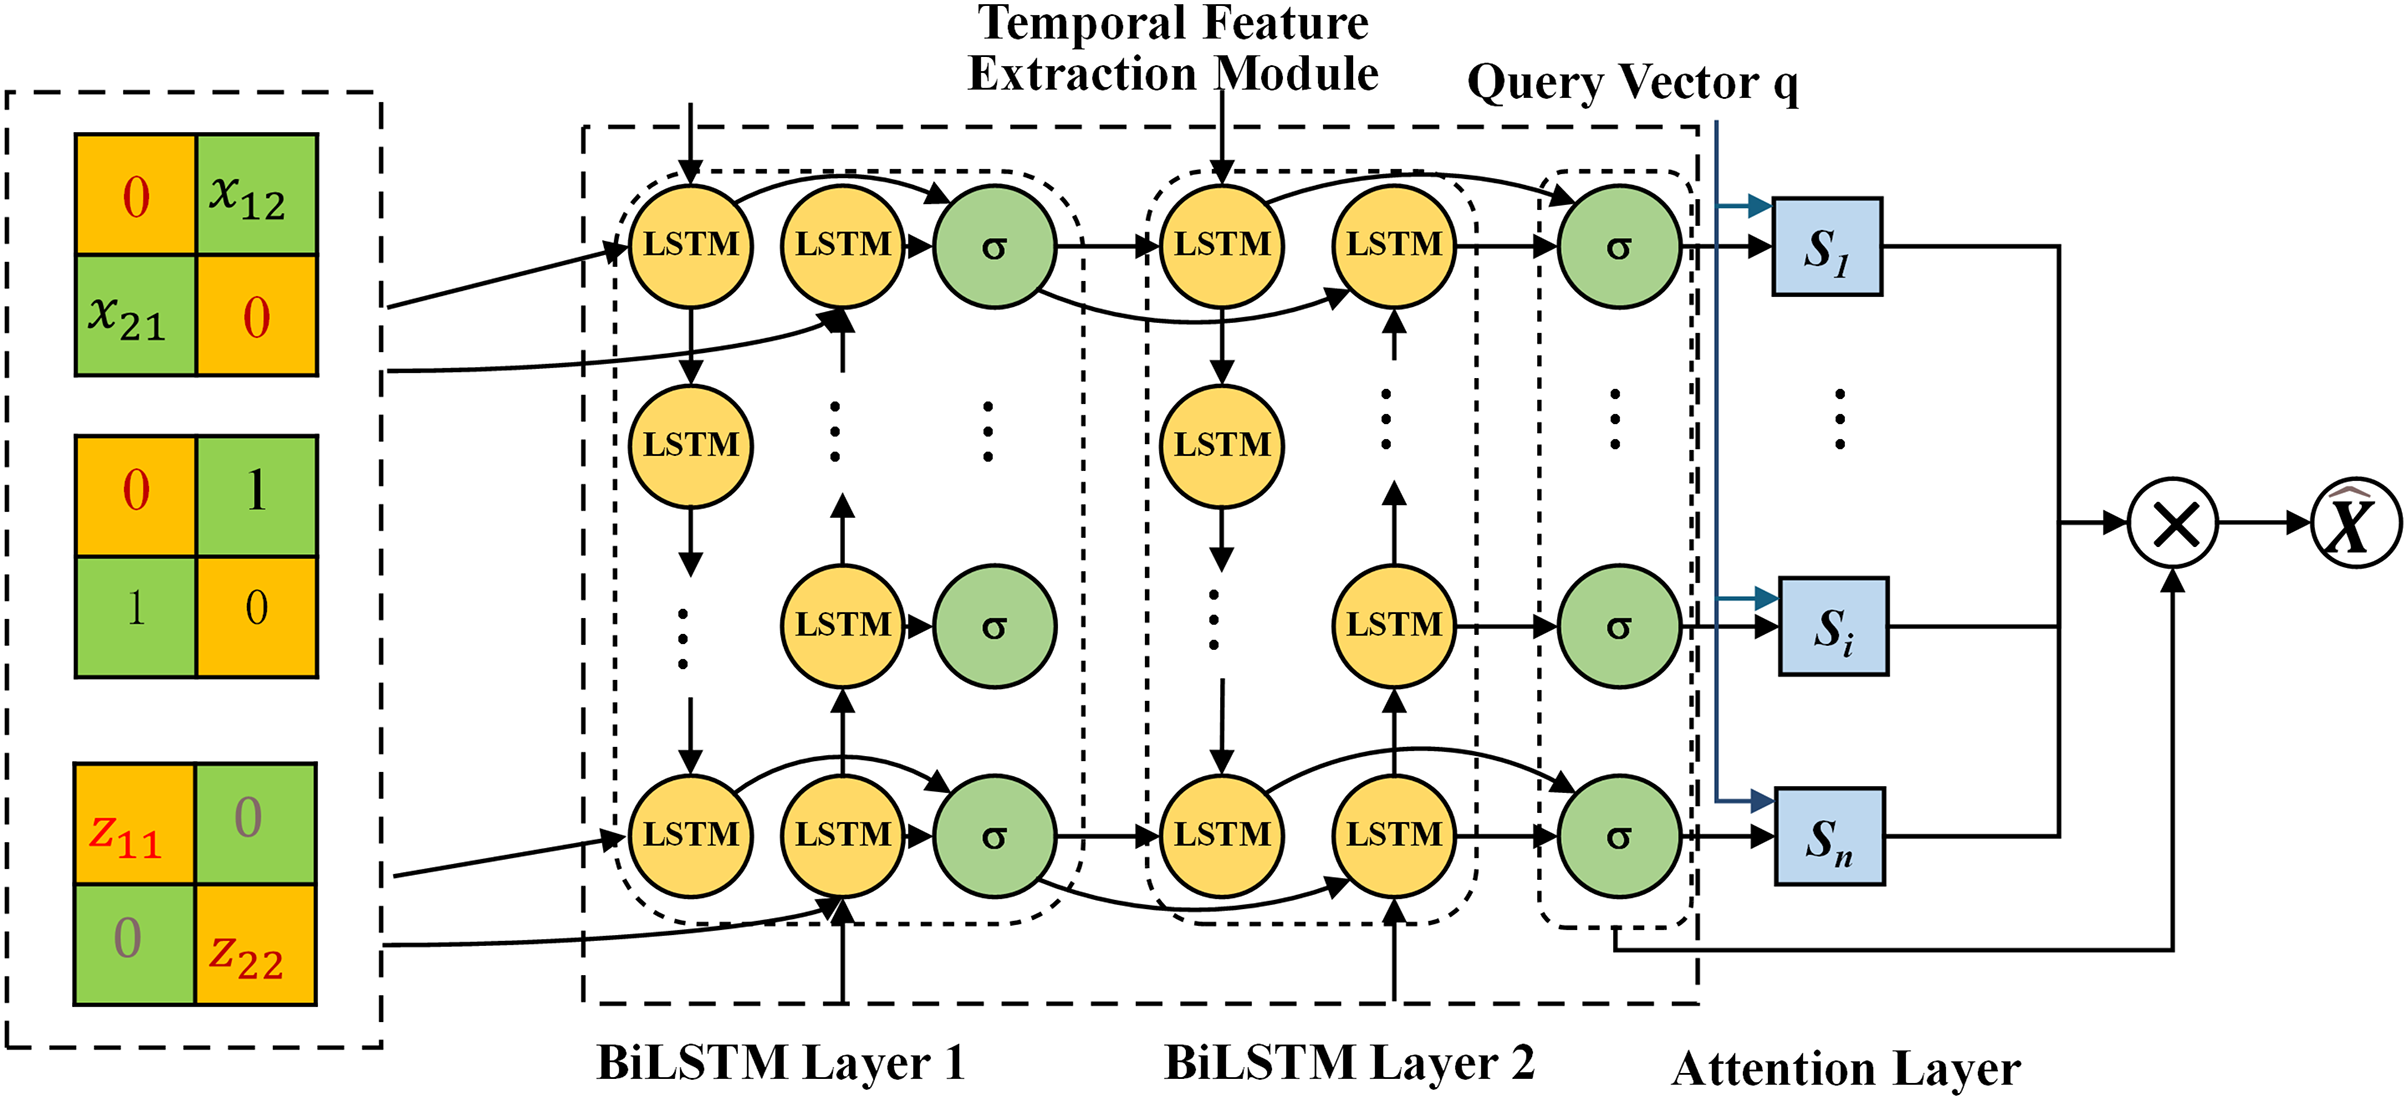
Figure 2: Improvement of generator structure
Generator G receives the power data with missing values
BiLSTM is an extension of LSTM, consisting of two LSTMs: one processes information in the forward direction, while the other handles information in the backward direction. BiLSTM can capture bidirectional temporal information in sequences, making it suitable for tasks that require consideration of both past and future information.
Based on the temporal features extracted by BiLSTM, the multi-head attention mechanism further enhances the feature representation capability. The multi-head attention mechanism employs multiple attention heads to capture dependencies between different time steps of the input sequence from distinct subspaces. For the query (Query), key (Key), and value (Value) of the input sequence, denoted as
where
In the model proposed in this paper, a hint matrix (Hint Mechanism) and a CNN-based network architecture are introduced to enhance the discriminator’s capability, as illustrated in Fig. 3.
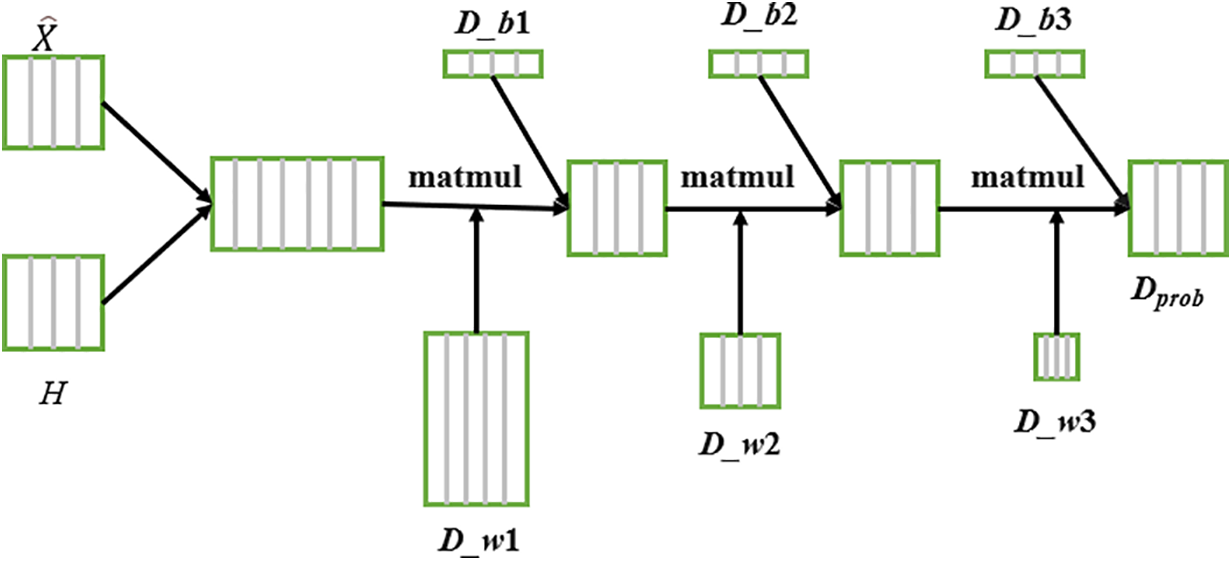
Figure 3: Improvement of discriminator structure
The hint matrix provides information about the validity of the original data, helping the discriminator more accurately distinguish between observed and imputed values. Particularly in cases of severe data missingness, the generator may produce multiple plausible imputation results, making it challenging for the discriminator to make effective judgments. The calculation formula for the hint matrix is:
where B is a defined random variable and M is the mask matrix.
The input to the discriminator consists of the generated sample
3.3.1 Discriminator Loss Function
The discriminator D aims to distinguish between observed values and generated values. The loss function of the discriminator is defined as cross-entropy:
where
The objective of the generator is to impute missing data by generating values that are as realistic as possible, such that the discriminator cannot easily distinguish between observed and imputed values. Furthermore, to ensure the accuracy of the imputed data at the positions of observed values, a reconstruction error term is incorporated.
(1) Adversarial Loss. The generator aims to mislead the discriminator into classifying the imputed data as observed data. The adversarial loss is applied exclusively to the positions of missing values:
where
(2) Reconstruction Loss. To ensure that the imputed values produced by the generator align closely with the ground truth data at observed positions, the reconstruction loss is formulated as follows:
where
where
This project runs on the Ubuntu 20.04 operating system, equipped with an Intel® Xeon® Platinum 8474C processor (16-core vCPU) and an NVIDIA GeForce RTX 4090D GPU (24 GB VRAM). The deep learning framework used is PyTorch 2.0.0, with Python version 3.8 and CUDA version 11.8. Our experimental datasets and source code will be available at https://github.com/zhangsu1234/BAC-GAN (accessed on 23 November 2025). In the subsequent experiments, this study aims to address the following research questions:
RQ1: How does the performance of the proposed model compare to other methods as the proportion of missing data increases?
RQ2: How does the proposed model perform across different datasets?
Datasets are shown in Table 1.
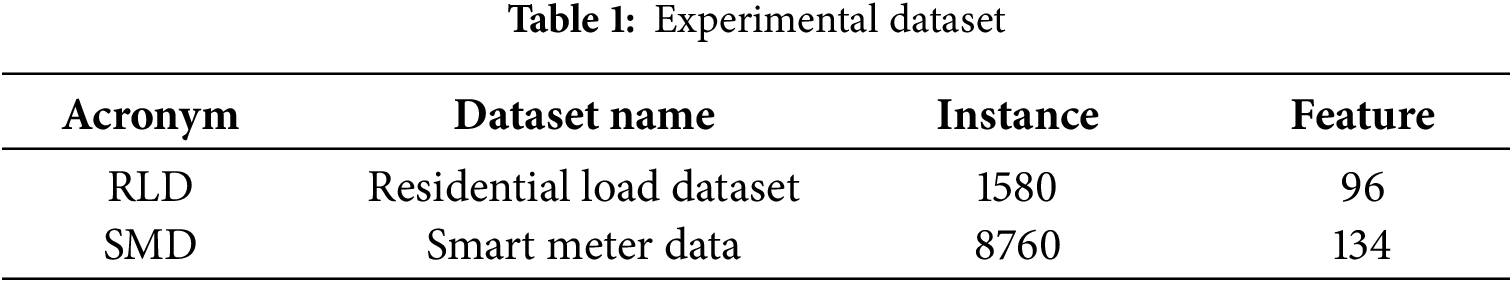
(1) Residential Load Dataset (RLD): The dataset comprises residential household electricity consumption data, with daily load profiles sampled at 15-min intervals, resulting in a feature dimension of 96. This dataset provides detailed documentation of typical residential electricity usage patterns and holds significant value for analyzing and predicting household electricity consumption behaviors. The time series plot is shown in Fig. 4.
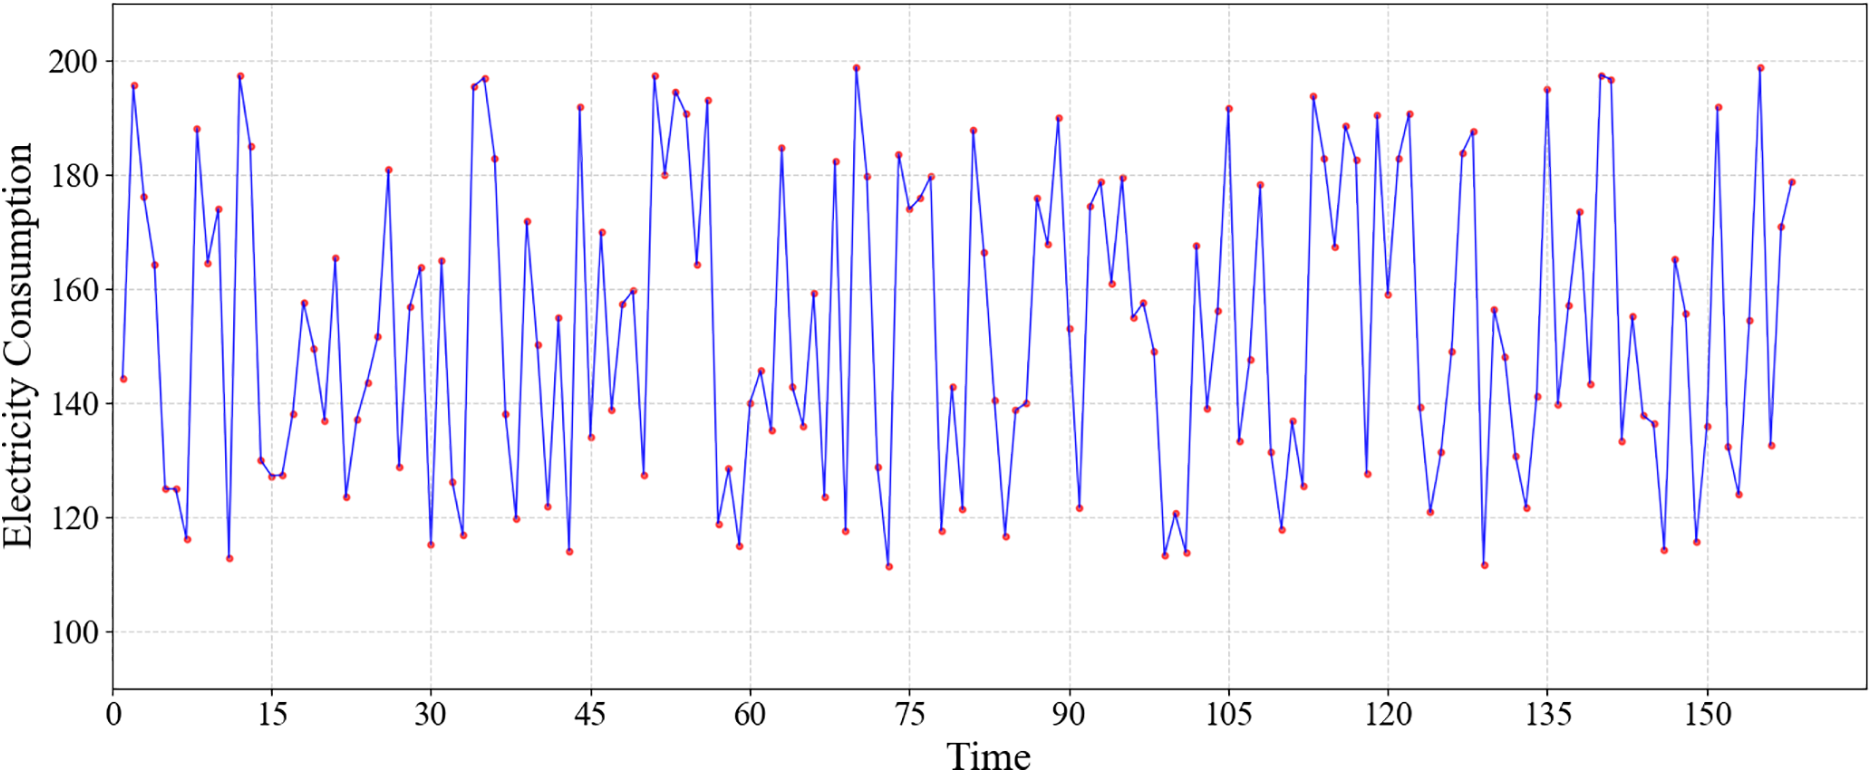
Figure 4: Time series plot of RLD (15-min intervals)
(2) Smart Meter Dataset (SMD): The SMD aggregates hourly energy consumption and multi-dimensional electrical parameters—including voltage, current, and power factor—from smart meters deployed across urban and suburban regions in a regional power distribution network. Covering a full calendar year of 2020 (8760 hourly records), the dataset integrates metadata such as timestamps and device status, enabling comprehensive analysis of load profiles, anomaly detection, and missing data imputation under realistic grid operation scenarios. The time series plot is shown in Fig. 5.
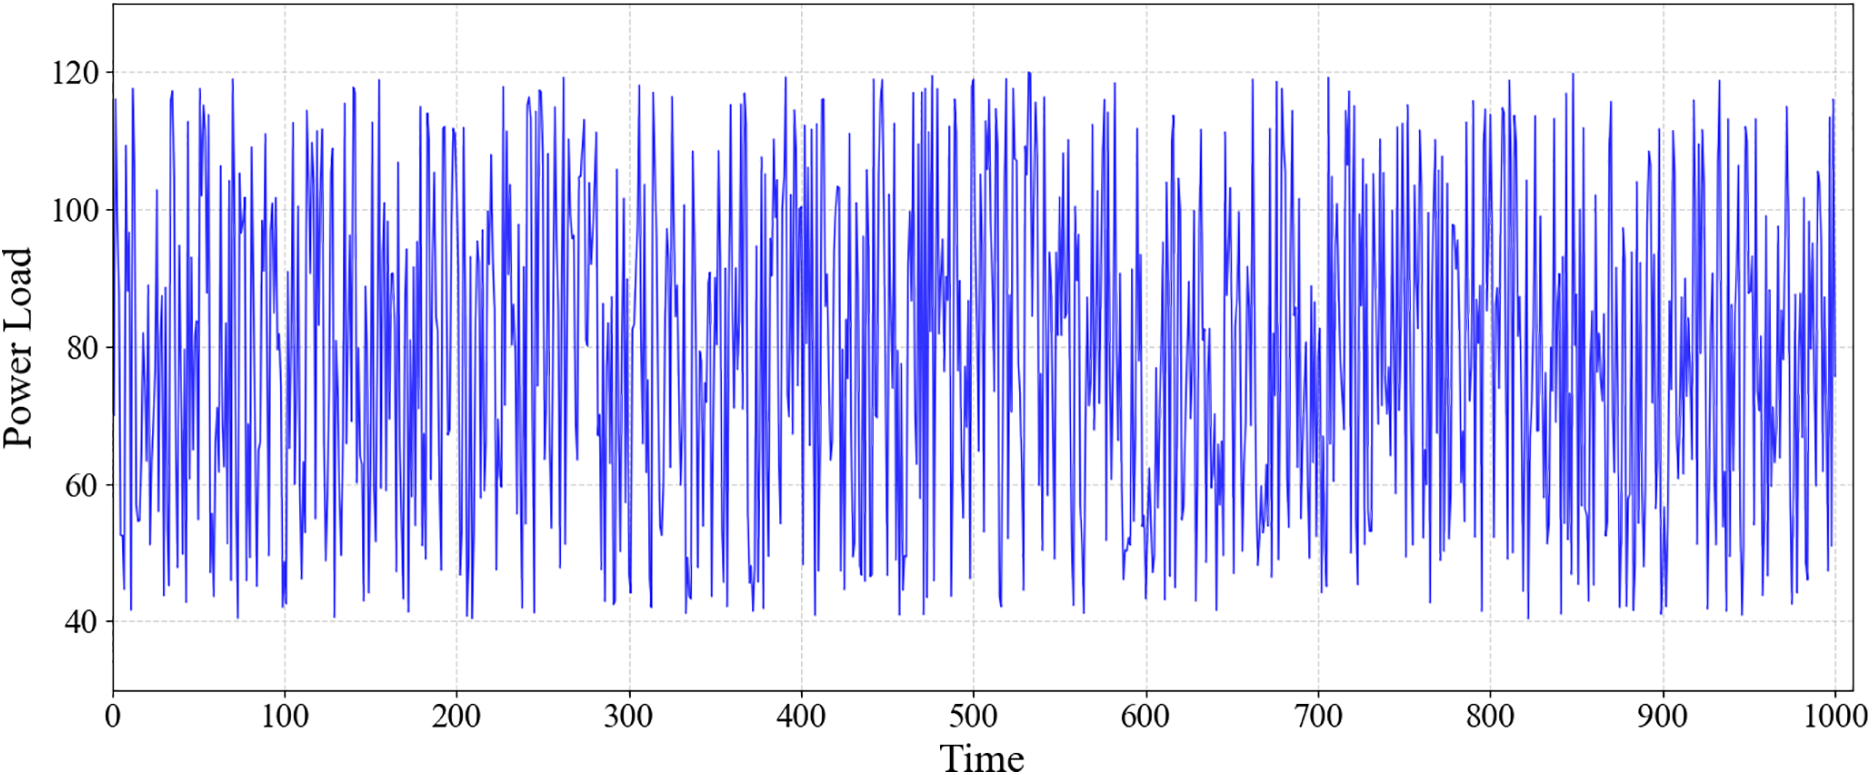
Figure 5: Time series plot of SMD (1-h intervals)
1. KNN [14]: This method identifies the K nearest observations to a sample with missing data using Euclidean distance and performs a distance-weighted average to impute the missing values.
2. VAE [24]: By maximizing the likelihood in the latent space and minimizing the discrepancy between the generated data and the original data, this approach recovers missing values.
3. GAIN [23]: Built upon the Generative Adversarial Network (GAN) framework, this model recovers missing data by performing conditional modeling of the missing locations and adversarial training.
4. M-RNN [19]: This method constructs a generative module based on Recurrent Neural Networks (RNNs) to model temporal dependencies by integrating historical and contextual information. It achieves data recovery through recursive prediction.
5. MIVAE [25]: By jointly optimizing the posterior likelihood of latent variables and the reconstruction error, this approach generates multiple probabilistic imputations within a variational framework, effectively modeling the uncertainty of missing values and enabling high-accuracy data recovery.
Root Mean Square Error (RMSE), Mean Square Error (MSE), Mean Absolute Error (MAE), and the Coefficient of Determination (
where
Sixty percent of the dataset was used as the training set, twenty percent was allocated to the validation set, and the remaining twenty percent was used for the test set. The experimental data were subjected to random missingness at missing rates ranging from
The selection of the optimal hyperparameters, specifically Hint = 0.9 and Alpha = 400, was driven by a systematic grid search on the validation set with a
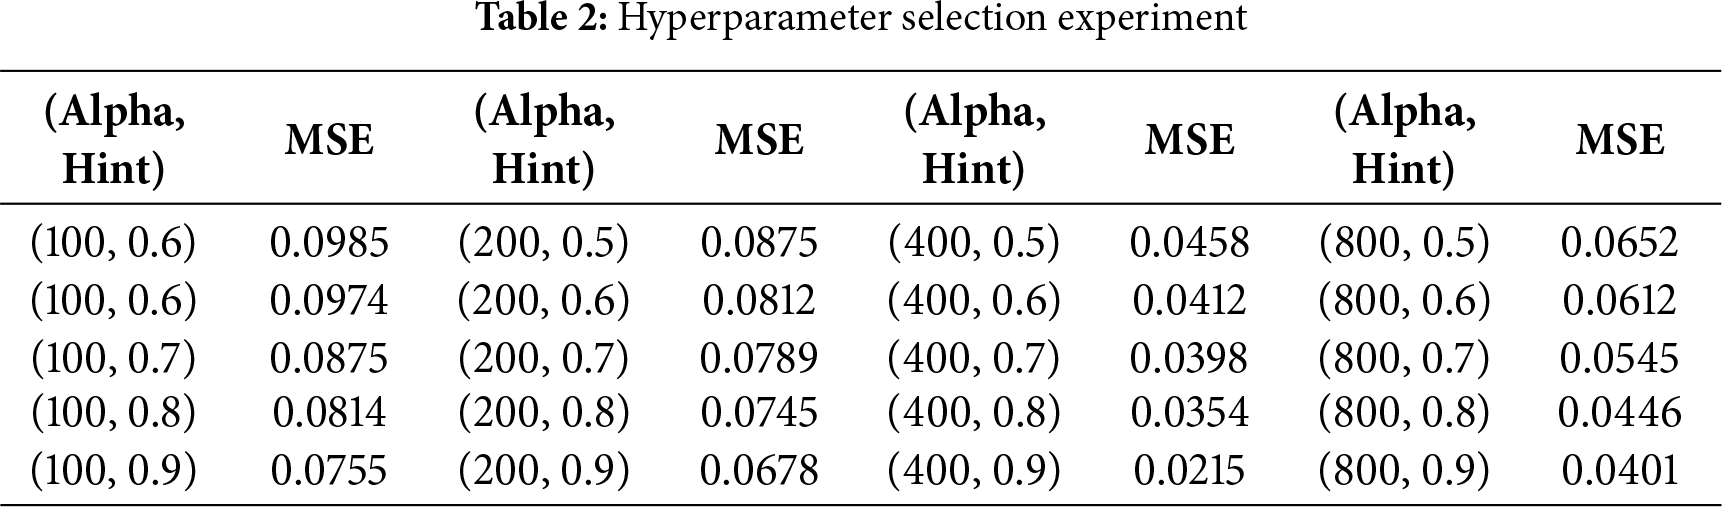
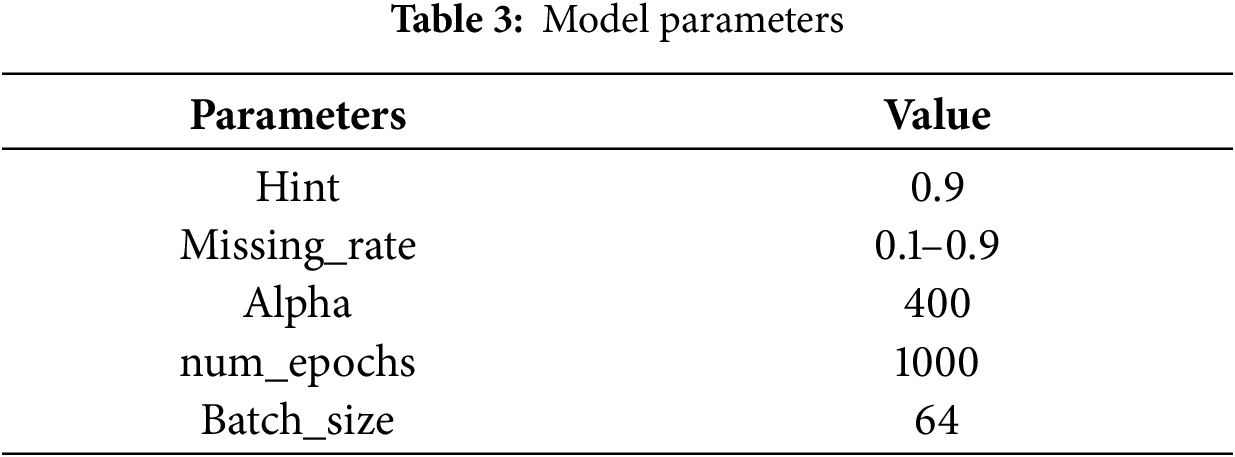
Our analysis of the experimental data reveals a clear trend of consistent performance improvement as the Hint value increased from 0.5 to 0.9 across all Alpha groups. For instance, within the critical Alpha = 400 group, the MSE decreased monotonically from 0.0458 at Hint = 0.5 to 0.0215 at Hint = 0.9, indicating that providing more precise location information to the discriminator is crucial for guiding the generator to produce more accurate imputations in high-missing-rate scenarios. The optimality of Alpha = 400 emerges from its synergistic interaction with Hint = 0.9, as evidenced by the performance comparison with other combinations. While the combination of Alpha = 200 with Hint = 0.9 yields a relatively high MSE of 0.0678, and Alpha = 800 with Hint = 0.9 achieves a better but still suboptimal MSE of 0.0401, the pair of Alpha = 400 with Hint = 0.9 achieves the lowest MSE of 0.0215 across the entire parameter space tested. This demonstrates that Alpha = 400 provides the ideal weight for the reconstruction loss, ensuring the generator not only fools the discriminator but also accurately reconstructs the known values—a capability fully leveraged when the discriminator is well-informed through Hint = 0.9. Therefore, this specific combination was selected as it represents the configuration where the generator receives the most effective guidance from the discriminator while being simultaneously constrained to achieve the highest factual accuracy. The parameters of the network model are configured as shown in the Table 3.
The imputation results of the RLD dataset across a range of missing rates are shown in Tables 4–8. The time series after imputation for a missing rate of 0.5 is shown in Fig. 6.
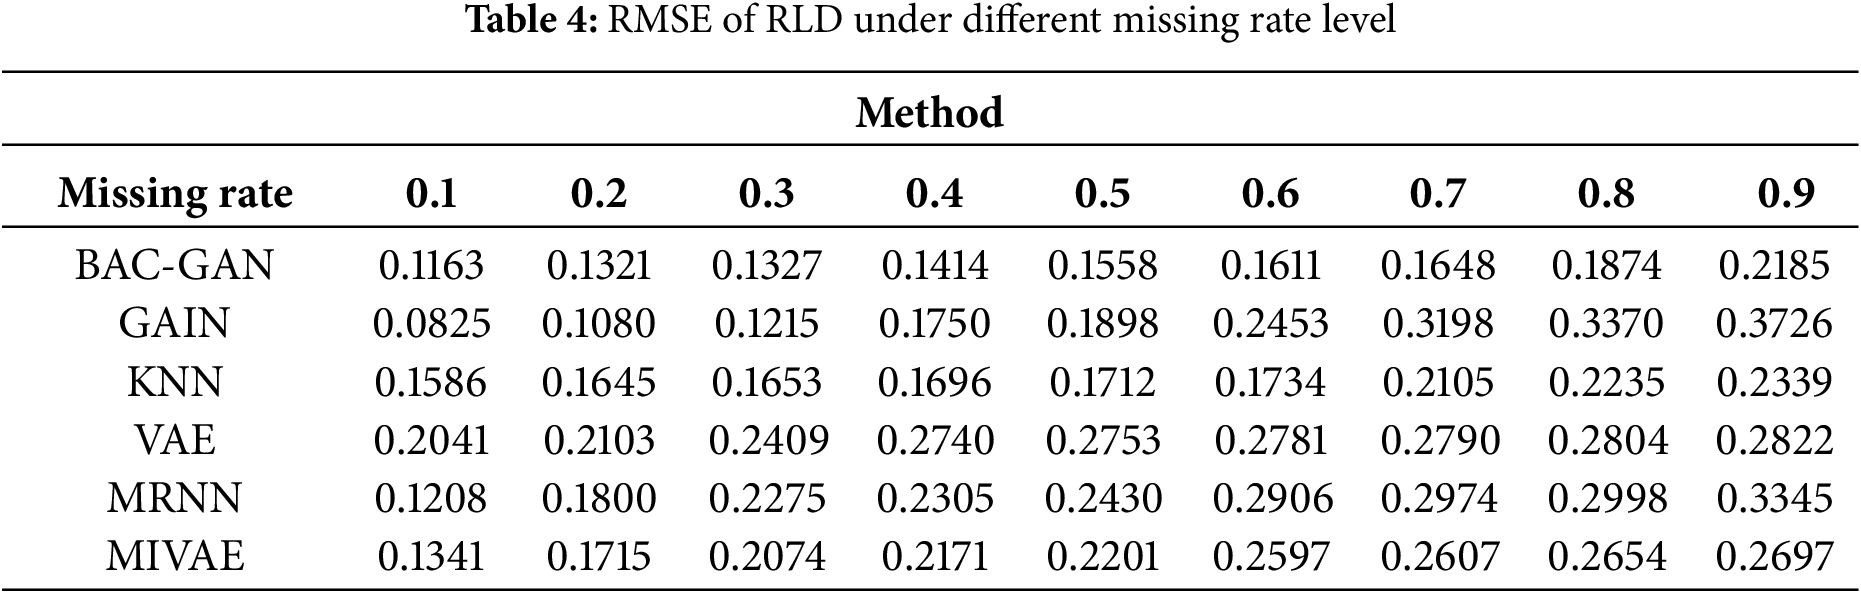
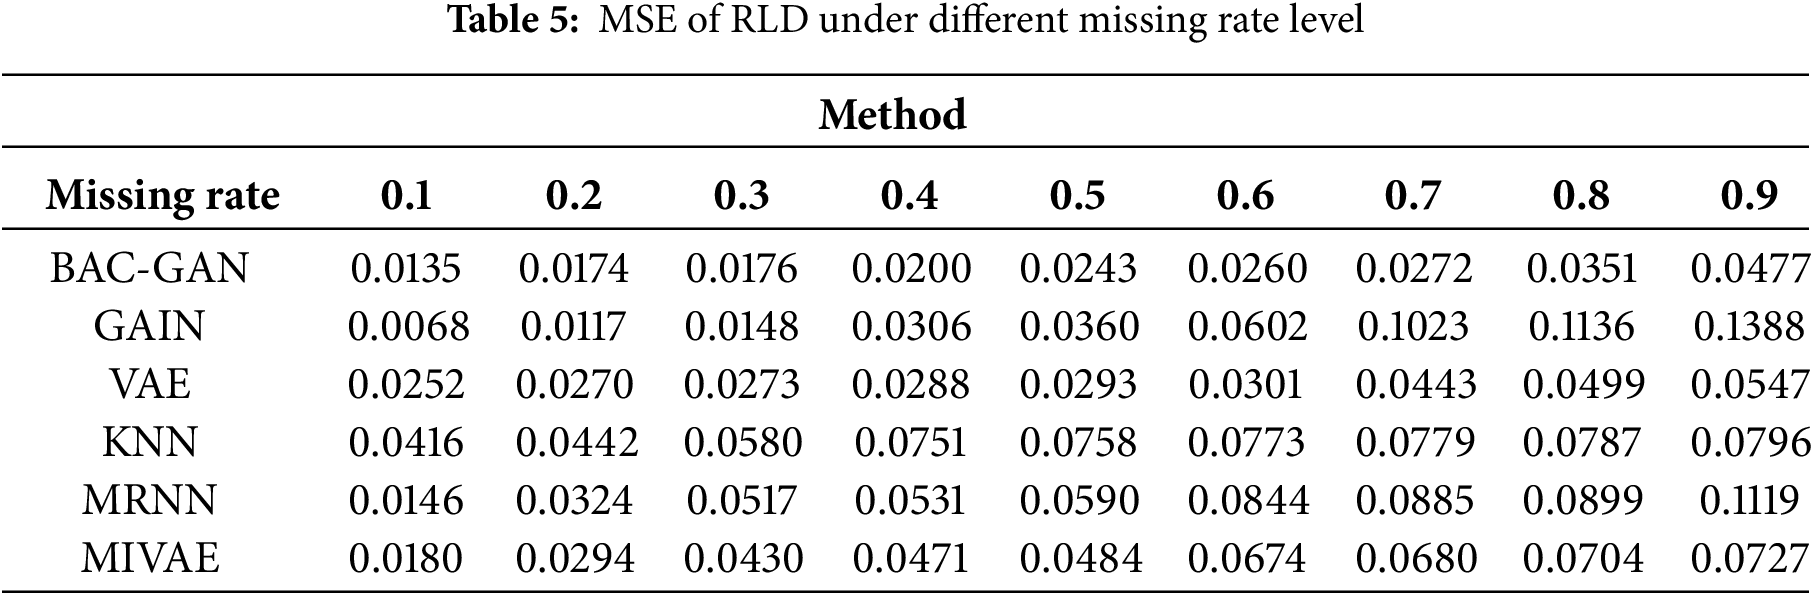
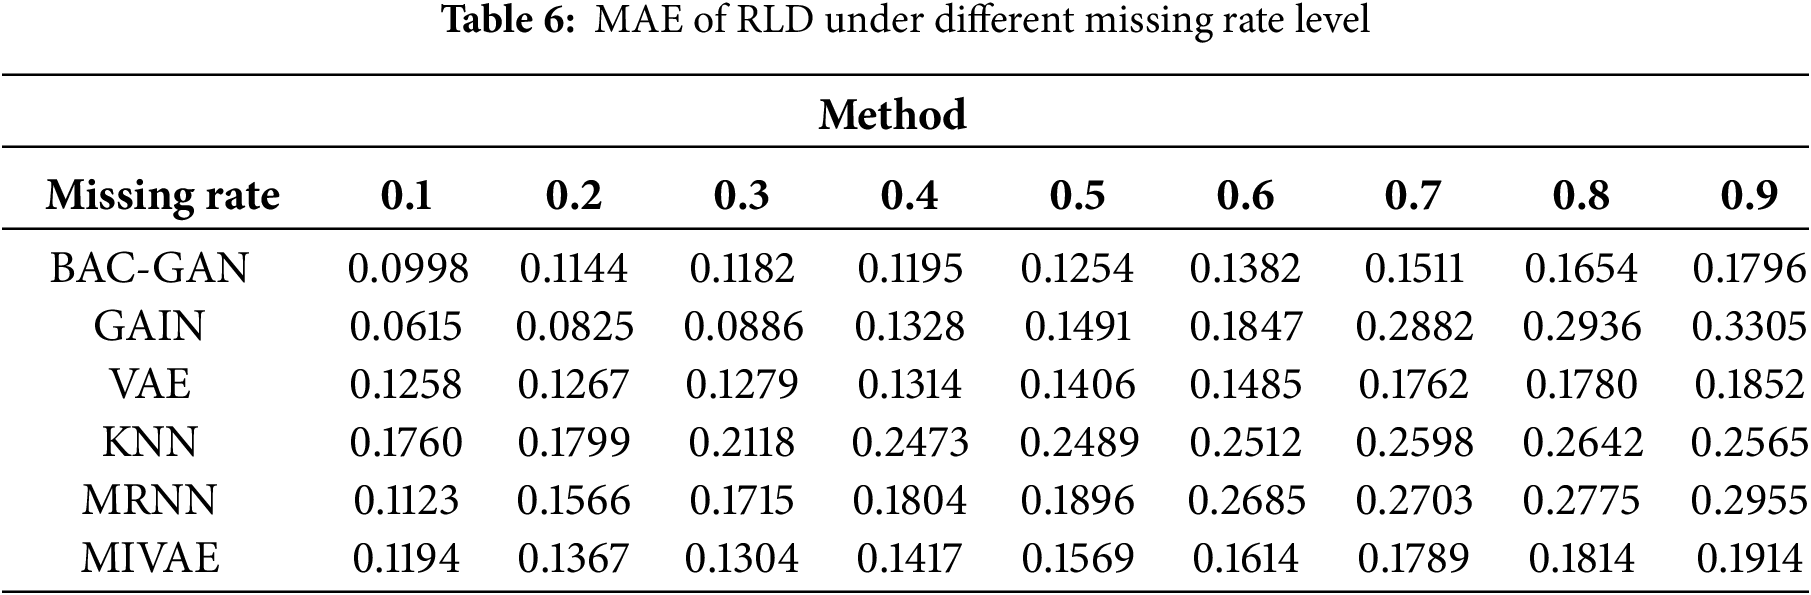
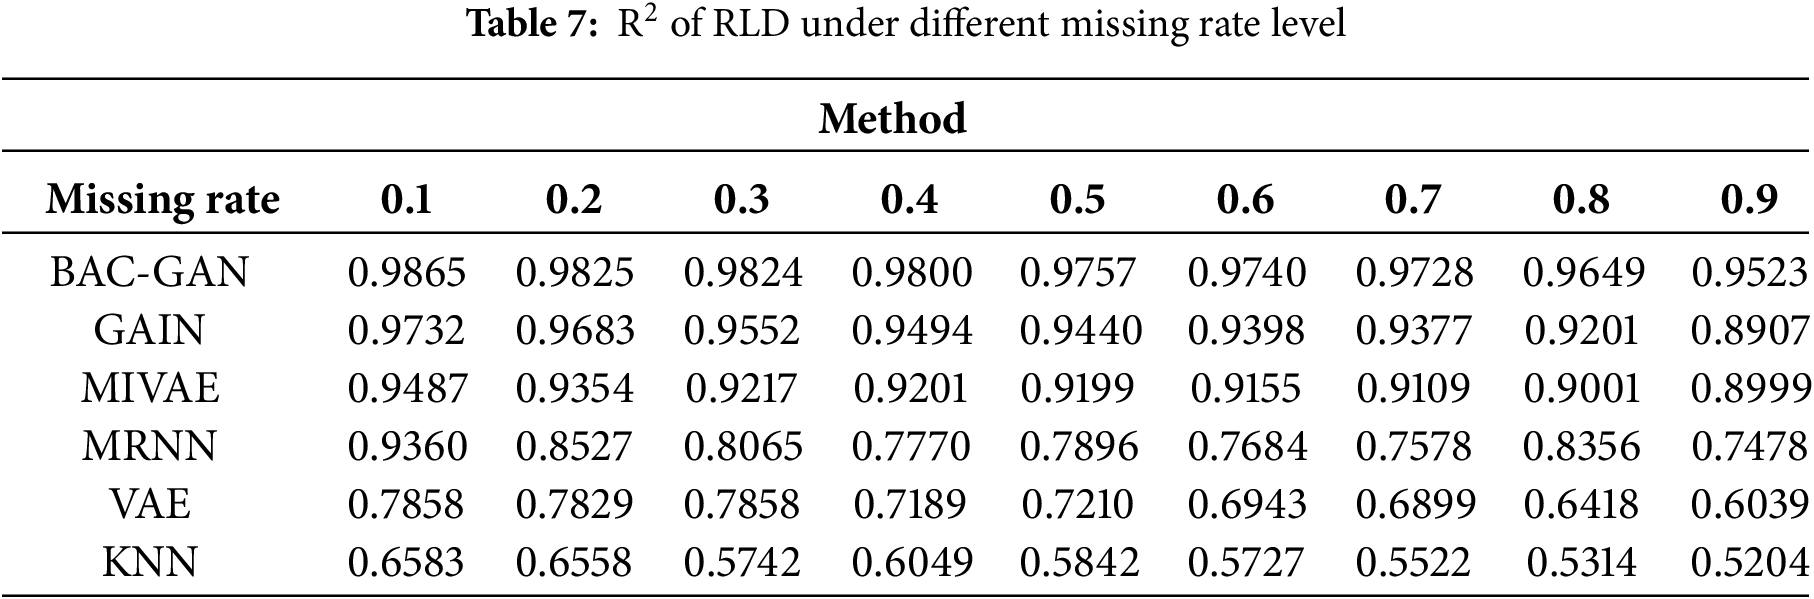
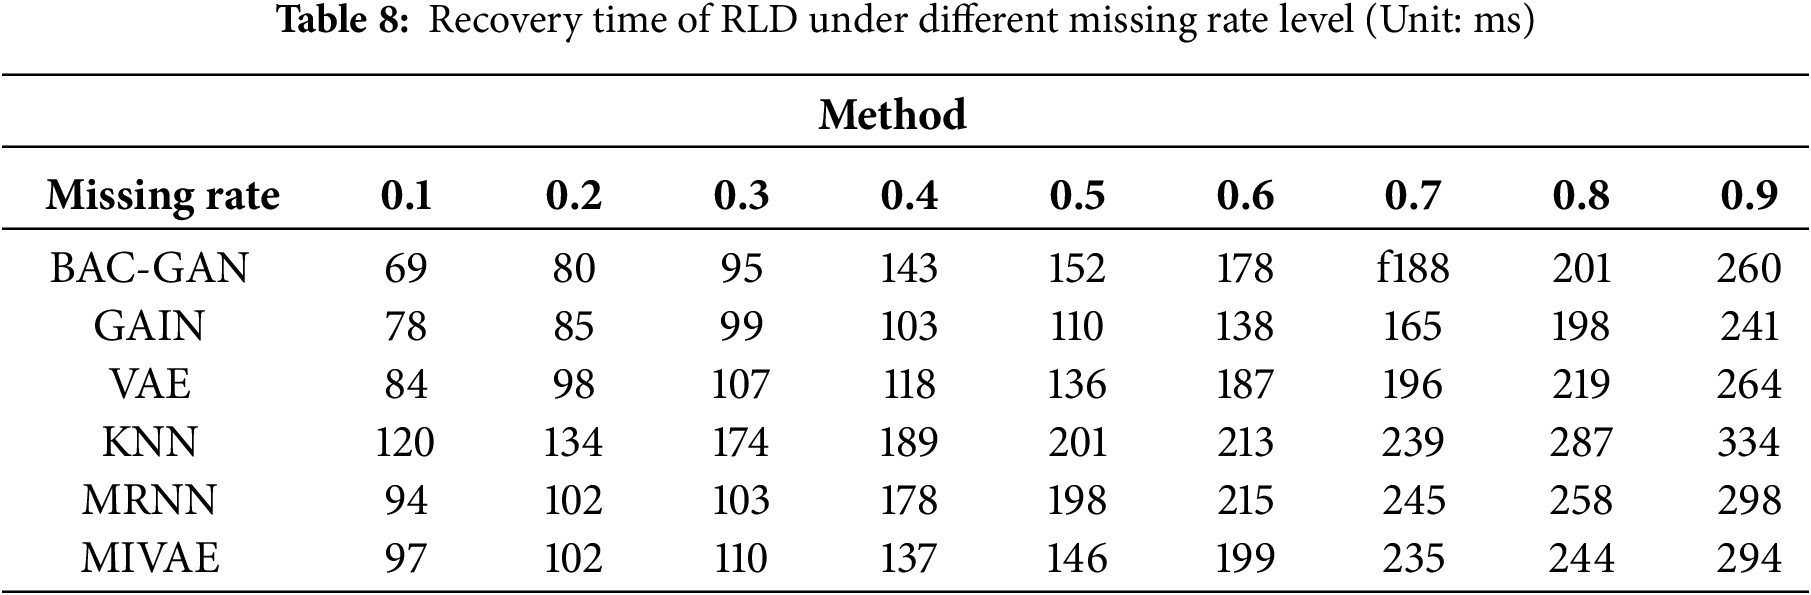
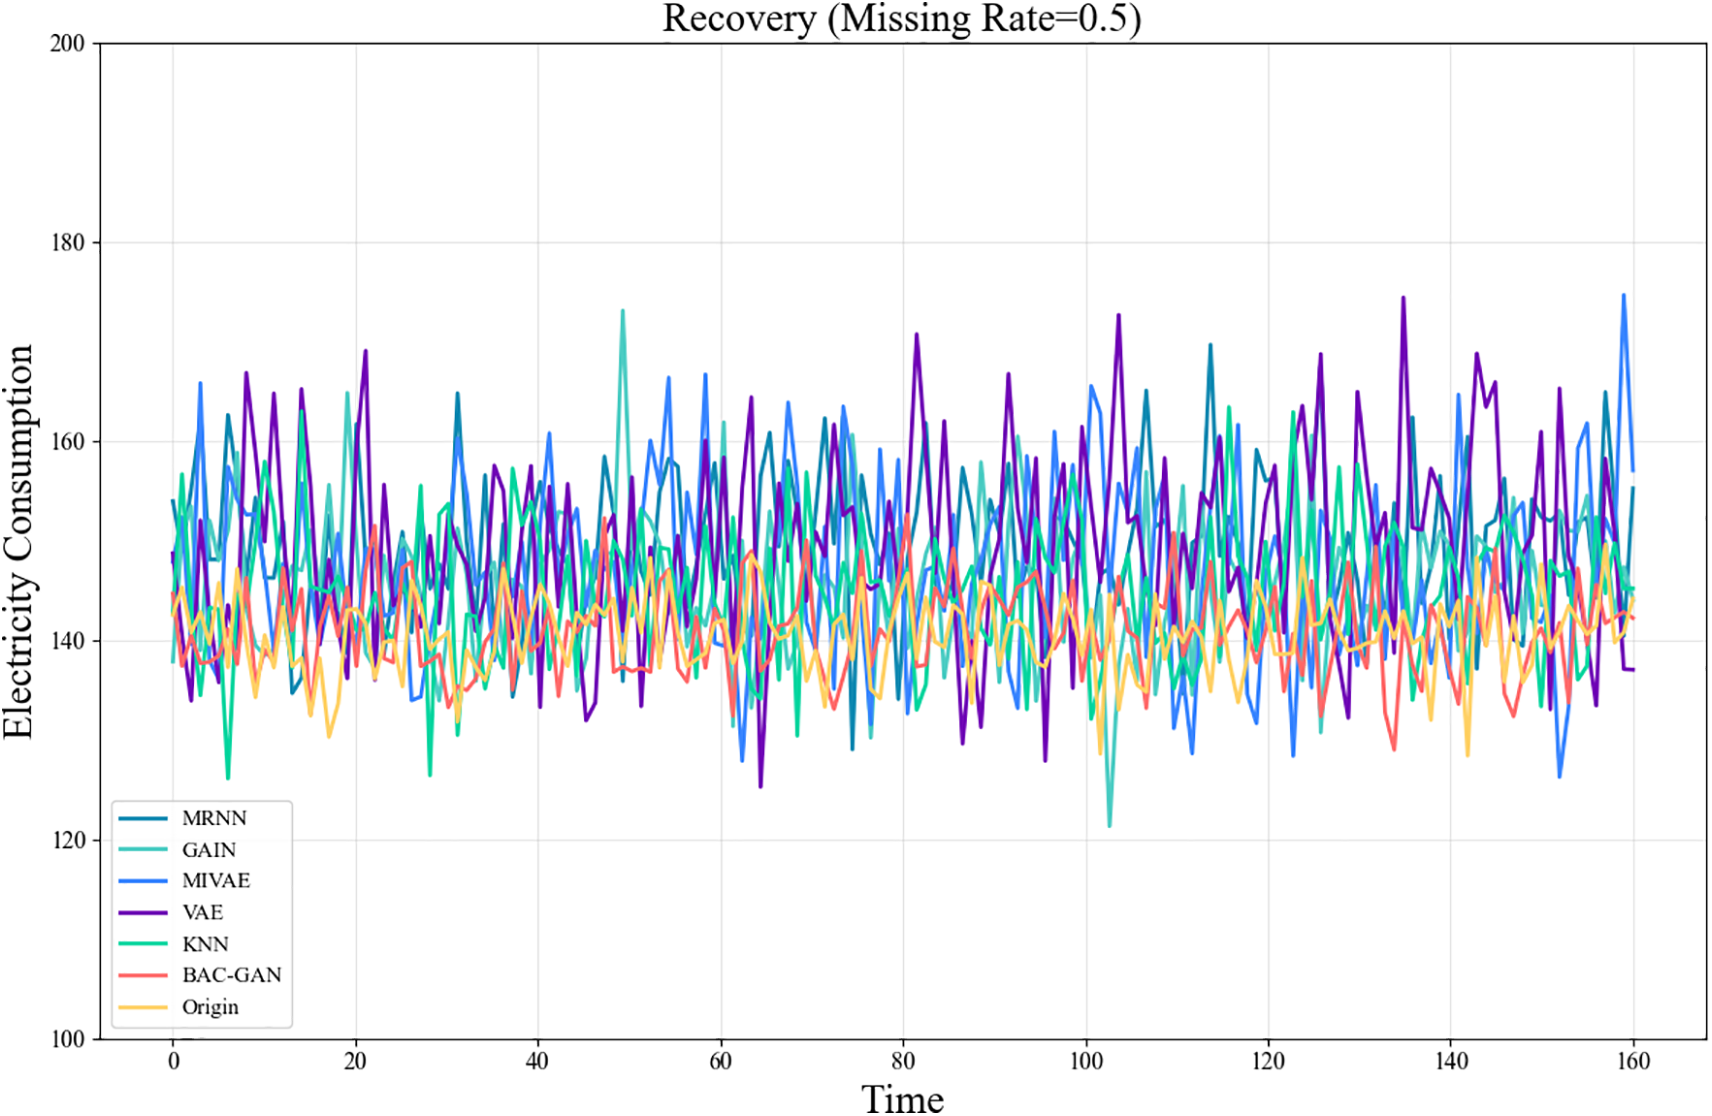
Figure 6: Time series plot of RLD after imputation (Missing rate = 0.5)
At low missing rates (0.1–0.3), the models were evaluated using metrics such as MSE, RMSE, and MAE. The results indicate that the proposed model performed second only to GAIN. At medium to high missing rates (0.4–0.9), the proposed model achieved the best performance across these metrics, significantly outperforming other methods, demonstrating its strong robustness in handling high missing scenarios. Furthermore, the model exhibited favorable
The imputation results of the RLD dataset across a range of missing rates are shown in Tables 9–13. The time series after imputation for a missing rate of 0.5 is shown in Fig. 7
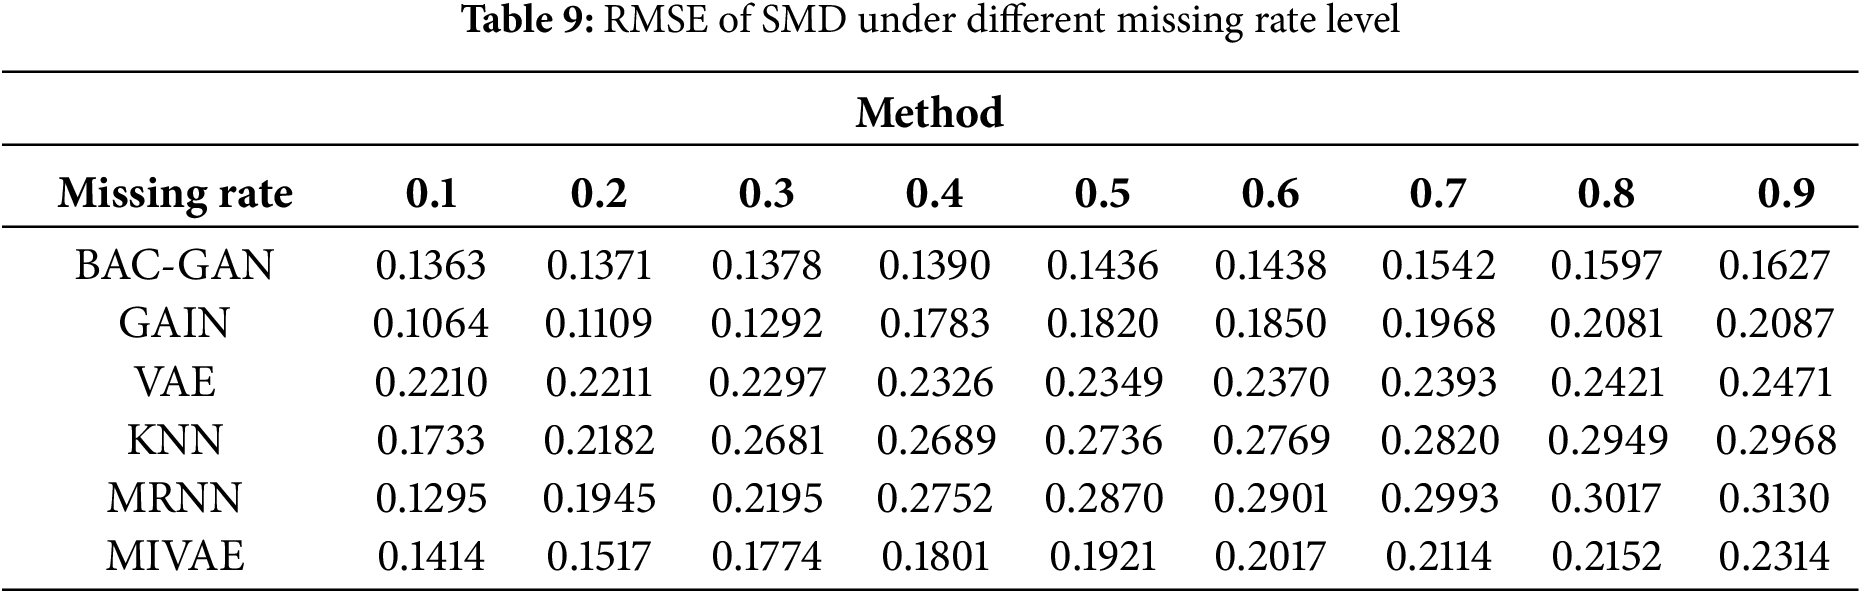
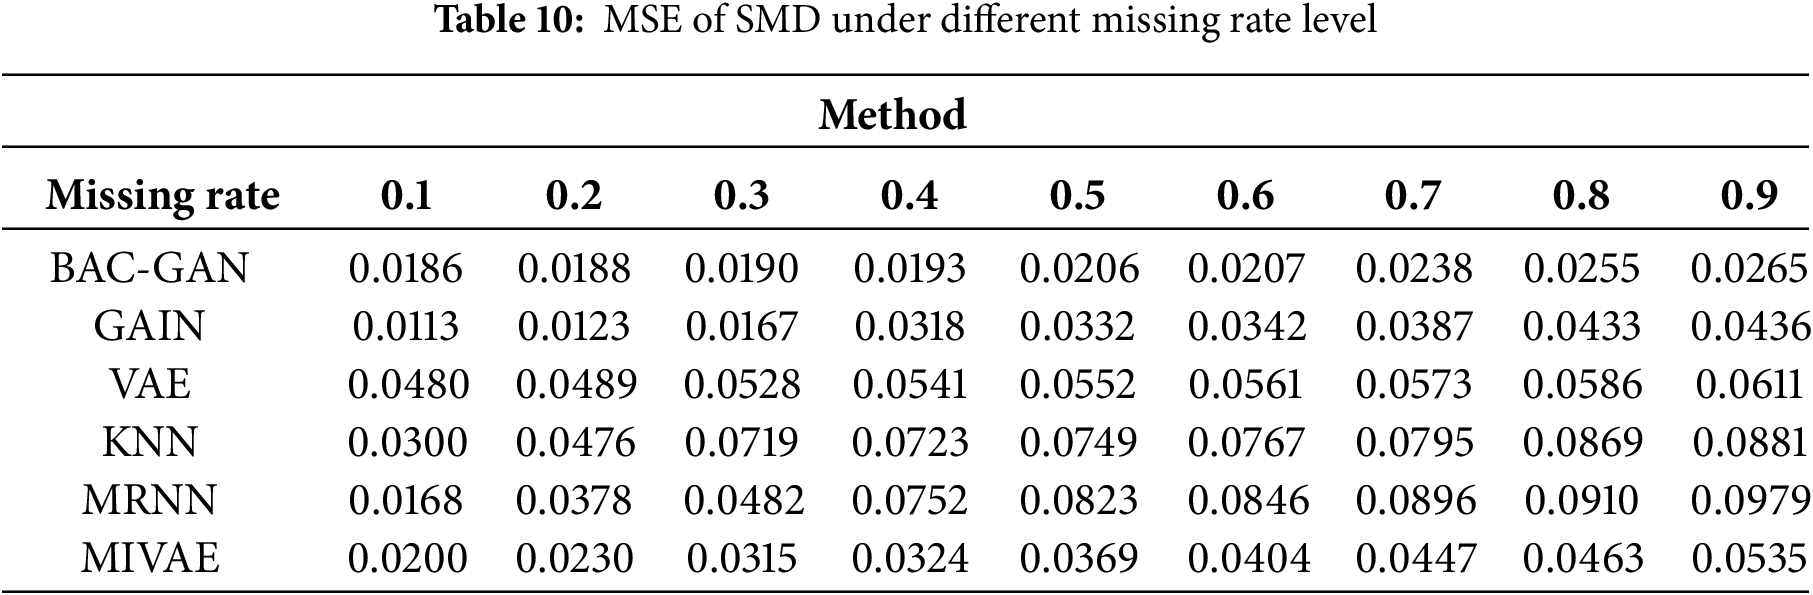
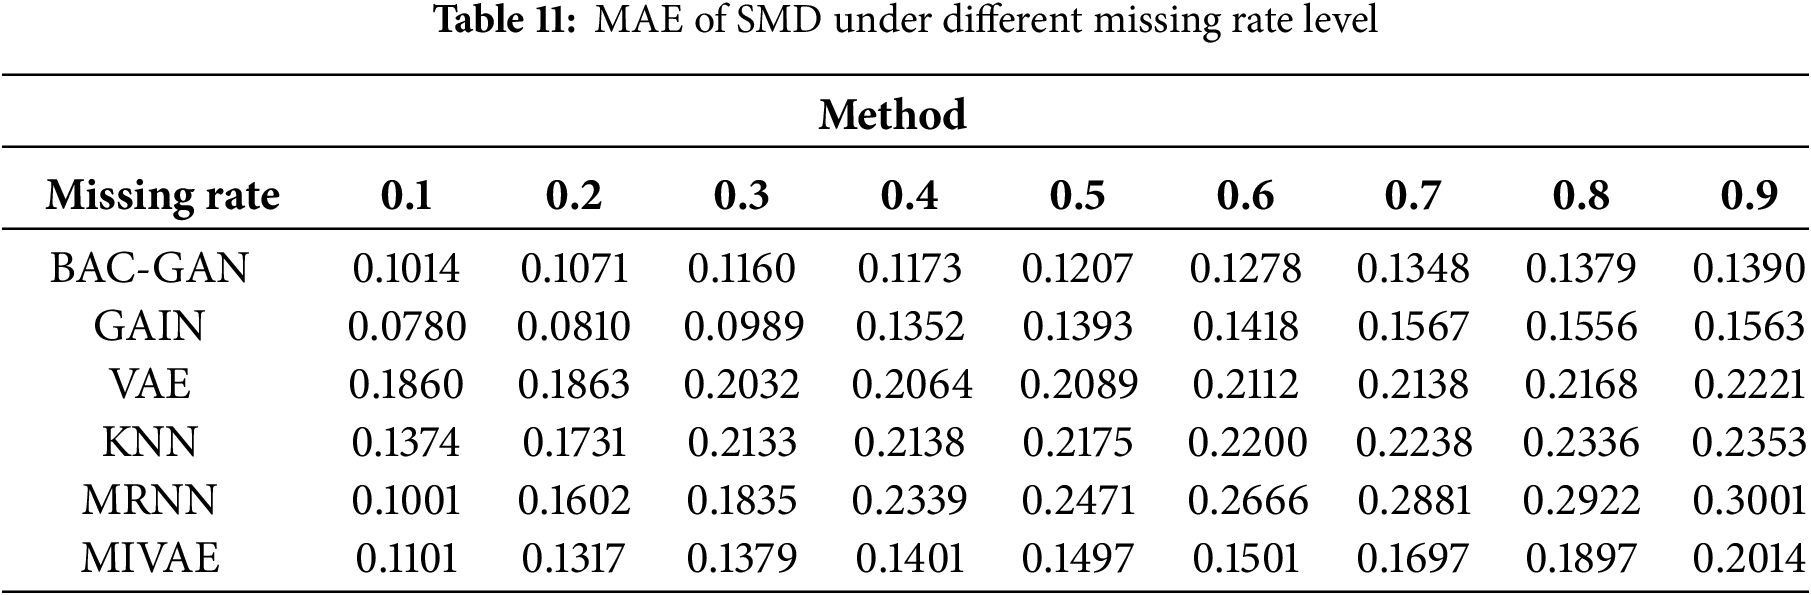
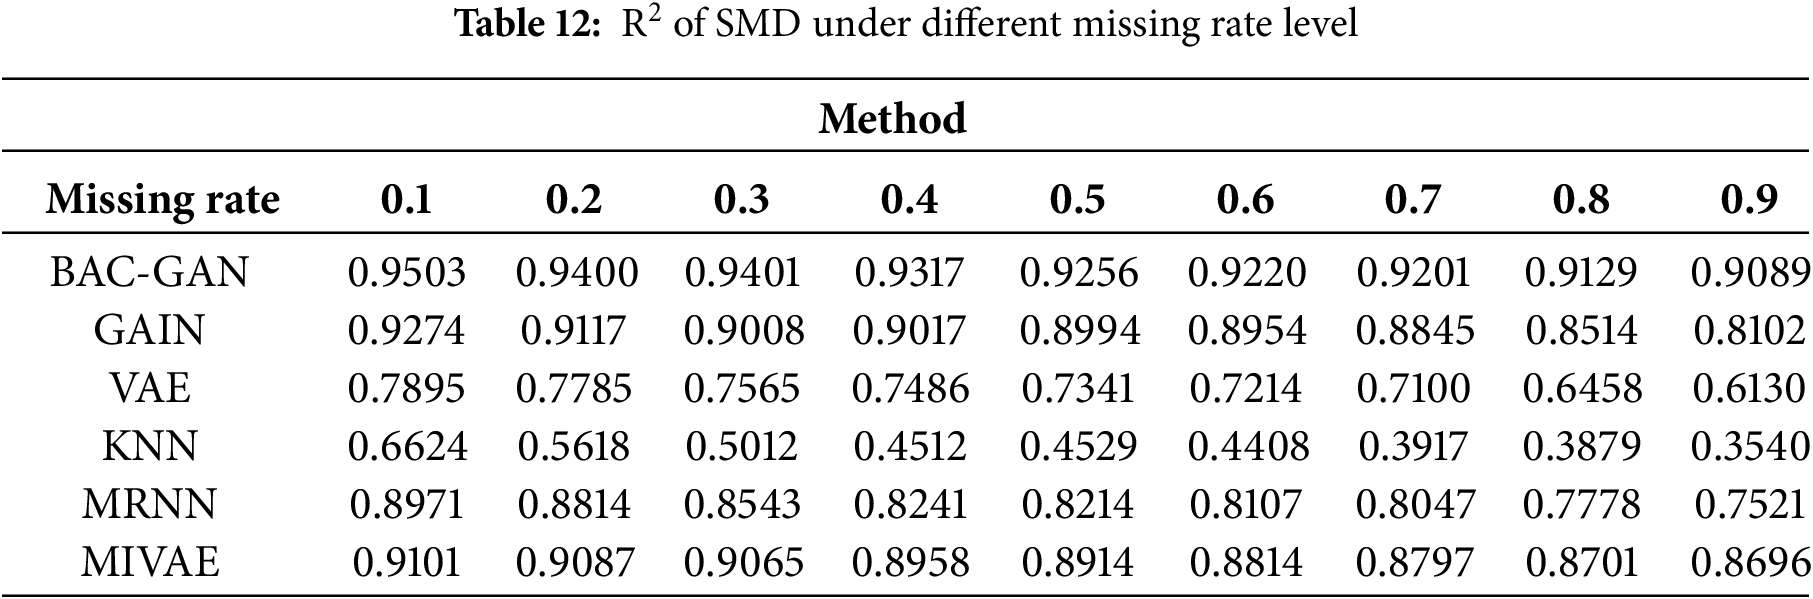
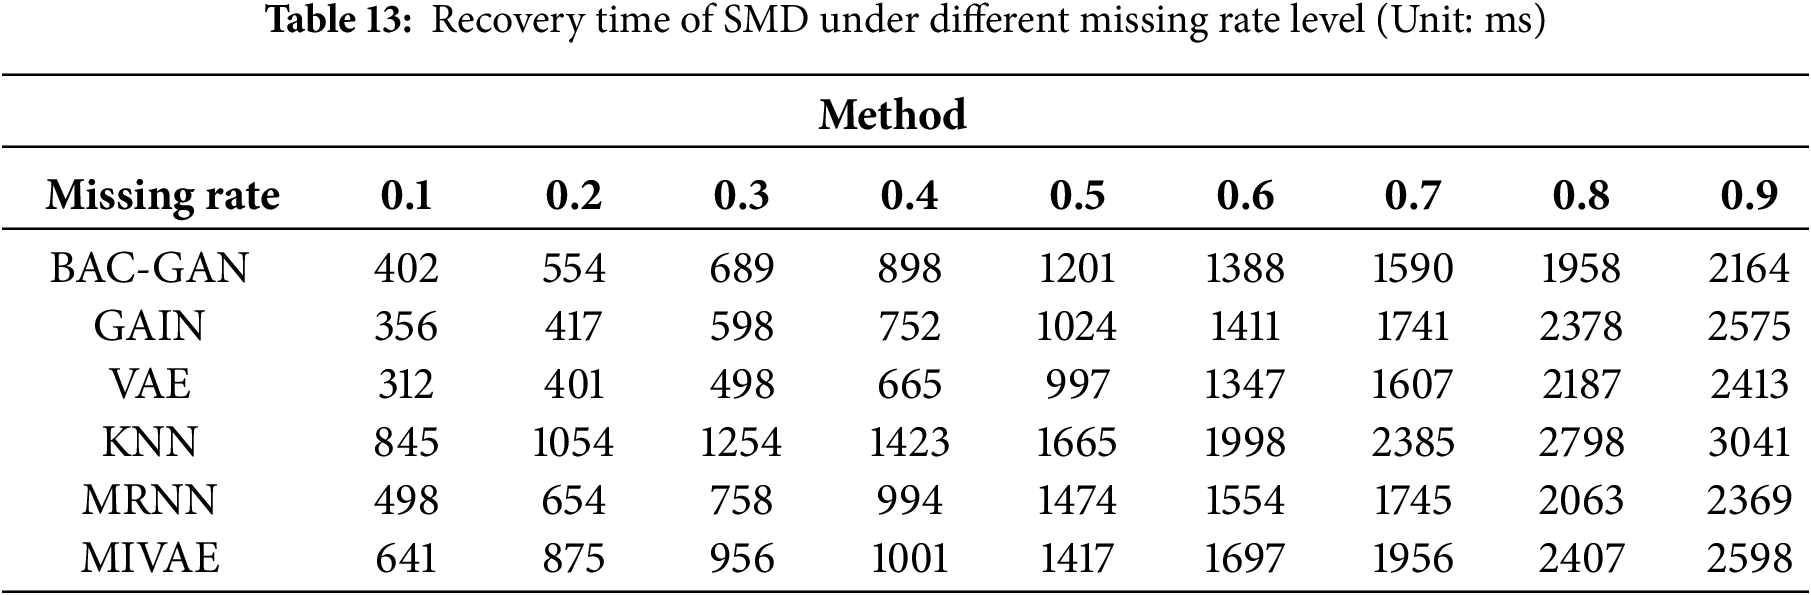
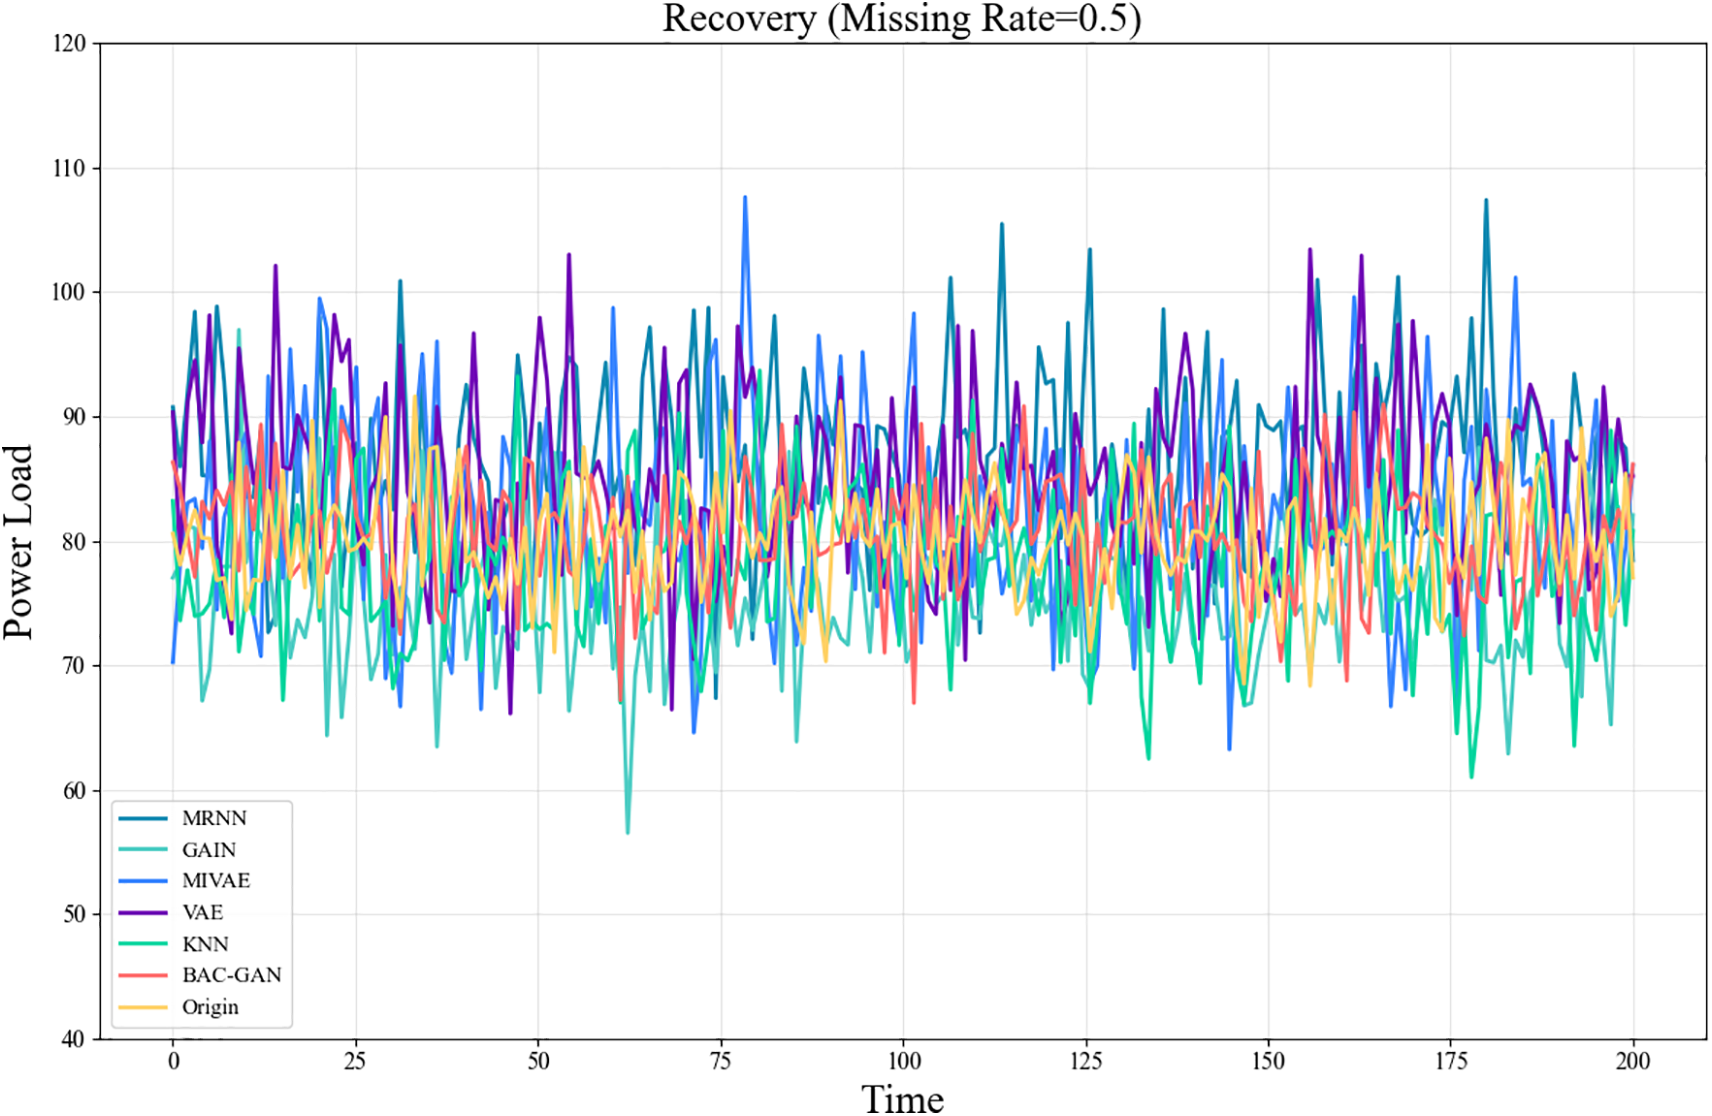
Figure 7: Time series plot of SMD after imputation (Missing rate = 0.5)
The proposed model demonstrates outstanding performance across all missing-rate scenarios, with its superiority being particularly pronounced at medium to high missing rates (0.4–0.9). Under these conditions, the model significantly outperforms comparative methods in terms of imputation accuracy, robustness, and ability to capture complex temporal dependencies. Meanwhile, BAC-GAN also exhibits excellent recovery time efficiency, maintaining fast response capabilities even under high missing-rate conditions, highlighting its strong applicability in practical situations where high proportions of data loss commonly occur.
Based on the four evaluation metrics mentioned above, the proposed model demonstrates excellent recovery performance under most missing-rate scenarios. The key to its success lies in the fact that BAC-GAN integrates BiLSTM and a multi-head attention mechanism, which effectively captures complex dependencies in time-series data and enhances the learning of global relationships. Meanwhile, the incorporation of CNN improves the model’s ability to handle high-dimensional data and strengthens local feature extraction, thereby increasing the accuracy and robustness of data recovery.
To validate the effectiveness of individual components in our proposed BAC-GAN framework, we conducted comprehensive ablation studies under various missing rate scenarios (0.2, 0.4, 0.6, 0.8). As demonstrated in Tables 14 and 15, the complete BAC-GAN model consistently achieves superior or competitive performance across all missing rates, particularly excelling at higher missing scenarios (0.6–0.8).
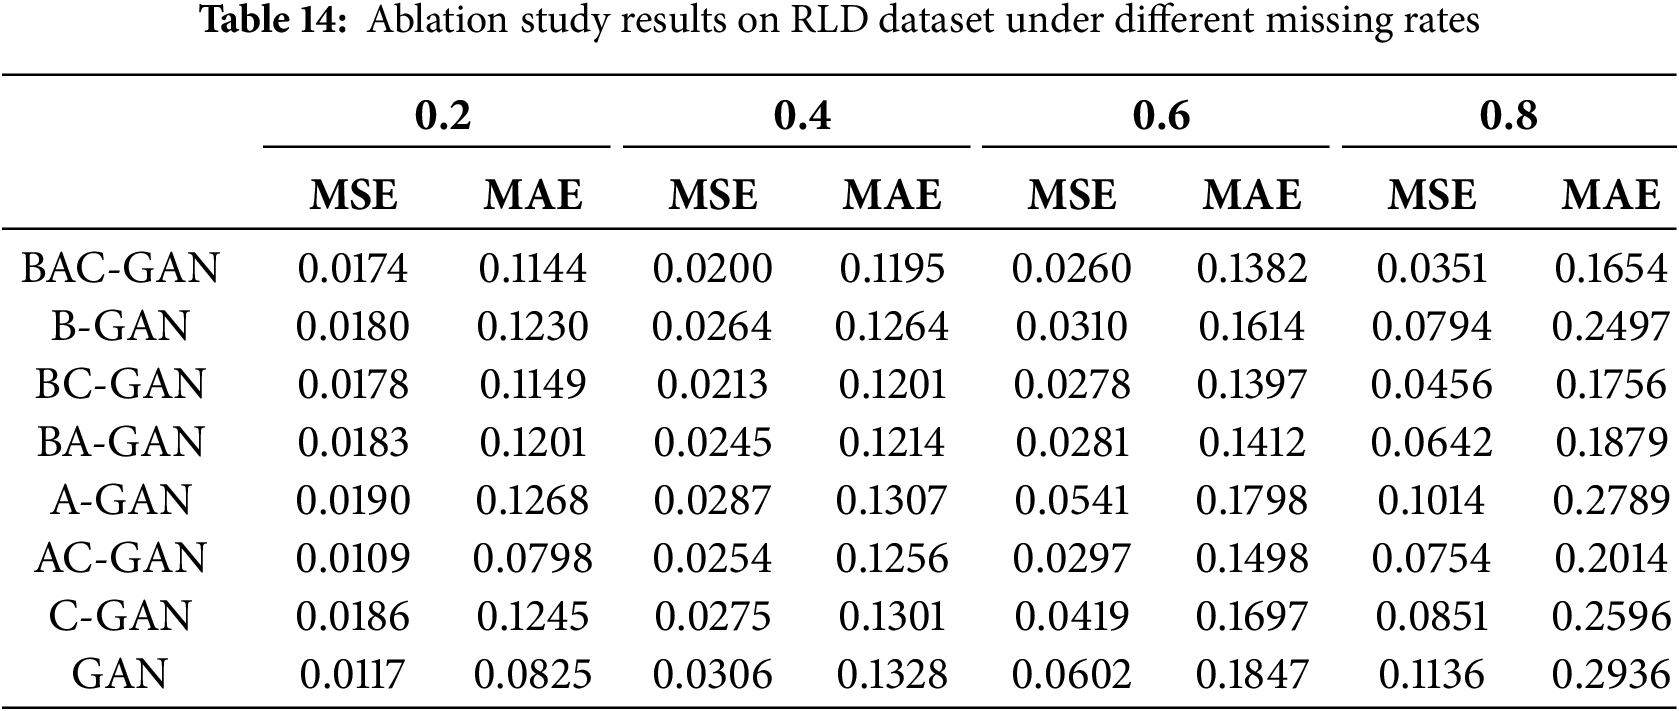
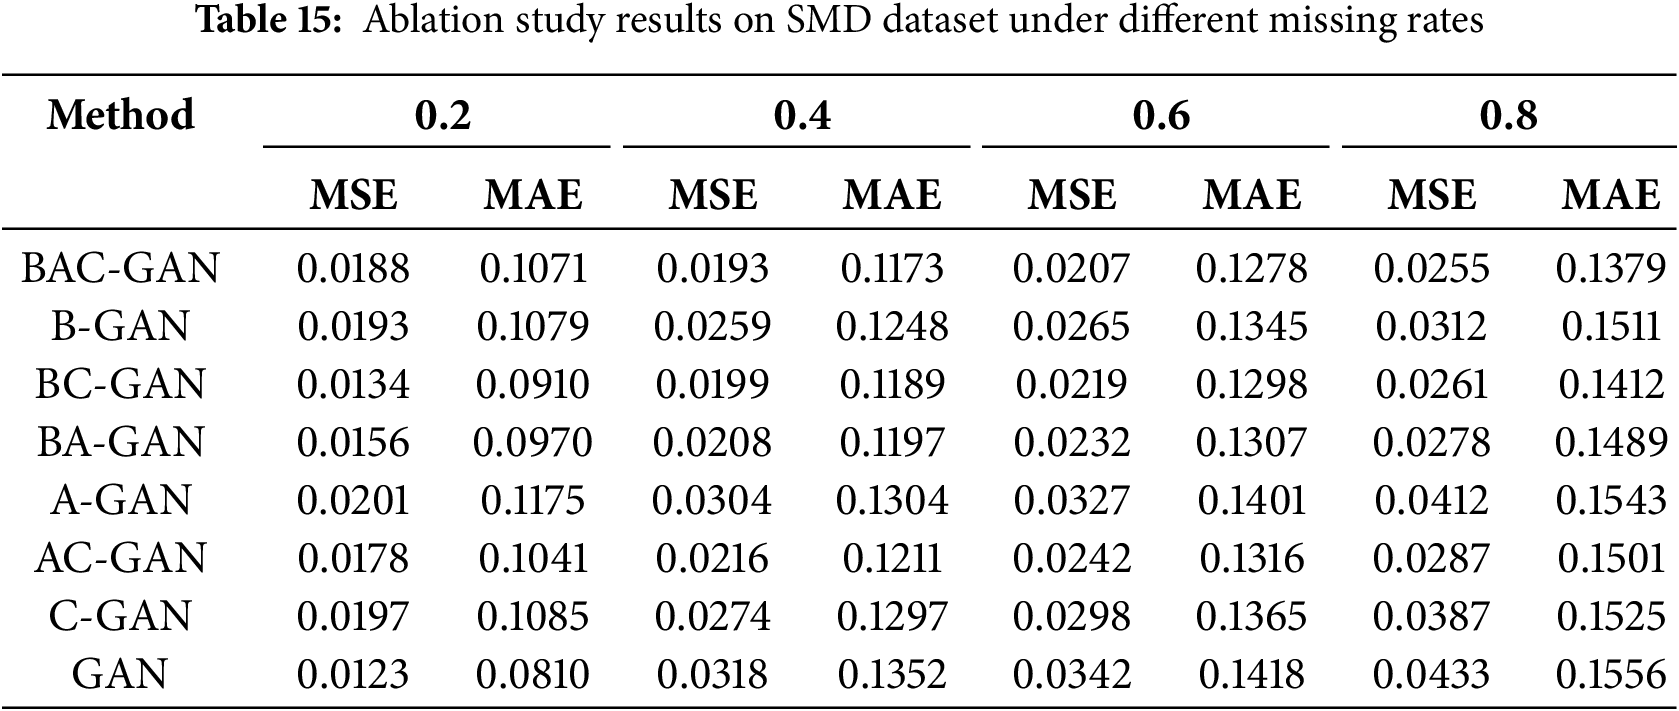
The performance degradation observed in partial component models reveals the complementary nature of the designed modules in this work. The BA-GAN variant demonstrates consistently intermediate performance, indicating that the attention mechanism contributes significantly to feature extraction but requires the constraint module to achieve optimal results. The A-GAN and C-GAN models exhibit relatively weaker performance, confirming that individual components alone are insufficient to handle complex missing data patterns.
Furthermore, the progressive performance decline from BC-GAN to BAC-GAN highlights the challenging nature of high missing-rate scenarios and validates the robustness of the proposed model. The complete BAC-GAN model maintains the most stable performance trajectory, exhibiting the smallest performance degradation as the missing rate increases from 0.2 to 0.8. These findings collectively demonstrate that the synergistic integration of all components in BAC-GAN is crucial for achieving robust performance across diverse missing data scenarios, with each element playing a distinct yet interdependent role in the overall architecture.
With the continuous development of power systems, the complexity and diversity of power data have been steadily increasing. Due to factors such as sensor failures and communication interruptions, missing or anomalous data frequently occur in power systems, posing significant challenges to system monitoring and management. To address this issue, this paper proposes a data recovery method based on an improved Generative Adversarial Network (BAC-GAN). The generator of this method incorporates bidirectional LSTM and multi-head attention mechanisms to capture complex dependencies in time-series data, while the discriminator employs CNN to integrate local features with global structures, ensuring the rationality of data recovery. Without relying on complete datasets, this method achieves high-precision data recovery. Experiments conducted on three publicly available power system datasets demonstrate that the BAC-GAN model exhibits significant advantages in recovery accuracy compared to five state-of-the-art and classical data recovery methods, providing an effective solution for missing data recovery in power systems.
The study of nonlinear generation mechanisms for multidimensional data represents a critical direction for the future development of smart grids. Current generation models based on linear assumptions struggle to accurately capture the complex dynamic coupling characteristics among source-grid-load-storage components. This limitation is particularly evident in high-penetration renewable energy integration scenarios, where traditional methods fail to adequately characterize the spatiotemporal correlations of wind and solar power outputs and load response characteristics. Future research should focus on developing interpretable generation architectures that integrate domain knowledge, ensuring that the data generation process aligns with power system operational principles.
As the scale and complexity of power system data continue to grow, missing data recovery methods based on generative adversarial networks still hold broad prospects for development. On one hand, more efficient network architectures and training strategies can be explored to further enhance the recovery accuracy and generalization capability of the model. On the other hand, the integration of technologies such as edge computing and federated learning may enable efficient data recovery in distributed environments.
Furthermore, although this study does not delve deeply into the application of Generative Adversarial Networks in multidimensional data fusion within power systems, the potential of GANs in handling multidimensional power data deserves further exploration. GANs can integrate different types of data and generate high-quality recovery results, which would significantly improve the comprehensiveness and accuracy of data recovery in power systems. While this paper primarily focuses on time-series data recovery, future work could extend the application of GANs to multidimensional data fusion. By integrating various types of data in power systems, the performance and robustness of missing data recovery could be further enhanced.
Acknowledgement: The authors acknowledge the support provided by the Advanced Ocean Institute of Southeast University, Nantong.
Funding Statement: This work was supported by the National Natural Science Foundation of China (No. 51977113) and the Science and Technology Project of State Grid Zhejiang Electric Power Co., Ltd. (No. 5211JX240001).
Author Contributions: Study conception and design: Su Zhang, Song Deng and Qingsheng Liu; data collection: Su Zhang, Song Deng and Qingsheng Liu; analysis and interpretation of results: Su Zhang, Song Deng and Qingsheng Liu; draft manuscript preparation: Su Zhang, Song Deng and Qingsheng Liu. All authors reviewed the results and approved the final version of the manuscript.
Availability of Data and Materials: The authors confirm that the data supporting the findings of this study are available within the article.
Ethics Approval: Not applicable.
Conflicts of Interest: The authors declare no conflicts of interest to report regarding the present study.
References
1. Cheng X, Sun Y, Jara A, Song H, Tian Y. Big data and knowledge extraction for cyber-physical systems. Int J Distrib Sens Netw. 2015;11(9):231527. doi:10.32604/cmc.2022.026751. [Google Scholar] [CrossRef]
2. Baccarelli E, Cordeschi N, Mei A, Panella M, Shojafar M, Stefa J. Energy-efficient dynamic traffic offloading and reconfiguration of networked data centers for big data stream mobile computing: review, challenges, and a case study. IEEE Netw. 2016;30(2):54–61. doi:10.1109/MNET.2016.7437025. [Google Scholar] [CrossRef]
3. Wang K, Li H, Feng Y, Tian G. Big data analytics for system stability evaluation strategy in the energy Internet. IEEE Trans Ind Inform. 2017;13(4):1969–78. doi:10.1109/TII.2017.2692775. [Google Scholar] [CrossRef]
4. Fang X, Misra S, Xue G, Yang D. Smart grid—the new and improved power grid: a survey. IEEE Commun Surv Tutor. 2011;14(4):944–80. doi:10.1109/SURV.2011.101911.00087. [Google Scholar] [CrossRef]
5. Wang MC, Tsai CF, Lin WC. Towards missing electric power data imputation for energy management systems. Expert Syst Appl. 2021;174(1):114743. doi:10.1016/j.eswa.2021.114743. [Google Scholar] [CrossRef]
6. Mohammadi M, Kavousi-Fard A, Dabbaghjamanesh M, Farughian A, Khosravi A. Effective management of ener-gy internet in renewable hybrid microgrids: a secured data driven resilient architecture. IEEE Trans Ind Inform. 2021;18(3):1896–904. doi:10.1109/TII.2021.3081683. [Google Scholar] [CrossRef]
7. Do V, McBrien H, Flores NM, Northrop AJ, Schlegelmilch J, Kiang MV, et al. Spatiotemporal distribution of power outages with climate events and social vulnerability in the USA. Nat Commun. 2023;14(1):2470. doi:10.1038/s41467-023-38084-6. [Google Scholar] [PubMed] [CrossRef]
8. Yuan Y, Zhang C, Wang Y, Liu C, Ji J, Feng C. Linear interpolation process and its influence on the secondary equipment in substations. In: 2017 China International Electrical and Energy Conference (CIEEC); 2017 Oct 25–27; Beijing, China. p. 205–9. doi:10.1109/CIEEC.2017.8388447. [Google Scholar] [CrossRef]
9. Liu T, Wei H, Zhang K. Wind power prediction with missing data using Gaussian process regression and multiple imputation. Appl Soft Comput. 2018;71:905–16. doi:10.1109/SURV.2011.101911.00087. [Google Scholar] [CrossRef]
10. Van Buuren S, Groothuis-Oudshoorn K. Mice : multivariate imputation by chained equations in R. J Stat Softw. 2011;45:1–67. doi:10.18637/jss.v045.i03. [Google Scholar] [CrossRef]
11. Broersen PMT, Bos R. Time-series analysis if data are randomly missing. IEEE Trans Instrum Meas. 2006;55(1):79–84. doi:10.1109/TIM.2005.861247. [Google Scholar] [CrossRef]
12. Box GEP, Jenkins GM, Reinsel GC. Time series analysis: forecasting and control. Hoboken, NJ, USA: John Wiley and Sons; 2015. [Google Scholar]
13. Li B, Lin YP, Zhou SW, Luo Q, Yin B. An interpolation algorithm based on sliding neighborhood in wireless sensor networks. J Comput Res Dev. 2012;49(6):1196–203. [Google Scholar]
14. Poloczek J, Treiber NA, Kramer O. KNN regression as geo-imputation method for spatio-temporal wind data. In: Proceedings of International Joint Conference SOCO’14-CISIS’14-ICEUTE’14; 2014 Jun 25–27; Bilbao, Spain. Cham, Switzerland: Springer International Publishing; 2014. p. 185–93. [Google Scholar]
15. Su T, Shi Y, Yu J, Yue C, Zhou F. Nonlinear compensation algorithm for multidimensional temporal data: a missing value imputation for the power grid applications. Knowl Based Syst. 2021;215:106743. doi:10.1016/j.knosys.2021.106743. [Google Scholar] [CrossRef]
16. Stekhoven DJ, Bühlmann P. MissForest—non-parametric missing value imputation for mixed-type data. Bioinformatics. 2012;28(1):112–8. doi:10.1093/bioinformatics/btr597. [Google Scholar] [PubMed] [CrossRef]
17. Yoon J, Zame WR, Van Der Schaar M. Estimating missing data in temporal data streams using multi-directional recurrent neural networks. IEEE Trans Biomed Eng. 2018;66(5):1477–90. doi:10.1109/TBME.2018.2874712. [Google Scholar] [PubMed] [CrossRef]
18. Che Z, Purushotham S, Cho K, Sontag D, Liu Y. Recurrent neural networks for multivariate time series with missing values. Sci Rep. 2018;8(1):6085. doi:10.1038/s41598-018-24271-9. [Google Scholar] [PubMed] [CrossRef]
19. Marisca I, Cini A, Alippi C. Learning to reconstruct missing data from spatiotemporal graphs with sparse observations. Adv Neural Inf Process Syst. 2022;35:32069–82. doi:10.48550/arXiv.2205.13479. [Google Scholar] [CrossRef]
20. Tashiro Y, Song J, Song Y, Ermon S. Csdi: conditional score-based diffusion models for probabilistic time series imputation. Adv Neural Inform Process Syst. 2021;34:24804–16. doi:10.48550/arXiv.2107.03502. [Google Scholar] [CrossRef]
21. Mesquita DPP, Gomes JPP, Rodrigues LR. Artificial neural networks with random weights for incomplete datasets. Neural Process Lett. 2019;50(3):2345–72. doi:10.1007/s11063-019-10012-02. [Google Scholar] [CrossRef]
22. Jiang B, Siddiqi MD, Asadi R, Regan A. Imputation of missing traffic flow data using denoising autoencoders. Procedia Comput Sci. 2021;184:84–91. doi:10.1016/j.procs.2021.03.122. [Google Scholar] [CrossRef]
23. Yoon J, Jordon J, Schaar M. Gain: missing data imputation using generative adversarial nets. In: Proceedings of the 35th International Conference on Machine Learning; 2018 Jul 10–15; Stockholm Sweden. p. 5689–98. doi:10.48550/arXiv.1806.02920. [Google Scholar] [CrossRef]
24. McCoy JT, Kroon S, Auret L. Variational autoencoders for missing data imputation with application to a simulated milling circuit. IFAC-PapersOnLine. 2018;51(21):141–6. doi:10.1016/j.ifacol.2018.09.406. [Google Scholar] [CrossRef]
25. Ma Q, Li X, Bai M, Wang X, Ning B, Li G. MIVAE: multiple imputation based on variational auto-encoder. Eng Appl Artif Intell. 2023;123:106270. doi:10.1016/j.engappai.2023.106270. [Google Scholar] [CrossRef]
Cite This Article
 Copyright © 2026 The Author(s). Published by Tech Science Press.
This work is licensed under a Creative Commons Attribution 4.0 International License , which permits unrestricted use, distribution, and reproduction in any medium, provided the original work is properly cited.
 Downloads
 Citation Tools