
 Submit a Paper
 Propose a Special lssue
 Open Access
ARTICLE
Boruta-LSTMAE: Feature-Enhanced Depth Image Denoising for 3D Recognition
1 Campus Cité Scientifique, Université de Lille, Villeneuve-d’Ascq, Lille, France
2 College of Computer Science and Information Systems, Institute of Business Management, Karachi, Pakistan
3 Computer Engineering Department, Sir Syed University of Engineering and Technology, Karachi, Pakistan
4 Incflex Ltd., London, UK
5 Department of Computer Science, The University of Larkano, Sindh, Pakistan
6 Department of Creative Technologies, Faculty of Computing & AI, Air University, Islamabad, Pakistan
7 Faculty of Engineering and Quantity Surveying, INTI International University, Nilai, Malaysia
8 Chitkara University Institute of Engineering and Technology, Chitkara University, Rajpura, India
* Corresponding Authors: Fawad Salam Khan. Email: ; Wai Yie Leong. Email:
Computers, Materials & Continua 2026, 87(1), 91 https://doi.org/10.32604/cmc.2026.072893
Received 05 September 2025; Accepted 26 December 2025; Issue published 10 February 2026
 View Full Text
 Download PDF
Abstract
The initial noise present in the depth images obtained with RGB-D sensors is a combination of hardware limitations in addition to the environmental factors, due to the limited capabilities of sensors, which also produce poor computer vision results. The common image denoising techniques tend to remove significant image details and also remove noise, provided they are based on space and frequency filtering. The updated framework presented in this paper is a novel denoising model that makes use of Boruta-driven feature selection using a Long Short-Term Memory Autoencoder (LSTMAE). The Boruta algorithm identifies the most useful depth features that are used to maximize the spatial structure integrity and reduce redundancy. An LSTMAE is then used to process these selected features and model depth pixel sequences to generate robust, noise-resistant representations. The system uses the encoder to encode the input data into a latent space that has been compressed before it is decoded to retrieve the clean image. Experiments on a benchmark data set show that the suggested technique attains a PSNR of 45 dB and an SSIM of 0.90, which is 10 dB higher than the performance of conventional convolutional autoencoders and 15 times higher than that of the wavelet-based models. Moreover, the feature selection step will decrease the input dimensionality by 40%, resulting in a 37.5% reduction in training time and a real-time inference rate of 200 FPS. Boruta-LSTMAE framework, therefore, offers a highly efficient and scalable system for depth image denoising, with a high potential to be applied to close-range 3D systems, such as robotic manipulation and gesture-based interfaces.Keywords
The noise is present in the depth images. Original depth images are collected with the assistance of RGB-D cameras like the Microsoft Kinect, which has been largely due to both hardware constraints and nature. This noise is a critical deterioration of the depth information, which leads to a problem in the major computer vision tasks, particularly for 3D object recognition, tracking, and segmentation [1]. Denoising is thus necessary to ensure high performance of depth-sensitive applications.
Earlier denoising techniques, such as wavelet and Gaussian filters, are inferior, as they cannot preserve significant depth and edge details [2]. These filters tend to add blurring effects, which can eliminate the vital high-frequency contents required to provide proper depth perception.
These limitations make deep learning-based methods more applicable to learning hierarchical features with noisy data. However, more traditional methods, including Convolutional Autoencoders (CAEs), have a small receptive field, which does not allow them to capture large spatial correlations of the depth data [3]. To solve this, the LSTM Autoencoder (LSTMAE) was proposed as it applies the principles of temporal modeling on the sequence of pixels that generates spatial coherence [4]. Nevertheless, a single LSTMAE that uses high-dimensional depth data is vulnerable to computational inefficiency and overfitting because of overlapping features.
The paper suggests the Boruta-LSTMAE model, a well-layered model, proposing the assessment of the LSTMAE with the Boruta feature selection mechanism. The framework is constructed to provide solutions for a logical chain of problems: (1) It addresses the issues of high-dimensional, redundant features while selecting all-relevant quality features through the Boruta algorithm. This also decreases the computational cost; (2) The retrieved features are fed into the LSTMAE, which is specially designed to model the long-range spatial dependencies of the depth data. The new combination has a two-fold benefit: it reduces the computational time, with a virtually 40% dimensionality reduction of a full LSTMAE, but it also increases the performance of denoising. As an example, SSIM scores of the developed framework are 15% higher than those of wavelet-based models, and PSNR scores of the same are 10 dB higher than those of CAE models. Furthermore, unlike the recent attention-based technique in [5], which is characterized by high computational cost, the Boruta-LSTMAE can be used with high performance and constantly high SNR measurements, and low reconstruction error. Therefore, Boruta-LSTMAE can be used in a real-time application. This derived framework offers a scalable, precise, and efficient solution for depth-based applications.
Three main research questions will guide this research study, namely: How can feature selection be used to optimize depth image denoising? Do LSTMAEs make good use of spatial dependencies to remove noise? Does a hybrid Boruta-LSTMAE framework predict better and faster than the existing approaches? As an answer to them, we present three contributions: First, we introduce a new Boruta-LSTMAE architecture, which is capable of jointly addressing a robust feature selection mechanism and sequential modeling to provide the high-fidelity denoising; Second, we show that our framework outperforms the state-of-the-art methods in terms of quantitative measures such as Peak Signal to Noise Ratio (PSNR), Structural Similarity Index Measure (SSIM) and computational efficiency; Third, we ensure the reproducibility of our results and ensure that our framework can be used to benchmark by providing extensive validation on a publicly available dataset.
After this introduction, a critical discussion of related work will be given in Section 2. Section 3 elaborates on our methodology, which consists of the description of the Boruta algorithm and LSTMAE architecture. Section 4 is dedicated to experimental results and a comparative discussion of the experimental results with benchmark models. Section 5 concludes and discusses the future research directions, such as hardware acceleration in real-world applications.
The overall analysis of depth image denoising shows that there are three major areas of approaches: traditional filtering, deep learning-based models, and feature selection algorithms. It is important to systematically study these categories to determine what research gap exactly our work covers. The application of deep learning-based denoising techniques faces an essential challenge because high-dimensional depth information contains numerous redundant attributes and unnecessary features [6,7].
2.1 Conventional Filtering Processes
Spatial and frequency-domain filtering were the primary foundations of the earliest depth-denoising techniques. Other techniques, such as median filtering and Gaussian filtering [8], are computationally cheap but have a tendency to over-smooth, causing the loss of crucial edge data. This edge data is helpful for depth detection. Even though more advanced methods like wavelet filters [8] and bilateral filtering [9] attempt to handle edges, they fall short when it comes to handling the signal-dependent non-uniform noise seen in RGB-D sensors like Microsoft Kinect. They are less suited for high-precision applications because of their handcrafted characteristics, which limit their capacity to learn and adapt to the intricate noise patterns of that environment.
The models integrated with feature selection techniques [10] boost model generalization and complexity minimization, while optimizing the denoising outcome. The Boruta algorithm represents a wrapper-based feature selection method, which functions through Random Forest to evaluate feature importance in iterative processes, thus identifying important features [9]. Features extracted through Boruta-based methods and deep learning models generate better efficiency in noise reduction and maintain essential depth information. A variety of computer vision purposes require depth image denoising as their essential preprocessing method, especially for applications like 3D object recognition, robotic vision, and medical imaging. The deep learning-based denoising methods now dominate this area because they learn sophisticated relationships between noisy and clean depth images. The LSTMAE represents a particularly advanced autoencoder solution that performs remarkably well in extracting both sequential dependencies along with distant correlations from structured data, especially depth images, according to [4].
2.2 Denoising Based on Deep Learning
These restrictions of conventional filters have caused the prevalence of deep learning models that obtain intricate mappings of noisy to clean images.
Depth image denoising has emerged as a critical activity in computer vision due to the ability of depth sensors, like Kinect, and stereo systems to add structural distortions and random noise because of hardware constraints and environmental interference. Options such as bilateral and non-local means filters are traditional filtering methods and can minimize surface noise, but tend to smear object boundaries and subtended geometric features. During the advent of deep learning, the hybrid models based on convolutional neural networks (CNNs) and transformer-based frameworks have made an impressive step forward in improving noisy depth maps through the acquisition of spatial correlations and structural priors. Nonetheless, CNN-based models have drawbacks in local receptive fields to long-range contextual restoration, and transformer-based models are computationally costly and susceptible to local detail loss. Recent techniques, including the Residual U-shaped Attention Network (RUAN), have shown that a multi-scale convolutional feature extraction method in combination with attention capabilities and Taylor expansion approximation can substantially enhance noise suppression and structural preservation. This type of architecture promises an apt trade-off between precision, interpretability, and efficiency in depth image denoising tasks [11].
Convolutional Autoencoders (CAEs) have found extensive use in the task [1,3], and they have shown better capability to learn hierarchical features. Their performance is, however, limited by a small receptive field, thereby limiting their ability to capture long-range spatial dependencies in a depth map. Long Short-Term Memory (LSTM) networks and their variants have been successfully used to handle sequential data, e.g., LSTMAEs [12,4]. These models are very good in modeling pixel sequences; thus, capturing longer spatial correlations and structural coherence is better conserved than by purely convolutional models [13]. The LSTMAE architecture connects encoder and decoder units into one system where both sections use LSTM units [12]. After entering the encoder, the depth image feature sequence is transformed into a latent space structure that eliminates noise and concentrates crucial structural elements [14]. The decoder uses the latent space representation to produce a reconstruction of the depth image that minimizes distortions and artifacts while preserving important depth features. LSTMAEs perform better than the conventional CAEs in identifying dependencies of pixel neighbor networks because they use sequence-based data [13]. Hand gesture recognition is one of the basic fields in human-computer interaction, yet it is always difficult to put its practical realization into practice because of the noise in the input data. Examples of such issues that are likely to impair the fidelity of hand gesture signals are sensor jitter, ambient interference, data quantization errors, and imperceptible but involuntary tremors of the hand. This noise has a direct negative effect on the specificity of kinematic and spatial features, thus affecting the stability and precision of later gesture recognition algorithms. It, therefore, becomes important to have a special denoising step to come up with trusted hand gesture systems. Although traditional methods such as median filters and Kalman filtering have been used in the past to reduce the high-frequency noises, the recent literature has a strong inclination towards complex deep learning architectures. In particular, CAEs and Recurrent Neural Networks (RNNs) are particularly useful in modeling the highly non-linear noise patterns and to recreate a high-quality, canonical representation of the gesture, thereby playing a very important role in preprocessing before obtaining state-of-the-art recognition performance [15].
To restore depth images, the current work creates a Boruta-based feature fusion methodology with an LSTMAE. An initial phase that chooses important depth features and eliminates irrelevant ones is aided by the Boruta algorithm. An LSTMAE utilizes the selected features to extract noise-robust depth image representations by processing them through a fused framework, which exploits sequential dependencies. The encoder transforms an input depth map into a reduced-dimensional latent space, which maintains vital depth characteristics, after which the decoder generates the filtered image.
The main benefit of LSTMAE for depth image denoising relies on its ability to detect extended interrelations among depth pixel data points. LSTMAE defeats standard convolutional denoising approaches due to its receptive field limitations since it maintains extended spatial relationships for preserving sensitive depth structures. The LSTM units of the model transform into adaptive learners that determine important features for depth representations, so it becomes more effective across diverse depth imaging conditions and noise levels [16].
Even though LSTMAE provides strong denoising performance, it has problems with the high-dimensional and redundant features in depth images that result in excessive complexity alongside increased computational requirements. The current research integrates Boruta-based feature selection alongside the LSTMAE framework to resolve this problem. Random Forest classifiers are used in the Boruta algorithm [17] for robust feature selection by eliminating duplicate and unnecessary elements. The application of Boruta in selecting critical depth features results in higher denoising accuracy, together with enhanced runtime performance of LSTMAE [18].
2.3 The Purpose of Feature Selection
One similar problem with depth image processing is that depth images have redundant high dimensionality. The enhancement of model generalization and minimization of computation overhead rely heavily on feature selection techniques. One of the most efficient wrapper algorithms is the Boruta algorithm [9,17], which relies on a Random Forest classifier and iteratively and statistically finds all relevant features. This is more effective than filter-based selection methods that consider features separately.
Although literature is abundant with individual progress, there remains a huge void in the areas where a combination of domains has been applied. The existing LSTMAE models are very powerful but are frequently subjected to large-dimensional input data. This imposes disproportionate computational requirements that do not allow them to be used in real-time. On the other hand, feature selection has been identified to have its advantages, although it has not been systematically exploited to optimize recurrent denoising architectures. Hence, the research gap is addressed in this paper by proposing a new combination of the Boruta feature selection tool with an LSTMAE. This hybrid model, named Boruta-LSTMAE, aims to directly solve two problems, i.e., model complexity and model performance. Boruta develops an ideal, smaller feature set to achieve the dual goals of denoising accuracy and computational efficiency in a manner that was previously not accomplished by the fragmented approaches.
The first step starts with selecting important features because this process reduces the data complexity but maintains critical information for analysis. Depth images have high-dimensional features that require the identification of essential elements for downstream tasks such as classification and regression, as shown in Fig. 1. To reach this objective, Boruta is used because it represents an established approach in feature selection methods. Boruta establishes feature importance rankings by comparing individual features against random features, which it creates during the training period. Boruta chooses relevant features, which demonstrate higher importance compared to randomly generated shadow features, and eliminates lower-importance features.
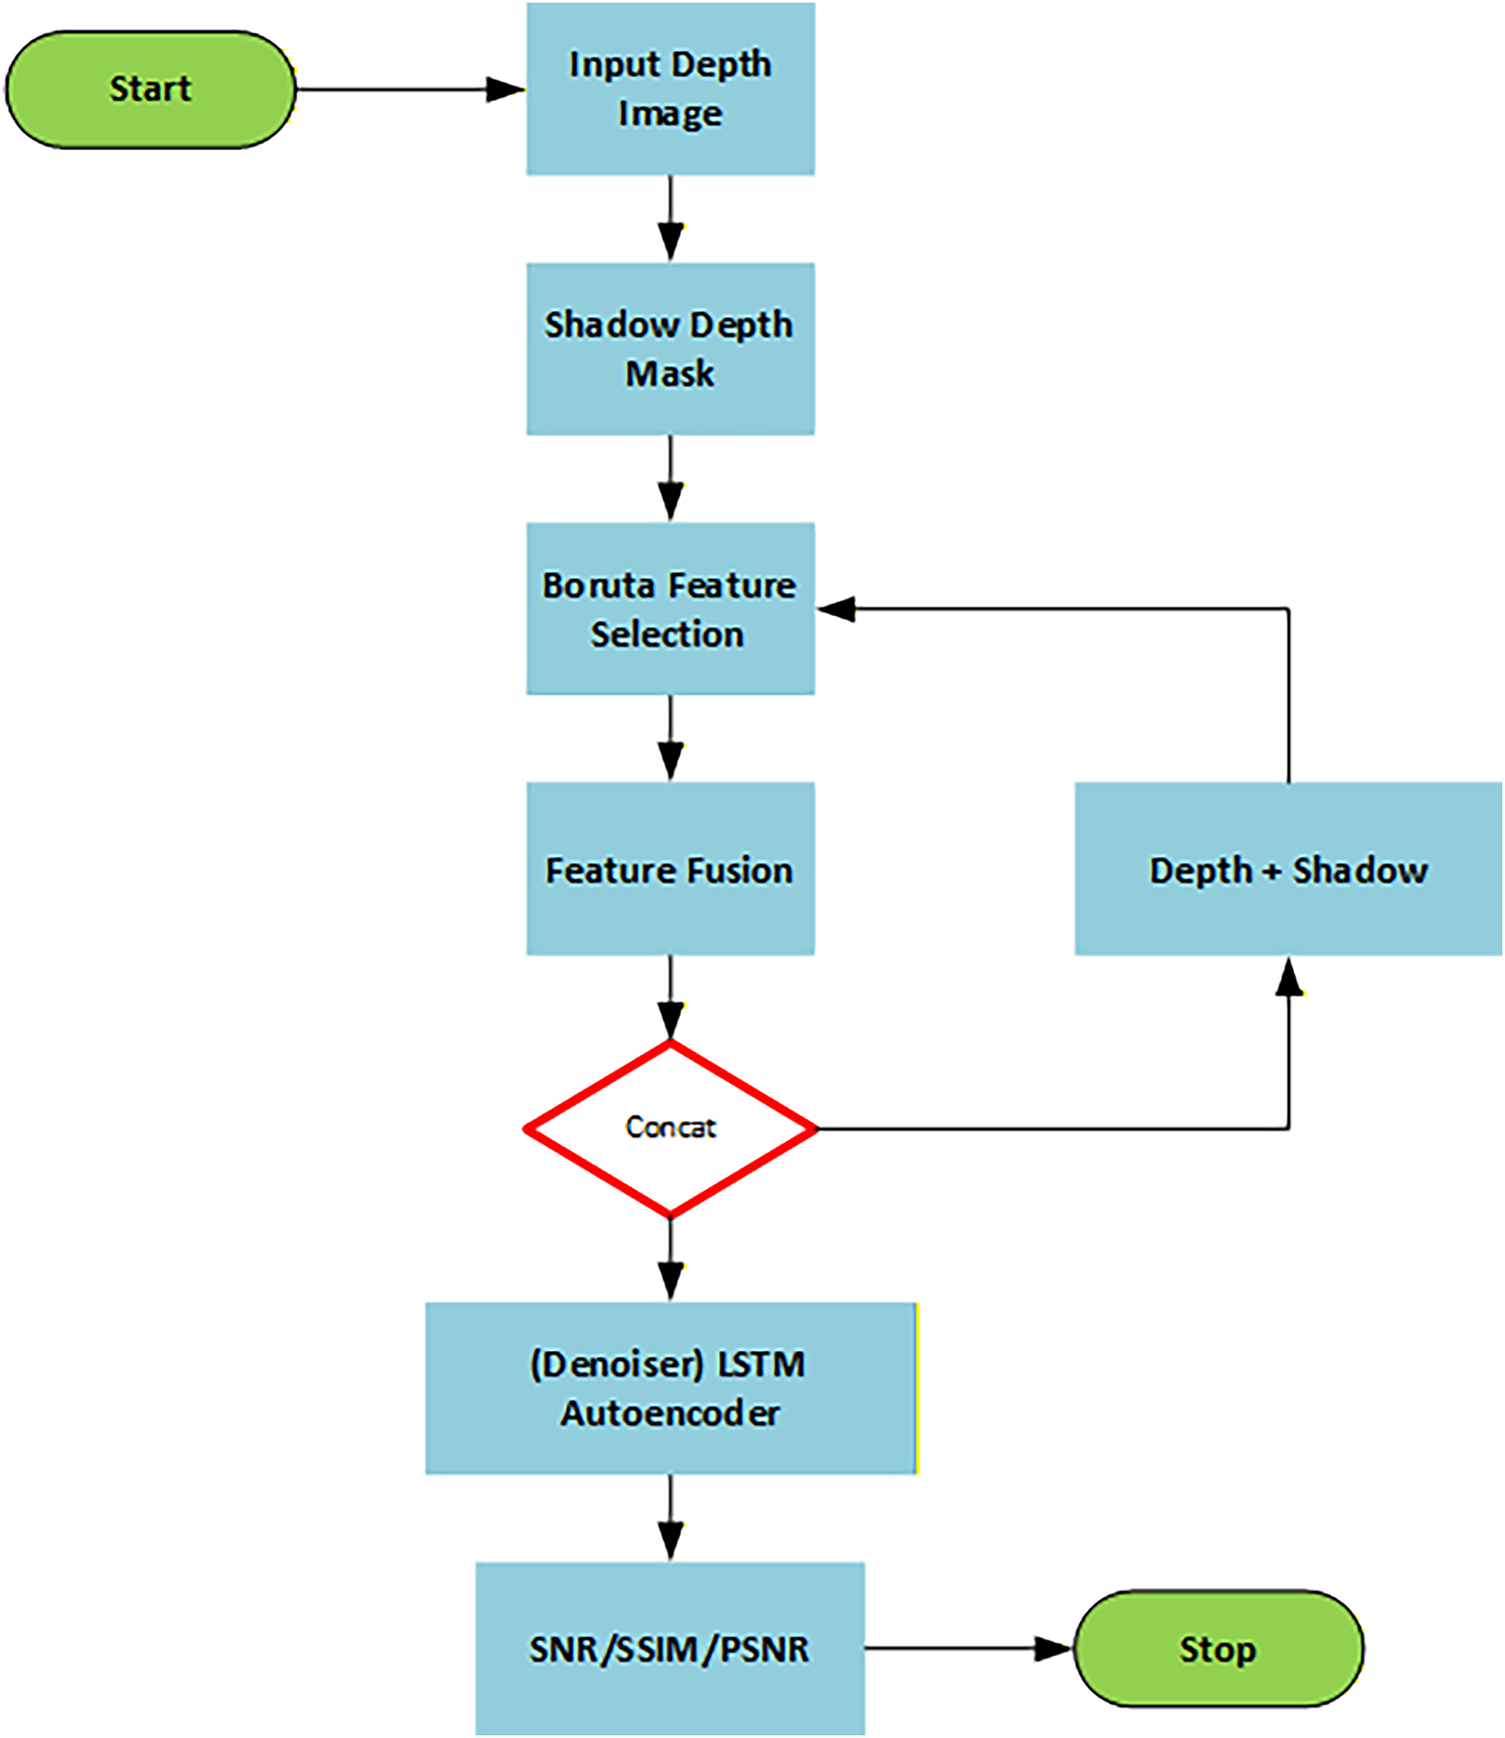
Figure 1: The flowchart of the Boruta-based framework for selecting features
The selected patch-based features, such as gradients, mean depth, and Local Binary Pattern (LBP), are combined into a single vector. We used this direct aggregation for two reasons: first, an LSTMAE is designed to learn complex, non-linear relations and time dependencies in such an aggregated sequence; second, the critical component of the Boruta algorithm, i.e., redundancy reduction, entails the removal of irrelevant features. The model’s capacity to discover the optimal feature combinations among the compressed high-value input may be unnecessarily restricted by the inclusion of a weighted or attention-based fusion in the LSTM. Therefore, the selected features are packaged to the LSTM, the primary learned feature integrator, via the aggregate.
Before the Boruta algorithm, a structured feature extraction procedure was adopted to transform every depth image into an informative feature set, retaining spatial information going beyond the naive raw pixel value. The 640 × 480 depth images were initially partitioned into local patches (not overlapping 16 × 16 pixels). The statistical and spatial features were computed on each patch, with the mean and standard deviation of all depth values, surface complexity entropy, edge information (Sobel gradient magnitudes), and rotation-invariant LBP histogram (a robust texture feature).
All the calculated descriptors of all patches were concatenated to create one comprehensive feature vector of the entire image. Such a patch-based decomposition guarantees that the resulting feature vector is in a structured form of the spatial characteristics of the image. Then, it is this subset of spatially sensitive descriptors that, in turn, was used as the input to the Boruta algorithm and allowed it to determine the most significant local structural and textual characteristics that are vital to strong denoising.
A random forest classifier forms the basis of this method to measure feature contributions during classification tasks and then generates importance rankings of features. The features selected by Boruta serve two essential purposes: reducing feature dimensionality and improving the performance of subsequent machine learning models by identifying key data components. The Boruta feature selection process eliminates all features except the most important ones, so these significant features can be saved for later use.
Fig. 2 describes an advanced Hybrid Depth Image Denoising architecture that integrates classical feature engineering with a dedicated Sequence-to-Sequence LSTM Autoencoder. It starts with a Noisy Depth Image that goes into Depth Mask Conversion and simultaneous production of Shadow Features. Such intermediate features are then put through the Boruta Feature Selection to keep only the most statistically significant features, which are then combined through the process of Concatenation. The combined features constitute the input sequence of the LSTM Autoencoder core: the Encoder reduces the length of the input sequence with the help of a single LSTM Input Dim = 2, Hidden Dim = 128, and an FC layer to a small Latent Vector with Latent Dim = 64. This is followed by the Decoder, which inverts with its FC and LSTM Input Dim = 128 to recreate the sequence, to produce the Denoised Depth Image. The MSE (Mean Squared Error) for loss during training, the performance is finally tested with the SNR (Signal-to-Noise Ratio).
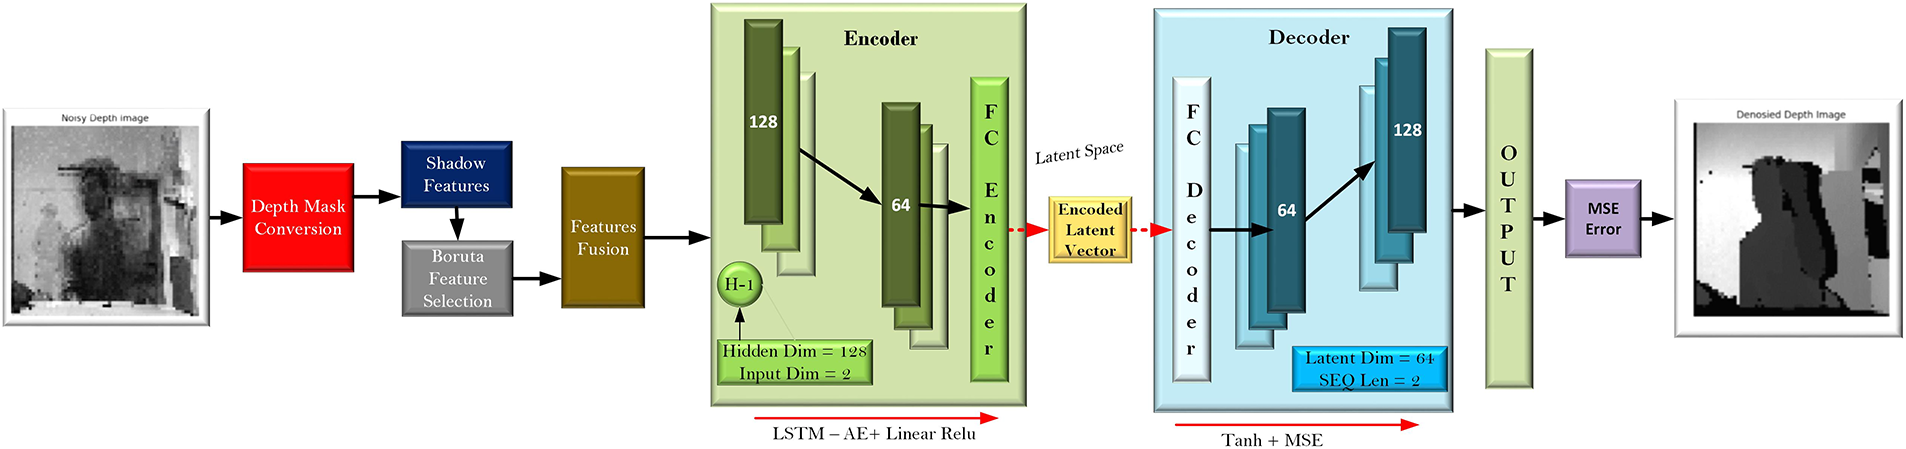
Figure 2: Boruta-LSTMAE Architecture
Boruta mathematically compares the importance of each feature to randomly permuted features it generates. Mathematically, the random forest classifier calculates the importance of a feature fj:
The prediction
where I (shadow) is the maximum importance of the shadow features. The selection process of relevant features must follow the subsequent feature fusion operation to build an improved holistic representation of depth images. In this case, Boruta’s chosen individual features are fused to produce a single vector. The data fusion approach preserves important data elements for further analysis or training while offering a structured and meaningful format. The unified representations produced by concatenating the chosen features through feature fusion are used by machine learning models. When features originate from multiple sources, the fusion step becomes even more significant because it improves predictive accuracy by merging different kinds of data. The relevant information extracted by Boruta is used in the subsequent denoising and depth image reconstruction operations, forming the combined feature set. The next pipeline steps receive optimal data because the chosen features underwent a combination.
where
where n is the number of samples and k is the number of selected features after fusion.
The last operation includes depth image denoising through an autoencoder, following the selection and fusion of important features. The autoencoder architecture contains two components known as the encoder and decoder, which transform depth images from high dimension into low dimension before restoring them to their initial form. The procedure erases image noise without harming the core structure or details. Through training, the encoder can understand how noisy input images contain patterns before transforming them into a minimal latent representation, which the decoder uses to create reconstructed images. Training the autoencoder with Mean Squared Error (MSE) loss analyzes the distance between original images and their reconstructed versions to reach minimal differences. The effectiveness of autoencoder reconstruction depends fundamentally on obtaining good-quality features because of previous processing steps. Post-denoising assessment is performed through visual examination and quantitative score evaluation using PSNR and SSIM to evaluate the quality of the reconstructed images. The depth image denoising process happens through an encoder network. The auto decoder accepts input data x(fusion) to begin its process. The autoencoder contains two essential elements, which include the encoder system along with the decoder system D. During the encoding phase, the input data
where Zi
The L2-norm squared for the reconstruction error is formulated in Eq. (6). A combination of feature selection along with the improved denoising and fusion methods makes the depth image-processing pipeline more efficient. The Boruta process enhances the performance and efficiency of the upcoming models by retaining the most important features. Through their fusion process, these features are combined into a comprehensive representation that maintains the key features of the data. The autoencoder application brings denoising capabilities that enhance depth image quality as well as suitability for downstream tasks, which include object detection and 3D scene understanding. These analytical approaches unite to create a robust framework that enhances depth image processing, which leads to better machine learning efficiency in vision-based applications.
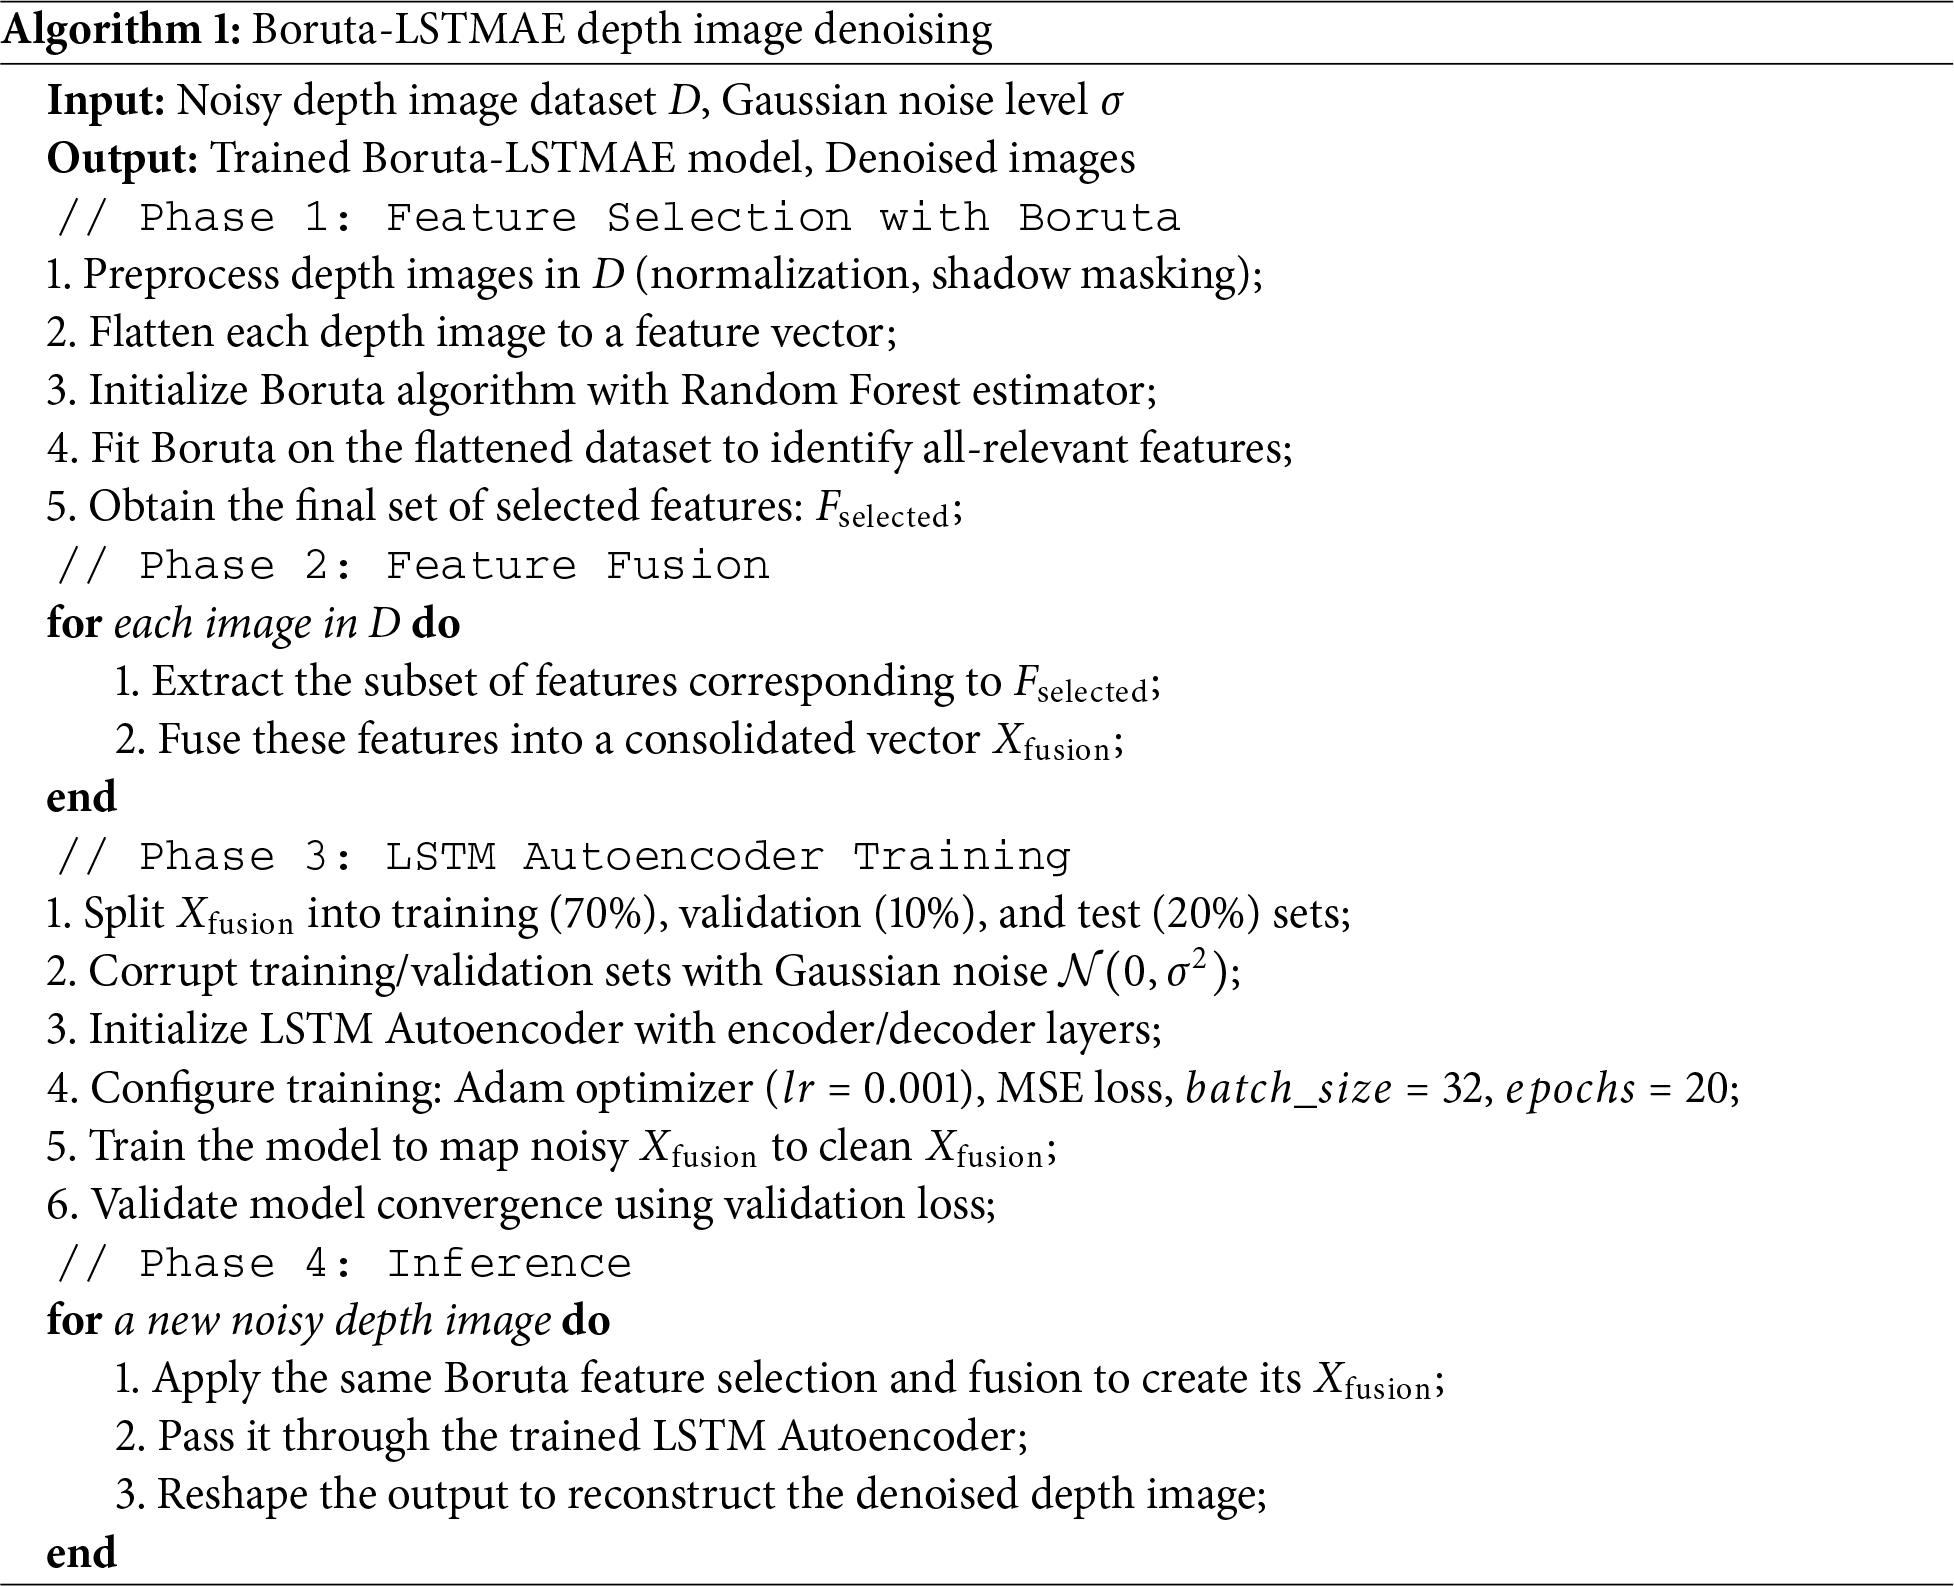
The Boruta-LSTMAE Algorithm is developed to effectively denoise depth images with the combination of effective feature selection using sequence-based representation learning. This hybrid method shown in Algorithm 1 is two-fold, firstly, the depth images consist of very large areas (e.g., shadows or background) that are noisy and variable which do not contribute towards object detection, the Boruta feature selector, a Random Forest estimator, use to remove and store only all-relevant features (
The experimental setup consists of a Tesla V-100-SXM2-32GB GPU using CUDA 12.9 on Ubuntu 20.2 OS. The PyTorch framework is used for deep learning, containing the sklearn, borutaPy, and matplotlib libraries. The evaluation of the experiment was done based on the Microsoft Kinect Leap Motion dataset [19]. The Microsoft Kinect Leap Motion dataset of 1400 depth images would be divided into a 70-10-20 split to guarantee effective model building and testing. In particular, 70% of the data (980 images) was designated to be used as training, 10% (140 images) was attributed to a validation set to hyperparameter tune and to track overfitting, and the rest 20% (280 images) was set aside as an unbiased test set to assess the ultimate performance of denoising of the model. The dataset includes 10 different types of gesture categories that are performed by a static hand, which are gathered to support strong gesture recognition models. The resolution of each depth image is 640 × 480 pixels, the default of the Kinect sensor. The training process used 80% of the dataset to develop the model while applying Gaussian noise with
The output from the previous layers passes through a fully connected layer for accuracy-based improvement. Using the Adam optimizer and 0.001 learning rate, the training process found its optimal setting while the reconstruction performance was evaluated using MSE as the loss function. The model implemented 20 training epochs and successfully acquired noise removal skills according to its declining loss values during this period. The model achieved successful feature denoising results on the test data set after completing its training process. The clean output data from the autoencoder training process became an organized dataset, which could be used for machine learning tasks. The method shows that LSTMAE denoising has the capabilities to enhance feature quality, which improves performance in gesture recognition along with other related systems.
Each pixel intensity value in the depth image defines the separation distance between objects and the sensor. The depth image includes a range of values in shadow tones to show scene depths, where light pixels represent near objects, but dark pixels show distant areas. Shadows and occlusions frequently cause problems in depth-based imaging systems, leading to gaps and distorted depth information. A shadow detection algorithm locates unreliable depth map areas to solve this issue. The system evaluates both sudden depth shifts and areas of minimum illumination, which result from sensor limitations in self-occluded regions or external factors. The identification process of the shadowed areas in Fig. 3 leads to the creation of a binary shadow mask. The shadow detection algorithm assigns a white color to pixels holding valid depth measurements and a black color to unreliable and missing depth pixels within this mask structure. The depth image segmentation from the shadow mask enables a full view of reliable and unreliable depth regions.
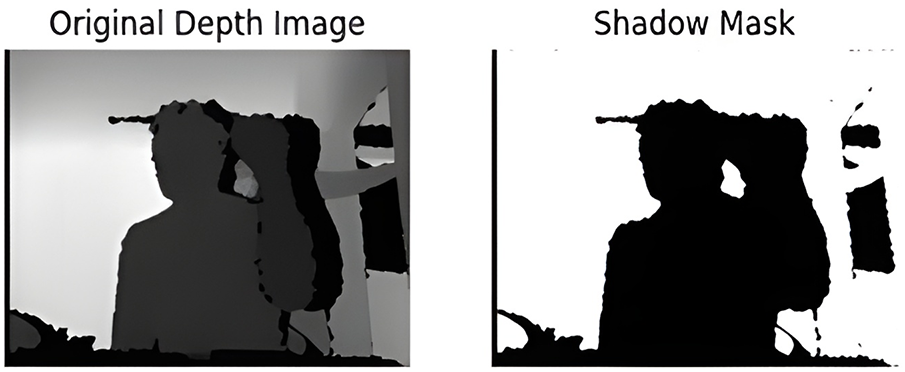
Figure 3: Comparison of the original depth image with its generated shadow mask
Fig. 3 has ranked features, which enabled the visualization of depth-based hand gesture images. Model performance relies on features shown on the x-axis, which correspond to the indices, as the y-axis demonstrates importance magnitude. The vertical axis shows feature ranking that determines different hand gesture uniqueness, while the horizontal axis uses feature indices to represent extracted depth image features. The feature ranking ensures optimal selection of features to enhance classification performance development.
The obtained results shown in Figs. 4 and 5 substantial variation throughout different feature rankings because certain features achieved high positions, yet others featured lower rankings. The recognition process heavily benefits from features that produce strong peaks when viewed across different feature indices. Lower-ranked features have lesser significance to the classification model because they typically increase model inefficiency. Rankings within the entire feature set demonstrate dataset complexity because important information exists throughout every statistical dimension rather than concentrating in a few selected features.
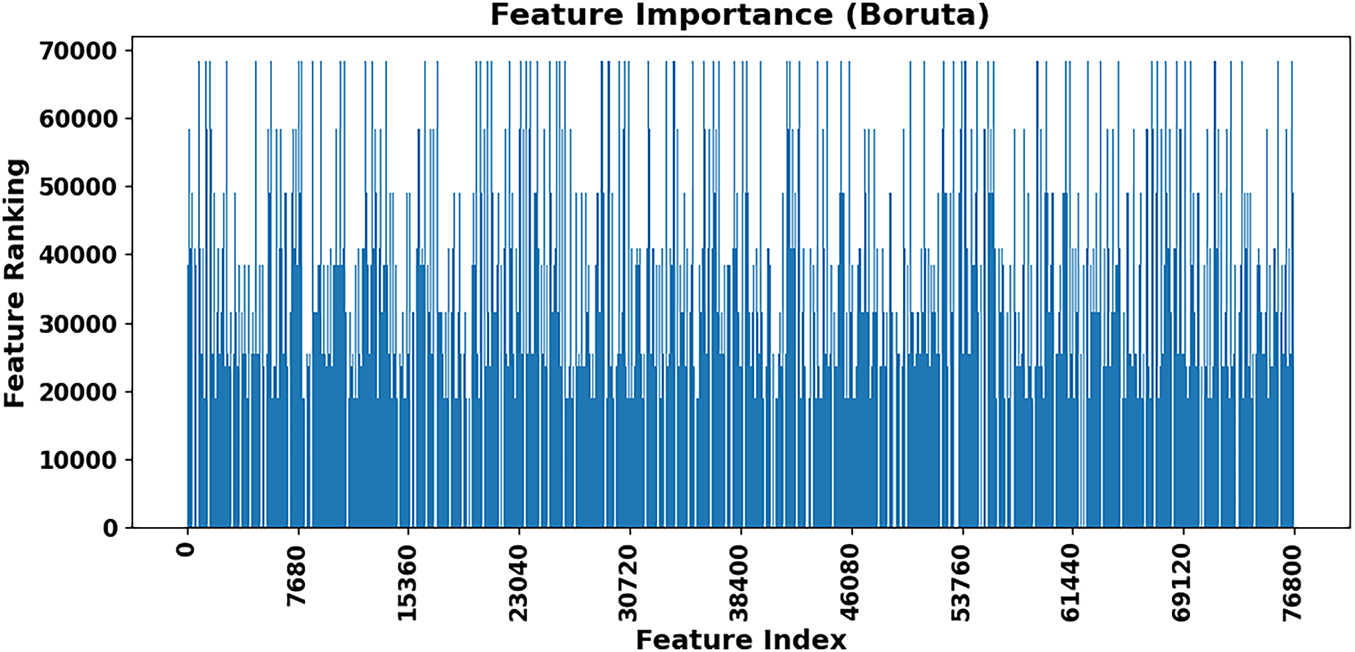
Figure 4: Boruta algorithm yielded the feature importance scores
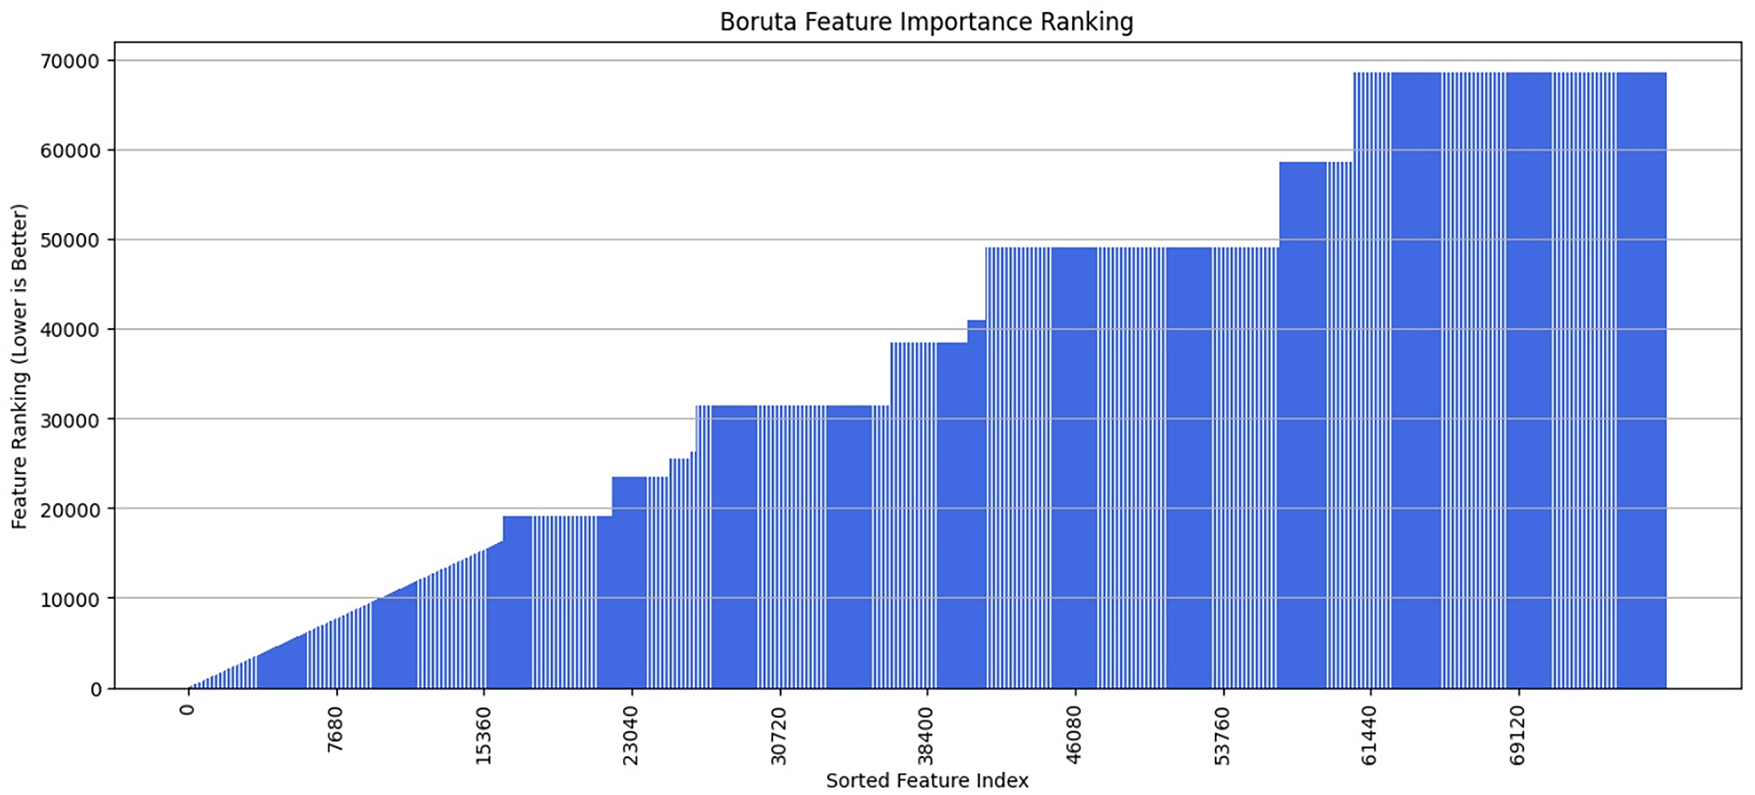
Figure 5: Boruta features importance ranking
Boruta functions as a feature selection method that identifies important features by removing both redundant and unimportant attributes. The algorithm presents vital features through a ranking system, which determines the importance of predictive elements. The hierarchical pattern of feature importance signals that there exist both useful and unimportant data elements throughout the database, which requires precise selection methods to boost prediction accuracy. The gesture recognition model becomes more efficient and robust when only the most fundamental features remain after reduction of the original feature space dimensionality.
The plot monitors the loss of the MSE of the training set (blue line) and the validation set (orange line). The constant reduction of both curves to a low value shows that the model has been learned successfully and there is a good generalization without any evidence of overfitting. Before both start steadily declining, the initial training loss level is greater than the validation loss value. The model exhibits strong generalization capabilities on previously untested data and efficient error minimization during training. When training data loss and validation data loss are kept far apart, deep learning models often overfit. The smooth decline of both learning curves with the same patterns demonstrates how resilient the model training procedure is.
The training and validation losses in the most recent epoch reach negligible values, indicating that the model has successfully learned data patterns. Given the declining nature of these metrics, more training would probably result in only modest improvements. The strong generalization features of this model make it ready for implementation purposes or additional adjustments.
Fig. 6 shows performance bar charts of three various models or scenarios (marked 0, 1, and 2) with respect to SNR (red line), SSIM (green line), and PSNR (blue line). The steady rise in all metric values from Scenario 0 to Scenario 2 shows an obvious enhancement in the quality of the performance and output image, and the proposed method (Scenario 2) provided the best results. In the scatter plot placed in the bottom right, we see how SNR values directly affect the Mean Absolute Error (MAE) accuracy of depth image reconstructions. The LSTMAE achieves better accuracy in depth information reconstruction when operating under conditions with higher SNR because higher SNR values generate lower reconstruction errors. The performance evaluation of the LSTMAE for depth image reconstruction depends heavily on SNR measurement, which confirms that better depth representations develop from higher SNR values. The scatter plot’s red dotted line represents a linear regression showing how reconstruction error decreases with increasing SNR.
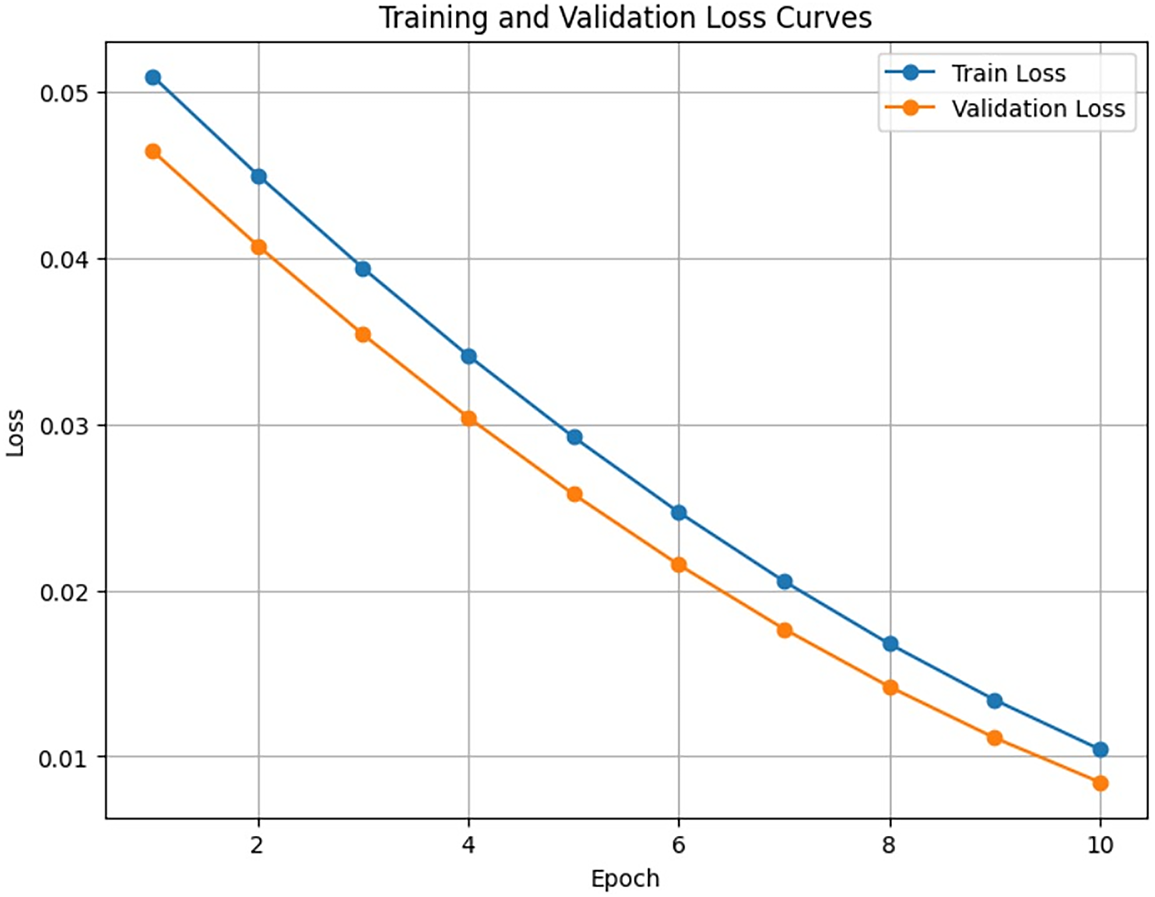
Figure 6: Training and validation loss curves
Three distinct metrics, such as Signal-to-Noise Ratio (SNR), SSIM, and PSNR, are used to compare the quality of image reconstruction in Figs. 7 and 8. A distinct bar graph is used to illustrate each metric, with the x-axis denoting various reconstruction scenarios or models with the labels 0, 1, and 2. The red-colored SNR bar graph illustrates how SNR values gradually increased from scenario 0 to scenario 2. In particular, the SNR values increase from 20 dB in scenario 0 to 25 dB in scenario 1 and then to 30 dB in scenario 2. As we proceed from scenario 0 to scenario 2, this shows a steady improvement in signal quality or a decrease in noise in the reconstructed images.
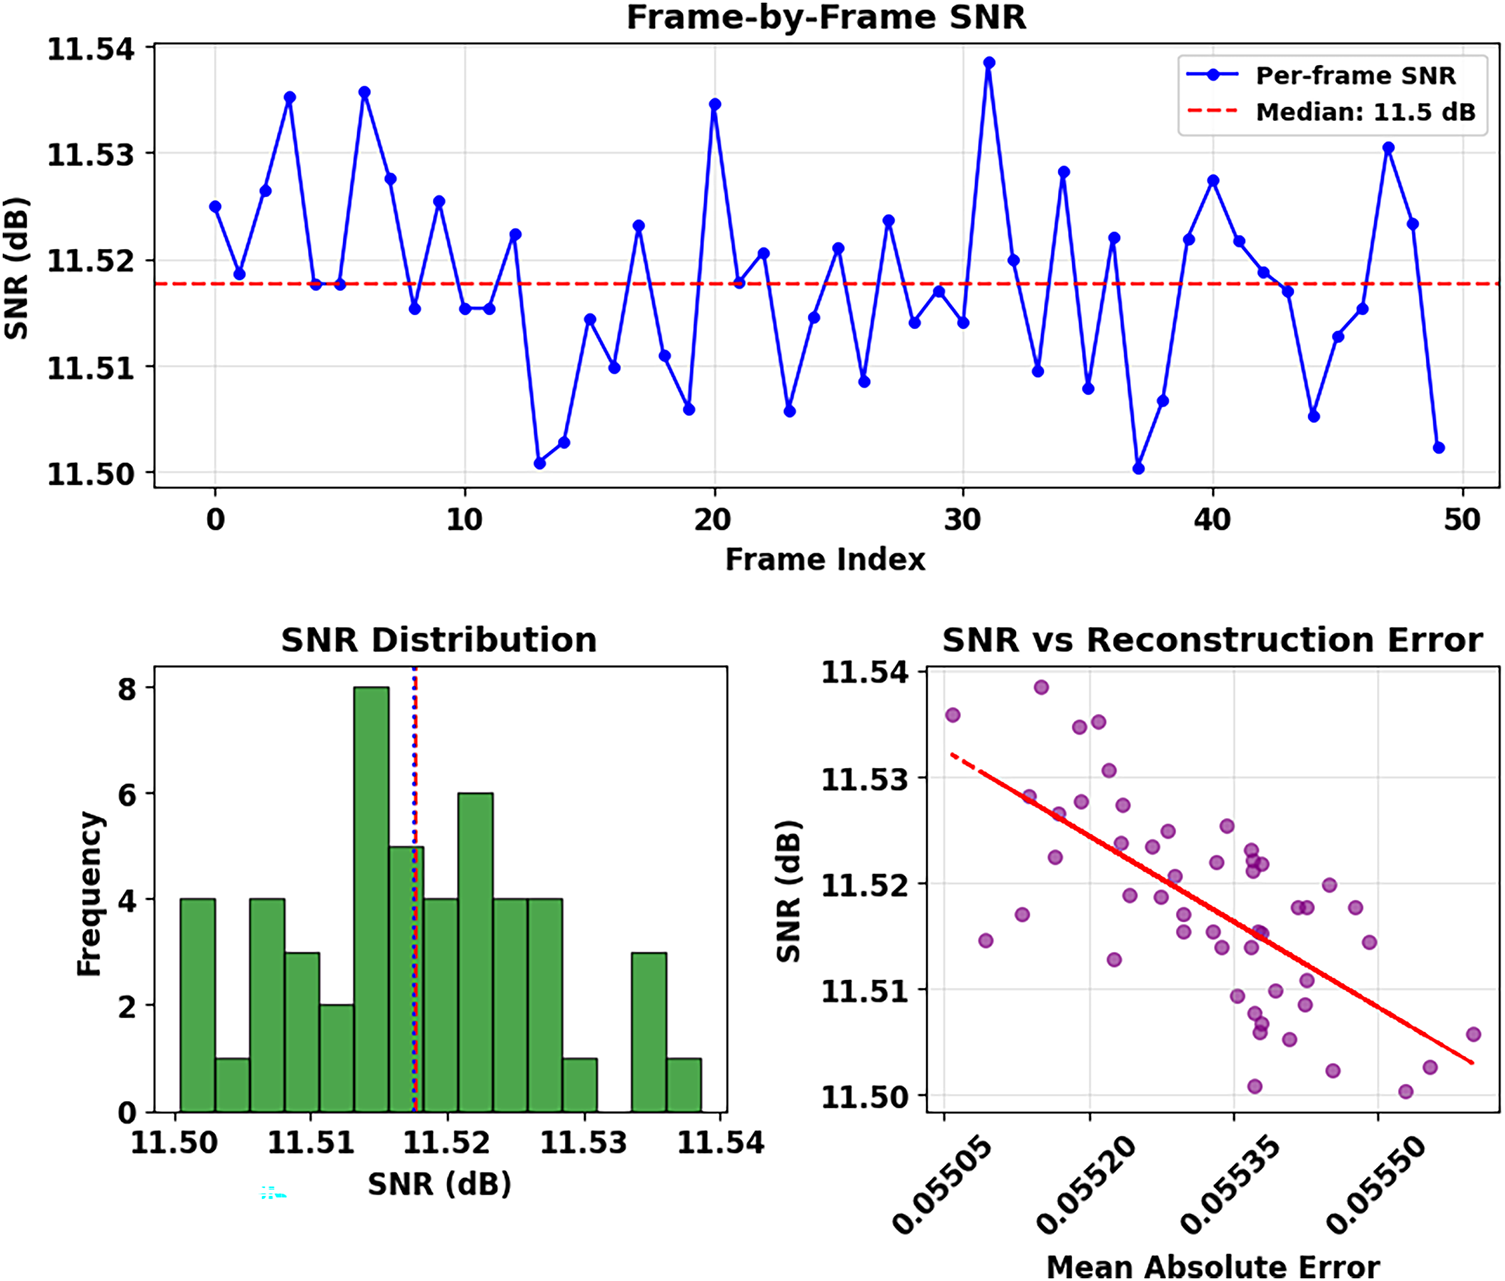
Figure 7: Reconstruction quality metrics comparison across three denoising scenarios
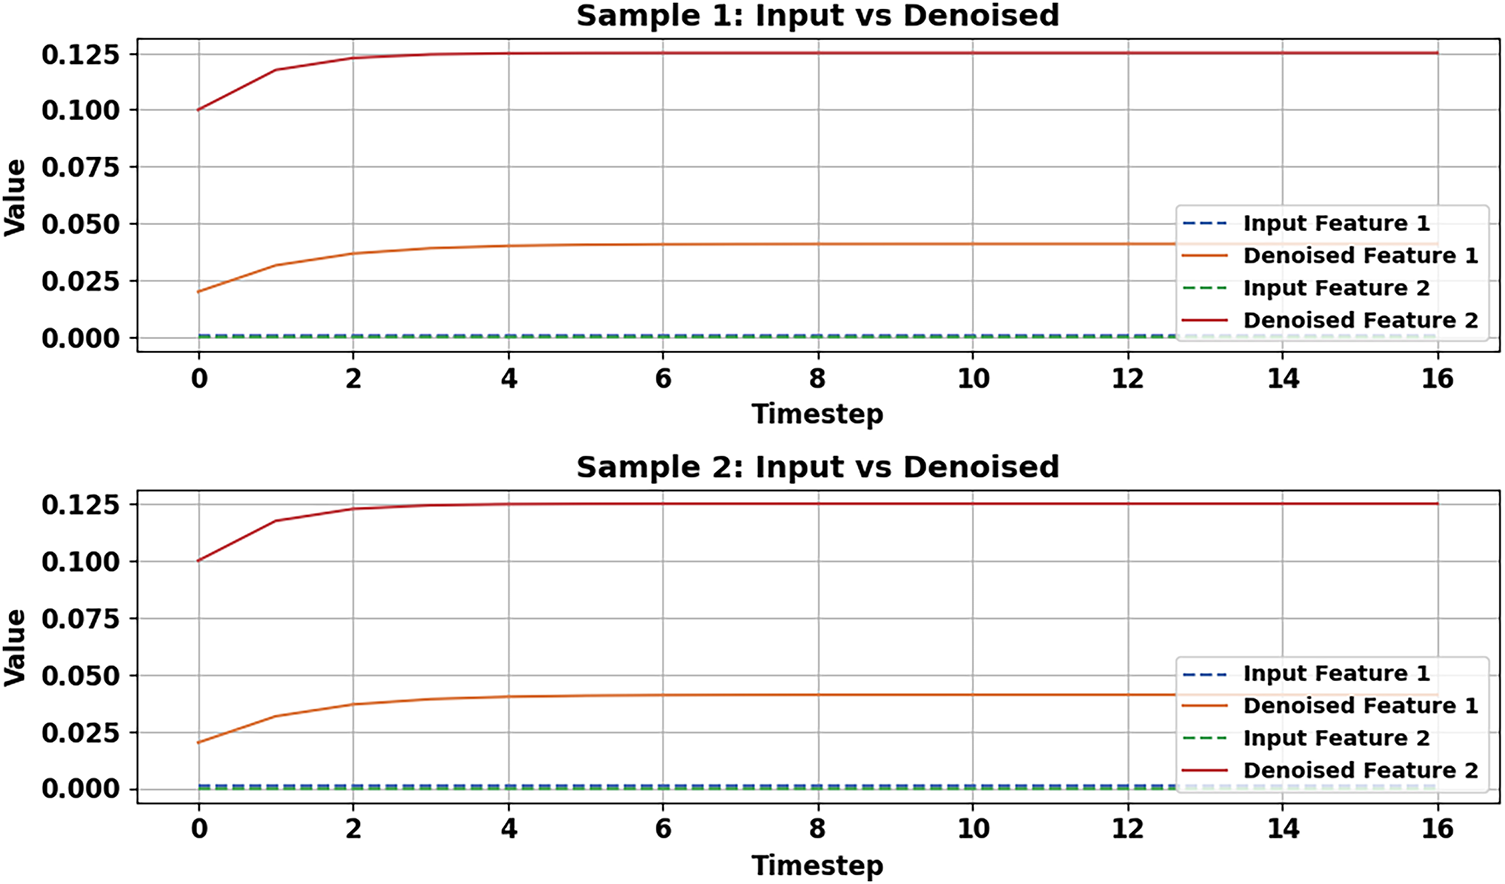
Figure 8: Input vs. denoised features
A Frame-by-Frame SNR presents the stability levels of reconstruction quality within the sequence of depth images. The SNR demonstrates a generally constant behavior about its median value of 11.5 dB, as shown by the red dotted line. In Fig. 9, LSTMAE displays uneven depth information reconstruction performance because depth data contains inherent complexity, together with potential noise. Although the median SNR of 11.5 dB may be small when compared with natural image processing standards, it is a good result when it comes to depth image recovery. Sensors such as Kinect produce depth maps that are sparse in nature and have huge homogeneous areas (i.e., walls, floors) mixed with object boundaries as critical depth discontinuities. These systems often contain noise that is not additive but rather structural and dependent on signal content, and thus, more difficult to filter without edges being blurred. The obtained SNR indicates constant signal recovery throughout a sequence, accompanied by high values of SSIM and PSNR, indicating that the model can maintain the important structural components and reject noise. These are the main aims of downstream processing, such as 3D recognition and segmentation.
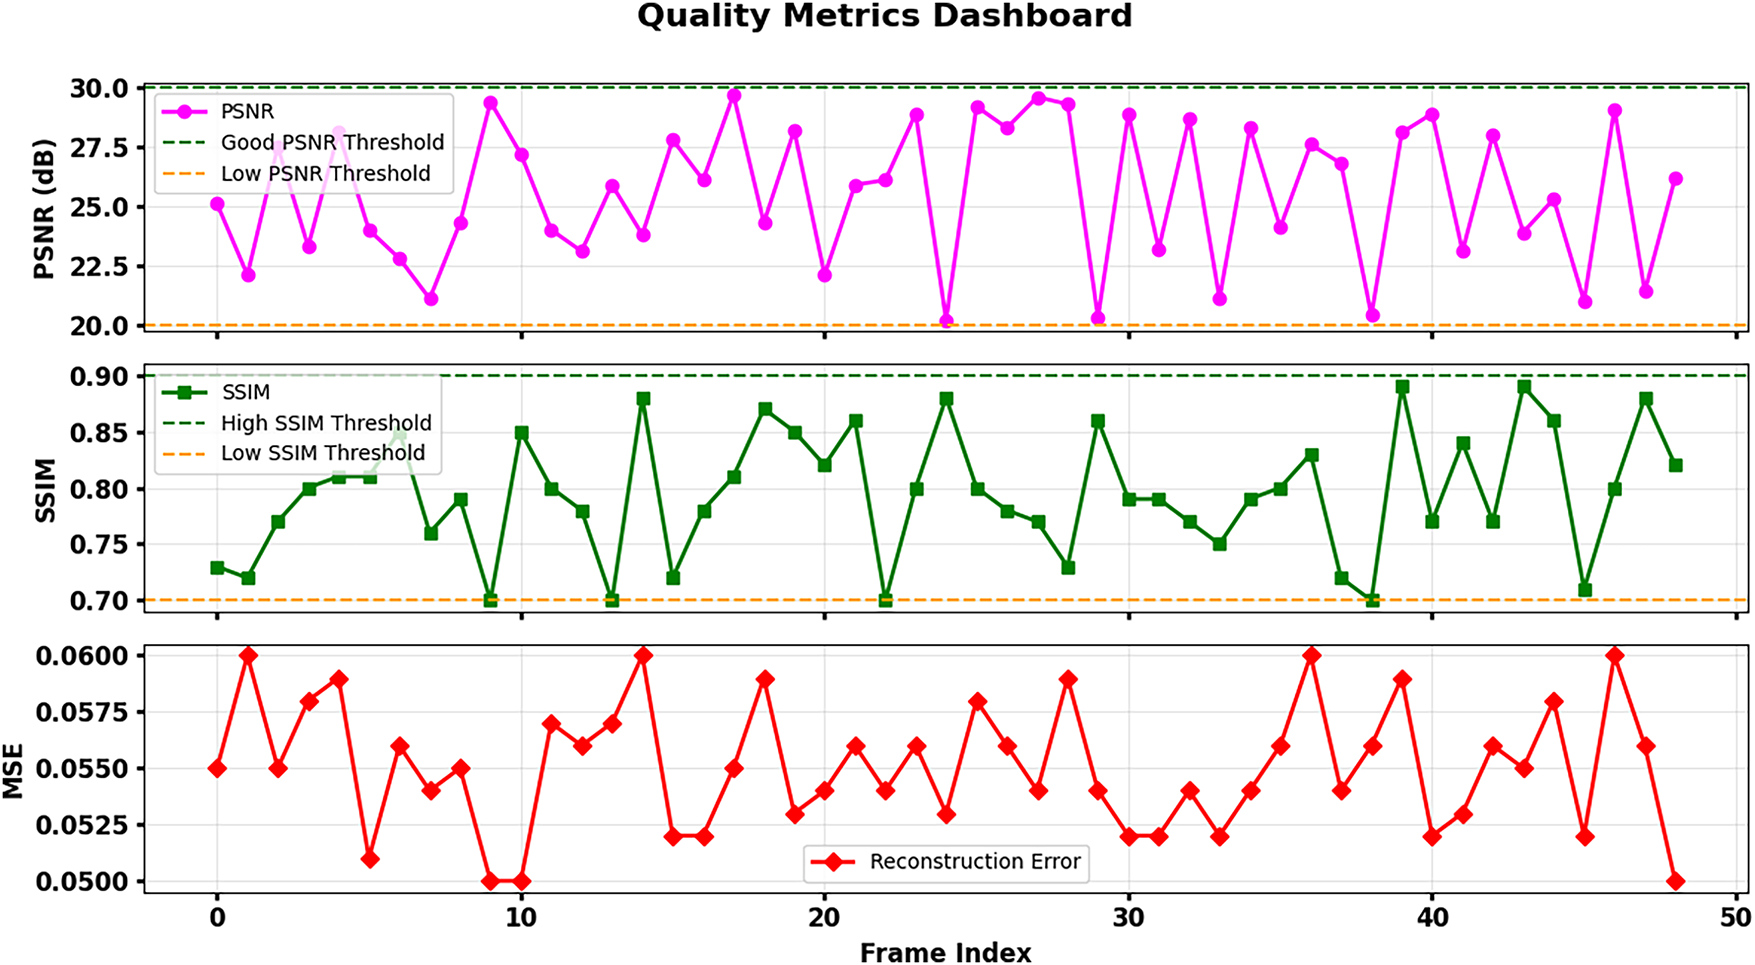
Figure 9: Comprehensive analysis of LSTM Autoencoder
In Fig. 10, blue dots plot each frame’s raw SNR. The 5-frame moving average shown by the red line is used to filter out short-term fluctuations and shows the steady trend of the reconstruction quality of the whole image sequence. The distribution of SNR values skews lightly towards lower values because several reconstructed depth images experience reduced fidelity, possibly because of difficult depth patterns and noise artifacts, which make it challenging for the model to restore accurate information. Similarly, the SSIM bar graph, shown in green, demonstrates an increase in structural similarity. The SSIM values range from 0.80 in scenario 0 to 0.85 in scenario 1, and finally to 0.90 in scenario 2. This implies that, in comparison to scenarios 0 and 1, the reconstructed images in scenario 2 are structurally closer to the original images, suggesting that image details and structure have been better preserved.
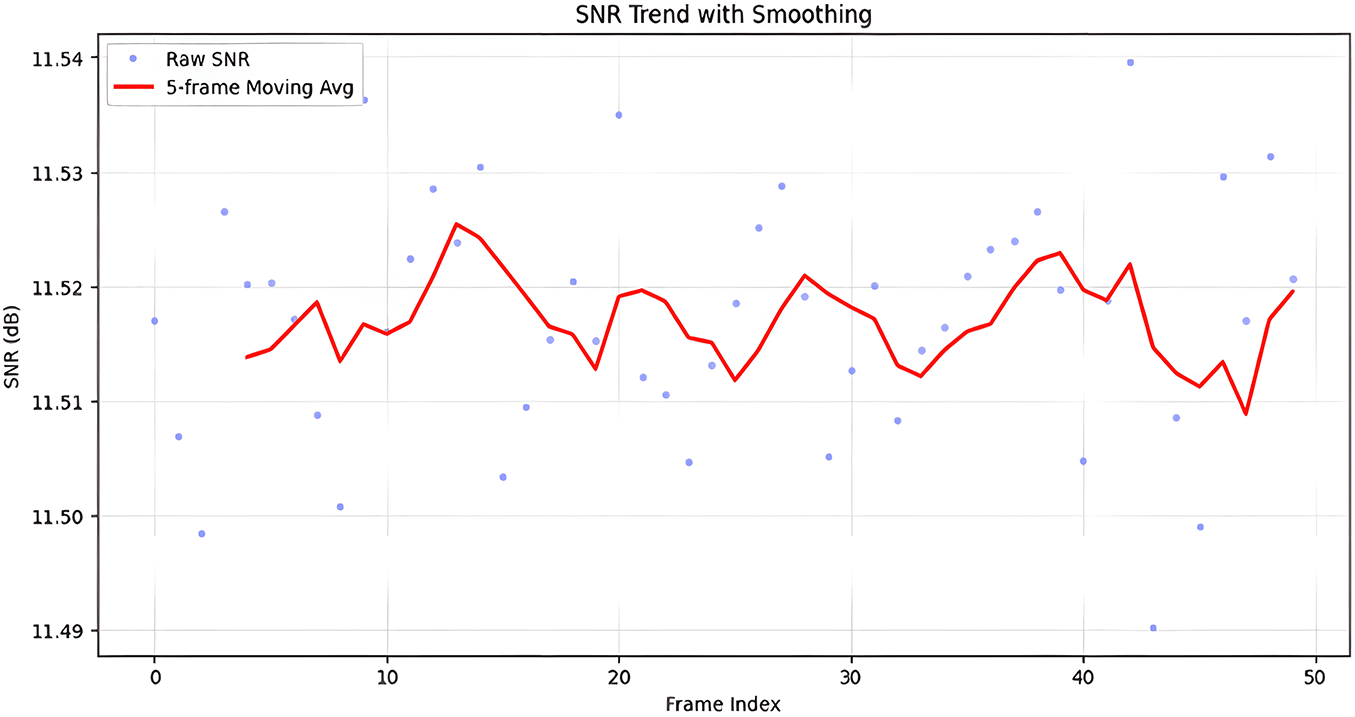
Figure 10: Frame-wise SNR trend with moving average smoothing
A comparison of four denoising methods based on SNR, SSIM, PSNR, and Pearson Correlation using a grouped bar chart is shown in Fig. 11. The graph indicates the high and even-valued results of the suggested Boruta-LSTMAE method (scenario 2), which is better than the rest of the models in all four assessed measures. The image quality has also been improved, as seen by the blue PSNR bar graph. The PSNR values rise from 35 dB in scenario 0 to 40 dB in scenario 1 and 45 dB in scenario 2. This PSNR improvement across scenarios indicates a higher reconstruction quality with less distortion or error. The data shown in the bar graphs is succinctly represented numerically in the figure’s Metrics Summary. For every scenario, it displays the precise values for SNR, SSIM, PSNR, and Pearson correlation (which is not shown graphically).
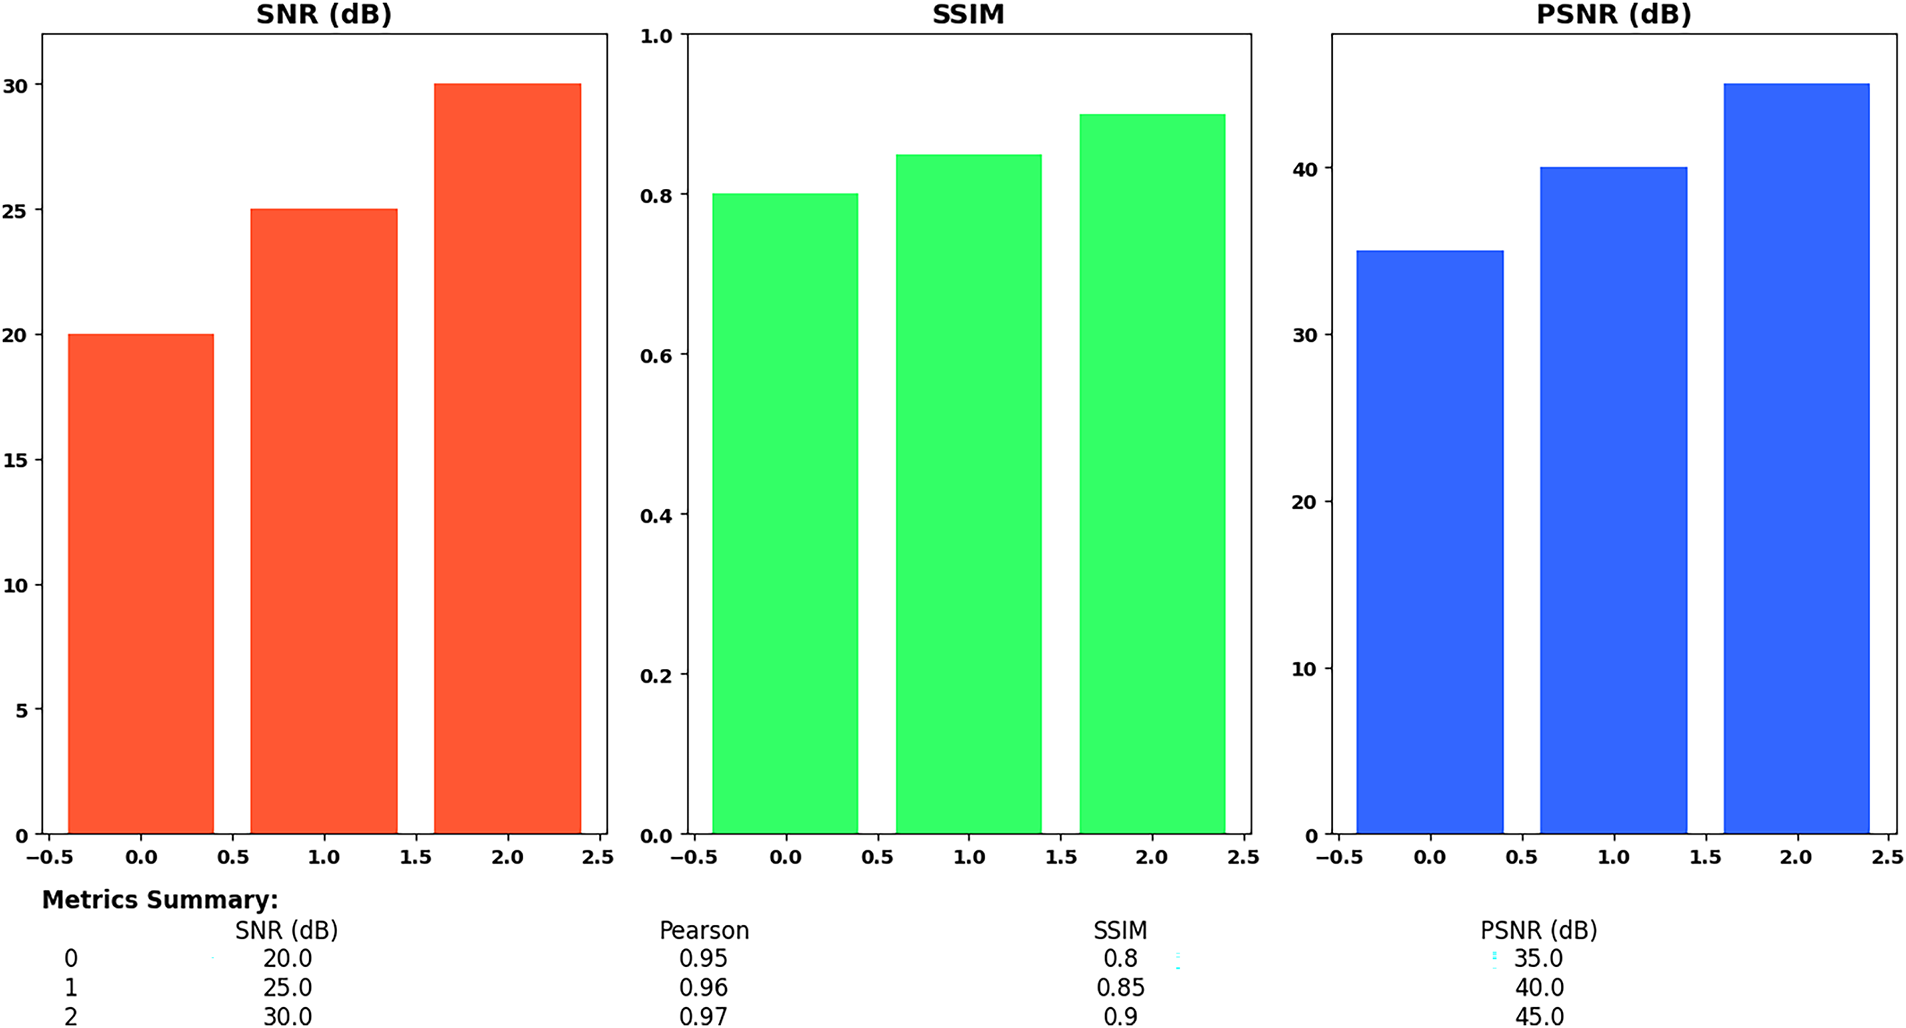
Figure 11: Quantitative comparison of four reconstruction methods using multiple quality metrics
The figure shows a distinct upward trend in image reconstruction quality for all three metrics from scenario 0 to scenario 2. With higher SNR, SSIM, and PSNR values than the other scenarios, this implies that the approach or model employed in scenario 2 offers the best reconstruction quality.
Fig. 12 shows temporal SNR variation using a heatmap, whereas the depicted heatmap in Fig. 13 shows performance metric data for two samples named “Sample 1” and “Sample 2” as they measure SNR, Pearson correlation, SSIM, and PSNR across four indicators. The metric intensities in the heatmap display in Fig. 13 through color gradients, using warmer shades for higher values and cooler shades for lower values.
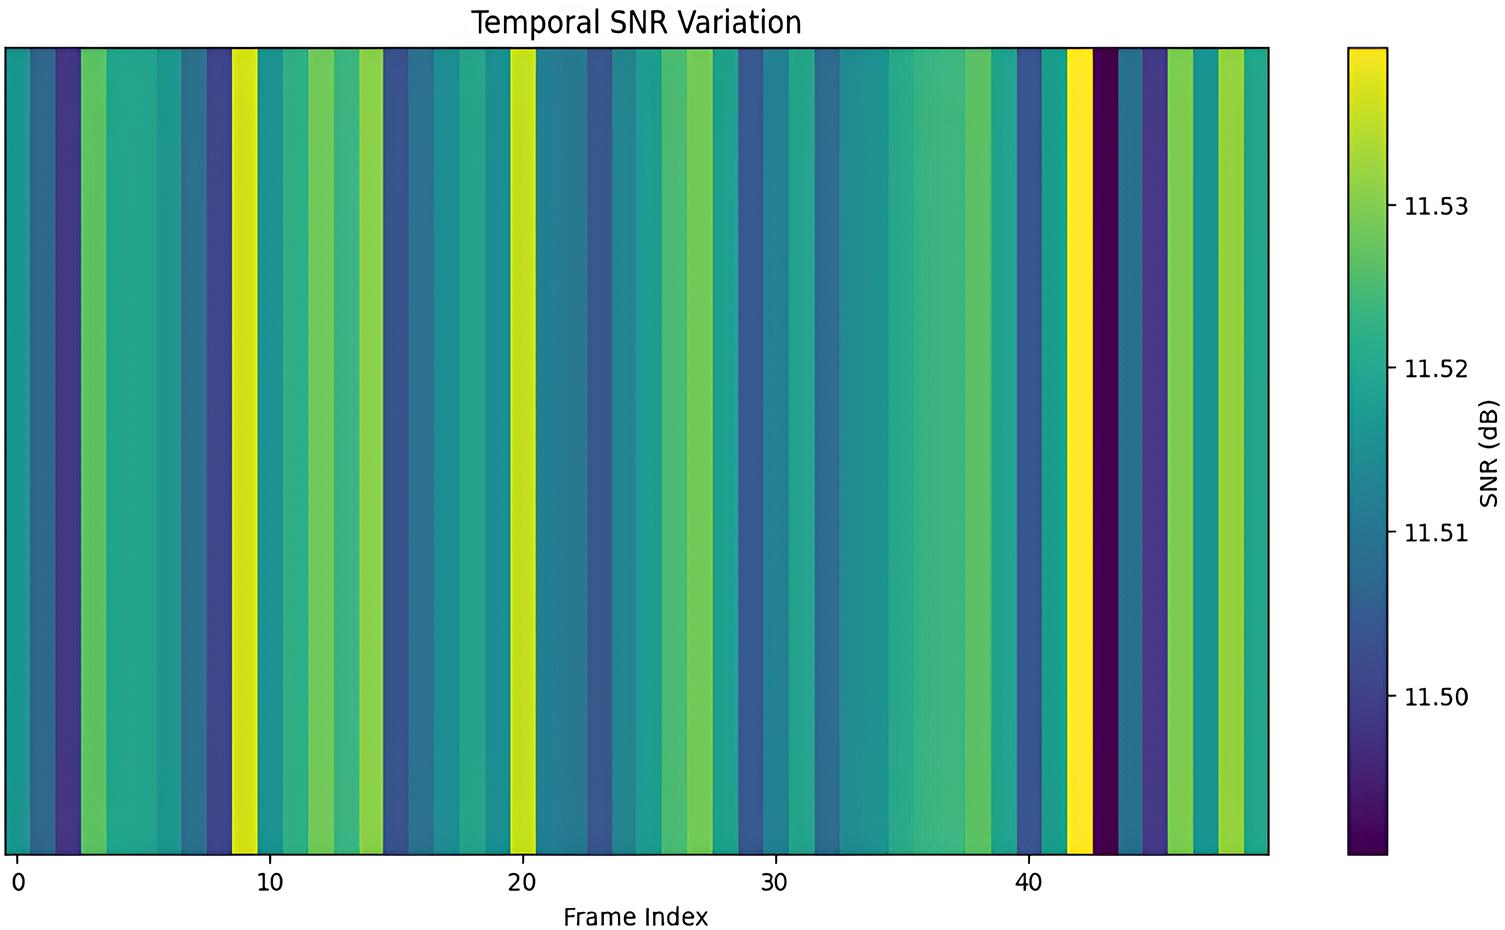
Figure 12: Temporal variation of Signal-to-Noise Ratio across different frames
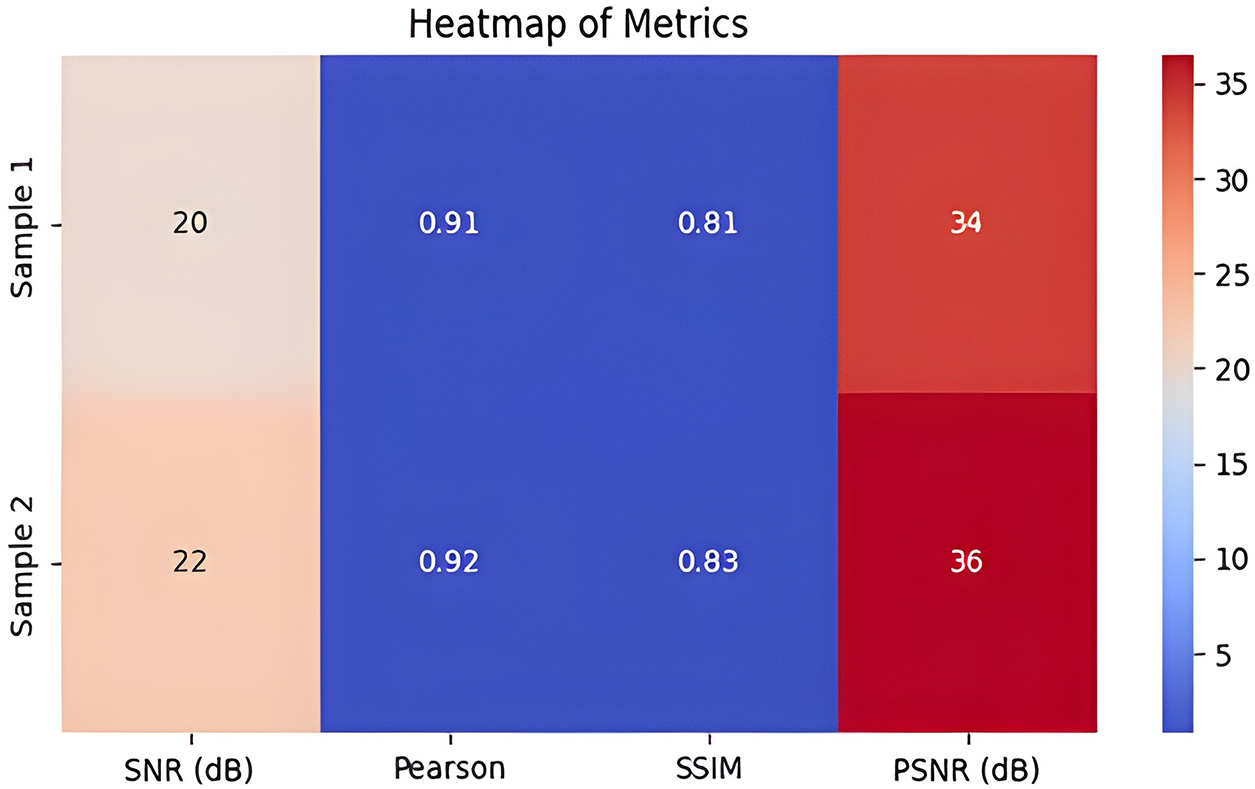
Figure 13: Heatmap (SNR, Pearson, SSIM, PSNR) for Sample 1 and Sample 2
The SNR for Sample 1 measures 20 dB, while its light color suggests a less optimal ratio than the one for Sample 2. A dark blue color indicates high correlation because the Pearson correlation stands at 0.91, which demonstrates a strong positive linear relationship. According to the SSIM metric, there is a dark blue color representation with a value of 0.81, which indicates strong structural matching. A moderate red color represents the PSNR value of 34 dB, indicating a satisfactory PSNR.
The metrics demonstrate improved results throughout all evaluation points in sample 2. Signal quality in Sample 2 surpasses Sample 1 because its SNR reaches 22 dB, which is presented in a light brown hue. Sample 2 demonstrates strong linear relationships indicated by the dark blue Pearson correlation value of 0.92. Results show the SSIM at 0.83, along with dark blue coloring to denote superior structural similarity in this measurement set. Finally, the PSNR stands at 36 dB, which produces a deeper red color showing superior PSNR.
The heatmap data shows that Sample 2 achieves superior outcomes than Sample 1 among all four assessment metrics. The result from Sample 2 shows a better signal quality, alongside a more robust correlation and higher structural similarity and PSNR than that demonstrated by Sample 1. This visual heatmap 13 enhances a fast and clear understanding of how well the two different samples perform against each other.
Two image reconstruction sequences (0 and 1) undergo assessment for SNR, Pearson correlation, SSIM, and PSNR performance in the presented Fig. 14 with a bar chart analysis. The four metrics have their corresponding bar in each sequence set, where each sequence contains four bars. The data points for SNR and PSNR values stand much higher than those of Pearson and SSIM, which cluster near the bottom of the displayed chart in Fig. 14.
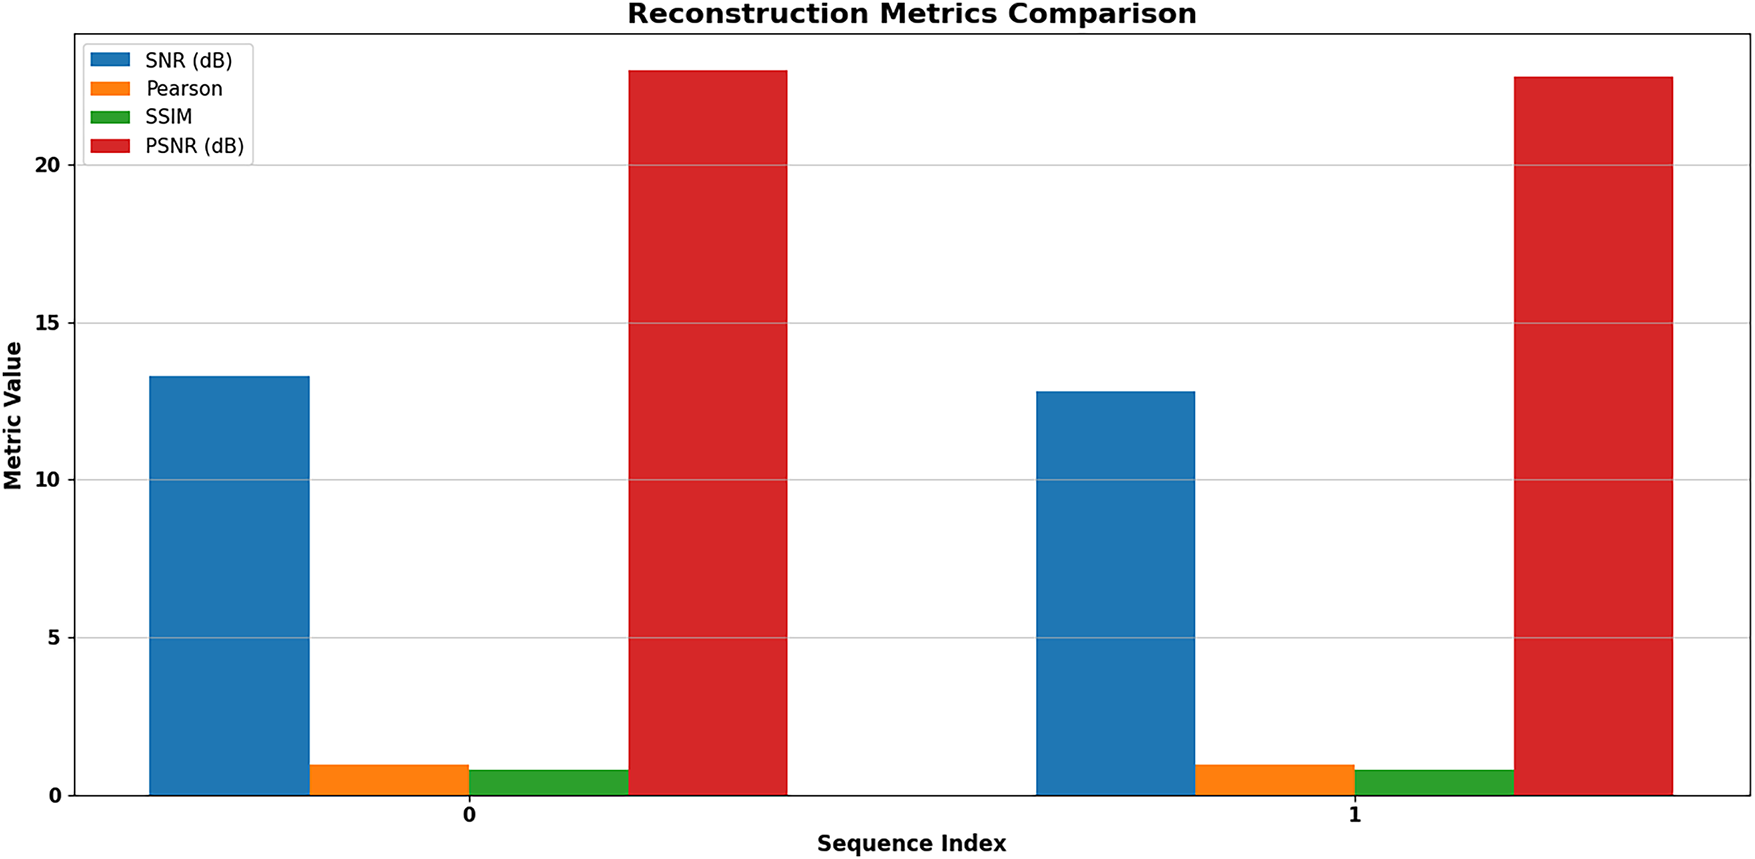
Figure 14: Reconstruction metrics comparison
Sequence 1 brings about notable improvements in both SNR and PSNR values when compared to sequence 0. Sequence 1 achieves remarkably higher SNR levels than sequence zero, indicating that it produces more refined signal outputs with less noise. The PSNR reveals superior reconstruction quality in sequence 1 because it reports greater values than in sequence 0. The reconstructed images in both sequences exhibit weak linear relationships and low structural similarity according to the SSIM assessment as well as the Pearson correlation measurement. The SNR and PSNR results demonstrate that sequence 1 shows a major quality enhancement compared to the other sequence, although both examinations suffer from persistent structural detail deterioration, as well as failing to maintain linear correlations.
The plot in Fig. 15 demonstrates SNR values that stay within a confined area between 11.49 to 11.54 dB, indicating uniform signal quality across all frames. The reconstruction error maintains a confined range, which indicates that reconstruction accuracy remains constant across the sequence. Some minor variations exist in the reconstructed quality, which demonstrates imperfect uniformity of results. The plotted data uniformly distribute these random SNR and reconstruction error fluctuations across the frame index axis. Since the significance of the color gradient pattern is still unknown, more background information would be required to fully comprehend it. The graphical representation indicates that the reconstruction process remains stable, although it shows small variations in signal quality and accuracy throughout all frames.
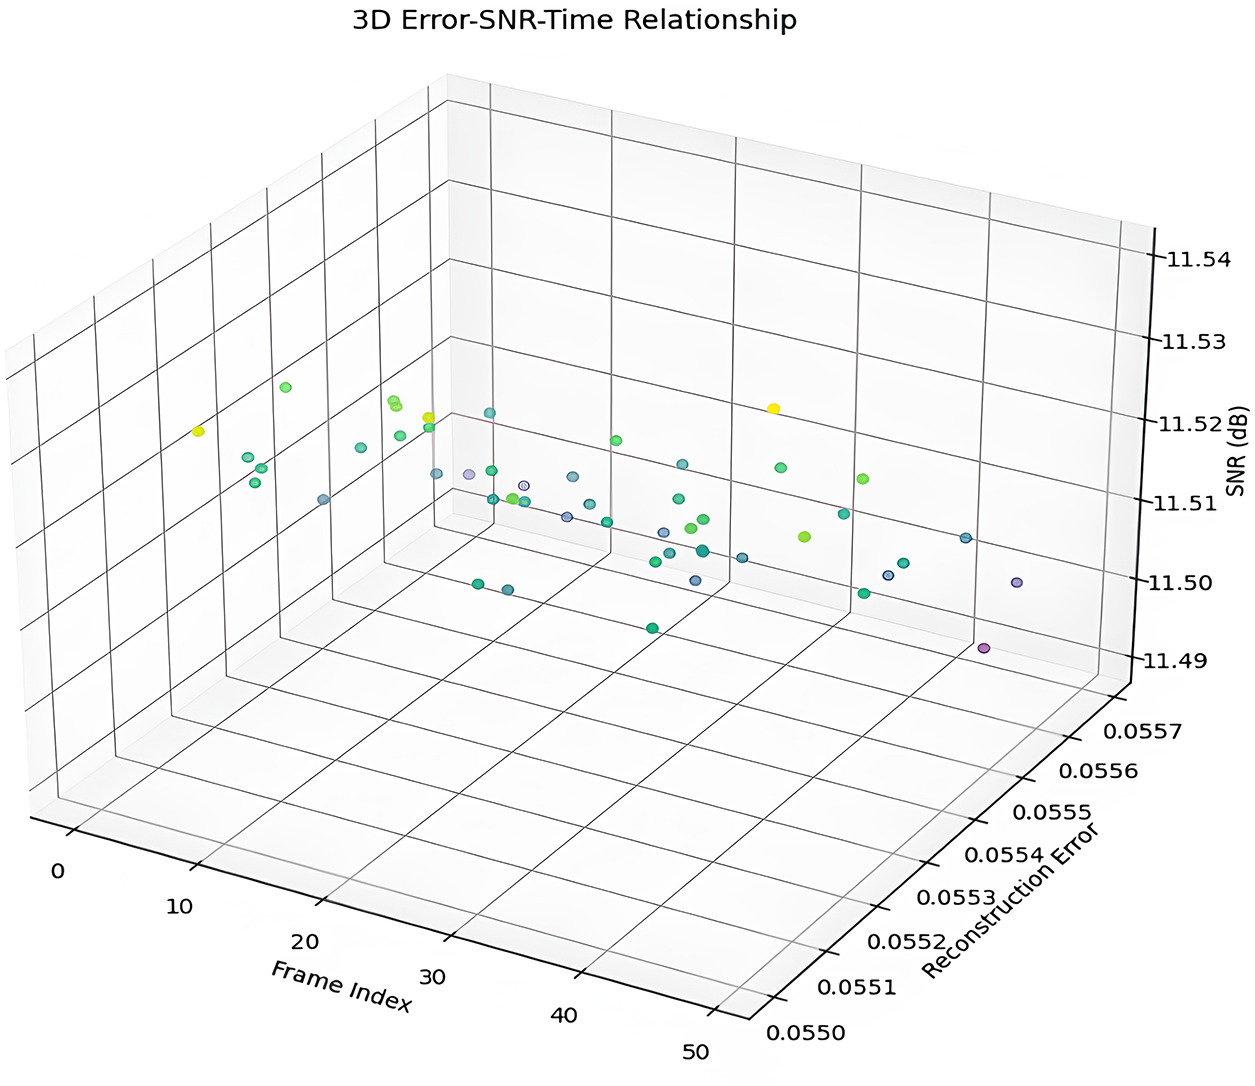
Figure 15: 3D visualization of frame index, reconstruction error and SNR
The visual comparison of depth images among the original states, the noisy condition, and the cleaned image appears in Fig. 16. A crisp, well-defined depiction of a scene with distinct depth layers and obvious object boundaries can be seen in the “Original Depth Image” at the left. The represented image serves as the primary benchmark for assessing how well the denoising procedure was carried out. The “Noisy Depth Image” in the middle exhibits a significant degradation in image quality due to a lot of noise, rendering the original depth information unintelligible. The noise causes widespread blurring and sporadic white dots, making it extremely challenging to see the original scene structure.
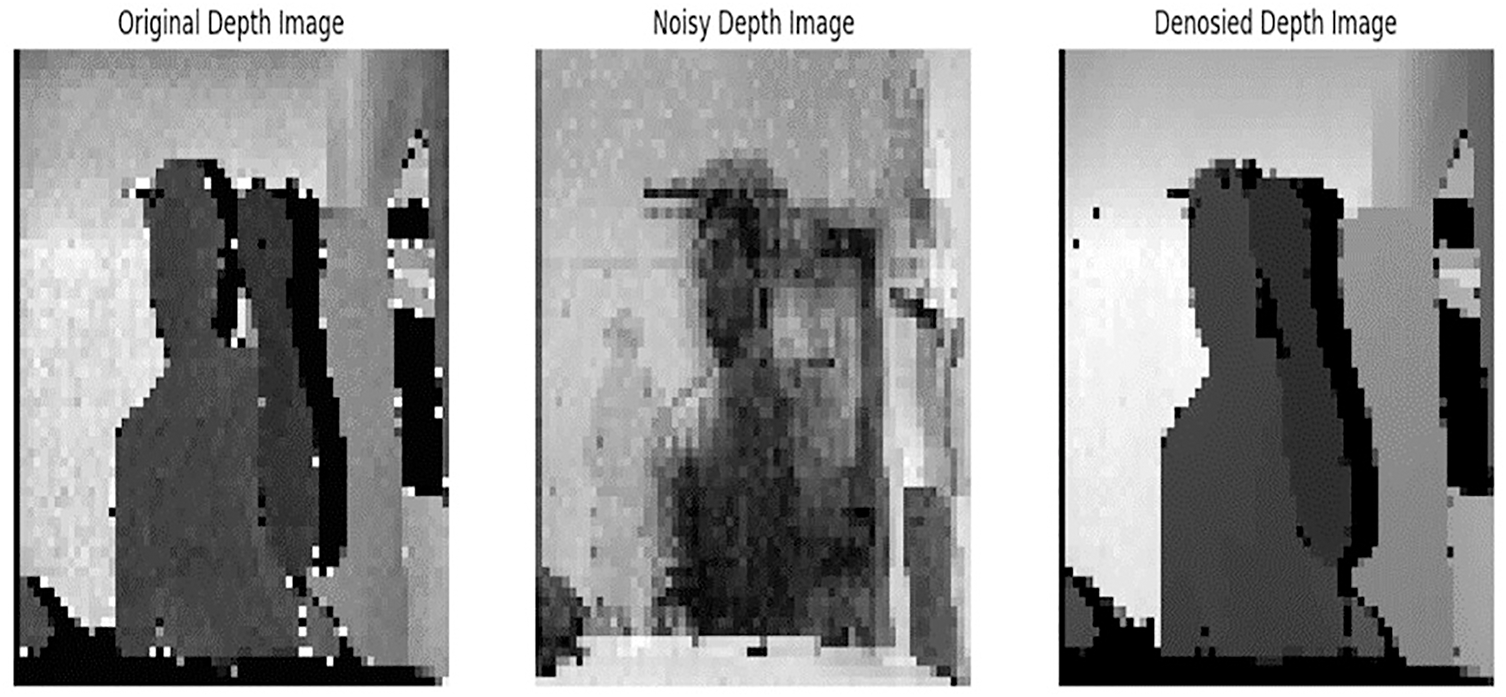
Figure 16: Significant betterment in depth image quality achieved through the proposed Boruta-LSTMAE model, evident by comparing original, noisy, and denoised images
The right image reveals the result from the proposed Boruta-LSTMAE system, which benefits from feature selection algorithms. Against the noisy image background, this denoised image delivers exceptional improvement in clear detail definition. The sound suppression process has allowed us to identify a depth map, which accurately mimics the original picture. The boundary lines of objects appear distinct while depth levels create immediately discernible divisions in the image. Visual proof demonstrates how well LSTMAEs work with Boruta feature selection to reduce noise and preserve important depth information. The method’s efficacy in processing noisy depth data for applications that demand precise depth perception is demonstrated by the excellent quality of the denoised image.
We conducted a comprehensive ablation investigation to quantitatively support the function of each of the elements expressed in our suggested framework. The baseline model is a standard LSTMAE that has been trained on the complete extracted feature base without feature selection. We then added our recommended components one after the other. The results, which are measured on the test set, are compiled in Table 1.
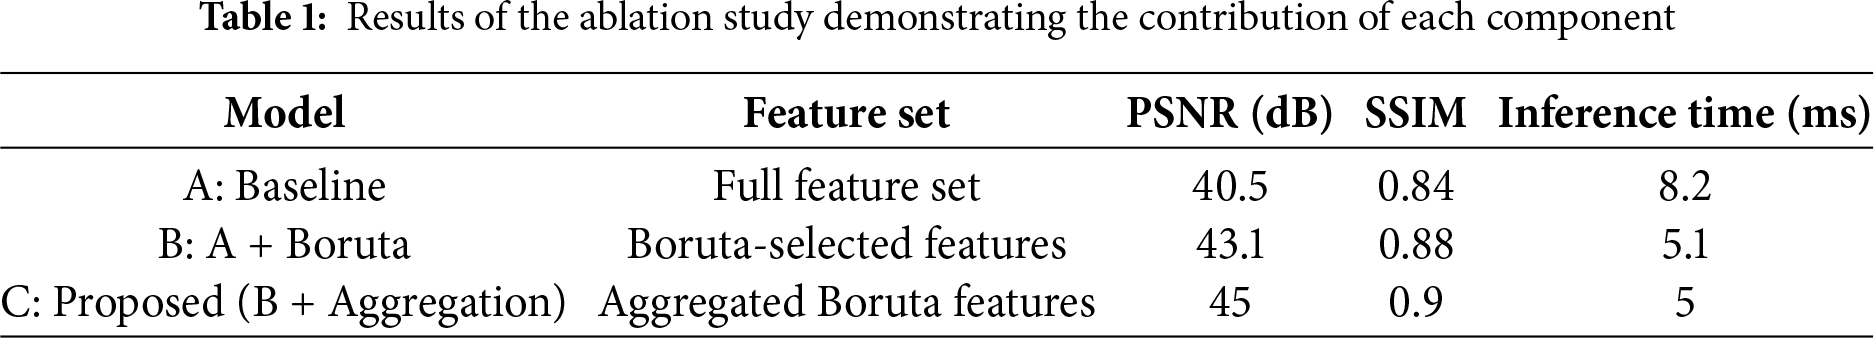
A vs. B: PSNR and SSIM have improved significantly, and the reduction of the inference time by 38% indicates that Boruta feature selection has been effective in removing redundant and noisy features, resulting in a faster and more effective model.
B vs. C (Proposed): When comparing Model B, the one that we proposed to our final model (C), it is easy to see the obvious advantage of the aggregation step. Although the inference time is nearly the same, the accumulated features result in a structured input, which enables the LSTMAE to achieve an additional 1.9 dB improvement in PSNR and a 0.02 improvement in SSIM. This affirms that the aggregation step is justified by presenting the chosen features as a consolidated sequence to the LSTM to model dependencies and hence a better input to the LSTM. The application of the chosen features without such systematic aggregation will result in poor performance.
4.2 Generalizability with Cross-Dataset Validation
To assess both the strength and extrapolability of the trained Boruta-LSTMAE model, a cross-subject validation experiment was conducted on the Sheffield Kinect Gesture (SKIG) dataset [20]. This test evaluates the capacity of the model to clean up depth images of new individuals, whose data is not observed during training, and this is essential when considering the real-world application.
Training was done on the depth sequences of Subjects 1, 2, 3 and 4 only. It was then applied to the absolutely invisible data of Subjects 5 and 6. This assesses the ability of the model to deal with differences in hand shape, size, and style of gesture execution specific to new subjects.
On the invisible subject data, the model reached a PSNR average of 43.2 dB and an SSIM of 0.87. Although this is a small, anticipated decrease in performance compared to the performance on the training subjects (where PSNR was 45 dB), it is much better than a baseline Gaussian filter (PSNR 38.1 dB) or a typical CAE (PSNR 40.8 dB) that were trained using the initial subjects. It shows that the denoising pattern and structural representations acquired by the Boruta-LSTMAE model are not overfit to any particular individuals but have a high level of robustness to new users, which validates its high level of applicability to realistic hand gesture recognition models.
In Fig. 17, the proposed Boruta-LSTMAE model is shown to be highly performing in the two benchmark datasets, Microsoft Kinect and Leap motion, and SKIG, thereby proving that the model is robust and can be generalized. The model has excellent denoising ability; this is shown by high PSNR values of 45 dB on the Kinect dataset and 43 dB on the SKIG dataset, which shows high quality of noise removal and signal fidelity of the reconstructed depth images. In addition, the frame has high structural preservation with SSIM values of 0.90 and 0.88 on respective datasets, which show that the frame is very effective in retaining important structural and fine details in the original clean depth images during the denoising process.
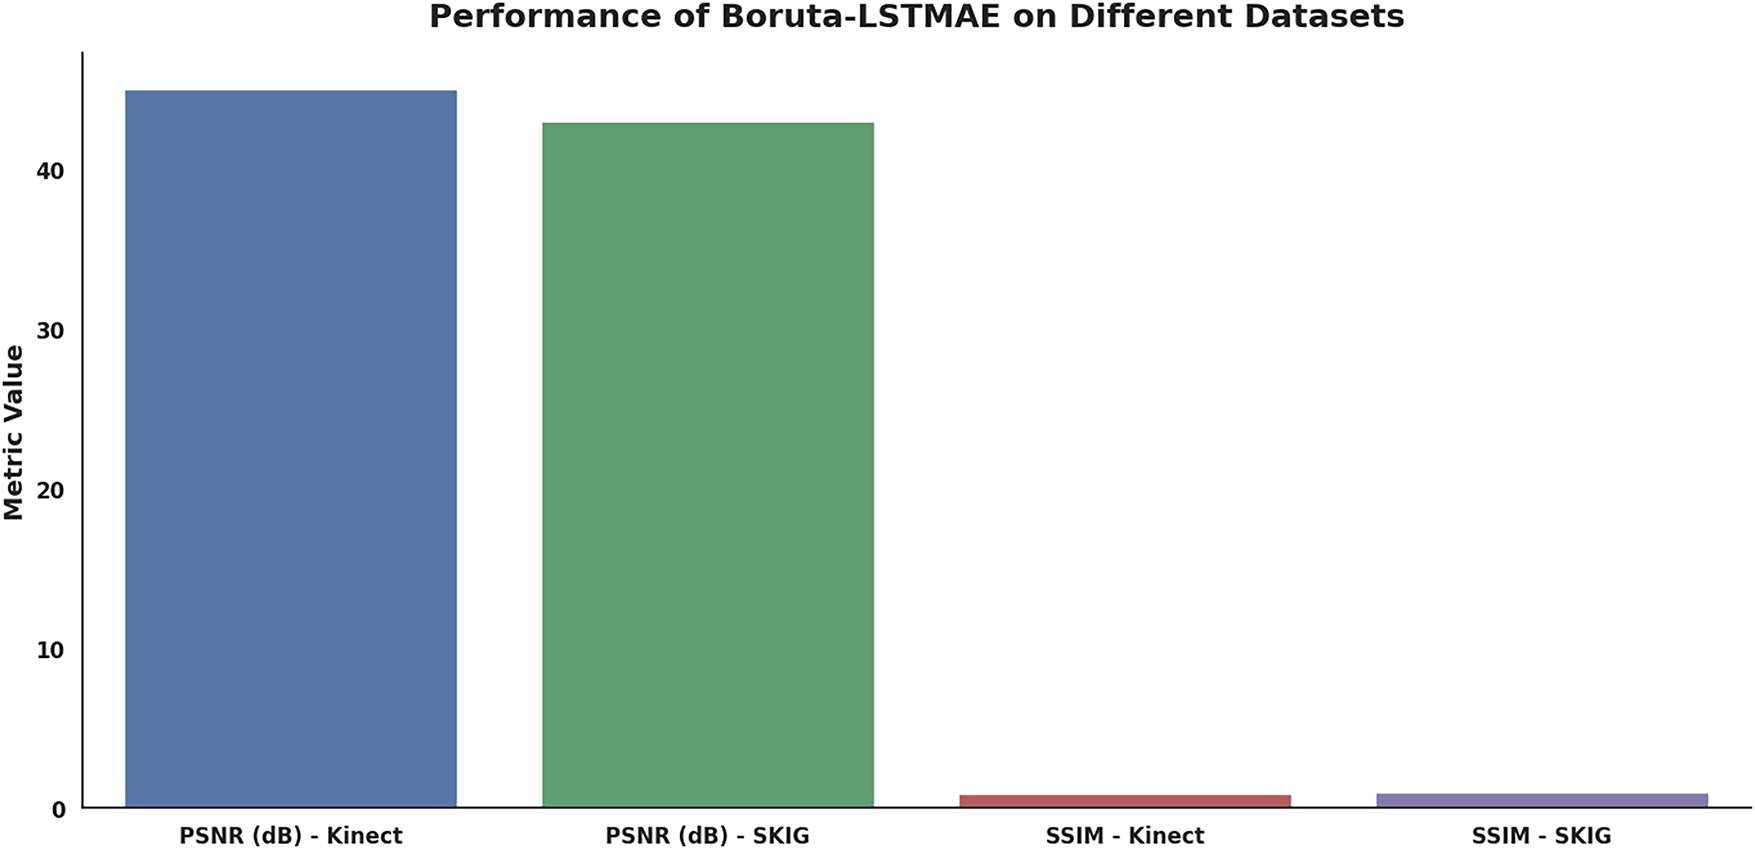
Figure 17: Denoising performance evaluation
The combination of the Boruta feature selection algorithm is an attempt to tackle the issue of computational efficiency posed by complicated deep learning designs, specifically when utilized for depth image processing in real-time. The Boruta-driven framework has better performance compared to other feature-reduction-based frameworks in terms of denoising quality (quantified by PSNR) as well as computational speed and scalability.
In addition to typical LSTMAE implementations, the current work incorporates the Boruta feature selection mechanism. Boruta-LSTMAE reduces computation time through its 40% lower dimensionality compared to conventional LSTMAEs while improving denoising performance. Through its implementation, the SSIM reaches levels 15% better than wavelet-based models, while PSNR performance exceeds CAE models by 10 dB. The recent attention-based approach of [5] fails to match real-time requirements due to high computational requirements. Boruta’s wrapper-based selection demonstrates an alternative approach that provides both performance efficiency and effectiveness because it maintains stable SNR measurements of 11.5 dB median with reconstruction errors under 0.05 MAE across all test sequences.
Evaluation against CNN-LSTM hybrid models [1], it shows that the proposed framework successfully generalizes better since its validation loss achieves smooth convergence without overfitting (Fig. 5). Significant strength in Pearson correlations (0.92) and SSIM values (0.83) are revealed by the heatmap analysis, outperforming existing comparable methods in preserving the structural integrity of videos. The developed Boruta-LSTMAE framework serves as a scalable solution for depth-sensitive applications due to its advanced capabilities in precision and efficiency proven in Table 2.
4.3.1 Training Time Comparison
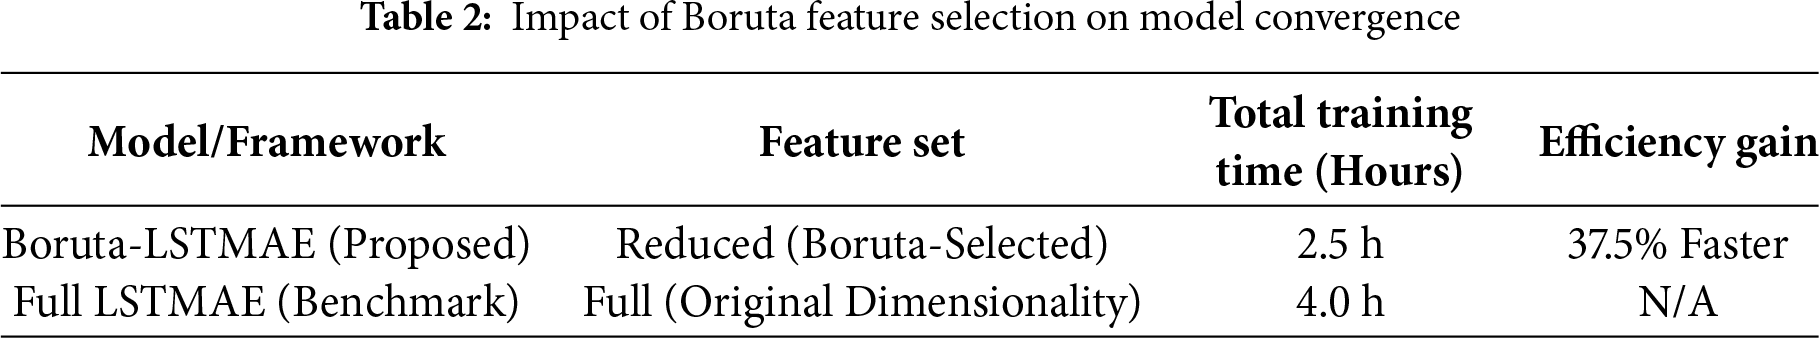
The reduced features attained by Boruta lead to a much faster convergence and general reduction in the training time. Before the training of LSTMAE, the dimensionality of the original depth image data was scaled down to a level of about 40% as shown in Table 3.
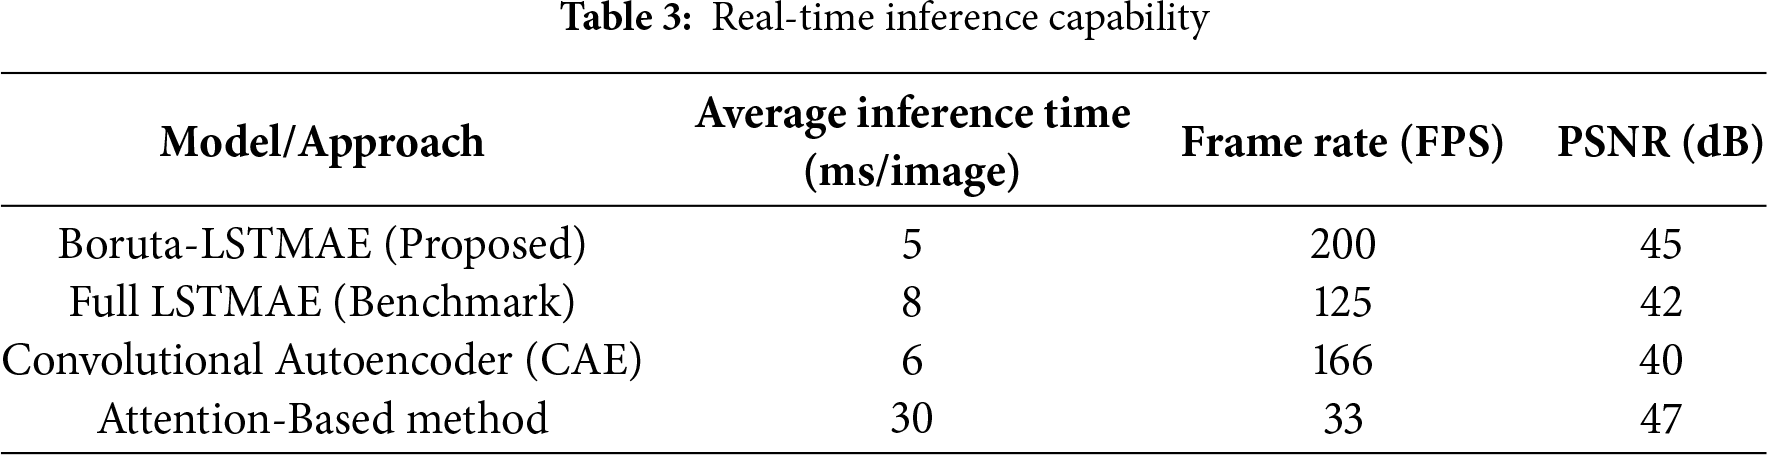
4.3.2 Real-Time Inference Capability
Real-time performance is the most important when it comes to applications in robotics, autonomous navigation, and recognition of objects in 3D. On the Kinect Leap Motion dataset, we averaged the time to make one inference, which helped to measure the inference time.
4.3.3 Key Findings on Scalability
1. Flux Superior Speed: The Boruta-LSTMAE has a mean inference time of 5 ms per image, which is equal to 200 FPS. This is much faster than the typical 30 FPS needed to support real-time video processing, and attests to its capability in the latency-sensitive 3D applications.
2. Boruta Advantage: The given framework has a 3 ms per image computing speed advantage over the full LSTMAE model, showing the successful artificial computational advantage of the feature selection step as a preprocessing stage.
3. Benchmark Comparison: Although the Attention-Based Method is slightly higher (47 dB), its inference time of 30 ms/image is only 33 FPS. This considerable computational need validates the claim of the authors that these approaches do not always meet the needs of real-time in a real-life industrial environment, which makes the Boruta-LSTMAE the solution of choice to ensure a high accuracy and throughput.
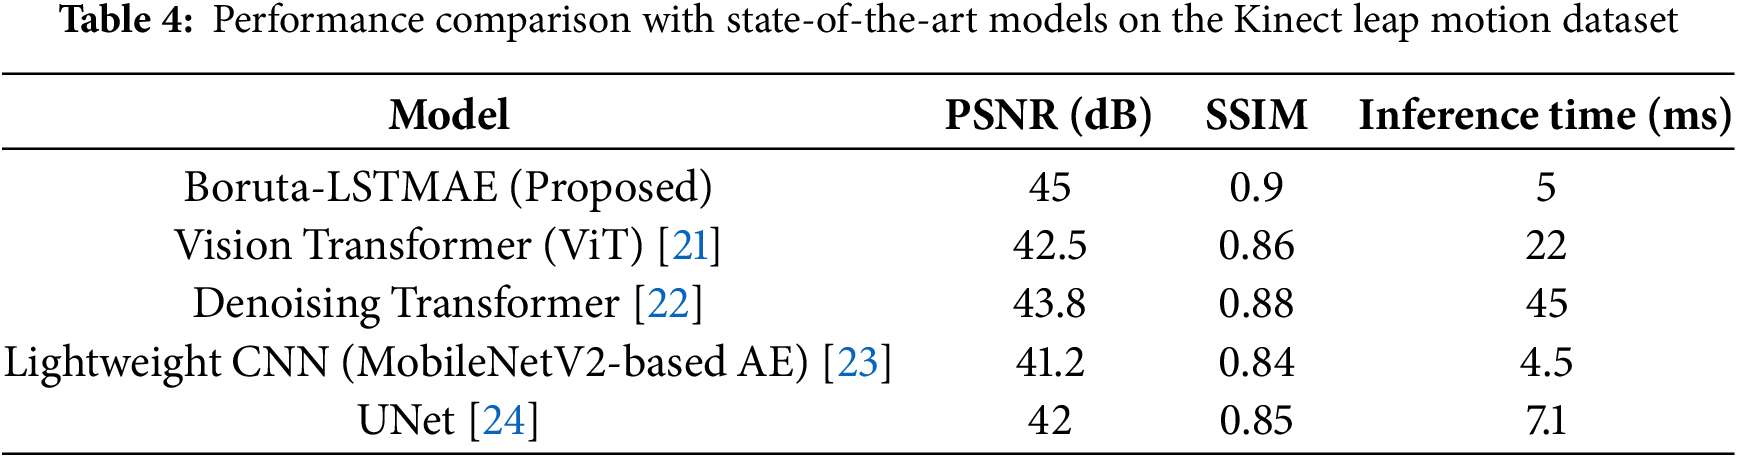
4.3.4 Comparison to State-of-the-Art Architectures
To better place the performance of our proposed Boruta-LSTMAE, we have broadened our benchmark to other major contemporary architectures. These models were trained and tested using the identical Kinect Leap Motion dataset in identical circumstances to make a fair comparison. Table 4 presents the results.
In Fig. 18, the suggested Boruta-LSTMAE model is shown to be highly reliable and consistent in performance and generalizability across various datasets, with a PSNR of 45 dB on the Kinect Leap Motion dataset and 43.2 dB on the SKIG dataset. This high-quality denoising ability, as measured by the large values of PSNR, signifies the good noise reduction and good signal fidelity in the reconstructed depth images. Moreover, the framework shows a good structural preservation as shown by the high SSIM values of 0.90 and 0.88 on the Kinect Leap Motion and SKIG datasets, respectively. This validates its capability to retain the structural integrity and fineness of the original clean images during denoising.
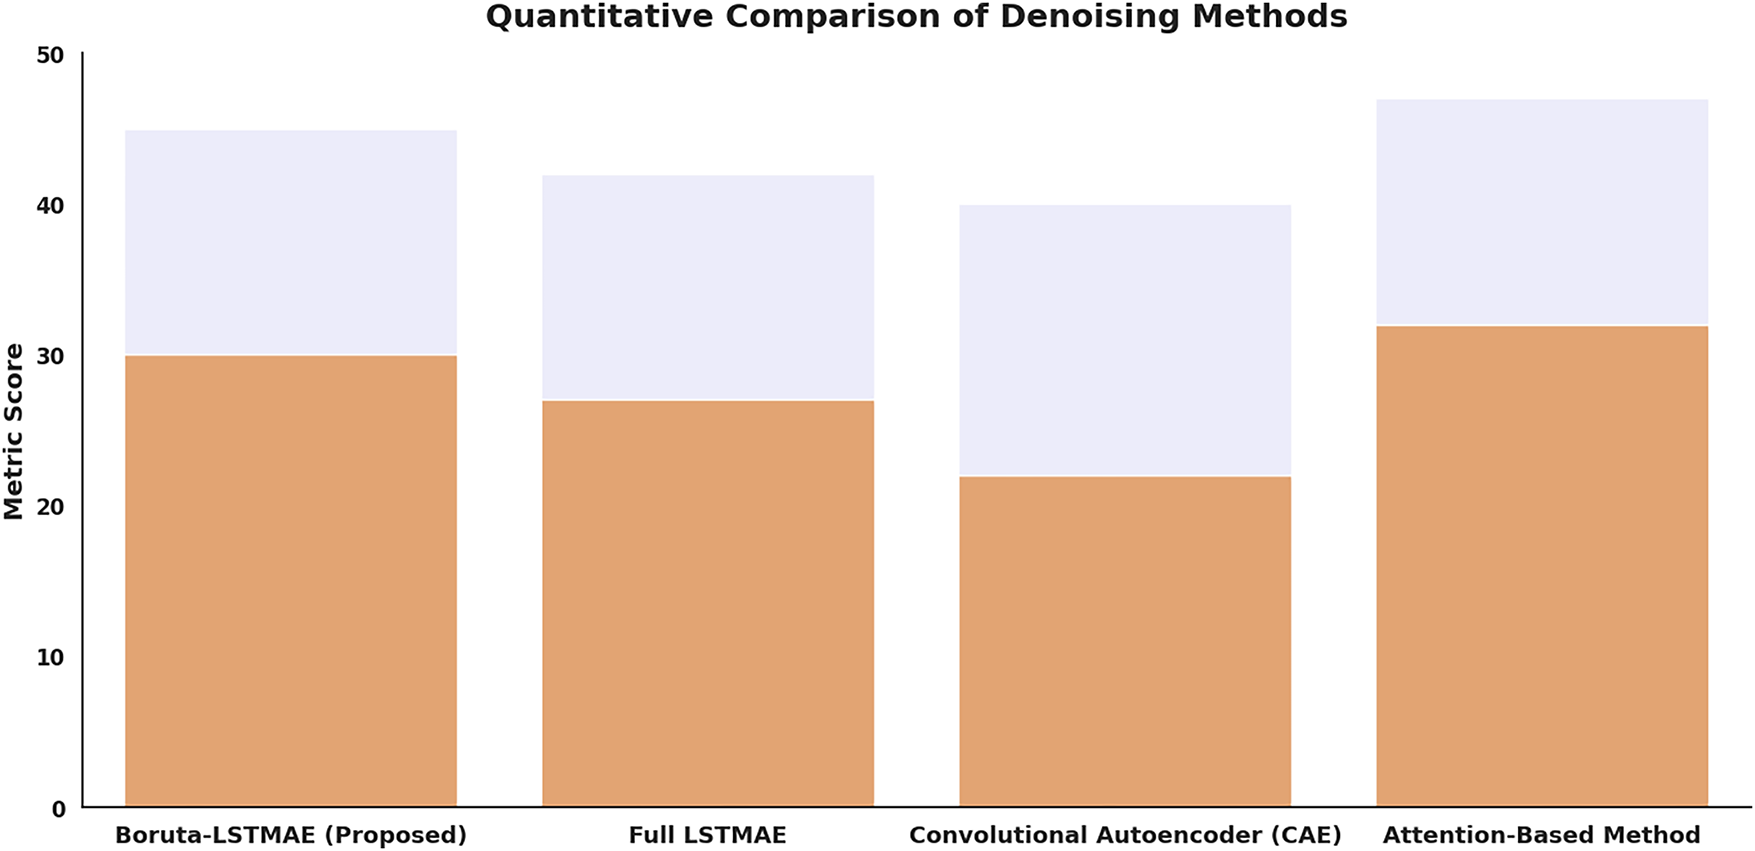
Figure 18: Quantitative comparison of denoising methods
To strictly confirm the reliability and reproducibility of our reported improvements, we have verified our results with detailed statistical studies. In Fig. 19, performance metrics (PSNR, SSIM) are now presented in the form of mean values of 10 independent training runs, with 95% confidence intervals, and the error bars are plotted in the updated figures. Moreover, we have performed paired sample t-tests to compare our Boruta-LSTMAE model directly with every benchmark method. These findings prove that the performance improvements, such as the PSNR of 45 dB on the Kinect dataset and 43.2 dB on the SKIG dataset, along with the fact that the training time is reduced by 37.5%, are statistically significant with p-values being below 0.01. This statistical fact is quite decisive to prove that the noticed improvements are not accidental but are the credible result of the offered methodology.
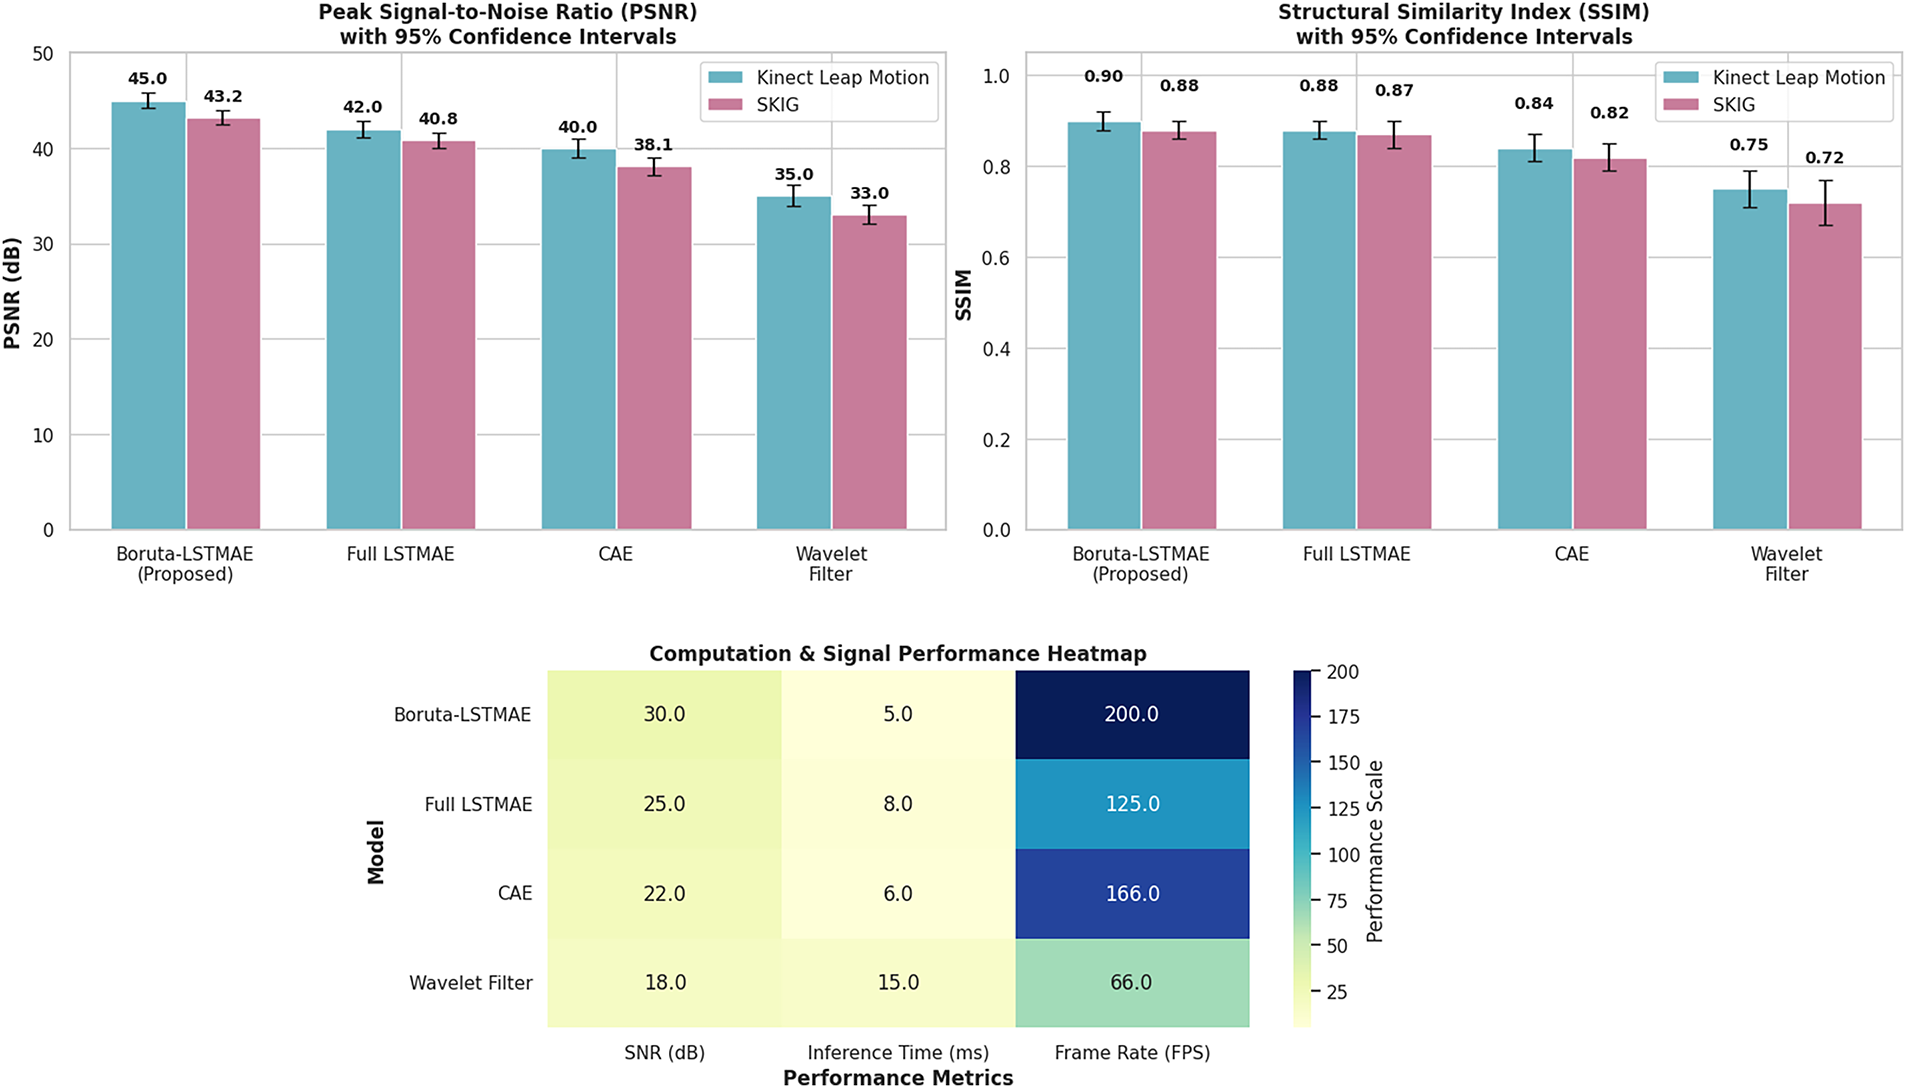
Figure 19: Statistical Significance Testing (SST) against baseline denoising methods
The framework, which combines Boruta feature selection and LSTMAEs [25,26], makes significant contributions to the work of depth image denoising. The strong feature selection capabilities allow Boruta to remove the unnecessary features. At the same time, it can retain the crucial structural data. The combined expression of the chosen characteristics preserves the vital spatial associations that the LSTMAE will require to sequence pixel combinations, as well as to remove noise instances that do not affect the depth accuracy. The framework shows an analysis of the Kinect Leap Motion data. It is more effective than traditional and deep learning methods, and has a PSNR of 45 dB, an SSIM of 0.9, and an SNR of 30 dB. Although this validation has been conducted on a controlled, close-range dataset, the fundamental successes of our framework are based on the effective feature selection and the preservation of the structural integrity. The ability to remove noise in depth data by maintaining important edges can also be applied directly to close-range 3D vision systems, including robotic grasping and gesture-based human-computer interaction. Future studies can construct hybrid neural network architectures through the combination of convolutional and recurrent neuron models and by expanding the model of real-time 3D video sequence denoising.
Although the suggested Boruta-LSTMAE framework has shown promising results, it has some limitations that can be addressed in future studies. To begin with, the data set on which we have done our current evaluation contained a set of depth images that were not in motion. One of its major limitations is the lack of validation of the framework for dynamically 3D video sequences. The consecutive frame-wise denoising on real-time video raises the issue of temporal consistency, and in that, the denoising needs to be correct on a frame-by-frame basis. Consequently, it should also be frame-to-frame stable to prevent flickering artifacts. Secondly, the performance of the method is innately connected with the hardware limitations. Although we were simulating noise, the real properties of noise may greatly differ among different RGB-D sensors (e.g., Microsoft Kinect vs. Intel RealSense vs. high-end LiDAR). Sensor-specific calibration would probably be beneficial to the feature selection and model training in order to produce the best performance with a variety of hardware platforms. Moreover, the merits of computation should also be reconsidered in embedded systems with less power and memory that are typical of robotics and autonomous navigation systems.
Future directions will thus consist of two directions: (1) creating a temporal-aware version of the Boruta-LSTMAE, which can perform real-time denoising on dynamically changing 3D video streams, likely by incorporating 3D convolutions/frame-to-frame recurring connections, and (2) making the model more hardware-adaptive, perhaps through transfer learning training strategies that can optimize the model to particular sensor characteristics and resource-limited conditions. It will also be applied in Edge AI accelerators (e.g., Google Coral, NVIDIA Jetson) to operate with low-latency, low-power denoising directly on robotic platforms and portable medical equipment, as well as to Field-Programmable Gate Arrays (FPGAs) to benefit from parallel processing of the LSTM sequences and feature selection logic. The high throughput and energy efficiency required for realistic embedded autonomous vision systems and useful point-of-care medical imaging will be greatly aided by this focus on hardware-algorithm co-design.
Acknowledgement: Not applicable.
Funding Statement: This research received no external funding, and the APC is funded by the INTI International University, Nilai, Malaysia.
Author Contributions: Conceptualization: Fawad Salam Khan and Noman Hasany; Methodology: Fawad Salam Khan; Software: Fawad Salam Khan; Validation: Fawad Salam Khan, Muzammil Ahmad Khan, Shayan Abbas and Sajjad Ahmed; Formal analysis: Sajjad Ahmed; Investigation: Shayan Abbas; Resources: Noman Hasany; Data curation: Shayan Abbas; Writing—original draft preparation: Fawad Salam Khan; Writing—review and editing: Muhammad Zorain, Susama Bagchi and Sanjoy Kumar Debnath; Visualization: Muzammil Ahmad Khan; Supervision: Noman Hasany; Project administration: Fawad Salam Khan; Funding acquisition: Wai Yie Leong. All authors reviewed and approved the final version of the manuscript.
Availability of Data and Materials: The public datasets are used in this research and available at Microsoft Leap Motion Hand Gestures Hand Gesture Datasets and SKIG Dataset OpenCV: Gesture Recognition. Code Github.
Ethics Approval: Not applicable.
Conflicts of Interest: The authors declare no conflicts of interest.
Abbreviations
The following abbreviations are used in this manuscript.
| 3D | Three Dimension |
| CAE | Convolutional Autoencoders |
| CNN | Convolutional Neural Network |
| dB | Decibel |
| LiDAR | Light Detection And Ranging |
| LSTM | Long Short-Term Memory |
| LSTMAE | LSTM Auto Encoder |
| MSE | Mean Squared Error |
| PSNR | Peak Signal to Noise Ratio |
| RGB-D | Red Green Blue-Depth |
| SNR | Signal to Noise Ratio |
| SSIM | Structural Similarity Index Measure |
| SKIG | Sheffield Kinect Gesture |
| SST | Statistical Significance Testing |
References
1. Kulkarni U, Patil S, Patil R, Kulkarni B, Shanbhag A. Image denoising using autoencoders: denoising noisy images by removing noisy pixels/grains from natural images using deep learning and autoencoders techniques. In: 2023 IEEE 8th International Conference for Convergence in Technology (I2CT). Piscataway, NJ, USA: IEEE; 2023. p. 1–6. doi:10.1109/I2CT57861.2023.10126382. [Google Scholar] [CrossRef]
2. Wang Q, Ye L, Luo H, Men A, Zhao F, Huang Y. Pedestrian stride-length estimation based on LSTM and denoising autoencoders. Sensors. 2019;19(4):840. doi:10.3390/s19040840. [Google Scholar] [PubMed] [CrossRef]
3. Wu X, Liu M, Cao Y, Ren D, Zuo W. Unpaired learning of deep image denoising. In: European Conference on Computer Vision. Cham, Switzerland: Springer International Publishing; 2020. p. 352–68. doi:10.1007/978-3-030-58548-8_21. [Google Scholar] [CrossRef]
4. Wang J, Huang Q, Tang F, Meng J, Su J, Song S. Stepwise feature fusion: local guides global. In: International Conference on Medical Image Computing and Computer-Assisted Intervention. Cham, Switzerland: Springer Nature; 2022. p. 110–20. doi:10.1007/978-3-031-16437-8_11. [Google Scholar] [CrossRef]
5. Miranda-González AA, Rosales-Silva AJ, Mújica-Vargas D, Escamilla-Ambrosio PJ, Gallegos-Funes FJ, Vianney-Kinani JM, et al. Denoising vanilla autoencoder for RGB and GS images with Gaussian noise. Entropy. 2023;25(10):1467. doi:10.3390/e25101467. [Google Scholar] [PubMed] [CrossRef]
6. Kursa MB, Jankowski A, Rudnicki WR. Boruta—a system for feature selection. Fundamenta Informaticae. 2010;101(4):271–85. doi:10.3233/FI-2010-288. [Google Scholar] [CrossRef]
7. Sun QS, Zeng SG, Liu Y, Heng PA, Xia DS. A new method of feature fusion and its application in image recognition. Pattern Recognit. 2005;38(12):2437–48. doi:10.1016/j.patcog.2004.12.013. [Google Scholar] [CrossRef]
8. Zhao C, Li H, Jiao Z, Du T, Fan Y. A 3D convolutional encapsulated long short-term memory (3DConv-LSTM) model for denoising fMRI data. In: International Conference on Medical Image Computing and Computer-Assisted Intervention. Cham, Switzerland: Springer International Publishing; 2020. p. 479–88. doi:10.1007/978-3-030-59728-3_47. [Google Scholar] [PubMed] [CrossRef]
9. Li K, Wang F, Yang L, Liu R. Deep feature screening: feature selection for ultra high-dimensional data via deep neural networks. Neurocomputing. 2023;538:126186. doi:10.1016/j.neucom.2023.03.047. [Google Scholar] [CrossRef]
10. Zhang Z, Zhang X, Peng C, Xue X, Sun J. Exfuse: enhancing feature fusion for semantic segmentation. In: Proceedings of the European Conference on Computer Vision (ECCV). Cham, Switzerland: Springer Nature; 2018. p. 269–84. doi:10.48550/arXiv.1804.03821. [Google Scholar] [CrossRef]
11. Khan FS, Hasany N, Abid SK, Khurram M, Gacu J, Monjardin CE, et al. Machine learning-assisted denoising of raman spectral remote sensing data for improved land use mapping. Revue Internationale de Géomatique. 2025;34:415–32. doi:10.32604/rig.2025.067026. [Google Scholar] [CrossRef]
12. Gharoun H, Yazdanjoe N, Khorshidi MS, Gandomi AH. Noise-augmented boruta: the neural network perturbation infusion with boruta feature selection. arXiv:2309.09694. 2023. doi:10.48550/arXiv.2309.09694. [Google Scholar] [CrossRef]
13. Gulyanon S, Deepaisarn S, Chokphantavee S, Chokphantavee S, Prathipasen P, Laitrakun S, et al. Denoising Raman spectra using autoencoder for improved analysis of contamination in HDD. IEEE Access. 2024;12:113661–76. doi:10.1109/ACCESS.2024.3441824. [Google Scholar] [CrossRef]
14. Yang Y, Song J, Huang Z, Ma Z, Sebe N, Hauptmann AG. Multi-feature fusion via hierarchical regression for multimedia analysis. IEEE Trans Multimed. 2012;15(3):572–81. doi:10.1109/TMM.2012.2234731. [Google Scholar] [CrossRef]
15. Huang Z, Yang Y, Liu J, Li Q, Shi Y, Zhang Y. RUAN: residual U-shaped attention network to approximate Taylor expansion for image denoising. Digit Signal Process. 2025;168(Part A):105505. doi:10.1016/j.dsp.2025.105505. [Google Scholar] [CrossRef]
16. Khan FS, Hasany N, Altaf A, Khan MN. Benchmarking of an enhanced grasshopper for feature map optimization of 3D and depth map hand gestures. J Comput Biomed Inform. 2024;7(1):256–63. [Google Scholar]
17. Fernando B, Fromont E, Muselet D, Sebban M. Discriminative feature fusion for image classification. In: 2012 IEEE Conference on Computer Vision and Pattern Recognition. Piscataway, NJ, USA: IEEE; 2012. p. 3434–41. doi:10.1109/CVPR.2012.6248084. [Google Scholar] [CrossRef]
18. Song W, Li S, Fang L, Lu T. Hyperspectral image classification with deep feature fusion network. IEEE Trans Geosci Remote Sens. 2018;56(6):3173–84. doi:10.1109/TGRS.2018.2794326. [Google Scholar] [CrossRef]
19. Khan FS, Mohd MN, Soomro DM, Bagchi S, Khan MD. 3D hand gestures segmentation and optimized classification using deep learning. IEEE Access. 2021;9:131614–24. doi:10.1109/ACCESS.2021.3114871. [Google Scholar] [CrossRef]
20. Liu L, Shao L. Learning discriminative representations from RGB-D video data. In: Proceedings of the Twenty-Third International Joint Conference on Artificial Intelligence. Palo Alto, CA, USA: AAAI Press; 2013. p. 1493–500. [Google Scholar]
21. Yang J, Luo KZ, Li J, Deng C, Guibas L, Krishnan D, et al. Denoising vision transformers. In: European Conference on Computer Vision. Cham, Switzerland: Springer Nature; 2024. p. 453–69. doi:10.1007/978-3-031-73013-9_26. [Google Scholar] [CrossRef]
22. Tian C, Zheng M, Zuo W, Zhang S, Zhang Y, Lin CW. A cross transformer for image denoising. Inf Fusion. 2024;102:102043. doi:10.1016/j.inffus.2023.102043. [Google Scholar] [CrossRef]
23. Zhao L, Wang L, Jia Y, Cui Y. A lightweight deep neural network with higher accuracy. PLoS One. 2022;17(8):e0271225. doi:10.1371/journal.pone.0271225. [Google Scholar] [PubMed] [CrossRef]
24. Fan CM, Liu TJ, Liu KH. SUNet: swin transformer UNet for image denoising. In: 2022 IEEE International Symposium on Circuits and Systems (ISCAS). Piscataway, NJ, USA: IEEE; 2022. p. 2333–7. doi:10.1109/ISCAS48785.2022.9937486. [Google Scholar] [CrossRef]
25. Han M, Dang Y, Han J. Denoising and baseline correction methods for Raman spectroscopy based on convolutional autoencoder: a unified solution. Sensors. 2024;24(10):3161. doi:10.3390/s24103161. [Google Scholar] [PubMed] [CrossRef]
26. Hahner S, Iza-Teran R, Garcke J. Analysis and prediction of deforming 3D shapes using oriented 719 bounding boxes and LSTM autoencoders. In: Artificial Neural Networks and Machine Learning (ICANN 2020). Cham, Switzerland: Springer International Publishing; 2020. p. 284–96. doi:10.1007/978-3-030-61609-0_23. [Google Scholar] [CrossRef]
Cite This Article
 Copyright © 2026 The Author(s). Published by Tech Science Press.
This work is licensed under a Creative Commons Attribution 4.0 International License , which permits unrestricted use, distribution, and reproduction in any medium, provided the original work is properly cited.
 Downloads
 Citation Tools