
 Submit a Paper
 Propose a Special lssue
 Open Access
ARTICLE
A Hybrid Clique-Based Method with Structural Feature Node Extraction for Community Detection in Overlapping Networks
1 School of Artificial Intelligence and Computer Science, Jiangnan University, Wuxi, China
2 School of Continuing Education, Jiangnan University, Wuxi, China
3 China Ship Scientific Research Center, Wuxi, China
4 Amazon-Alexa Shopping, Seattle, WA, USA
* Corresponding Authors: Lixiang Zhang. Email: ; Wei Fang. Email:
Computers, Materials & Continua 2026, 87(1), 93 https://doi.org/10.32604/cmc.2025.073572
Received 21 September 2025; Accepted 29 December 2025; Issue published 10 February 2026
 View Full Text
 Download PDF
Abstract
Community detection is a fundamental problem in network analysis for identifying densely connected node clusters, with successful applications in diverse fields like social networks, recommendation systems, biology, and cyberattack detection. Overlapping community detection refers to the case of a node belonging to multiple communities simultaneously, which is a much more meaningful and challenging task. Graph representation learning with Evolutionary Computation has been studied well in overlapping community detection to deal with complex network structures and characteristics. However, most of them focus on searching the entire solution space, which can be inefficient and lead to inadequate results. To overcome the problem, a structural feature node extraction method is first proposed that can effectively map a network into a structural embedding space. Thus, nodes within the network are classified into hierarchical levels based on their structural feature strength, and only nodes with relatively high strength are considered in subsequent search steps to reduce the search space. Then, a maximal-clique representation method is employed on the given vertex set to identify overlapping nodes. A hybrid clique-based multi-objective evolutionary algorithm with decomposition method is designed to address cliques and the remaining unexplored nodes separately. The number of communities generated with this allocation method is closer to the actual partition count with high division quality. Experimental results on nine usually used real-world networks, five synthetic networks, and two large-scale networks demonstrate the effectiveness of the proposed methodology in terms of community quality and algorithmic efficiency, compared to traditional, MOEA-based, and graph embedding-based community detection algorithms.Keywords
Community detection is used to identify groups of nodes that have similar properties or functions, which is a challenging problem in network analysis [1]. Conventional community detection methods need comprehensive network information, including connectivity, properties, or labels. However, traditional methods, such as the Girvan-Newman algorithm [2], Louvain algorithm [3], and Infomap algorithm [4], are insufficient for community detection in networks characterized by complex structures or dynamic properties [5]. These traditional methods generate a large number of small or poorly defined communities, which can be difficult to interpret and not be useful in downstream analyses [6].
An overlapping network is a type of network in which nodes can belong to more than one community or group simultaneously, such as social networks, biological networks, and technological networks [7,8]. In social networks, for example, individuals may belong to multiple communities according to their interests, professions, or social connections [9]. In recent years, there has been a growing interest in the development of algorithms employing probabilistic modeling [10], graph partitioning [11], and deep learning [12].
To further improve the quality of community detection, the development of overlapping community detection methods based on multi-objective evolutionary algorithms (MOEA) has become an increasingly active research area [13–16]. Earlier MOEA-based methods typically optimized only an objective function, and thus had difficulty accurately capturing multiple community structures within a network [17]. Therefore, to address the increasing diversity of optimization problems, the use of multiple objective functions for community detection has been proposed. Multi-objective methods consider modularity, community density, and coverage, to enhance the global quality of the detected communities. However, MOEA-based algorithms exhibit high computational complexity, especially when dealing with large-scale networks, resulting in significantly increased computation times. The existing community detection methods are sensitive to the assumptions of the network representation and the model, which limits their applicability to specific contexts [8]. For example, MOGA-Net [13] is a multi-objective algorithm that employs locus-based representation, to identify high-quality communities that accurately reflect the underlying structure of a network. MOEA/D-Net [17] uses a decomposition-based approach to identify communities in networks, based on the principles of multi-objective optimization. Wen et al. [18] designed a maximal clique-based representation to identify highly overlapping communities by finding all maximal cliques in the network, which are complete subgraphs that cannot be extended by adding more nodes. The aforementioned methods are restricted by their different encoding and decoding techniques [19].
In recent years, many research papers have proposed several kinds of deep learning approaches for community detection due to their strong ability to learn nonlinear network properties, preserve complicated network structures with lower dimensional network embeddings, and detect communities more accurately [20]. Representative deep learning-based community detection approaches include Convolutional Network-based [21], Graph Convolutional Network(GCN)-based [22], Graph Attention Network-based [23], Generative Adversatrial Network-based [24], Autoencoder-based [7,25], Deep Sparse Filtering-based [26], and Deep Nonnegative Matrix Factorization-based [27]. Among them, GCN-based community detection has achieved great interest as it can aggregate node neighborhood information in deep graph convolutional layers to globally capture complex features [28]. GCNs provide a powerful, flexible, and modern deep learning framework for generating high-quality, inductive graph embeddings. Graphic embedding-based community detection methods have emerged as a promising alternative to traditional methods [29]. The graph embedding-based community detection methods aim to transform network data into a low-dimensional continuous vector space, enabling more effective community detection in complex networks. Existing graph embedding-based methods, such as DeepWalk [30], Node2vec [31], and LINE [32], which are shallow embedding, cannot always produce high-quality embeddings or provide satisfactory results for community detection. For example, the DeepWalk and Node2vec algorithms rely on random walks to generate node sequences, which may not accurately capture the global network structure. In addition, graph embedding methods are often limited by the quality and quantity of available network data, which can affect the accuracy and reliability of community detection results [33]. In the last two years, an increasing amount of research on graph decomposition-based community detection methods emerged. The CPGC method [22] leverages the idea of graph decomposition by modifying the graph convolution to combine representation learning and clustering, achieving improved community partition results. In the HAE algorithm [34], the non-negative factorization of the matrix is used to decompose the characteristics of the network, using the semantics obtained to assist in training an unsupervised community detection algorithm. These methods have validated the applicability of the graph decomposition approach in the field of community detection.
Based on the aforementioned intuitions, in the paper, a novel structural feature-based maximal clique MOEA/D algorithm, SFCMOEA, is proposed for the problem of overlapping community detection in networks. In SFCMOEA, a series of methods are presented that combine graph embedding-based methods, the maximal clique representation scheme, and the decomposition-based MOEA(MOEA/D) framework. The main contribution of this article can be summarized as follows.
(1) A structural node extraction method is proposed, where the graph embedding method [35] and the Minkowski distance calculation [36] are used to represent the structure of the network and the relationships between the nodes.
(2) A hybrid clique-based MOEA/D (HCMOEA) method is designed to optimize multiple objectives, with the aim of obtaining high-quality community partitioning results.
(3) Experiments are conducted on a series of synthetic and real-world networks of varying scales to demonstrate the usability and reliability of the SFCMOEA algorithm in addressing the community detection problem.
The remainder of the paper is organized as follows. Section 2 briefly introduces community detection problems and the framework of MOEA-based community detection methods. The SFCMOEA and its core components, including the SFNE method, the maximal-clique-based representation scheme, and the HCMOEA, are described in detail in Section 3. In Section 4, the performance of the proposed SFCMOEA is evaluated on synthetic and real-world networks, compared to six representative methods. Finally, the conclusions are presented in Section 5.
In this section, a more detailed explanation of concepts related to overlapping networks and the application of community detection algorithms is presented. Then the MOEA model of the community detection problem is given. Finally, the MOEA framework and the objective functions used are briefly reviewed.
2.1 Community Detection for Overlapping Networks
Overlapping networks are a type of complex network in which nodes can belong to multiple communities simultaneously, which often exhibit multiple affiliations or memberships [37]. Mathematically, an overlapping network can be represented as a graph
Community detection is the process of identifying groups of nodes that are densely connected within the group while having relatively few connections to nodes outside that group. In the context of overlapping networks, the goal is to identify communities such that each node can belong to one or more communities, depending on its connections and attributes. Overlapping community detection methods aim to identify overlapping communities within networks. Traditional methods, such as the clique percolation method (CPM) [38], and the local expansion and optimization method (LEOM) [39], are based on connections or attribute relationships among nodes in the network. These methods have some advantages in terms of interpretability and performance, but often suffer from scalability issues and are sensitive to network structures and parameter settings. In recent years, the Node Importance-Based Label Propagation Algorithm (NI-LPA) has been proposed to uncover logical partitions on real networks [40].
MOEA/D is effectively applied to community detection by formulating the problem as a multi-objective optimization problem (MOP). For community detection problem, optimizations targeting such as maximizing modularity, minimizing intercommunity edges, and ensuring balanced community sizes. The decomposition-based method, MOEA/D, allows simultaneous optimization of multiple subproblems. A simple illustration of MOEA/D is given in Fig. 1. In the figure, the orange nodes represent the initial population. Each orange point corresponding to the individual solutions evaluated according to two objectives,
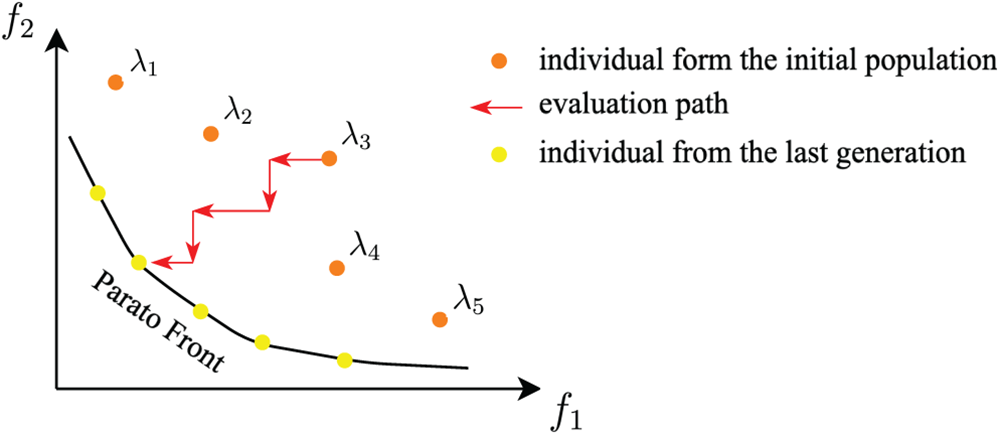
Figure 1: A simple illustration of the optimization process in MOEA/D
In the development of MOEA/D, Zhu et al. [41] used a locus-based representation in conjunction with the multiobjective community detection (MOCD) method to improve the quality of community partition results. Furthermore, Zhang et al. [42] introduced the concepts of macro- and micropopulation representations to obtain robust preliminary community structures. The framework of the MOEA-based community detection method is introduced. The common characteristic shared by the two methods mentioned above and earlier MOEA-based approaches is the presence of a representation step. In many studies, the representation step aims to retain the most important structural and topological characteristics of the network [17]. In order to better compatibility with MOEA-based techniques, complex networks can be transformed into more analytical forms, by means of dimensionality reduction, noise reduction, feature extraction, or conversion of network data into formats. Representation as a type of preprocessing step is important in improving the quality of network data and optimizing inputs for MOEAs [18].
In the MOEA framework, the selection of both the representation scheme and the objective functions is of significant importance. One of the chosen objective functions is the kernel K-means (KKM) function, which takes advantage of kernel functions to map network data to a higher-dimensional feature space. On the other hand, Ratio Cut (RC) is employed as another objective function because of its focus on achieving balanced and well-separated communities. A lower KKM value indicates a higher intralink density, while a lower RC value signifies a lower interlink density. The community detection problem can be formulated as a two-objective optimization problem by minimizing the KKM and RC objectives simultaneously [43].
3 Structural Feature Clique-Based MOEA
This section provides a comprehensive introduction to the proposed methodology, and the flowchart for the proposed method, SFCMOEA, is presented in Fig. 2. As can be seen in Fig. 2, there are mainly four steps in SFCMOEA, which are generating structured network information, extracting structural feature nodes, searching for maximal-cliques, and searching for non-dominated solution using hybrid maximal clique-based MOEA/D. For extracting structural feature nodes, graph embedding and Minkowski distance calculation are employed to represent the structure and relationships of nodes, thereby better revealing hidden community structures and preserving the network structure in the similarity matrix. A series of nonlinear functions is applied to the matrix to identify a set of structural feature nodes, where each node can represent a potential partition. Subsequently, an improved maximal clique search method is employed to identify all maximal cliques based on the its efficient search capability. In the HCMOEA, the populations formed by maximal cliques and nonclique nodes are processed separately. Individuals represented by maximal cliques are optimized, while non-clique nodes are allocated based on connection strength to existing communities. In SFCMOEA, nodes belonging to maximal cliques and those that do not are processed separately, which can not only improve search efficiency, but also achieve more accurate partitioning for non-clique nodes by incorporating the calculation of neighborhood similarity.
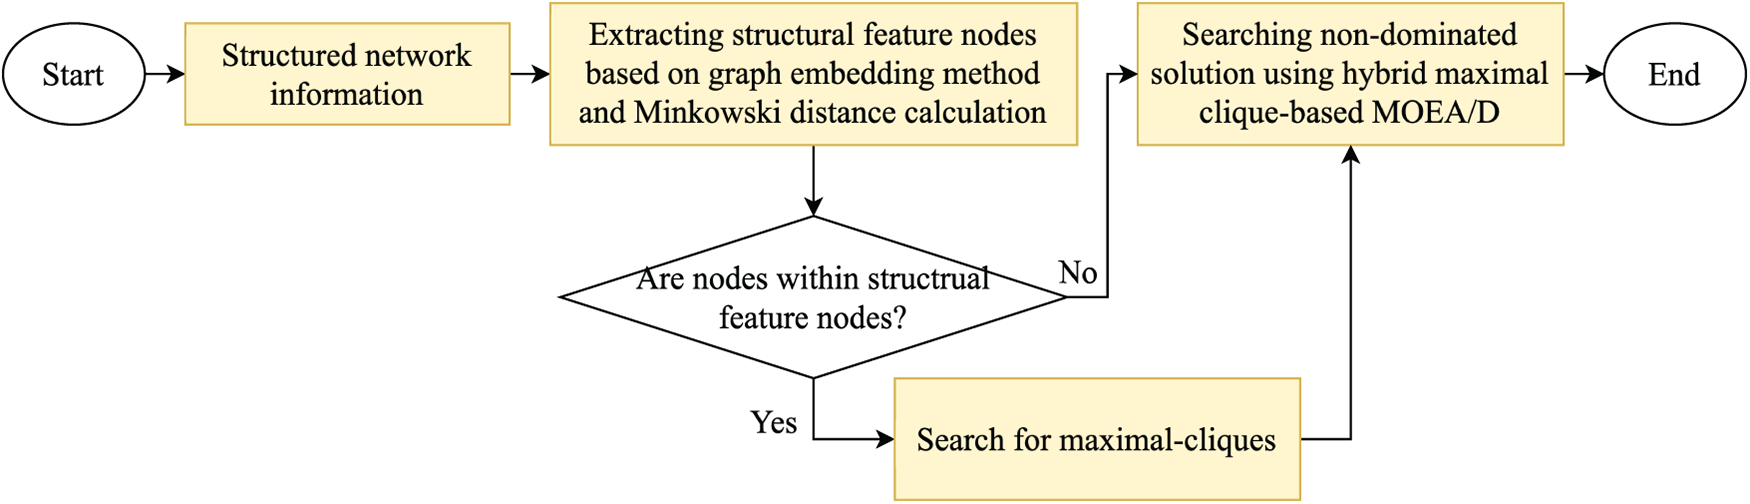
Figure 2: The flowchart of the proposed algorithm SFCMOEA
3.1 Structural Feature Node Extraction (SFNE) Method
The search process in an overlapping network space is often affected by isolated nodes and hidden communities, leading to a decrease in search efficiency. To overcome this problem, the challenge is to map the high-dimensional network space onto a lower-dimensional space while preserving the information about the network structure. In addition, it is important to maintain the consistency of the network structure during subsequent search processes and to effectively handle isolated nodes and hidden communities. Thus, a method that can accurately preserve the network structure while considering isolated community structures is needed. A method named structural feature node extraction (SFNE) is proposed, as presented in Algorithm 1, which encodes connectivity relationships between nodes using graph embedding and similarity computation methods. The input to Algorithm 1 is a structural embedding matrix
where
To more directly illustrate the process of the SFNE method, the graph embedding process and the calculation of node connections based on the original graph G are presented in Fig. 3 from the original graph G. Fig. 3a represents a network with 13 nodes and 18 edges. By applying the struc2vec algorithm, a multidimensional embedding space is obtained, and each node is mapped to the embedding space, resulting in Fig. 3b. In the embedding space, each element describes the position and features of a node within the graph. Structurally similar nodes, with weaker colors, are embedded in similar positions. Fig. 3c shows the similarity matrix obtained by applying the Minkowski distance formula in the embedding space. More closely connected nodes tend to have higher weights, whereas isolated nodes are also assigned weights. In the graph, node 13 is an isolated node, while nodes {3, 5, 9} are closely connected. Nodes {3, 5, 9} tend to have higher weights and are more likely to be assigned to multiple communities, leading to the phenomena of overlap.
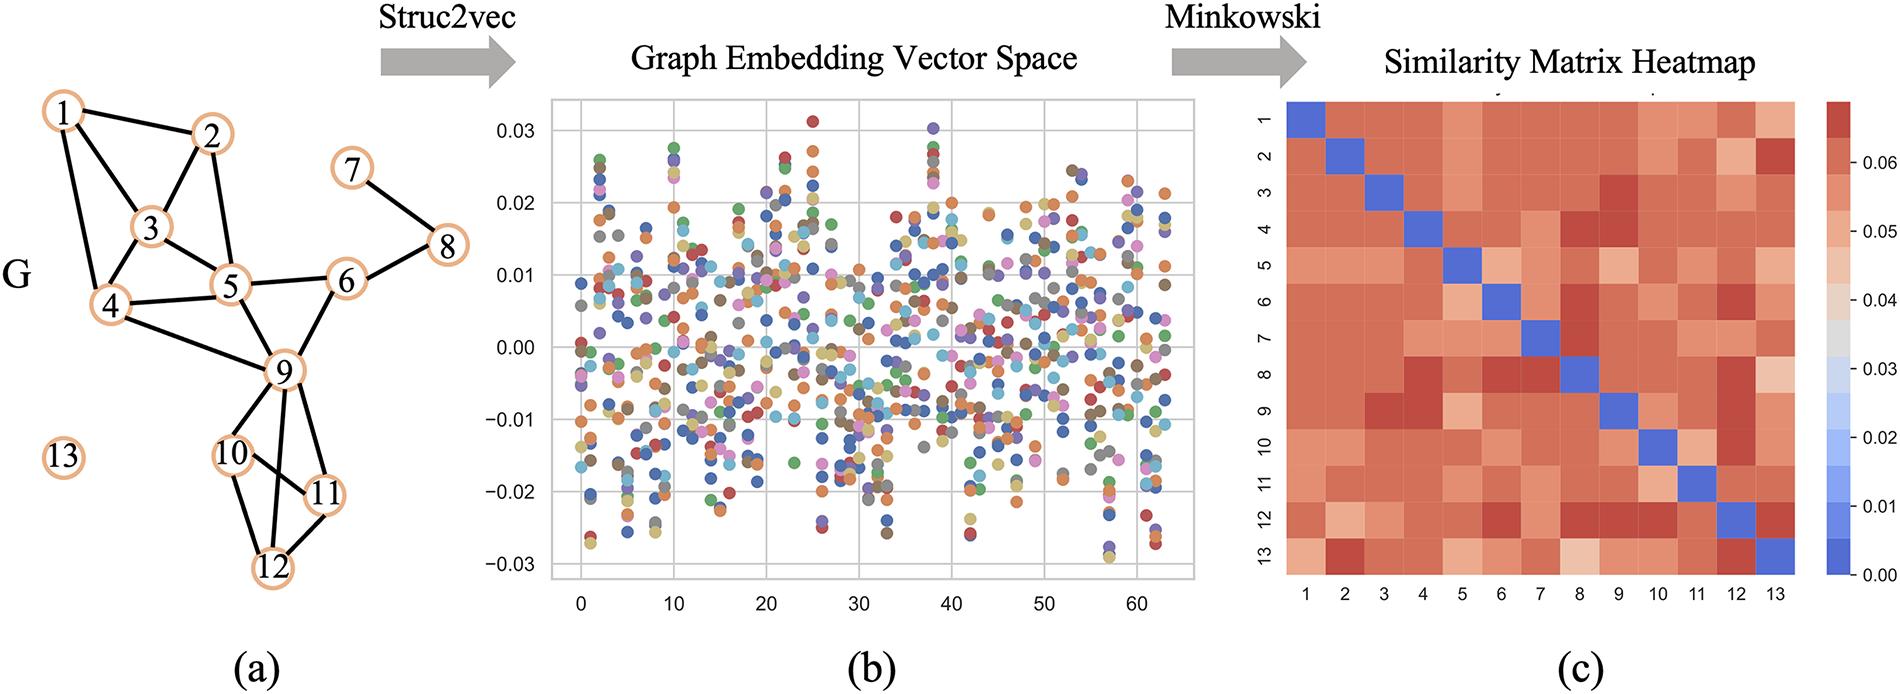
Figure 3: Illustration of the SFNE method, which includes transforming a network into embedding space vectors and then converting these vectors into a node similarity matrix. (a) Original network with 13 nodes and 18 links. (b) Space vectors calculated by the struc2vec algorithm, and different colors represent points of different dimensions. (c) The node similarity matrix, calculated using the Minkowski distance, represents each element as the position and features of a node within the graph, with darker colors indicating stronger structural features
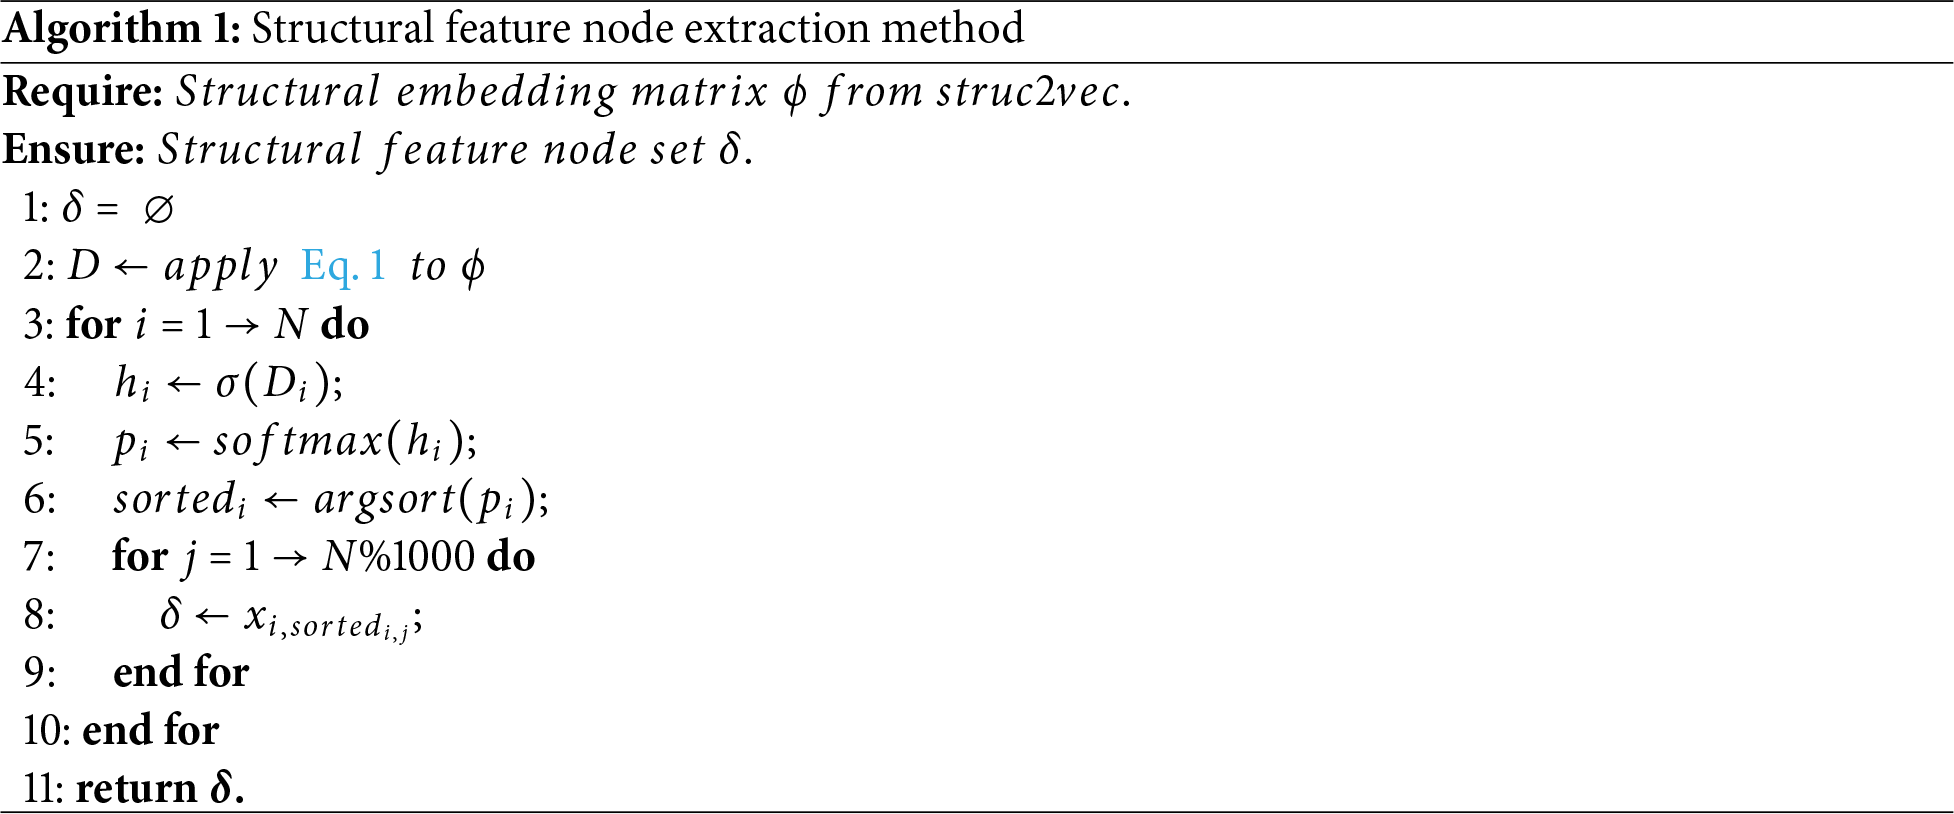
On line 2 of Algorithm 1, the node distance matrix D is obtained by applying Eq. (1) to
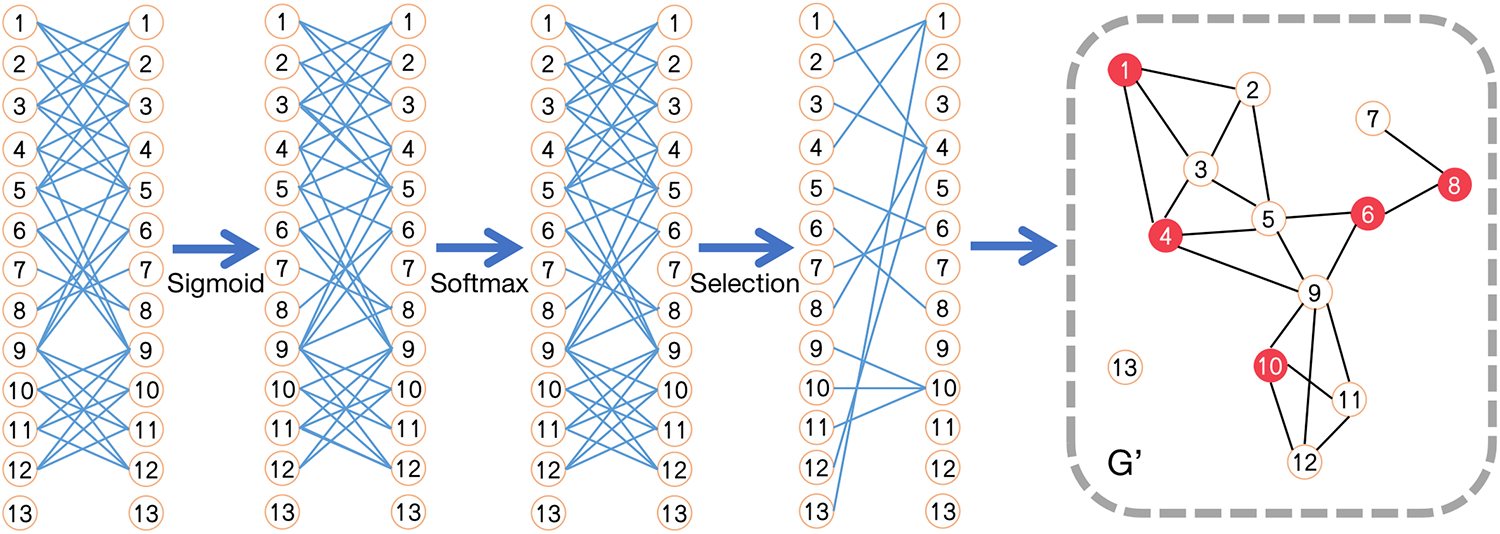
Figure 4: Application of the SFNE method to graph G in Fig. 3c, generating graph
Fig. 4 illustrates the procedure of the SFNE method, with graph G as an example. Applying the sigmoid and softmax functions on the matrix D, the probabilities of each node belonging to all other nodes are obtained. Afterwards, each node has
After obtaining the set of structural feature vertex, the next step is to apply the representation scheme. Taking into account both efficiency and search accuracy, the maximal-clique algorithm [18] is chosen here. A detailed description of the maximal clique algorithm is shown in Algorithm 2; on line 1, an empty set
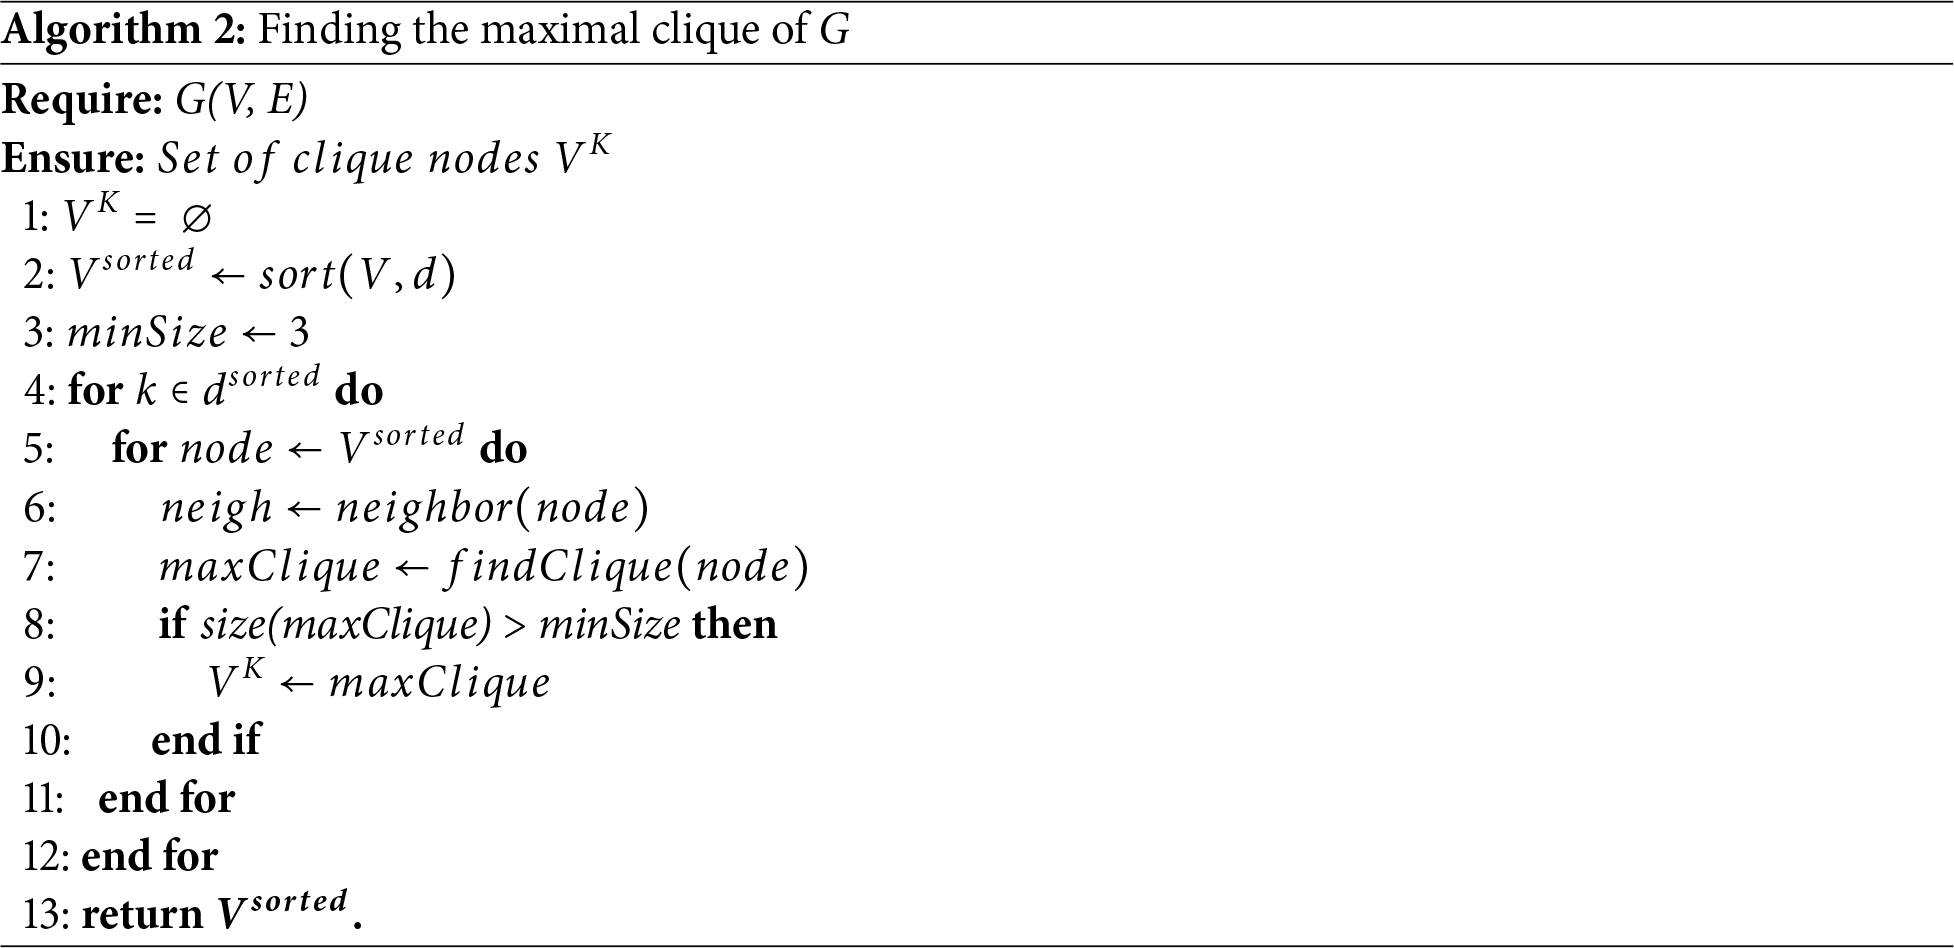
Then the unvisited nodes are each iteratively selected as the next candidate node in reverse order node degrees
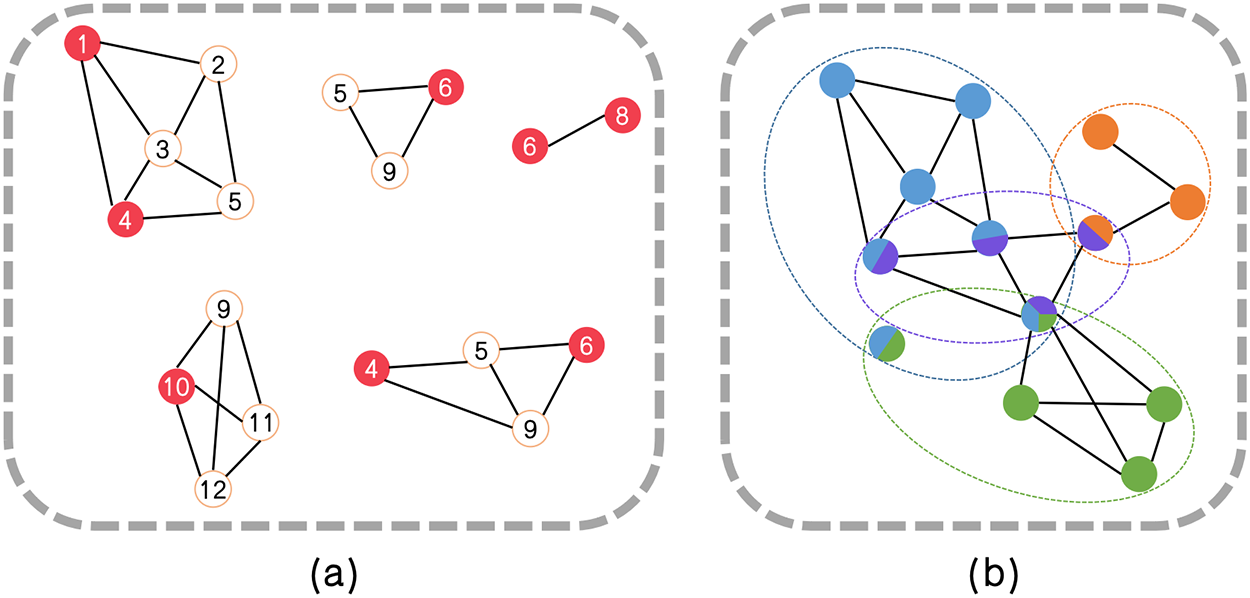
Figure 5: Example of the maximal cliques and final partitioning results. (a) The maximal cliques obtained by searching in G′ starting from the red structural feature nodes. (b) The final partitioning results obtained through SFCMOEA with four distinct communities in four colors. Four overlapping nodes, with one node belonging to a maximum of three communities is presented
Compared with the MOEA step, preparatory work is performed to compute the weights to quantify the individuals in the clique structure. Once the clique are obtained, each clique in Fig. 5a is treated as an individual. The weights between individuals are calculated, and two cliques merge if the combined weight exceeds that of the individual cliques. The weight, also called the link strength, is defined on the basis of the interrelation between the internal and external nodes.
As seen in Eq. (2), both the number of intercommunity edges and the average number of edges are utilized to assess
The calculated link strength W is used to determine whether two cliques should be merged as follows:
In the definition of T, the maximal clique graph is treated as a weighted network, where
As described in the following subsection, the proposed hybrid clique-based MOEA/D (HCMOEA) method is specifically designed to operate on clique-structured individuals, providing advantages over traditional techniques in terms of maintaining structural integrity and enhancing diversity. As illustrated in Fig. 5a, each maximal-clique in a graph is a complete subgraph in which every node is connected to every other node. Considering the clique structure, we divide the algorithm into two parts: the clique-based optimization step and the community allocation method. The aim is to maximize the advantages offered by tightly connected links within the discovered cliques.
3.3.1 Clique-Based Optimization
In the HCMOEA, the proposed crossover and mutation operations are designed to preserve the maximal-clique structure of individuals while effectively increasing diversity. Here, the two parental individuals
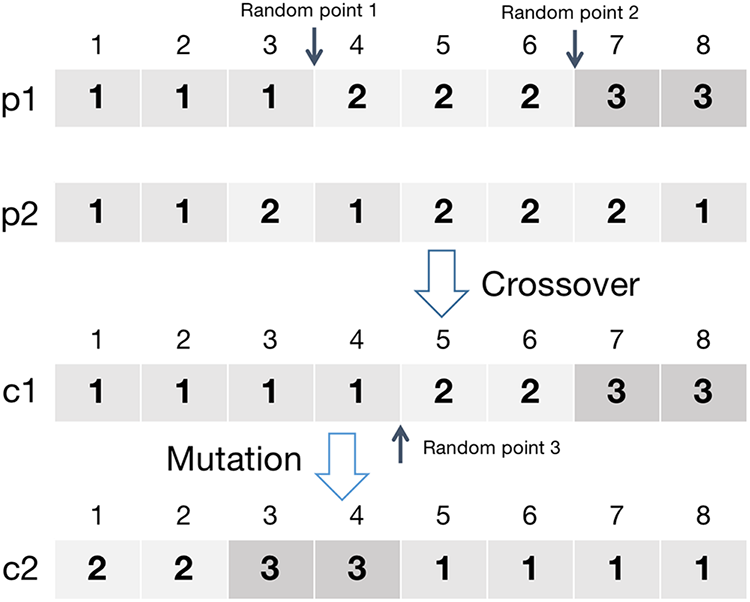
Figure 6: Example of the clique-based optimization process
As shown in Fig. 6, a mutation point is selected from the offspring obtained in the crossover step. The genes on both sides of the mutation point, namely
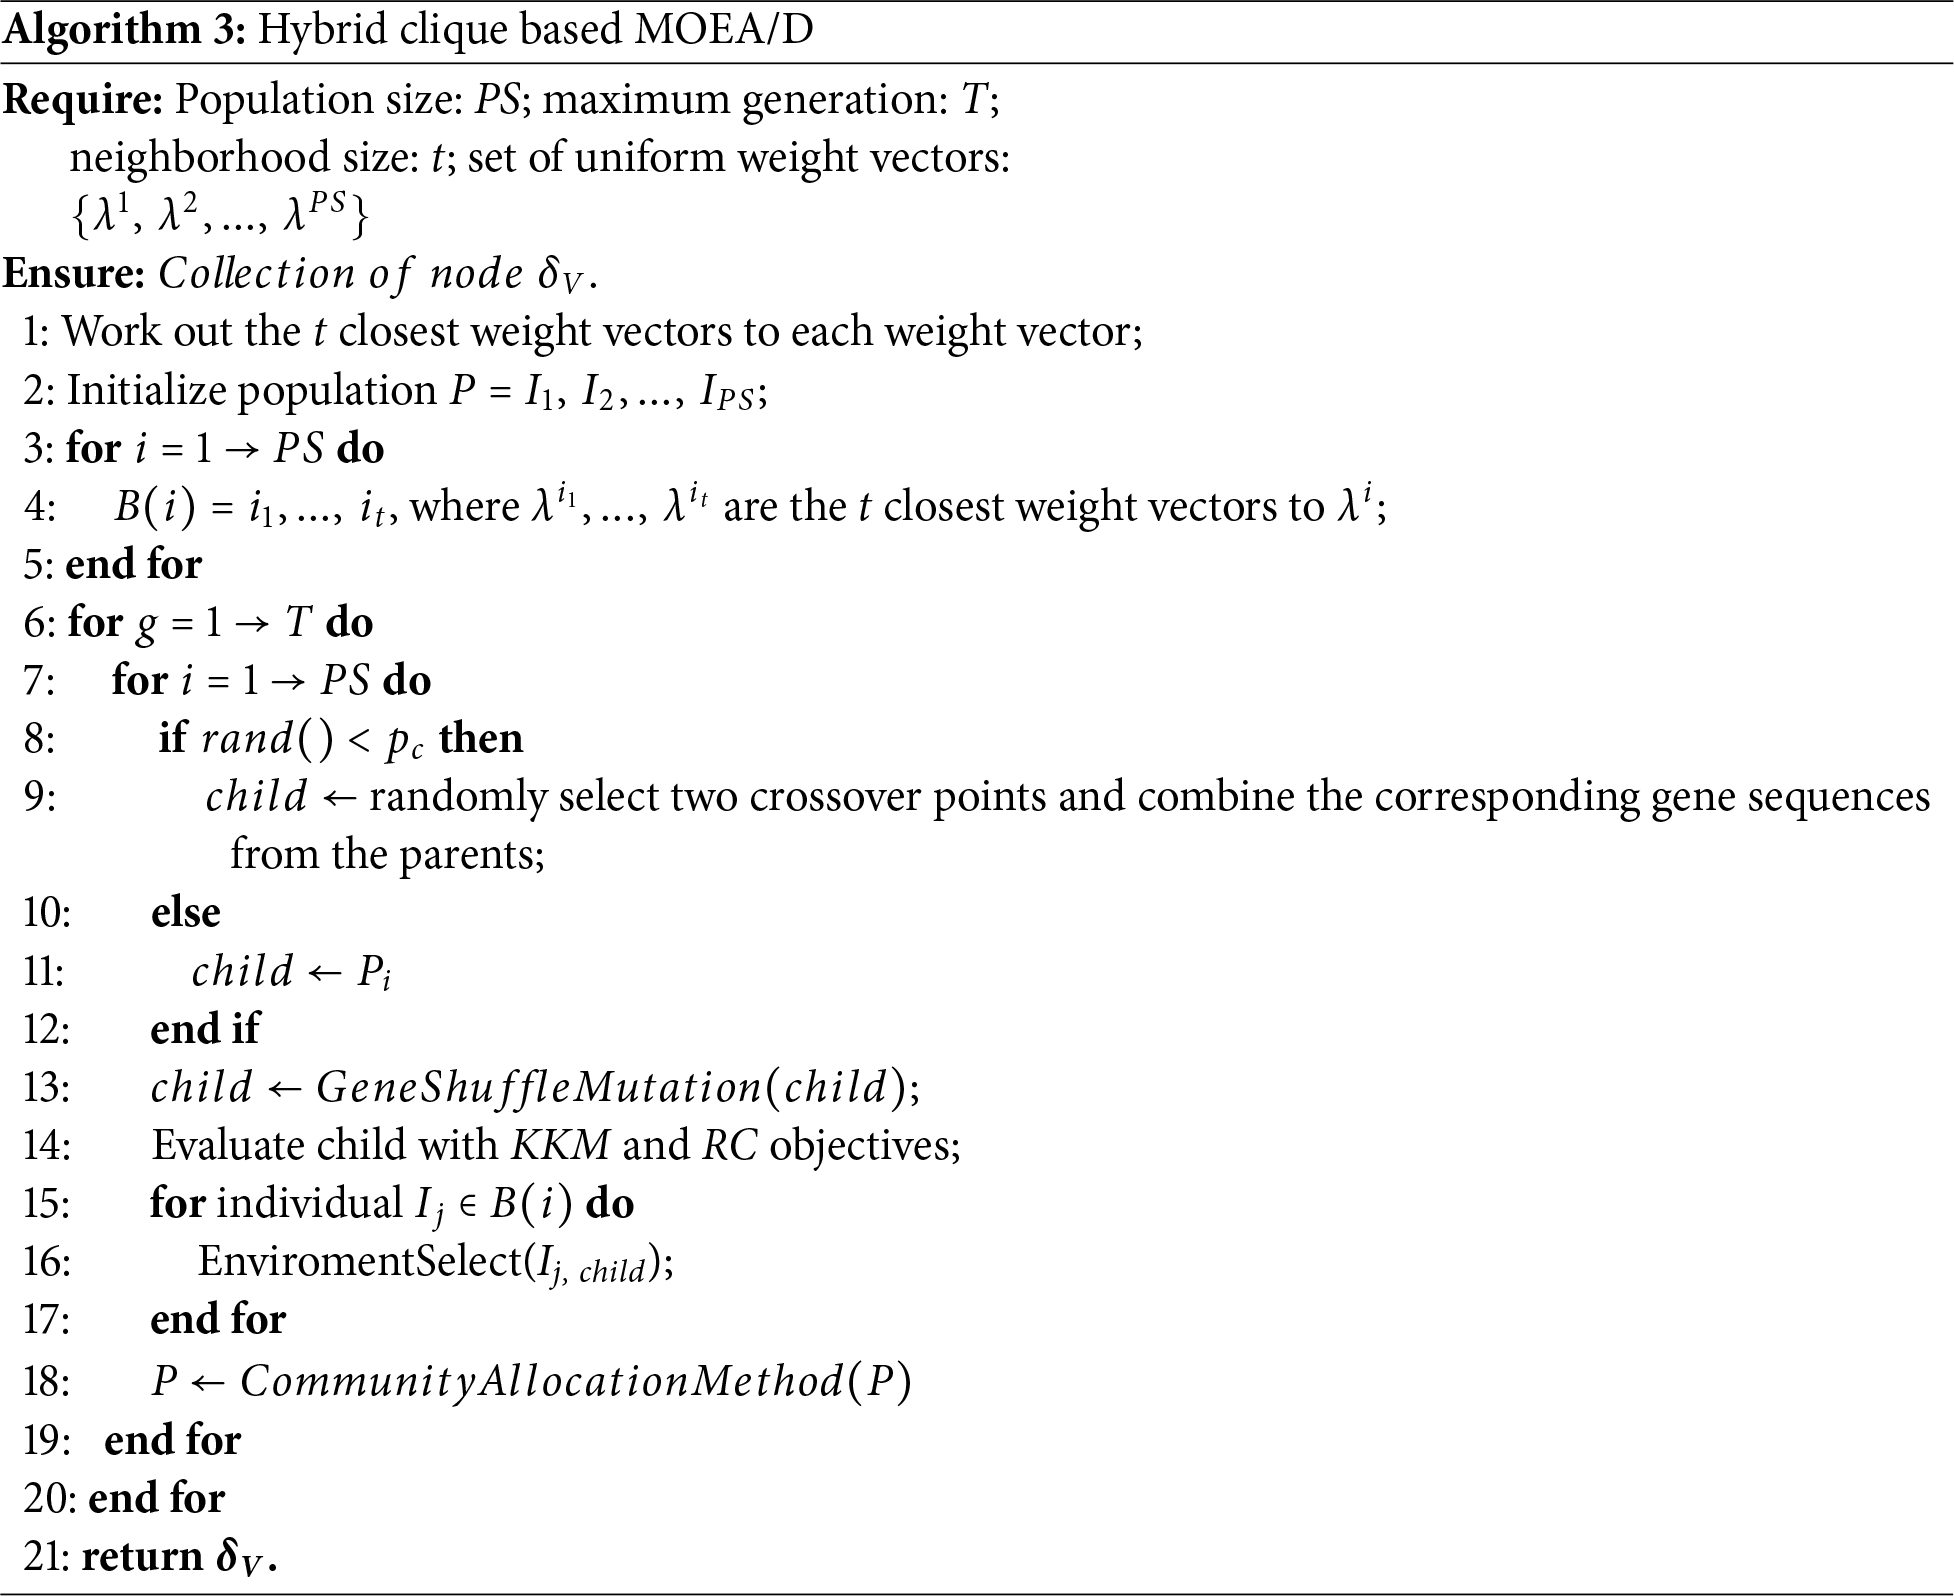
Regarding the objective functions, the kernel K-means(KKM) [45] and Ratio Cut(RC) [46] function are chosen. The KKM and the RC values of community C are calculated as:
where
3.3.2 Community Allocation Method
Through the clique-based optimization process, a series of internally densely connected structures with sparse external links are obtained. The next step is to assign the remaining nodes to the existing structures. The communities of isolated nodes and nodes within cliques with a size smaller than 3 are determined using the community allocation method. For example, in Fig. 5, the node
where
In this section, the experimental results obtained by applying the proposed algorithm to real-world networks and synthetic benchmark networks are presented.
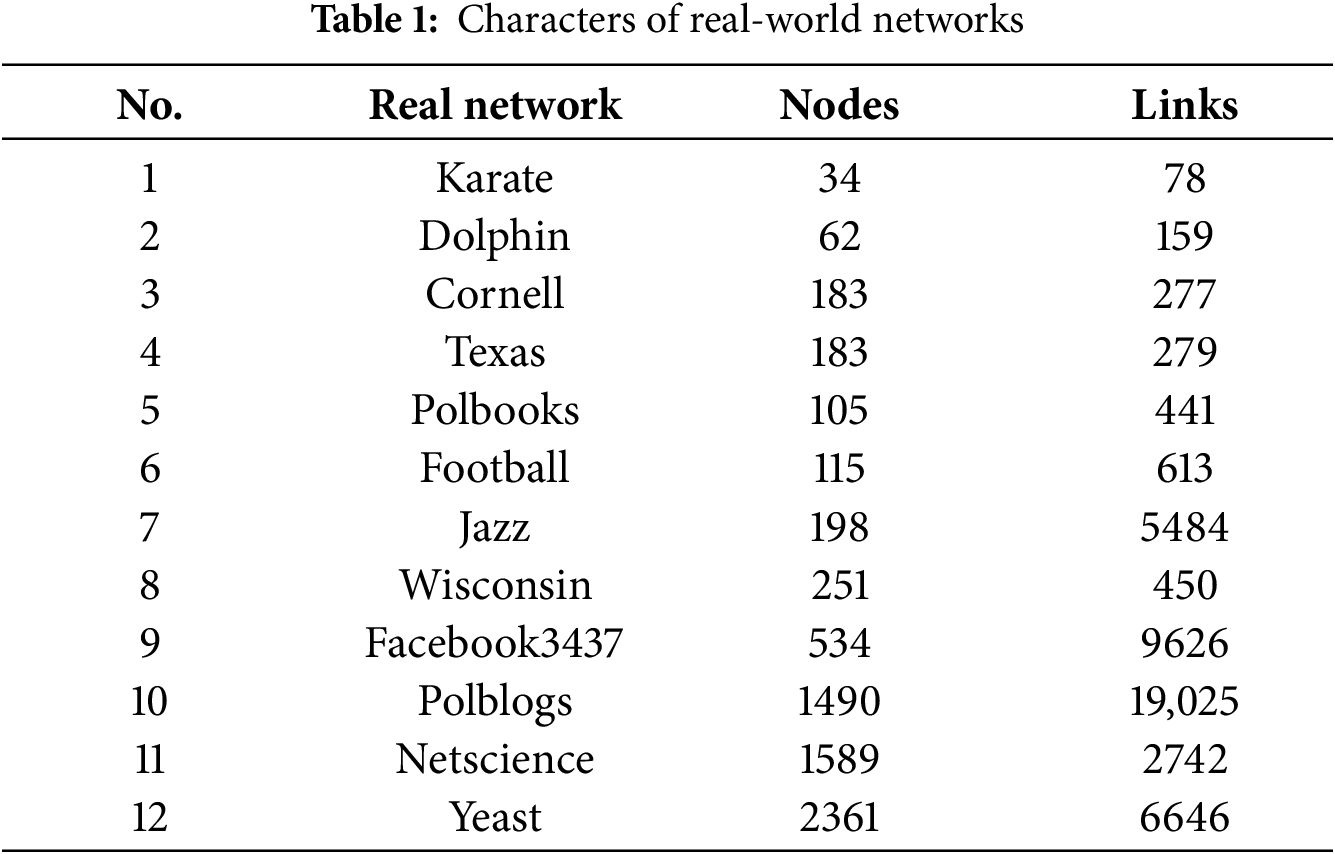
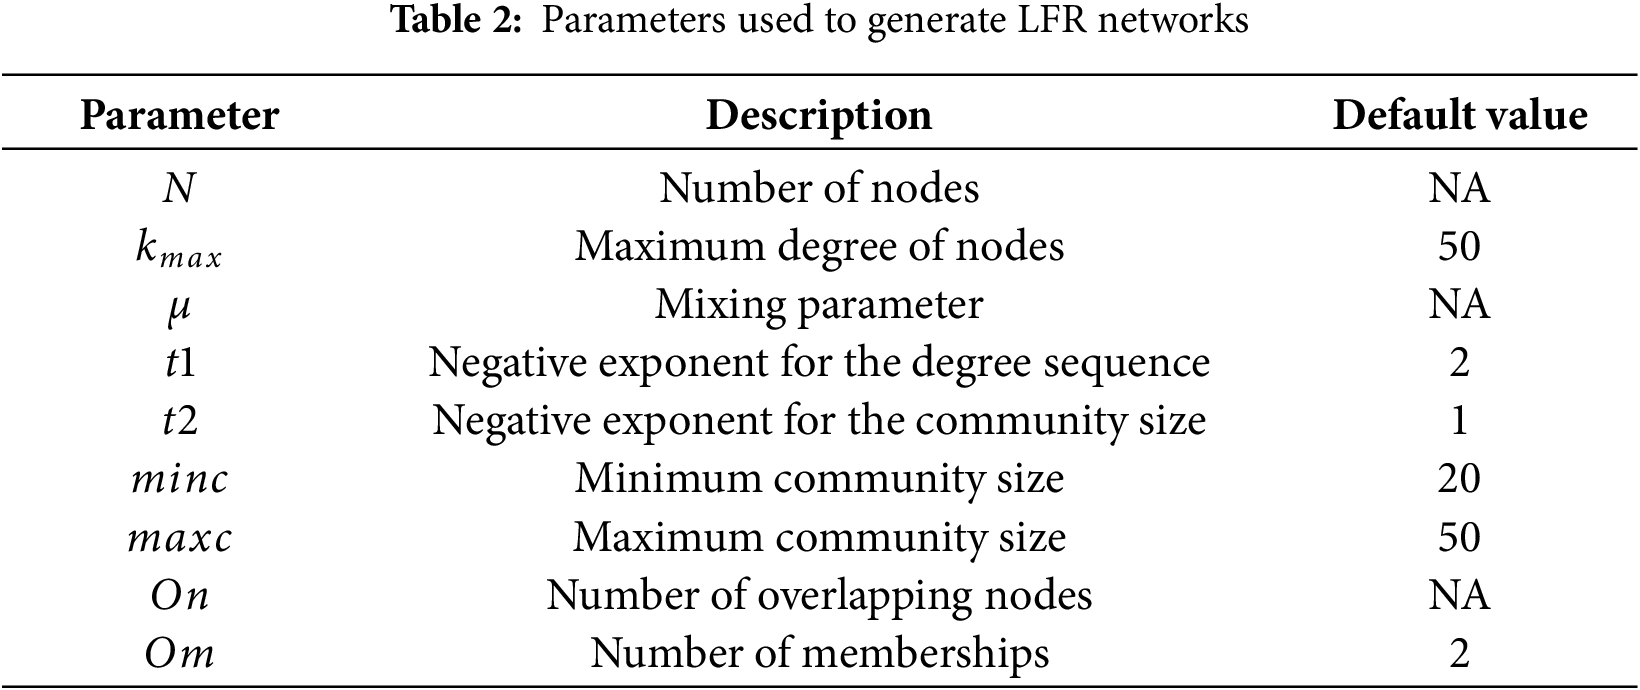
In Table 1, nine real-world networks with different numbers of nodes and links are presented. The smallest-scale network comprises only 34 nodes, whereas the largest-scale network comprises more than 2000 nodes. In addition, the ratio of nodes to edges varies significantly between the different networks. For the generation of synthetic networks, Lancichinetti Fortunato Radicch (LFR) is a benchmark network model to evaluate community detection algorithms [47]. The LFR model is commonly used to evaluate community detection tasks because it can generate synthetic networks with known community structures [48]. The LFR model allows for adjustment of parameters such as the number of nodes, average node degree, maximum node degree, mixing parameter, community size distribution, and number of overlapping nodes to generate networks that simulate various real-world scenarios. Multiple parameters enable researchers to analyze the performance of community detection methods under different conditions. Table 2 lists the various parameters considered: N; the average node degree
4.2 Compared Algorithms and Performance Evaluation Indices
To fully demonstrate the advantages and comprehensiveness of the proposed algorithm, MOEA-based methods, graph embedding-based methods, and traditional methods are taken in comparison. In the realm of graph embedding techniques, several benchmark algorithms are considered for comparison, including LINE [32], Node2vec [31], DeepWalk [30], and Word2vec [49]. The mentioned graph embedding-based methods all require pre-configuration of the number of communities. Subsequently, the speaker-listener label propagation algorithm (SLPA) [50] is used as a traditional method of detecting communities by simulating the propagation of information among nodes. For MOEA-based community detection algorithms, MCMOEA [18] and MEAs_SN [51], leverage the MOEA approach to simultaneously optimize multiple objectives. Furthermore, NCMOEA integrates concepts from both MOEA and graph embedding [52]. In the NCMOEA framework, the nodes in a network are categorized into two types: candidate central (CC) nodes, which are more likely to serve as community centers, and noncentral (NC) nodes, which are less likely to be central. To effectively represent these different node types, NCMOEA employs a mixed representation scheme.
In terms of experimental settings, for the traditional and graph embedding-based methods, the parameter configurations is recommended in their respective articles. For MOEA-based methods, a common parameter setup is applied, with a population size (PS) of 100 and a maximum generation count (
Extended modularity Q and NMI have been selected as alternative evaluation metrics. The main reason for using Extended Modularity Q as an evaluation metric in the community detection problem is its ability to accurately measure the quality and cohesion of community structures [53]. Q is computed on the basis of the node assignments in the network and evaluates the degree of separation within communities as follows:
where
The reason for using NMI as an evaluation metric for community detection is that it serves as a measure of the similarity between the clustering results and the true community structure [54]. NMI is calculated as follows:
where C represents the community results,
4.3 Experiment Results on Real-World Networks
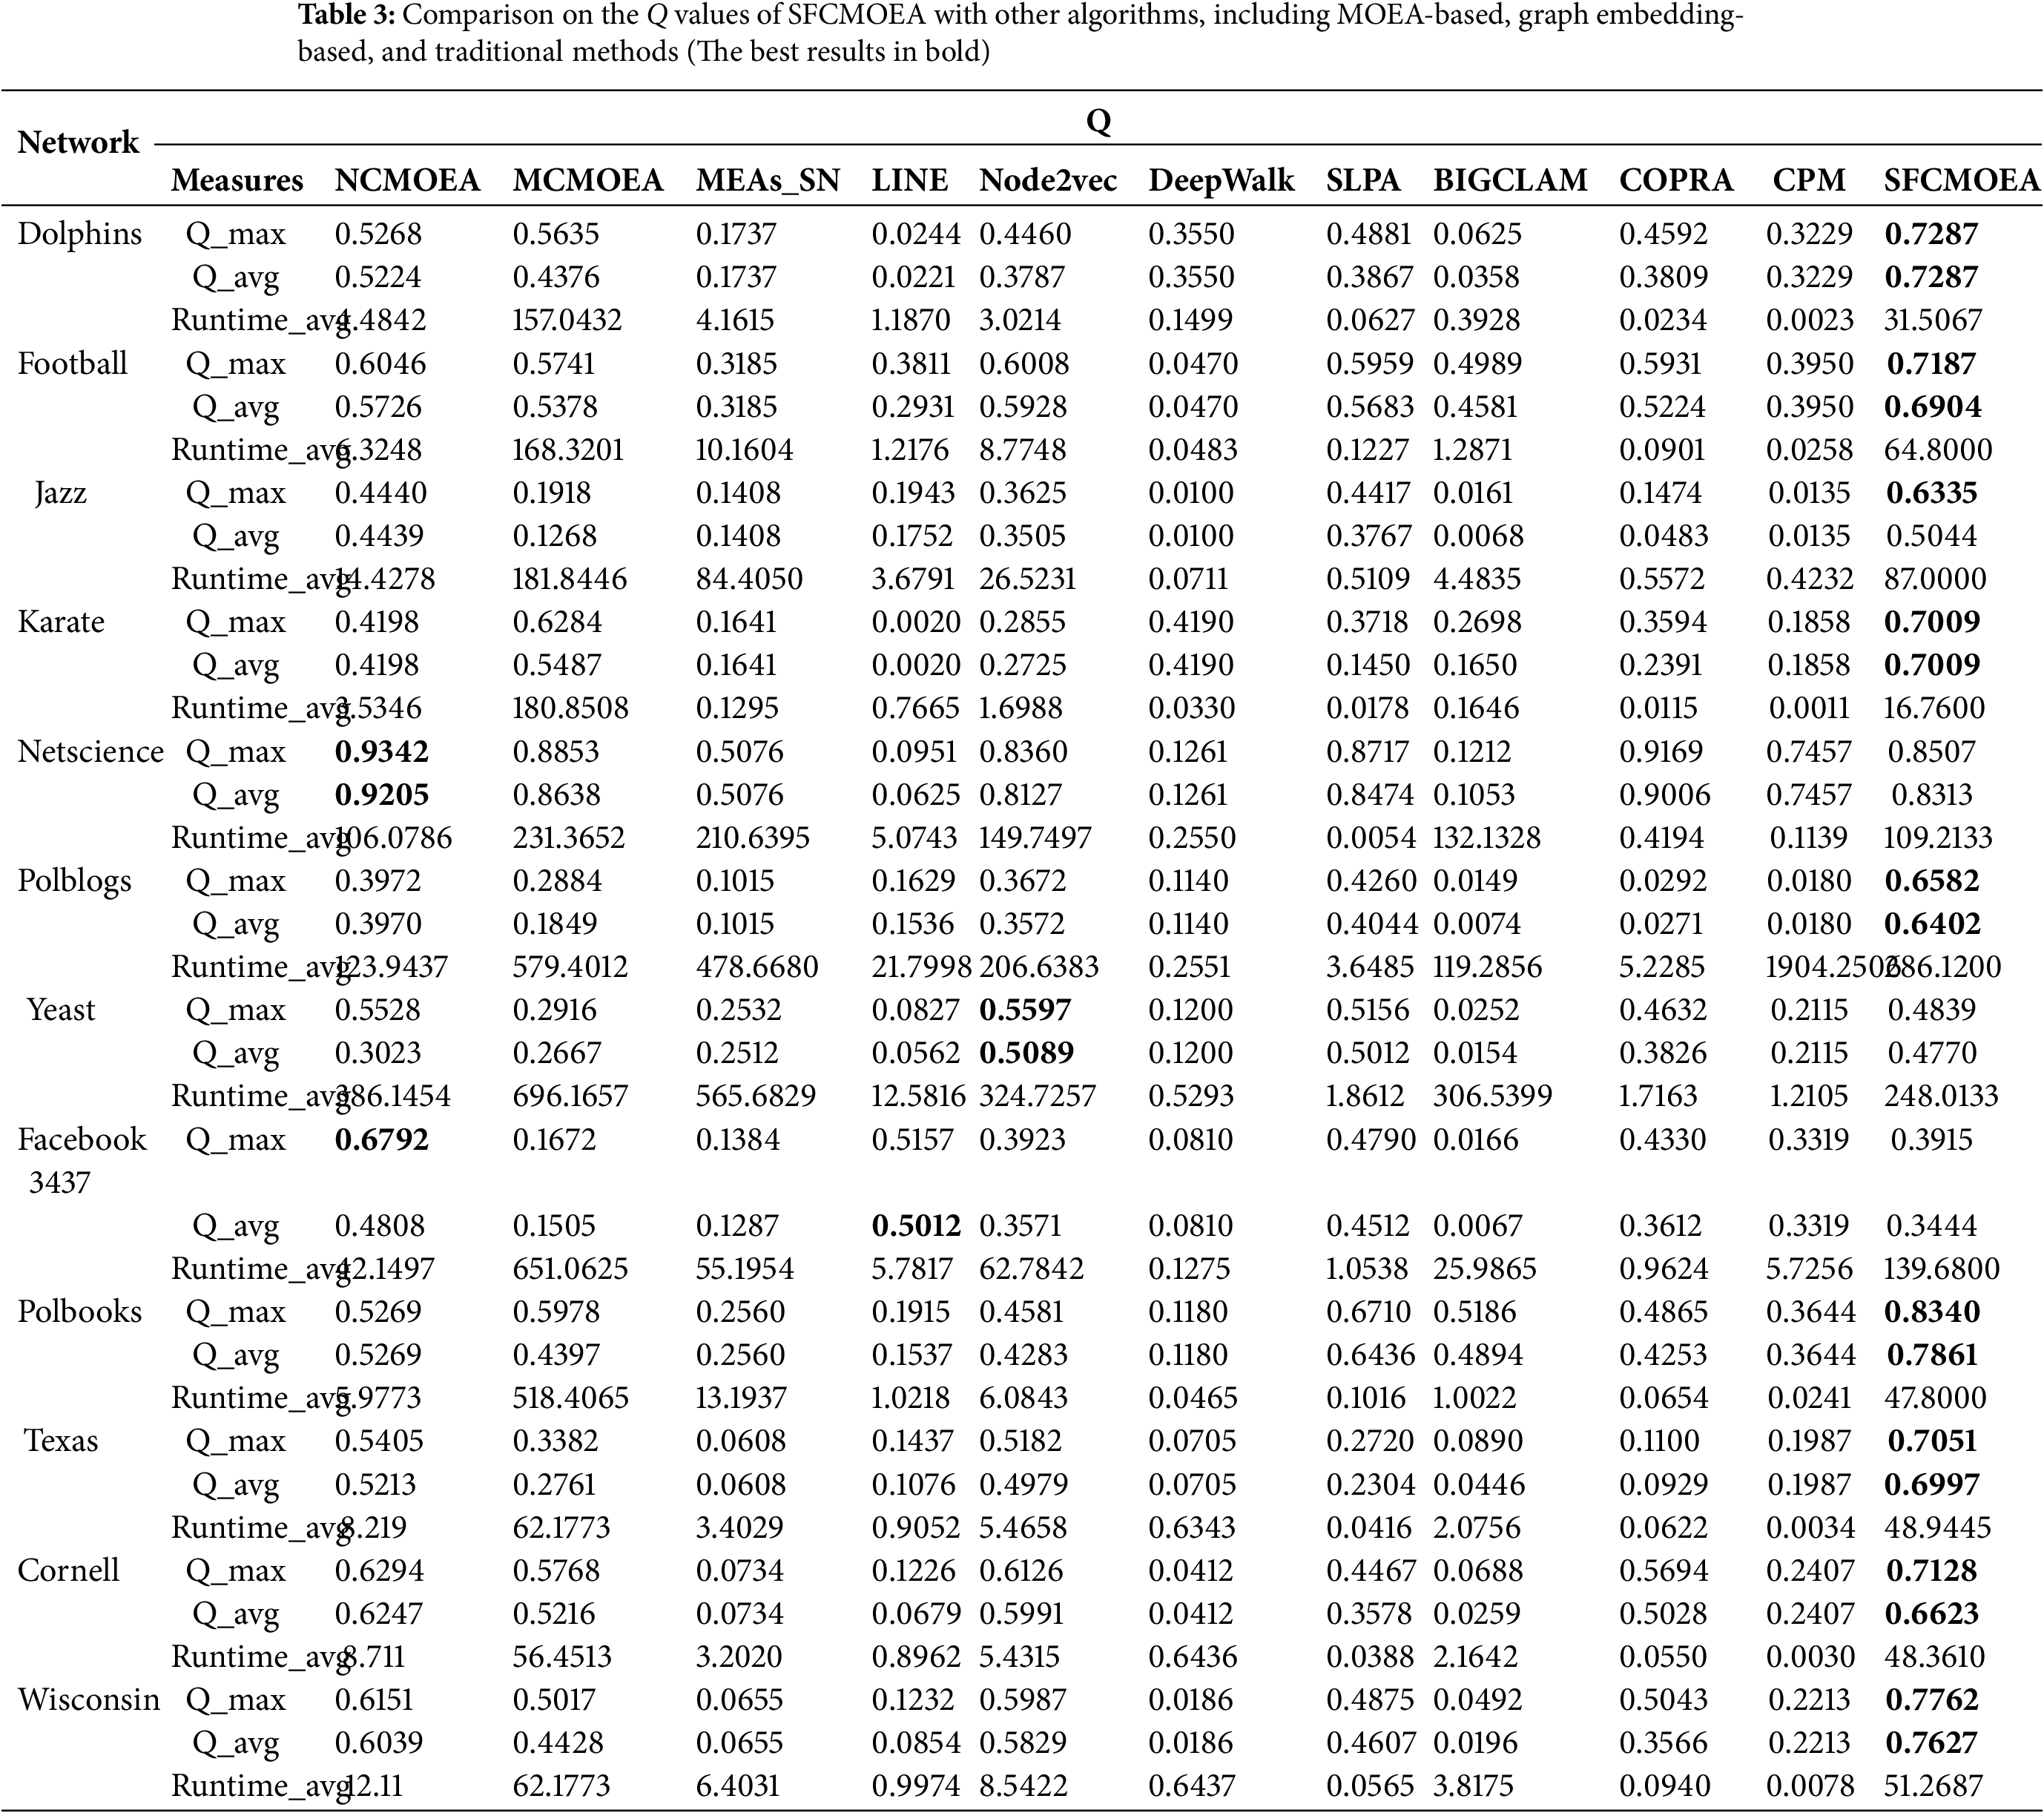
For the 12 real-world networks, NCMOEA, MCMOEA, MEAs_SN, LINE, Node2vec, DeepWalk, BIGCLAM [56], COPRA, and CPM are compared to SFCMOEA in terms of Q and
4.3.1 Experimental Results in Terms of Q
In the experimental results shown in Table 3, SFCMOEA algorithm achieves excellent results in terms of its Q values. For nine out of 12 networks, SFCMOEA outperforms other algorithms in terms of maximum and average values of Q (
Furthermore, the performance of the SFCMOEA algorithm can be further evaluated by examining the Pareto front. For MOEA-based community detection algorithms, a good quality of the generated communities corresponds to the objectives of maximizing
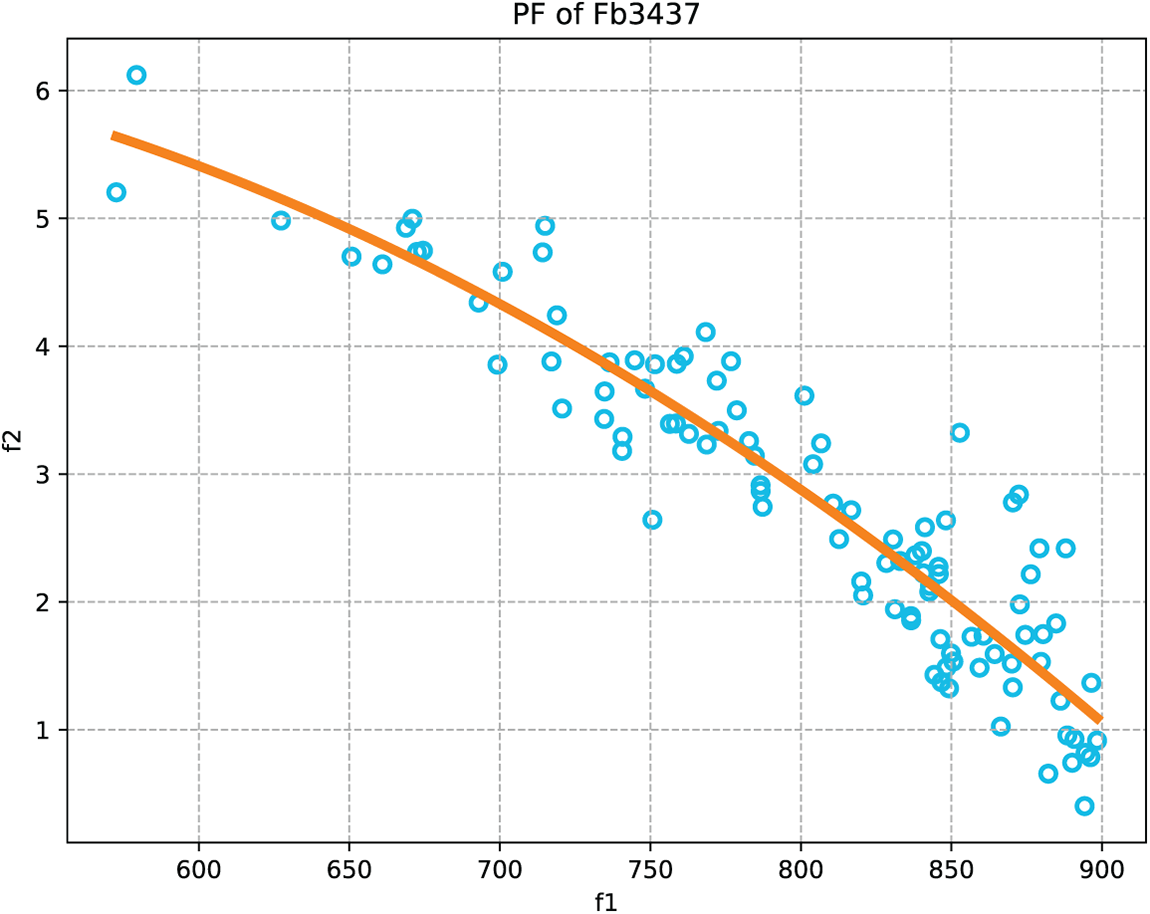
Figure 7: Illustration of the mapping of the Pareto Front (
Furthermore, Fig. 8 presents the results obtained by running SFCMOEA on the Football network. From the figure, it can be observed that 7 communities are discovered in the network, differentiated by different colors. Each partitioned result exhibits strong internal connections while the external connections remain sparse, consistent with the objectives of community detection tasks.
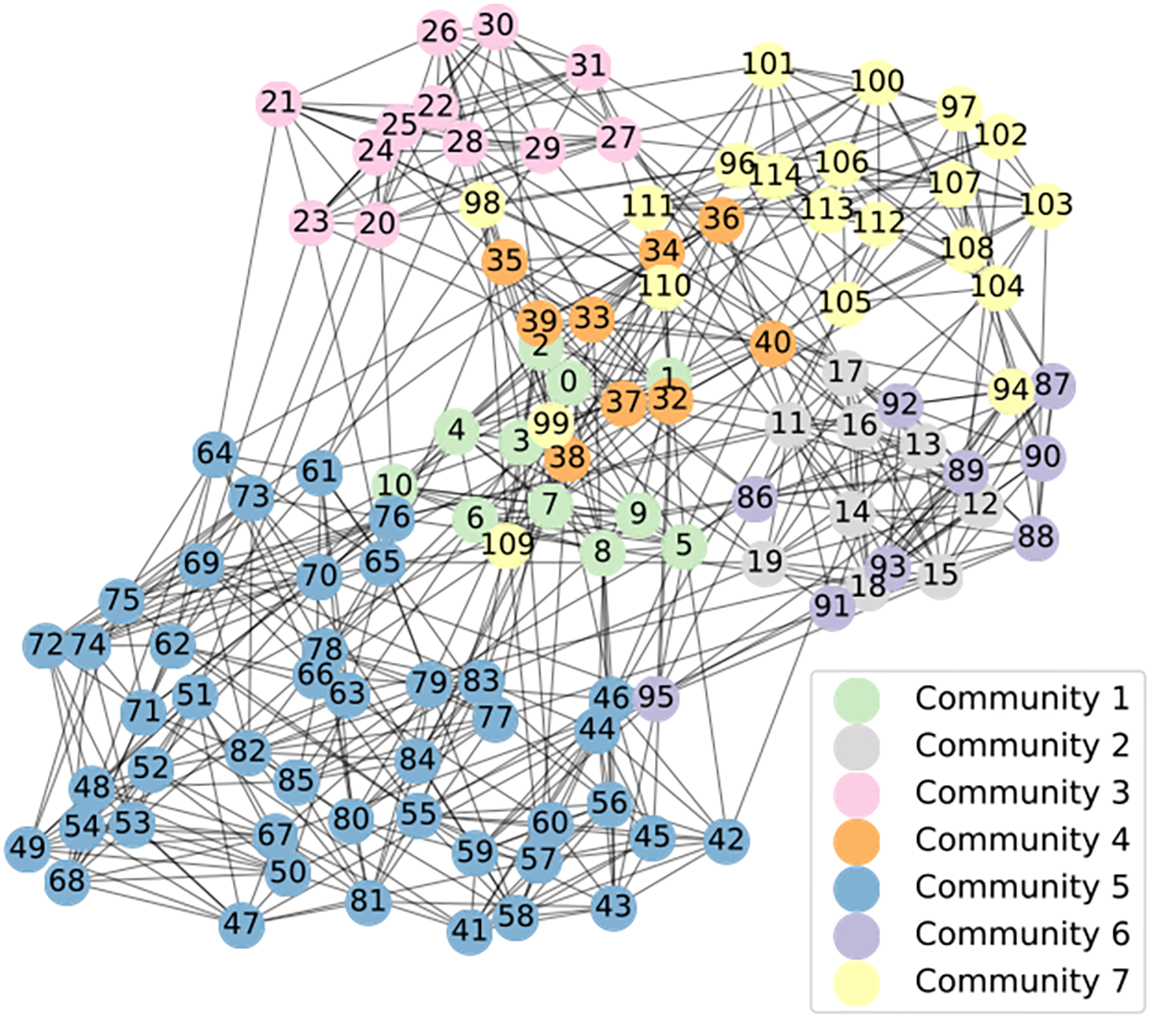
Figure 8: Community detection results obtained by applying SFCMOEA to the Football network where different colors represent different communities
4.3.2 Experimental Results in Terms of Runtime
In terms of runtime, SFCMOEA is at a moderate level in most networks in terms of average runtime
4.4 Experiment Results on Synthetic Networks
The parameters used to construct the LFR networks for these experiments are presented in Table 2. There are a total of nine distinct parameters, of which six parameters have been set to their default values as listed in the table. The remaining parameters N,
In Fig. 9, compared to the other algorithms, SFCMOEA performs better on datasets characterized by a high degree of community overlap and a larger scale. As the network becomes more complex, other algorithms show a significant decrease in performance, whereas the performance of SFCMOEA remains stable. In the case of sparse networks, both the SLPA and Node2vec algorithms are close to the SFCMOEA. From the perspective of community partitioning, SLPA and Node2vec algorithms generate more number of community structures. Interestingly, as the network scale increases, the performance of the NCMOEA algorithm actually improves. In general, in terms of evaluating the results of network construction, graph embedding-based methods may exhibit some limitations.
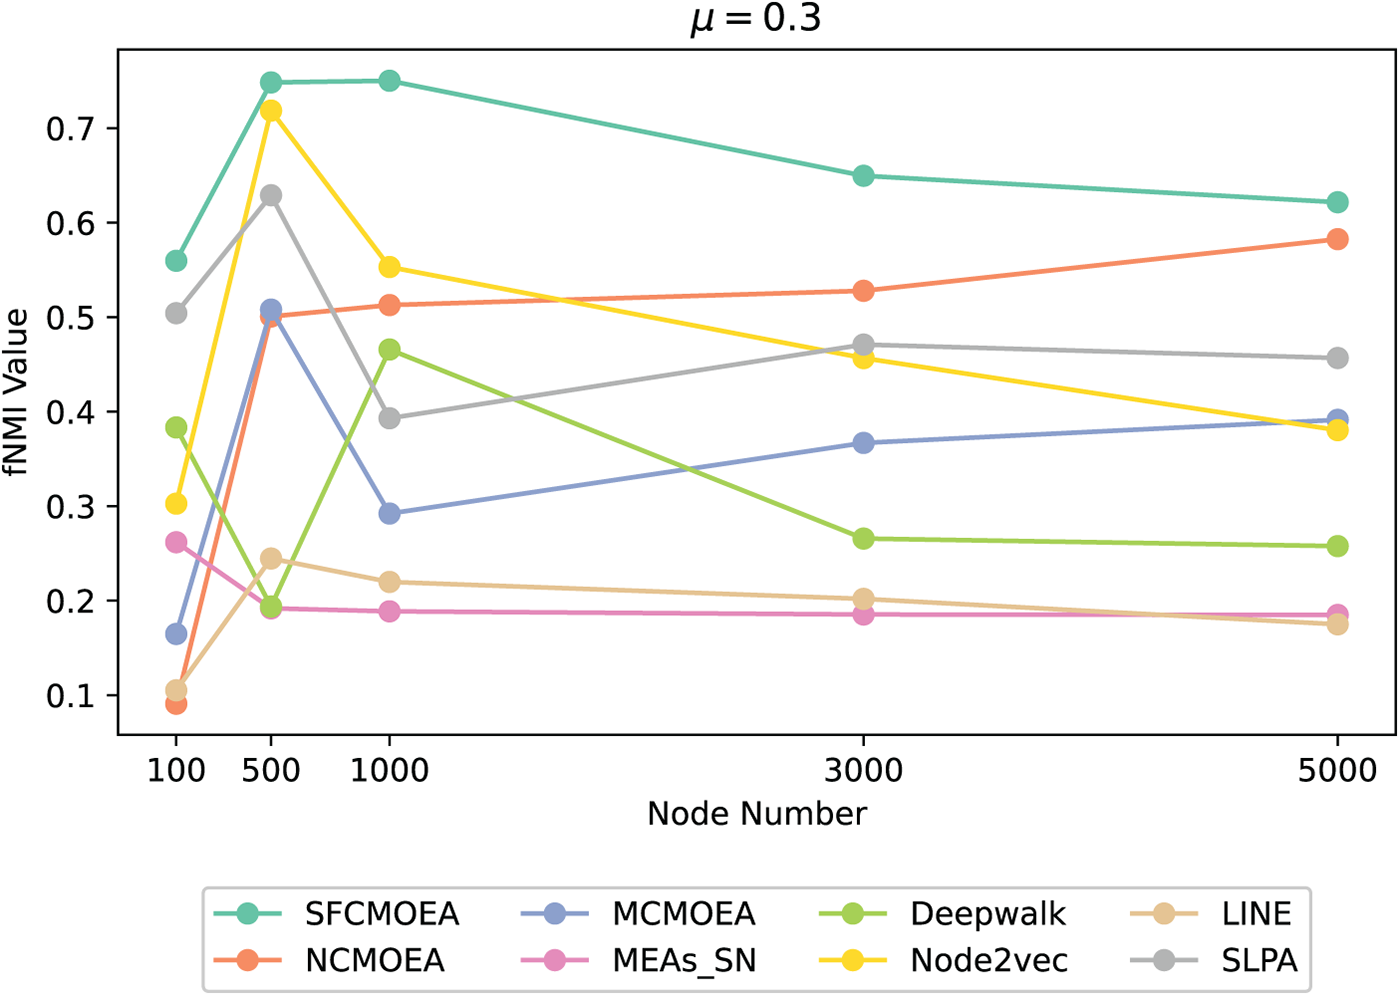
Figure 9: Example results of eight algorithms based on the
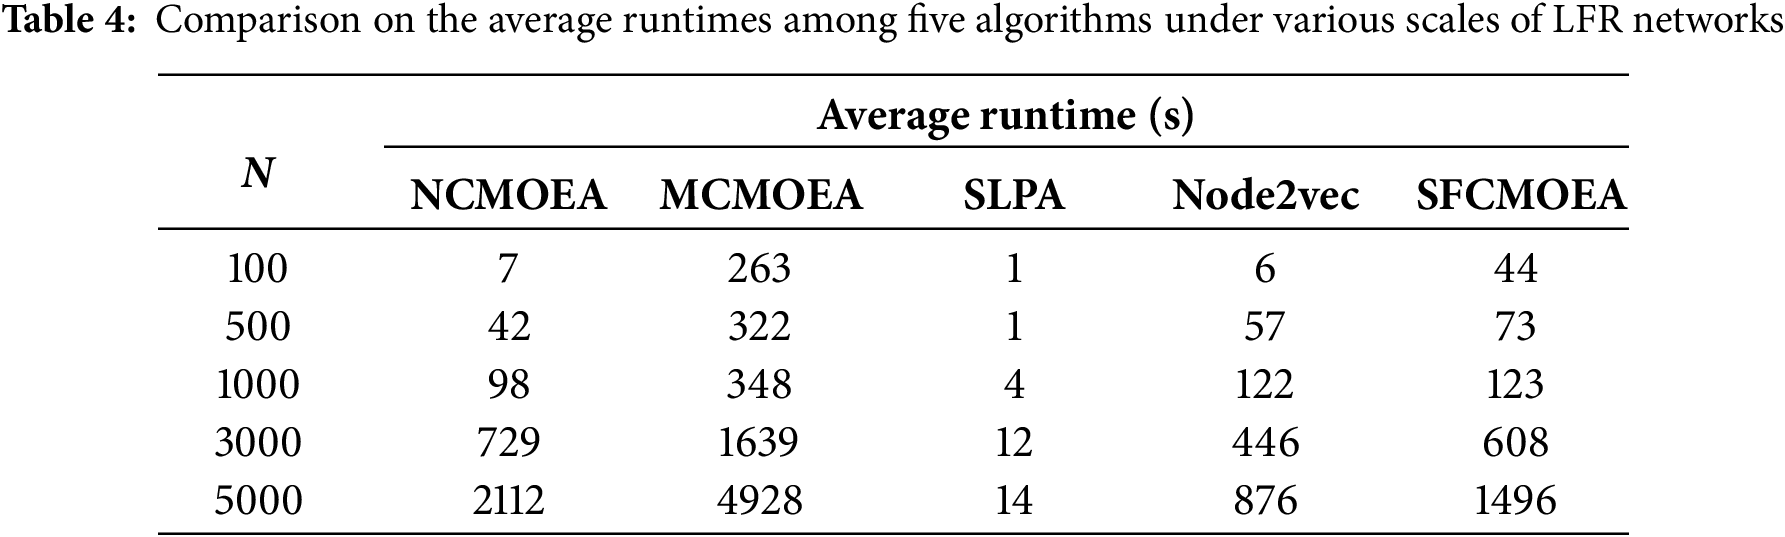
In addition, the runtimes on the constructed LFR network datasets, the evaluation criterion of runtime, is also taken into account. A comparison is made among five algorithms using five different scales of LFR datasets. The algorithms compared included traditional algorithms, graph embedding algorithms, and MOEA-based algorithms simultaneously. Table 4 presents the
4.5 Performance Analysis on SFNE Method
This section aims to highlight the effectiveness of the proposed SFNE method by investigating its behavior on both real-world and synthetic network datasets. The number of nodes in the network and the size of the structural feature vertex set used by SFCMOEA is set as the comparison standard. MOEA-based methods, graph embedding methods and traditional methods typically perform the search starting from all nodes as the compared algorithms. In this evaluation, LFR benchmarks generated with parameter settings of
From the two figures shown in Fig. 10, as the scale of the network increases, the ratio of the number of nodes utilized in SFCMOEA to all nodes in the network continues to expand. Even when the network scale is small, there can be almost 50% savings in node usage. Combined with the evaluations of Q,
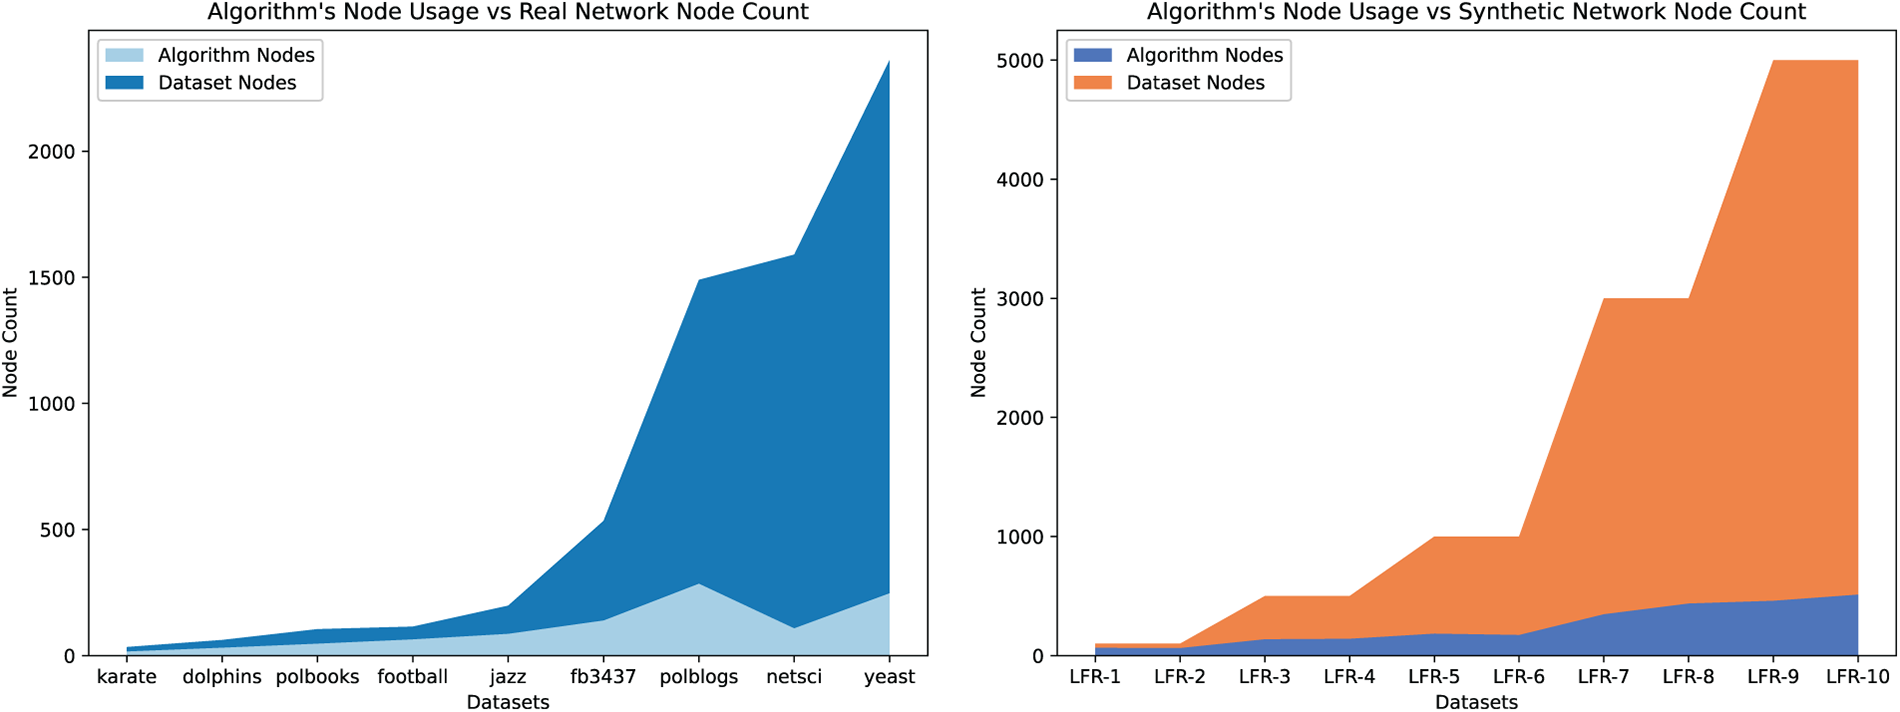
Figure 10: Comparison on the number of nodes actually used by the SFCMOEA algorithm to the total number of nodes in real and synthetic networks, respectively. The upper line represents the total number of network nodes, while the lower line indicates the number of nodes used in the search process
For further analysis, Fig. 11 presents a comparison of the number of detected partitions with the actual number of communities in 10 different scaled LFR datasets generated by SFCMOEA, MCMOEA and SLPA algorithms. The MOEA-based methods and traditional methods are chosen for comparison to provide a comprehensive analysis of the results. From the figure, SFCMOEA is closest to the actual number of communities in almost all networks, with consistent results in the cases of LFR4 and LFR6. The reason can be attributed to the vertex set generated by the SFNE step, which ensures that the number of communities generated in the subsequent community search step is close to the actual partition count. As the network scale increases, the MCMOEA algorithm tends to generate a larger number of communities, which is also reflected in the decreasing fNMI results. In contrast, the SLPA method performs relatively better than the MOEA-based methods in this regard. Considering Fig. 11 in conjunction with Fig. 10, SFCMOEA achieves a balance by minimizing the use of nodes during the search while ensuring the reliability of the community count generated.
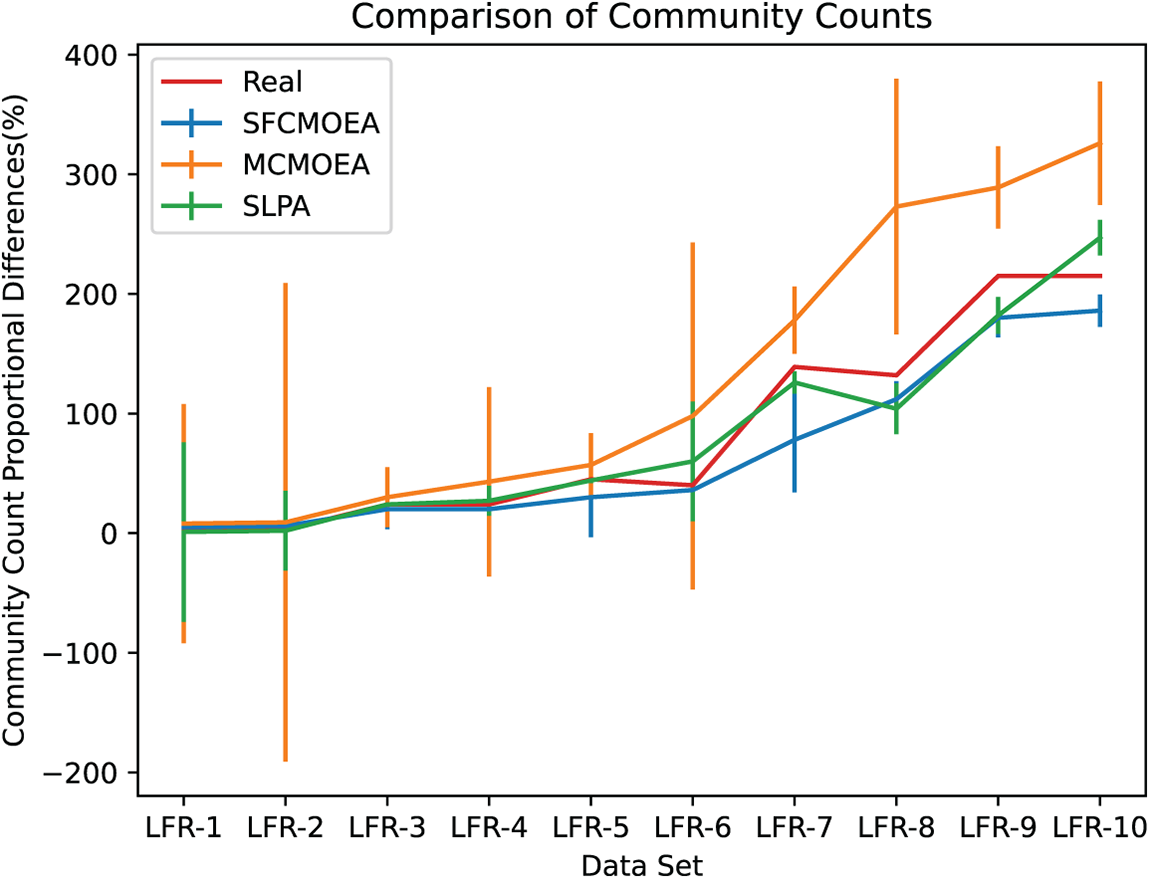
Figure 11: Comparison between the number of communities detected by three algorithms (SFCMOEA, MCMOEA, SLPA) and the actual number of communities. Each data point represents the average number of communities across different datasets, with error bars indicating the maximum and minimum values
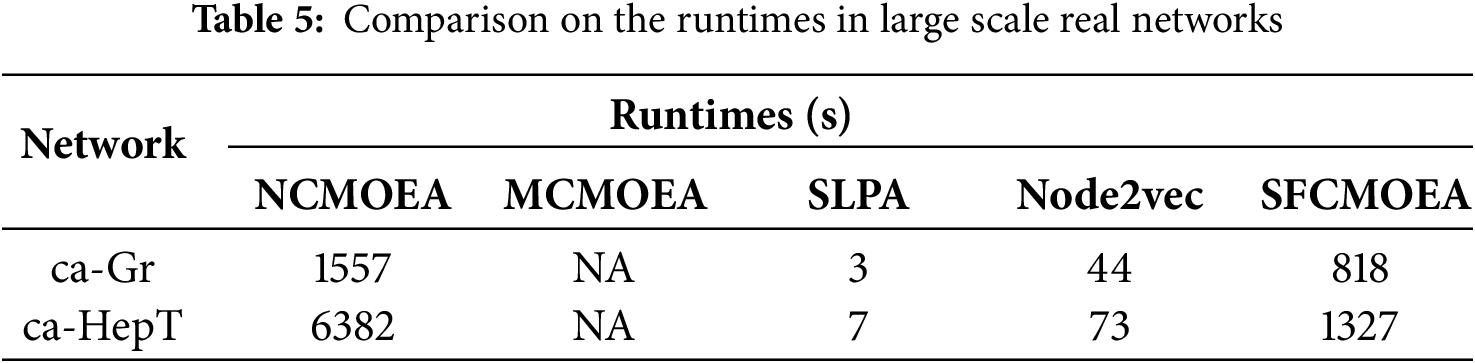
4.6 Experiment Results on Large-Scale Networks
In order to validate the feasibility and efficiency of SFCMOEA on large-scale real-world datasets, the ca-Rr and ca-HePt datasets are selected. These two datasets consist of 5242 and 9877 nodes, respectively, that make up the network. In Table 5, SFCMOEA performs well in the community detection task in large-scale networks, while addressing the limitations of MCMOEA. Furthermore, compared to NCMOEA, an MOEA-based algorithm that performs well on small-scale networks, the SFCMOEA algorithm demonstrates advantages in larger-scale scenarios. However, there is still some gap between SFCMOEA and non-MOEA-based methods.
In this paper, a novel algorithm is proposed for community detection in overlapping networks, called SFCMOEA. The SFCMOEA algorithm addresses the limitations of existing community detection algorithms. First, to reduce the search space and speed up the search for optimal solutions, the SFNE method is designed to generate a set of vertices that collect the most influential nodes for community detection. Only the nodes within the vertex set are involved in subsequent search steps. To identify overlapping nodes, a maximal clique representation scheme is employed on the generated vertex set. A link strength-based method is then proposed to measure the interconnections between cliques, thereby improving the quality of the detected communities. Finally, the HCMOEA approach is proposed to address cliques and the remaining unexplored nodes separately, based on the clique-structured individuals. The HCMOEA approach enables the generation of a number of communities closer to the actual partition count, followed by the allocation of nodes according to the attractiveness of different communities. The number of individuals is effectively reduced while enhancing the efficiency of the algorithm. In the experiments, various networks have been used to test SFCMOEA against some well-known algorithms, including non-EA-based, MOEA-based, and graph embedding-based methods for community detection. In terms of comparing the generated number of communities, SFCMOEA shows a closer number to real partitions and greater stability. The main drawback of SFCMOEA lies in the runtime compared to the traditional methods. Therefore, in the future, algorithm parallelization based on CPU or GPU is requried. Furthermore, we plan to improve SFCMOEA by incorporating additional features, such as node attributes and edge weights, and the performance of SFCMOEA on dynamic networks will also be considered.
Acknowledgement: None.
Funding Statement: This research was supported in part by the National Natural Science Foundation of China under Grants 62473176, 62073155, 62002137, 62106088, and 62206113, in part by National Key Laboratory of Ship Structural Safety under Grant 450324300, in part by the Postgraduate Research & Practice Innovation Program of Jiangsu Province under Grant KYCX24_2642.
Author Contributions: The authors confirm contribution to the paper as follows: Methodology, Sicheng Ma; writing—original draft preparation, Lixiang Zhang; validation, Guocai Chen and Zeyu Dai; writing—review and editing, Junru Zhu; supervision, funding acquisition, Wei Fang. All authors reviewed and approved the final version of the manuscript.
Availability of Data and Materials: There are no new data or materials for this review.
Ethics Approval: Not applicable.
Conflicts of Interest: The authors declare no conflicts of interest.
References
1. Zhuo Z, Chen B, Yu S. Overlapping community detection via adaptive Bayesian nonnegative matrix tri-factorization. IEEE Trans Netw Sci Eng. 2026;13:2951–63. doi:10.1109/tnse.2025.3623790. [Google Scholar] [CrossRef]
2. Girvan M, Newman ME. Community structure in social and biological networks. Proc Nat Acad Sci. 2002;99(12):7821–6. doi:10.1073/pnas.122653799. [Google Scholar] [PubMed] [CrossRef]
3. Blondel VD, Guillaume JL, Lambiotte R, Lefebvre E. Fast unfolding of communities in large networks. J Stat Mech Theory Exp. 2008;2008(10):P10008. doi:10.1088/1742-5468/2008/10/p10008. [Google Scholar] [CrossRef]
4. Rosvall M, Bergstrom CT. Maps of random walks on complex networks reveal community structure. Proc Nat Acad Sci. 2008;105(4):1118–23. doi:10.1073/pnas.0706851105. [Google Scholar] [PubMed] [CrossRef]
5. Malliaros FD, Vazirgiannis M. Clustering and community detection in directed networks: a survey. Phys Rep. 2013;533(4):95–142. [Google Scholar]
6. Burgess M, Adar E, Cafarella M. Link-prediction enhanced consensus clustering for complex networks. PLoS One. 2016;11(5):e0153384. doi:10.1371/journal.pone.0153384. [Google Scholar] [PubMed] [CrossRef]
7. Xie H, Ying X, Wang X, Qi Y, Chen W, Huang X, et al. Redundancy-aware masked graph autoencoder for overlapping community detection in attributed networks. Eng Appl Artif Intell. 2025;162:112821. doi:10.1016/j.engappai.2025.112821. [Google Scholar] [CrossRef]
8. Zhang L, Pan H, Su Y, Zhang X, Niu Y. A mixed representation-based multiobjective evolutionary algorithm for overlapping community detection. IEEE Trans Cybern. 2017;47(9):2703–16. doi:10.1109/tcyb.2017.2711038. [Google Scholar] [PubMed] [CrossRef]
9. Adamic L, Adar E. How to search a social network. Soc Netw. 2005;27(3):187–203. doi:10.1016/j.socnet.2005.01.007. [Google Scholar] [CrossRef]
10. Souravlas S, Anastasiadou SD, Economides T, Katsavounis S. Probabilistic community detection in social networks. IEEE Access. 2023;11:25629–41. doi:10.1109/access.2023.3257021. [Google Scholar] [CrossRef]
11. Arnaudon A, Schindler DJ, Peach RL, Gosztolai A, Hodges M, Schaub MT, et al. PyGenStability: multiscale community detection with generalized Markov stability. arXiv:2303.05385. 2023. [Google Scholar]
12. Ali M, Hassan M, Kifayat K, Kim JY, Hakak S, Khan MK. Social media content classification and community detection using deep learning and graph analytics. Technol Forecast Soc Change. 2023;188:122252. doi:10.1016/j.techfore.2022.122252. [Google Scholar] [CrossRef]
13. Pizzuti C. A multi-objective genetic algorithm for community detection in networks. In: 2009 21st IEEE international conference on tools with artificial intelligence. Piscataway, NJ, USA: IEEE; 2009. p. 379–86. [Google Scholar]
14. Zhang W, Shang R, Jiao L. Complex network graph embedding method based on shortest path and MOEA/D for community detection. Appl Soft Comput. 2020;97:106764. doi:10.1016/j.asoc.2020.106764. [Google Scholar] [CrossRef]
15. Shang R, Wang S, Zhang W, Feng J, Jiao L, Stolkin R. Evolutionary multi-objective overlapping community detection based on fusion of internal and external connectivity and correction of node intimacy. Appl Soft Comput. 2024;154:111414. doi:10.2139/ssrn.4288728. [Google Scholar] [CrossRef]
16. Shang R, Zhao K, Zhang W, Feng J, Li Y, Jiao L. Evolutionary multiobjective overlapping community detection based on similarity matrix and node correction. Appl Soft Comput. 2022;127:109397. doi:10.1016/j.asoc.2022.109397. [Google Scholar] [CrossRef]
17. Gong M, Ma L, Zhang Q, Jiao L. Community detection in networks by using multiobjective evolutionary algorithm with decomposition. Phys Stat Mech Appl. 2012;391(15):4050–60. doi:10.1016/j.physa.2012.03.021. [Google Scholar] [CrossRef]
18. Wen X, Chen WN, Lin Y, Gu T, Zhang H, Li Y, et al. A maximal clique based multiobjective evolutionary algorithm for overlapping community detection. IEEE Trans Evol Comput. 2016;21(3):363–77. doi:10.1109/tevc.2016.2605501. [Google Scholar] [CrossRef]
19. Pizzuti C. Evolutionary computation for community detection in networks: a review. IEEE Trans Evol Comput. 2017;22(3):464–83. doi:10.1109/tevc.2017.2737600. [Google Scholar] [CrossRef]
20. Su X, Xue S, Liu F, Wu J, Yang J, Zhou C, et al. A comprehensive survey on community detection with deep learning. IEEE Trans Neural Netw Learn Syst. 2024;35(4):4682–702. doi:10.1109/tnnls.2021.3137396. [Google Scholar] [PubMed] [CrossRef]
21. De Santo A, Galli A, Moscato V, Sperli G. A deep learning approach for semi-supervised community detection in Online Social Networks. Knowl Based Syst. 2021;229:107345. doi:10.1016/j.knosys.2021.107345. [Google Scholar] [CrossRef]
22. Liu H, Wei J, Xu T. Community detection based on community perspective and graph convolutional network. Expert Syst Appl. 2023;231:120748. doi:10.1016/j.eswa.2023.120748. [Google Scholar] [CrossRef]
23. Sismanis K, Potikas P, Souliou D, Pagourtzis A. Overlapping community detection using graph attention networks. Future Gener Comput Syst. 2025;163:107529. doi:10.1016/j.future.2024.107529. [Google Scholar] [CrossRef]
24. Chen J, Gong Z, Mo J, Wang W, Wang W, Wang C, et al. Self-training enhanced: network embedding and overlapping community detection with adversarial learning. IEEE Trans Neural Netw Learn Syst. 2022;33(11):6737–48. doi:10.1109/tnnls.2021.3083318. [Google Scholar] [PubMed] [CrossRef]
25. Zhang W, Wang W, Shang R, Xu S. Overlapping community detection based on graph attention autoencoder and self-trained clustering. Appl Soft Comput. 2025;183:113584. doi:10.1016/j.asoc.2025.113584. [Google Scholar] [CrossRef]
26. Xie Y, Gong M, Wang S, Yu B. Community discovery in networks with deep sparse filtering. Pattern Recognit. 2018;81:50–9. doi:10.1016/j.patcog.2018.03.026. [Google Scholar] [CrossRef]
27. Cheng J, He C, Lin X, Liu W, Han K, Tang Y. When graph neural networks meet deep nonnegative matrix factorization: an encoder and decoder-like method for community detection. Expert Syst Appl. 2025;271:126676. doi:10.1016/j.eswa.2025.126676. [Google Scholar] [CrossRef]
28. Bi XA, Chen K, Jiang S, Luo S, Zhou W, Xing Z, et al. Community graph convolution neural network for Alzheimer’s Disease classification and pathogenetic factors identification. IEEE Trans Neural Netw Learn Syst. 2025;36(2):1959–73. doi:10.1109/tnnls.2023.3269446. [Google Scholar] [PubMed] [CrossRef]
29. Škrlj B, Kralj J, Lavrač N. Embedding-based Silhouette community detection. Mach Learn. 2020;109:2161–93. doi:10.1007/s10994-020-05882-8. [Google Scholar] [PubMed] [CrossRef]
30. Perozzi B, Al-Rfou R, Skiena S. DeepWalk: online learning of social representations. In: Proceedings of the 20th ACM SIGKDD international conference on knowledge discovery and data mining. New York, NY, USA: ACM; 2014. p. 701–10. [Google Scholar]
31. Grover A, Leskovec J. node2vec: scalable feature learning for networks. In: Proceedings of the 22nd ACM SIGKDD international conference on knowledge discovery and data mining. New York, NY, USA: ACM; 2016. p. 855–64. [Google Scholar]
32. Tang J, Qu M, Wang M, Zhang M, Yan J, Mei Q. LINE: large-scale information network embedding. In: Proceedings of the 24th International Conference on World Wide Web; 2015 May 18–22. Florence, Italy. p. 1067–77. [Google Scholar]
33. Xu R, Che Y, Wang X, Hu J, Xie Y. Stacked autoencoder-based community detection method via an ensemble clustering framework. Inf Sci. 2020;526:151–65. doi:10.1016/j.ins.2020.03.090. [Google Scholar] [CrossRef]
34. Zhao Y, Li W, Liu F, Wang J, Luvembe AM. Integrating heterogeneous structures and community semantics for unsupervised community detection in heterogeneous networks. Expert Syst Appl. 2024;238:121821. doi:10.1016/j.eswa.2023.121821. [Google Scholar] [CrossRef]
35. Hamilton WL, Ying R, Leskovec J. Representation learning on graphs: methods and applications. arXiv:1709.05584. 2017. [Google Scholar]
36. Xu H, Zeng W, Zeng X, Yen GG. An evolutionary algorithm based on Minkowski distance for many-objective optimization. IEEE Trans Cybern. 2018;49(11):3968–79. doi:10.1109/tcyb.2018.2856208. [Google Scholar] [PubMed] [CrossRef]
37. Xie J, Kelley S, Szymanski BK. Overlapping community detection in networks: the state-of-the-art and comparative study. ACM Comput Surv. 2013;45(4):1–35. doi:10.1145/2501654.2501657. [Google Scholar] [CrossRef]
38. Palla G, Derényi I, Farkas I, Vicsek T. Uncovering the overlapping community structure of complex networks in nature and society. Nature. 2005;435(7043):814–8. doi:10.1038/nature03607. [Google Scholar] [PubMed] [CrossRef]
39. Ma W, Cai L, He T, Chen L, Cao Z, Li R. Local expansion and optimization for higher-order graph clustering. IEEE Internet Things J. 2019;6(5):8702–13. doi:10.1109/jiot.2019.2923228. [Google Scholar] [CrossRef]
40. El Kouni IB, Karoui W, Romdhane LB. Node importance based label propagation algorithm for overlapping community detection in networks. Expert Syst Appl. 2020;162:113020. doi:10.1016/j.eswa.2019.113020. [Google Scholar] [CrossRef]
41. Zhu W, Li H, Wei W. A two-stage multi-objective evolutionary algorithm for community detection in complex networks. Mathematics. 2023;11(12):2702. doi:10.3390/math11122702. [Google Scholar] [CrossRef]
42. Zhang L, Yang H, Yang S, Zhang X. A macro-micro population-based co-evolutionary multi-objective algorithm for community detection in complex networks [Research Frontier]. IEEE Comput Intell Mag. 2023;18(3):69–86. doi:10.1109/mci.2023.3277773/mm1. [Google Scholar] [CrossRef]
43. Rahimi S, Abdollahpouri A, Moradi P. A multi-objective particle swarm optimization algorithm for community detection in complex networks. Swarm Evol Comput. 2018;39:297–309. doi:10.1016/j.swevo.2017.10.009. [Google Scholar] [CrossRef]
44. Ribeiro LF, Saverese PH, Figueiredo DR. struc2vec: learning node representations from structural identity. In: Proceedings of the 23rd ACM SIGKDD international conference on knowledge discovery and data mining. New York, NY, USA: ACM; 2017. p. 385–94. [Google Scholar]
45. Dhillon IS, Guan Y, Kulis B. Kernel k-means: spectral clustering and normalized cuts. In: Proceedings of the Tenth ACM SIGKDD international conference on knowledge discovery and data mining. New York, NY, USA: ACM; 2004. p. 551–6. [Google Scholar]
46. Hagen L, Kahng AB. New spectral methods for ratio cut partitioning and clustering. IEEE Trans Comput-Aided Design Integr Circ Syst. 1992;11(9):1074–85. doi:10.1109/43.159993. [Google Scholar] [CrossRef]
47. Lancichinetti A, Fortunato S. Benchmarks for testing community detection algorithms on directed and weighted graphs with overlapping communities. Phys Rev E. 2009;80(1):016118. doi:10.1103/physreve.80.016118. [Google Scholar] [PubMed] [CrossRef]
48. Kamiński B, Prałat P, Théberge F. Artificial benchmark for community detection (abcd)—fast random graph model with community structure. Netw Sci. 2021;9(2):153–78. doi:10.1017/nws.2020.45. [Google Scholar] [CrossRef]
49. Goldberg Y, Levy O. word2vec Explained: deriving Mikolov et al.’s negative-sampling word-embedding method. arXiv:1402.3722. 2014. [Google Scholar]
50. Xie J, Szymanski BK, Liu X. Slpa: uncovering overlapping communities in social networks via a speaker-listener interaction dynamic process. In: 2011 IEEE 11th international conference on data mining workshops. Piscataway, NJ, USA: IEEE; 2011. p. 344–9. [Google Scholar]
51. Liu C, Liu J, Jiang Z. A multiobjective evolutionary algorithm based on similarity for community detection from signed social networks. IEEE Trans Cybern. 2014;44(12):2274–87. doi:10.1109/tcyb.2014.2305974. [Google Scholar] [PubMed] [CrossRef]
52. Yang H, Li B, Cheng F, Zhou P, Cao R, Zhang L. A node classification-based multiobjective evolutionary algorithm for community detection in complex networks. IEEE Trans Comput Soc Syst. 2024;11(1):292–306. doi:10.1109/tcss.2022.3223159. [Google Scholar] [CrossRef]
53. Shen H, Cheng X, Cai K, Hu MB. Detect overlapping and hierarchical community structure in networks. Phys Stat Mech Appl. 2009;388(8):1706–12. doi:10.1016/j.physa.2008.12.021. [Google Scholar] [CrossRef]
54. Lancichinetti A, Fortunato S, Kertész J. Detecting the overlapping and hierarchical community structure in complex networks. New J Phys. 2009;11(3):033015. doi:10.1088/1367-2630/11/3/033015. [Google Scholar] [CrossRef]
55. Amelio A, Pizzuti C. Is normalized mutual information a fair measure for comparing community detection methods? In: Proceedings of the 2015 IEEE/ACM international conference on advances in social networks analysis and mining 2015. New York, NY, USA: ACM; 2015. p. 1584–5. [Google Scholar]
56. Yang J, Leskovec J. Overlapping community detection at scale: a nonnegative matrix factorization approach. In: WSDM’ 13. New York, NY, USA: Association for Computing Machinery; 2013. p. 587–96. doi:10.1145/2433396.2433471. [Google Scholar] [CrossRef]
57. Van Veldhuizen DA, Lamont GB. Evolutionary computation and convergence to a pareto front. In: Koza JR, editor. Late breaking papers at the genetic programming 1998 conference. Madison, WI, USA: Stanford University Bookstore; 1998. p. 221–8. [Google Scholar]
Cite This Article
 Copyright © 2026 The Author(s). Published by Tech Science Press.
This work is licensed under a Creative Commons Attribution 4.0 International License , which permits unrestricted use, distribution, and reproduction in any medium, provided the original work is properly cited.
 Downloads
 Citation Tools