
 Submit a Paper
 Propose a Special lssue
 Open Access
ARTICLE
Computational Analysis of Fracture and Surface Deformation Mechanisms in Pre-Cracked Materials under Various Indentation Conditions
1 Department of Mechanical Engineering, National Kaohsiung University of Science and Technology, Kaohsiung, 807, Taiwan
2 Department of Mechanical Engineering, University of Technology and Education-The University of Danang, Danang, 50000, Vietnam
3 Department of Fragrance and Cosmetic Science, Kaohsiung Medical University, Kaohsiung, 807, Taiwan
* Corresponding Author: Te-Hua Fang. Email:
Computers, Materials & Continua 2026, 87(1), 15 https://doi.org/10.32604/cmc.2025.074862
Received 20 October 2025; Accepted 12 December 2025; Issue published 10 February 2026
 View Full Text
 Download PDF
Abstract
The mechanical performance of exceedingly soft materials such as Ag is significantly influenced by various working conditions. Therefore, this study systematically investigates the effects of crack geometry, substrate crystal orientation, and indenter shape on crack propagation. The mechanical response of Ag is analyzed using the quasi-continuum (QC) method. A pre-crack with a predefined depth and angle was introduced to initiate fracture behavior. The results show that when the pre-crack height is 50 Å, the crack propagates rapidly as the imprint depth increases from 0 to 7 Å, grows steadily up to 15 Å, and then accelerates sharply between 15 and 20 Å. For other pre-crack heights, crack propagation occurs at a relatively faster rate. Substrates with [100], [010], and [001] crystal orientations promote crack extension, while the onset of plastic deformation (referred to as the yield point in this study) and the fracture strength both increase with increasing pre-crack height. The yield point, fracture strength, and stress intensity factors are highly sensitive to the pre-crack height. When the pre-crack angle is 90°, the fracture strength reaches its maximum of 0.2% higher than that of the uncracked sample-whereas at 0°, it reaches its minimum, still 53.8% higher than that of the uncracked sample. The sample model is conducted using AutoCAD software. The optimized quasi-continuum (QC) method is used to investigate the effects of different crack geometries, substrate crystal orientations, and indenter shapes on the crack extension of Ag material. Baskes and Dow (FBD) potential is borrowed to describe the interaction forces between Ag-Ag, Ni-Ag, and Ni-Ni.Keywords
Silver (Ag) nanowires have attracted increasing attention due to their excellent electrical conductivity, mechanical flexibility, and high structural stability [1–6]. Their mechanical behavior is strongly affected by microstructural features introduced during synthesis, such as diameter, aspect ratio, surface energy, and defect population [7–10]. Although these morphological and microstructural characteristics have been widely investigated, their influence on fracture behavior particularly in the presence of pre-existing cracks remains insufficiently understood.
Pre-crack morphology plays a critical role in the deformation mechanisms of Ag nanowires. Crystal orientation, voids, and intrinsic cracks govern dislocation nucleation, stress localization, and fracture modes [11,12]. To provide a physical context for crack evolution, classical fracture mechanics offers useful concepts such as the stress intensity factor K, fracture toughness, and the crack-tip plastic zone size [13,14]. An increase in crack length leads to higher stress intensities and larger plastic zones, thereby facilitating accelerated crack extension [15,16]. Although linear elastic fracture mechanics (LEFM) may not fully capture nanoscale deformation due to size effects and atomistic discreteness, these concepts remain valuable for interpreting qualitative trends in atomistic and quasi-continuum simulations. However, LEFM is not strictly applicable to the present nanoscale imprinting configuration because the small-scale yielding (SSY) condition is not satisfied. According to the Brown and Srawley criterion, SSY requires the crack length (a), specimen thickness B, and remaining ligament (W − a) to all exceed 2.5(KI/σy)2. In our QC simulations, the crack-tip plastic zone reaches dimensions comparable to the initial crack height (10–50 Å), which violates the above requirement that the plastic zone must be small compared with the crack length. Therefore, fracture mechanics concepts such as KI and LEFM-based crack-tip fields cannot quantitatively describe the deformation behavior, and atomistic or quasi-continuum methods are required to capture bond breaking, dislocation emission, and lattice distortion occurring at the crack tip [17].
Existing studies demonstrate the importance of crack morphology in Ag-based systems. Intentional crack creation has been used to tune the mechanical response of sensors [13,18], while other works highlight that crack height and angle control fracture resistance in sintered Ag joints [18,19]. However, a systematic investigation of how pre-crack parameters influence the fracture strength and crack-extension behavior of single-crystal Ag nanowires is still lacking, motivating the present study.
To model nanoscale fracture, the optimized quasi-continuum (QC) method provides an efficient multi-scale framework that preserves atomistic resolution around high-deformation regions while coarsening the surrounding domain [20–24]. It has been successfully applied to indentation, crack propagation, and defect evolution in FCC metals [25–27]. This makes QC particularly suitable for studying crack-tip processes such as bond breaking, dislocation emission, and lattice distortion, which cannot be captured by conventional continuum models. Experimental verification of the exact imprinting configuration is not feasible because atomic-scale crack-tip evolution and defect nucleation cannot be directly resolved using current in-situ TEM or AFM techniques [28–30], and fabricating Ag nanowires with controlled pre-crack heights (10–50 Å) and crack angles is technically impractical. Thus, a direct one-to-one laboratory validation is currently unattainable. Nevertheless, the QC method has been rigorously validated in previous studies, showing strong agreement with both MD simulations and experimental trends for nanomechanical deformation.
Therefore, in this study, the optimized QC method is employed to investigate the crack-extension behavior, yield strength, and fracture strength of single-crystal Ag nanowires during imprinting with Ni indenters. The effects of crack height, crack angle, crystal orientation, and indenter geometry are systematically analyzed to provide fundamental insight into nanoscale fracture mechanisms.
2.1 Coupling of Local and Non-Local Regions
Non-local area simulations are suitable when atomic-scale accuracy is required. In local area simulations, the deformation changes at the atomic scale are relatively slow, and continuous boundary conditions can be applied, providing the advantage of high computational efficiency. When both methods need to be used simultaneously in a simulation, they must be integrated by combining the energy formulations of the non-local and local areas.
The QC method combines these two methods to fully exploit their simulation advantages fully [31]. To avoid generating ghost forces in the combined interface area, the weight of the energy in the coupling area becomes an important consideration. As with non-local area simulations based on energy formulation, the
energy calculation assumes that this energy can be approximated by only representative atoms, as shown in Eq. (1) [31].
Among them, Nloc is the number of representative atoms in the local region, Nnloc is the number of representative atoms in the non-local region, and nα and nβ are the weight functions of the local and non-local regions, respectively. uh is the local region atomic displacement, Eα is the atomic energy in the local region, and Eβ is the atomic energy in the non-local region. The coupled form of the QC method uses a simple segmentation based on the existing mesh, assigning each element equally to each node in the model.
The purpose of using grids in the QC method is to effectively describe the behavior of atoms and reduce the computational load in numerical simulations, thereby improving computational efficiency [32]. The grid adaptation method is a numerical simulation technique that allows the resolution of the computational grid to be automatically adjusted according to requirements during the simulation process. This helps allocate more computational resources to different problem areas, thereby more accurately capturing critical physical phenomena while reducing computational costs in the target computational area [33,34].
The QC method employs the Newton–Raphson (NR) scheme to update the model coordinates [35]. In this study, the solver was allowed a maximum of 200 iterations per loading step. This setting was determined through convergence testing, which showed that the residual forces consistently fell below 10−6 eV/Å, consistent with standard AC/atomistic minimization practice and that increasing the iteration limit beyond 200 produced negligible changes (<0.1%) in the total energy and stress. Accordingly, 200 NR iterations were selected as an optimal balance between numerical convergence and computational efficiency.
The basic idea of Newton’s iteration method is as follows: let f(x) be a differentiable function, let s be the root of f(x) = 0, select x0 as the initial approximation of s, and proceed through the point (x0, f(x0)). The tangent line of the curve L is shown in Eq. (2) [32].
Then the abscissa coordinate of the intersection of L and the x-axis is the nth approximation of s, and its calculation is given by Eq. (3).
By repeatedly applying the above formula to perform calculations, a sequence of approximate values of s can be obtained, and the value can be progressively improved through iteration until a solution that meets the accuracy requirements is found.
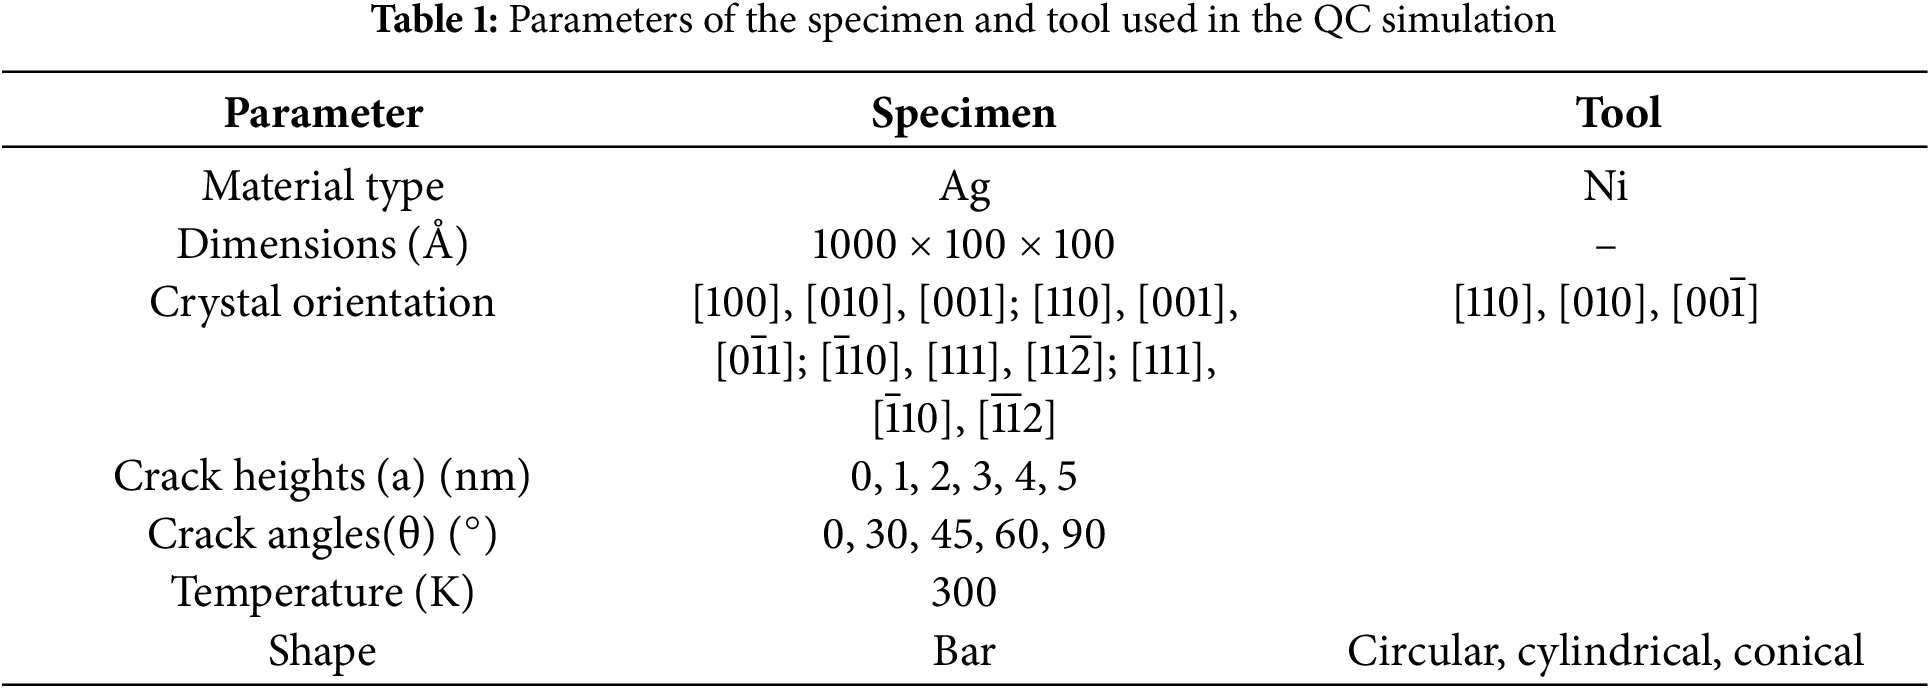
Fig. 1 presents the schematic diagram of the nanoimprint simulation constructed using the quasi-continuum (QC) method. The model consists of a pure Ag specimen and a Ni indenter. The indenter orientation corresponds to the close-packed surface of nickel aligned along the Z-direction. Three indenter geometries including circular, cylindrical, and conical were employed to examine the effect of imprint shape on the mechanical response and crack behavior in specimens containing a pre-crack. The circular indenter has a radius of 50 Å; the cylindrical indenter has a height of 100 Å and a radius of 30 Å; and the conical indenter has a peak angle of 90°. The Ag bar dimensions are 1000 × 100 × 100 Å3 along the X-, Y-, and Z-directions, respectively. Pre-cracks with heights of 10, 20, 30, 40, and 50 Å were introduced at the center of the bottom surface of the Ag bar. Their orientations form angles of 0°, 30°, 45°, 60°, and 90° relative to the horizontal substrate plane. To investigate the effect of crystallographic orientation, five Ag specimens with identical pre-crack height (10 Å) and angle (90°) but different crystal orientations [100], [010], [001]; [110], [001], [011]; [101], [111], [
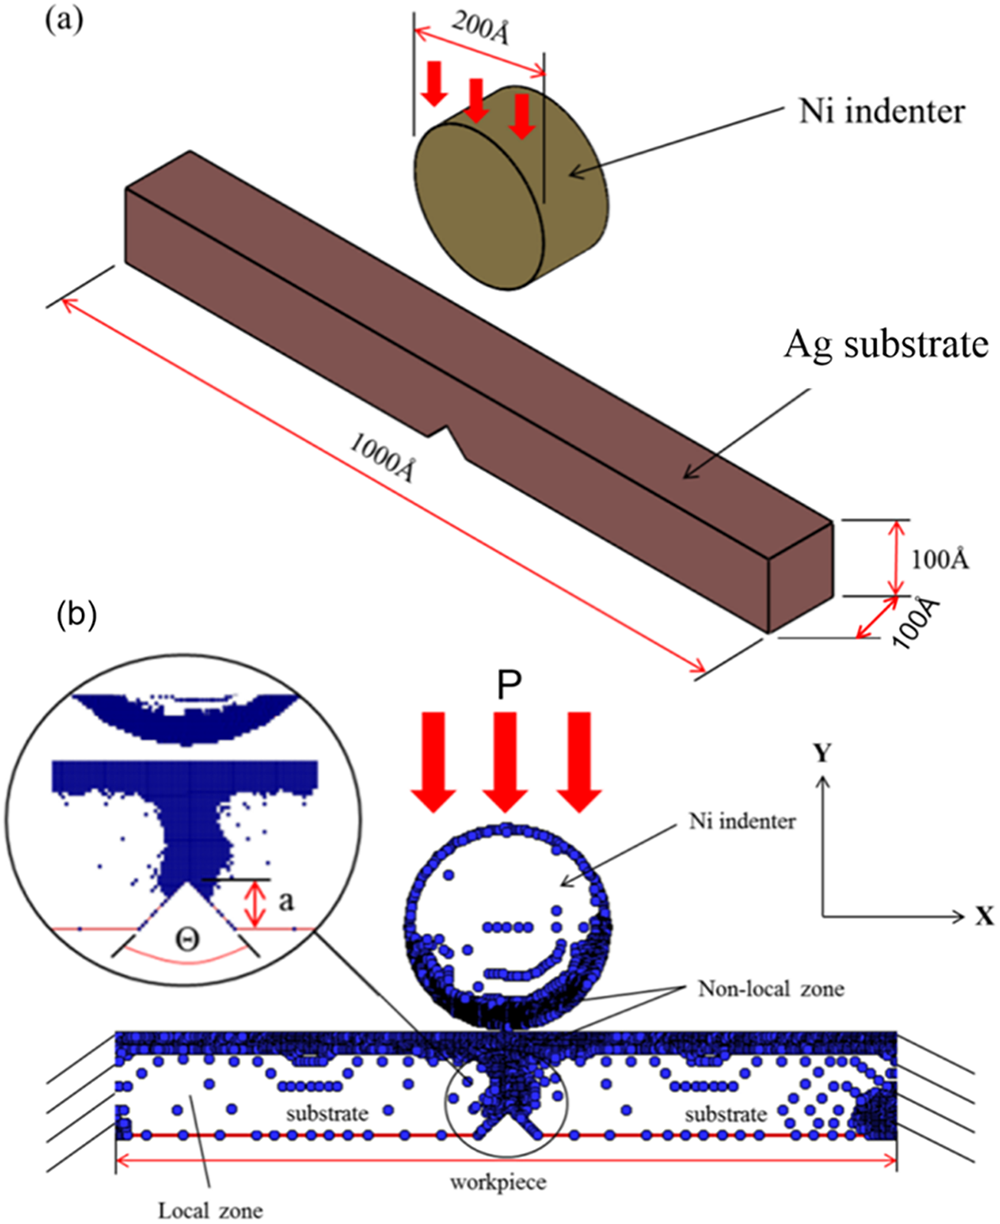
Figure 1: Schematic diagram of the nanoimprint simulation using the quasi-continuum method: (a) 3D module, (b) cross-section
It should be emphasized that, in this study, the “crack angle” refers to the inclination angle between the pre-crack surface and the horizontal substrate plane, rather than the crack tip opening angle (CTOA). The angle is introduced purely as a geometric input parameter to investigate how the initial crack orientation affects crack propagation under indentation loading. The relatively large angles (e.g., 90°) were intentionally selected to explore extreme cases of vertically oriented pre-cracks and to analyze their roles in deformation localization and stress distribution. Although the concept of Crack Tip Opening Displacement (CTOD) is well established in fracture mechanics, it is not directly relevant here because the focus of this work is on the prescribed pre-crack geometry rather than the dynamic crack-tip evolution.
The FBD potential, a second-moment tight-binding (SMTB) type many-body potential, was employed to model Ag–Ag interactions in this study. FBD potentials are well established for FCC metals and have been widely used in simulations of deformation, indentation, and fracture because they accurately reproduce cohesive energies, elastic constants, vacancy formation energies, and stacking-fault energies of noble metals. Compared with EAM, the FBD potential uses a simpler quadratic interpolation scheme and requires fewer fitting parameters while still maintaining comparable accuracy for pure metals and some binary systems [32]. Relative to pairwise potentials such as Morse or Lennard-Jones, FBD captures essential many-body metallic bonding effects that are critical for describing dislocation nucleation, defect evolution, and crack propagation. Although MEAM includes angular-dependent bonding and can model a broader class of materials, it is significantly more computationally expensive. For large-scale QC simulations of pure silver, the FBD potential provides an optimal balance of physical fidelity and computational efficiency [36–40].
Therefore, FBD was selected as the most suitable potential for modeling metallic bonding and deformation mechanisms in Ag under imprint loading. Ag–Ni interactions were described using a Lennard–Jones potential following previous studies.
The Young’s modulus (E) was calculated based on the elastic deformation relationship of a cylindrical beam (or wire) with radius r and suspended length L, subjected to a mid-point load F. The corresponding mid-point deflection (d) and area moment of inertia (I = πr4/4) were considered according to the formulation proposed by Gere and Timoshenko [41], as shown in Eq. (4).
The yield strength was determined based on the yield force (Fy) obtained from the force–displacement curve prior to the onset of plastic deformation, as presented in Eq. (5).
where R is the radius and L is the length of the double clamped beam that is loaded at its central point by force F.
This section uses three indenter shapes for the imprint simulation: circular, cylindrical, and conical. The sample contains different pre-crack heights of 0, 10, 20, 30, 40, and 50 Å, with an angle of 90°. The imprint depth is 10 Å.
The equivalent atomic stress used in this work refers to the atomic-level von Mises stress calculated from the virial stress components. For each atom, the virial stress tensor σij is obtained from the standard atomistic virial expression, and the equivalent atomic stress is computed as Eq. (6) [41].
where σij represents the atomic virial stress. This scalar measure provides an effective representation of the local stress state and is widely used in atomistic and quasi-continuum simulations to characterize deformation and crack-tip behavior.
Fig. 2 shows the equivalent atomic stress diagram of the sample under a circular indenter, with different pre-crack heights of 0, 10, 20, 30, 40, and 50 Å. It can be observed that the atomic stress responds differently depending on the pre-crack height. High atomic stress is concentrated in the contact area between the indenter and the sample when the pre-crack heights are 0 and 10 Å. As a result, the sample remains in its original form. However, when the sample contains pre-cracks with heights ranging from 20 to 50 Å, the high atomic stress propagates from the crack tip, accelerating crack extension into the sample. The fracture regime initiates at the crack tip, spreads laterally to both sides, and propagates toward the surface, which is the center of the indenter–sample contact region. This behavior can be explained by the fact that the crack tip acts as a stress concentrator. As the pre-crack height increases, the stress intensity factor at the crack tip increases accordingly, enhancing the local shear strain and promoting crack opening under the imprint load [42]. Therefore, larger pre-crack heights lead to more efficient crack propagation under compression.
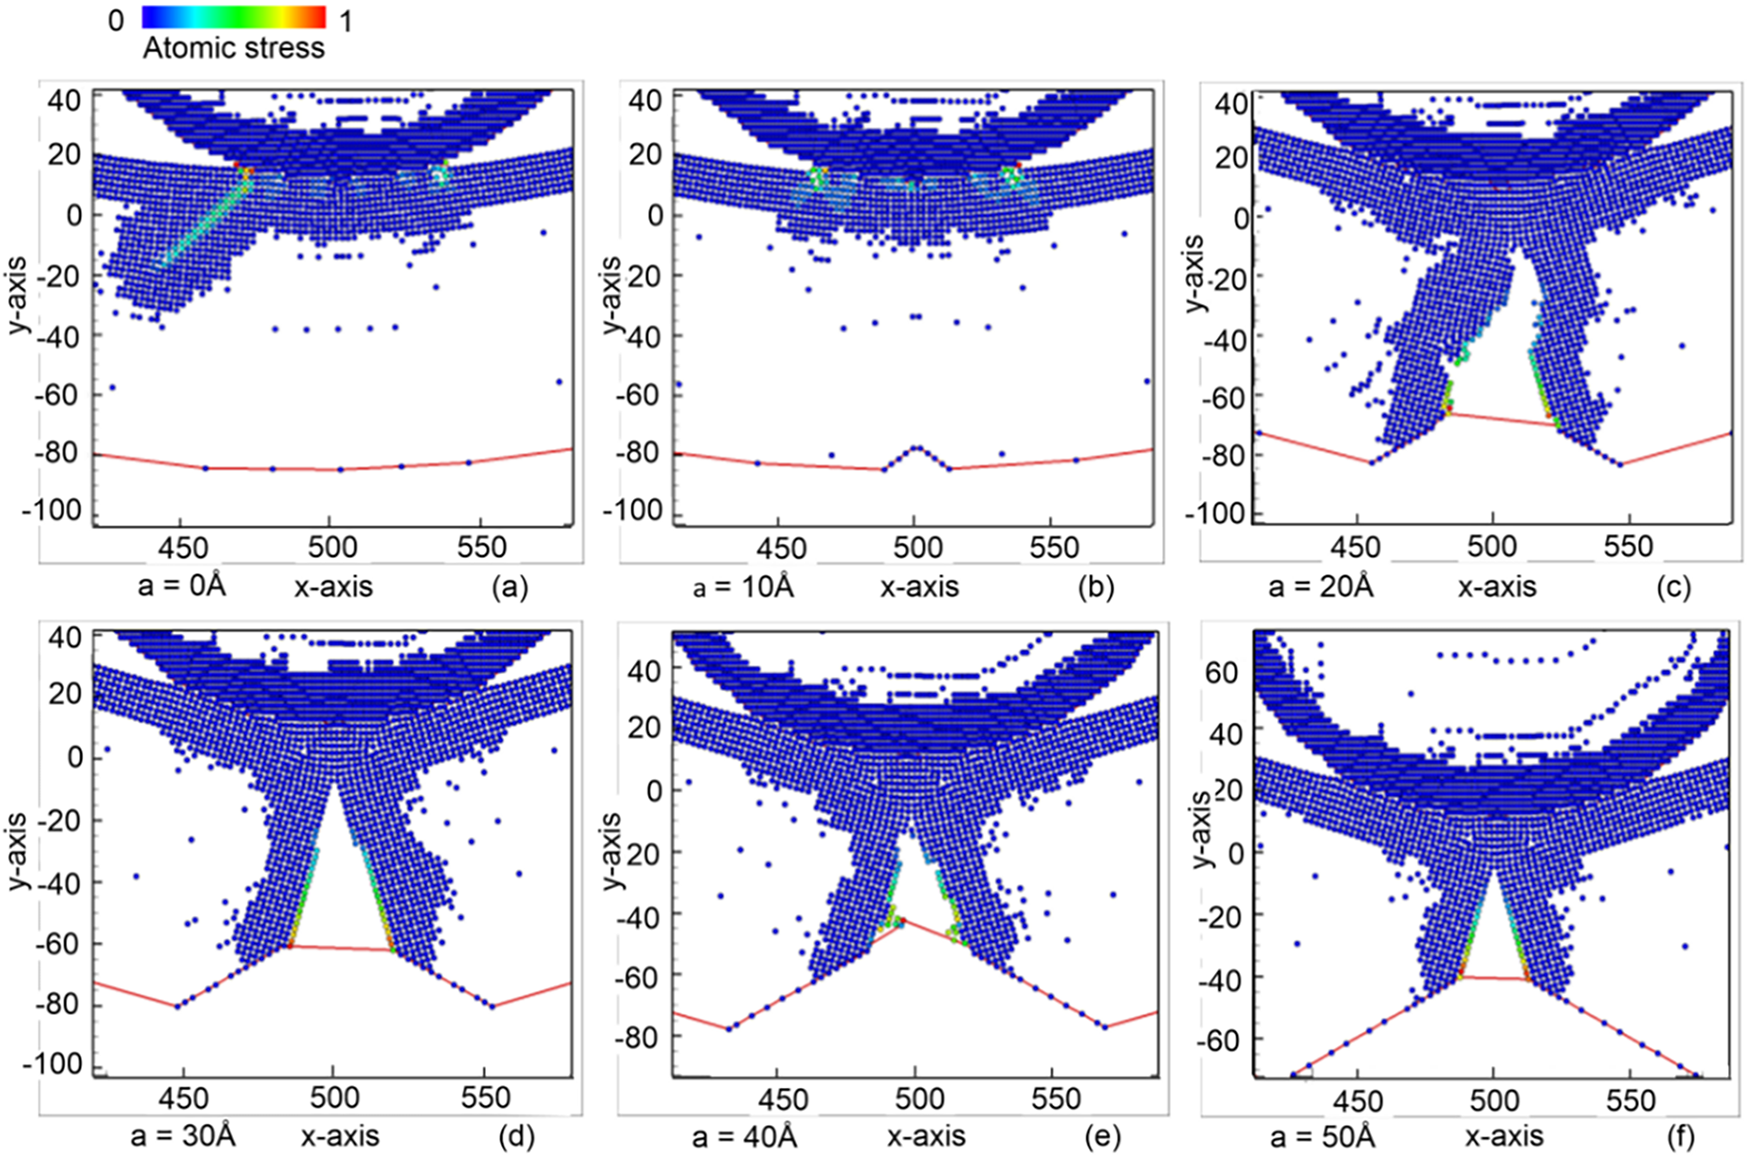
Figure 2: Equivalent atomic stress diagrams of the sample under the circular indenter for different pre-crack heights: (a) 0 Å; (b) 10 Å; (c) 20 Å; (d) 30 Å; (e) 40 Å; and (f) 50 Å
For the samples without a crack and with a pre-crack high of 10 Å, the energy from the indenter transmits to all the atoms in the sample. The central region of the sample exhibits lower shear strain due to the efficient transmission of reaction forces back to the indenter along the imprint direction, as shown in Fig. 3a,b. In contrast, for samples with pre-crack heights ranging from 20 to 50 Å, regions with high shear strain are concentrated near the peak of the original crack, around the newly formed crack areas, and approximately in the top one-third of the sample’s height, as shown in Fig. 3c–f.
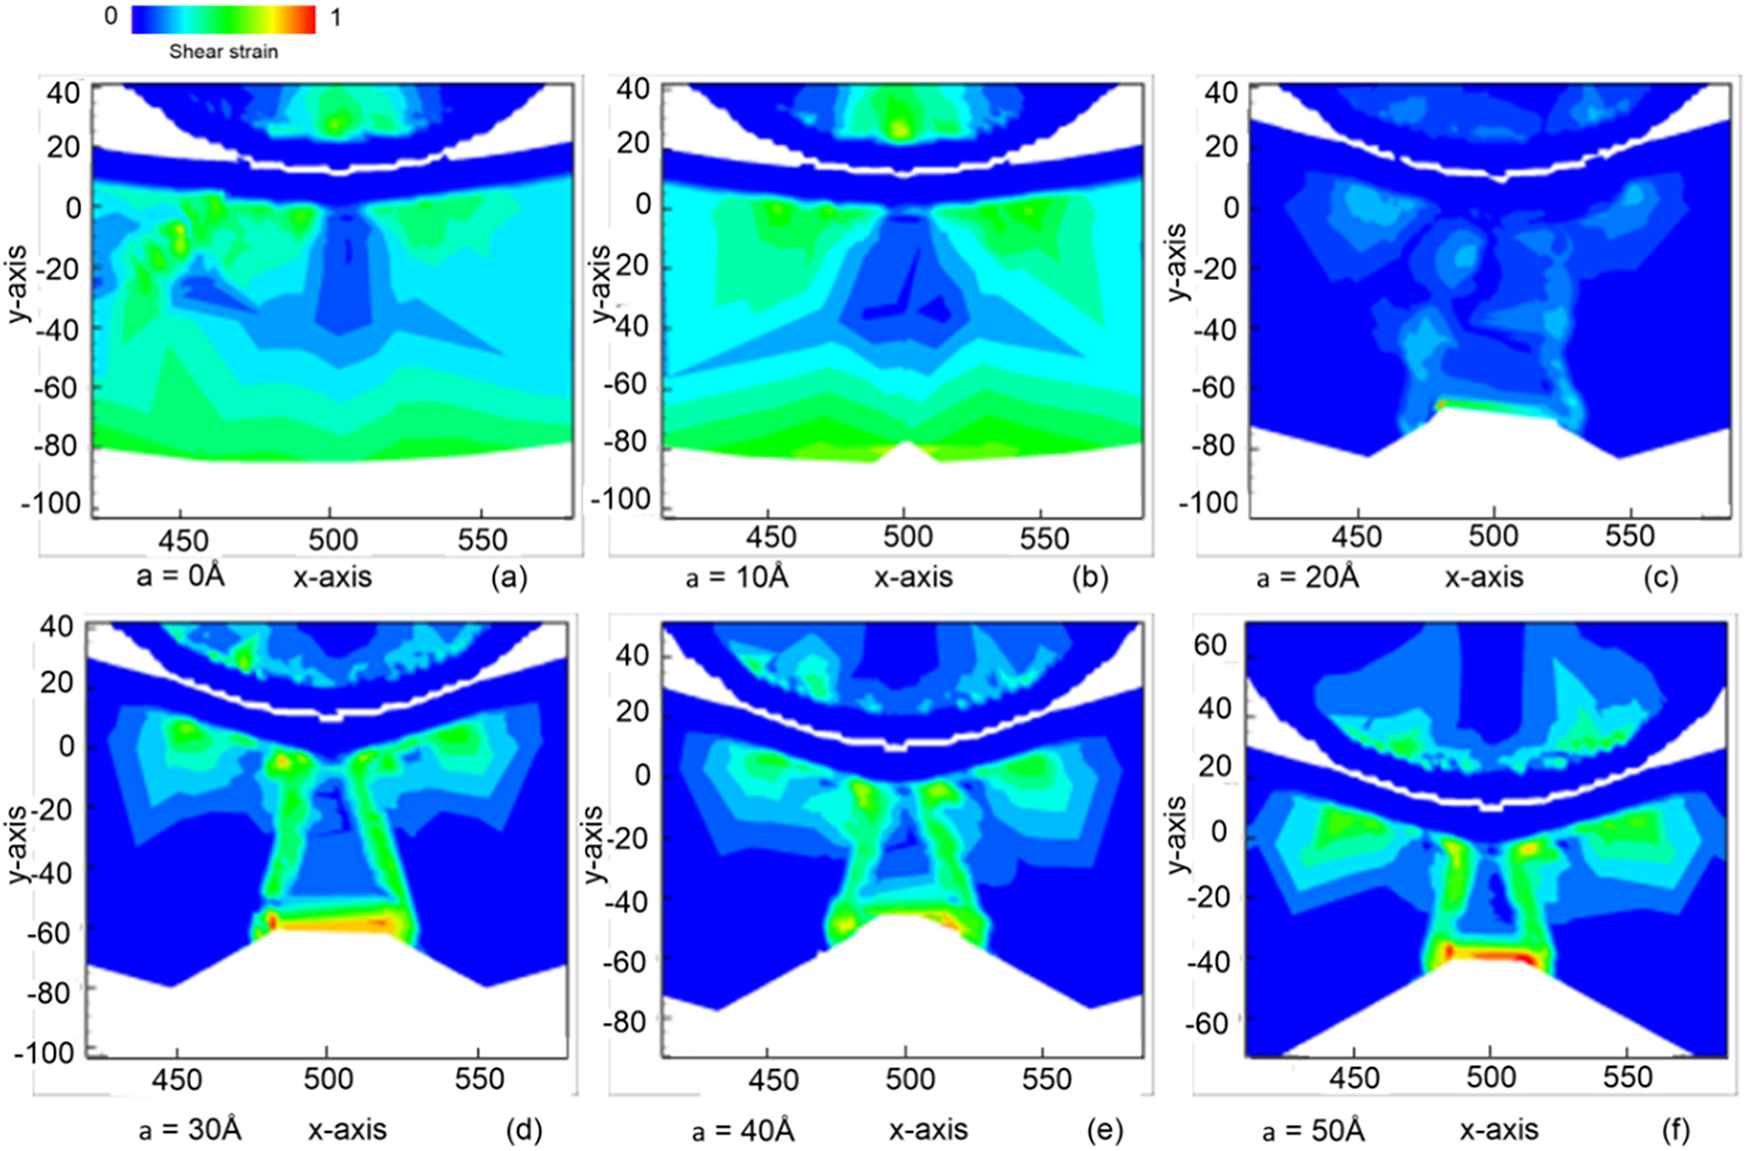
Figure 3: The shear strain distribution in the sample under the circular indenter with varying pre-crack heights: (a) 0 Å; (b) 10 Å; (c) 20 Å; (d) 30 Å; (e) 40 Å; and (f) 50 Å
Fig. 4 shows the equivalent atomic stress diagram of the sample the cylindrical indenter for different pre-crack heights of 0, 10, 20, 30, 40, and 50 Å. The result shows that the deformation of the sample during imprinting is not significantly influenced by the initial pre-crack hight. Owing to the geometry of the cylindrical indenter, the contact area between the indenter and the sample becomes considerably large as the indenter penetrates the material. Consequently, the external force is distributed over a broad region, producing a relatively uniform stress field across the specimen rather than localized stress concentration. This observation is further supported by Fig. 5, where atoms exhibit similar shear strain magnitudes throughout the sample, regardless of the pre-crack height. The wide and uniform stress field generated by the cylindrical indenter reduces the effective stress intensity at the crack tip, thereby suppressing crack-tip activation and limiting crack growth. As a result, variations in pre-crack height do not lead to notable differences in deformation or crack propagation behavior.
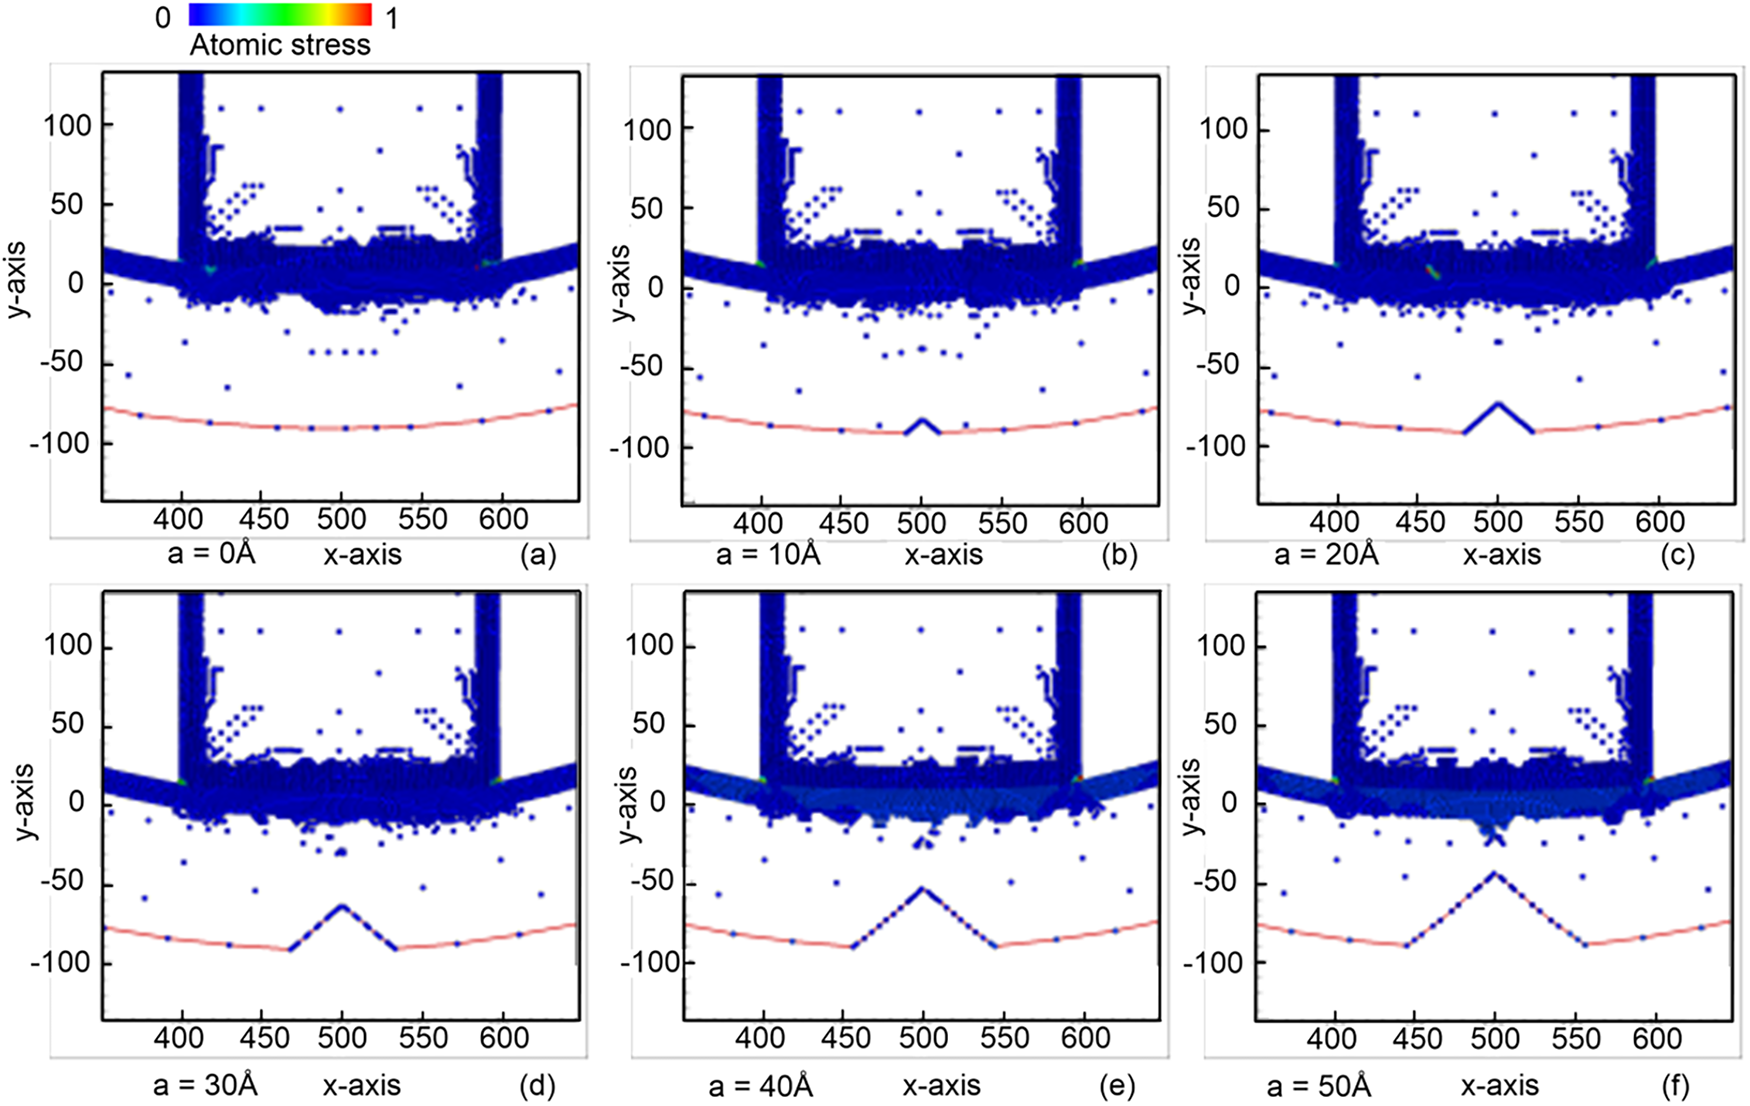
Figure 4: Equivalent atomic stress diagram of the sample under the cylindrical indenter for different pre-crack heights: (a) 0 Å; (b) 10 Å; (c) 20 Å; (d) 30 Å; (e) 40 Å; and (f) 50 Å
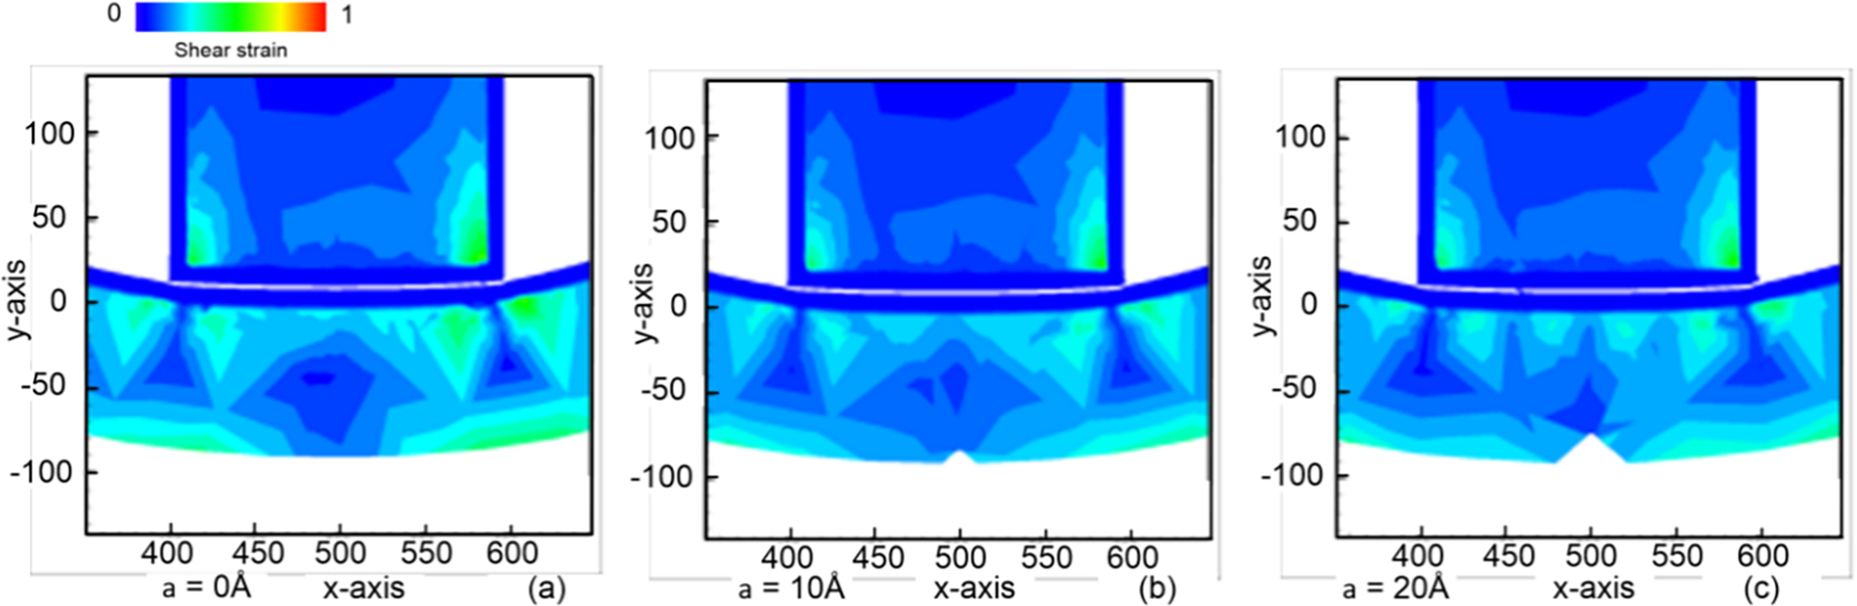
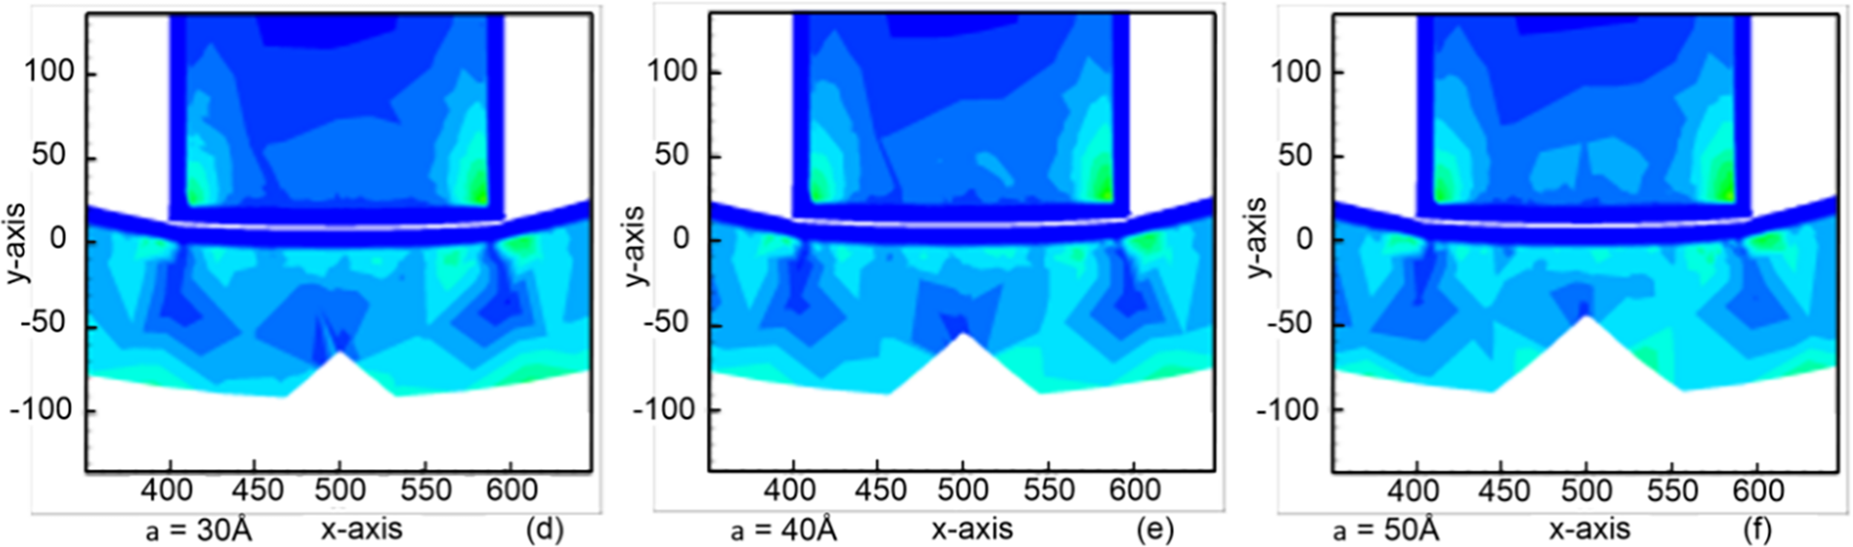
Figure 5: The shear strain distribution in the sample under the cylindrical indenter with varying pre-crack heights: (a) 0 Å; (b) 10 Å; (c) 20 Å; (d) 30 Å; (e) 40 Å; and (f) 50 Å
Fig. 6 shows the equivalent atomic stress distribution in the sample under the conical indenter with varying pre-crack heights of 0, 10, 20, 30, 40, and 50 Å. Due to its sharp geometry, the conical indenter penetrates the sample with a very small contact area, concentrating the applied load into a narrow region. This highly localized loading dramatically increases the stress intensity at the crack tip, and when combined with the inherent instability of the pre-existing crack, it accelerates crack propagation in a rapid and directional manner. This behavior is markedly different from that produced by the spherical indenter (Fig. 2), where the broader contact area generates a more distributed stress field, leading to crack extension that grows in both length and width instead of in a narrow, focused direction. In most cases, atoms exhibiting high shear strain are strongly concentrated around the crack-growth zone, reflecting the sharp stress gradient produced by the conical indenter. However, for the sample with a pre-crack height of 10 Å, the shear strain is more widely distributed across the specimen (Fig. 7). This suggests that the crack at 10 Å is too short to fully interact with the localized stress field of the conical indenter, resulting in partial stress redistribution and reduced crack-tip amplification. As the pre-crack becomes longer, its interaction with the concentrated load becomes stronger, promoting more aggressive crack extension.
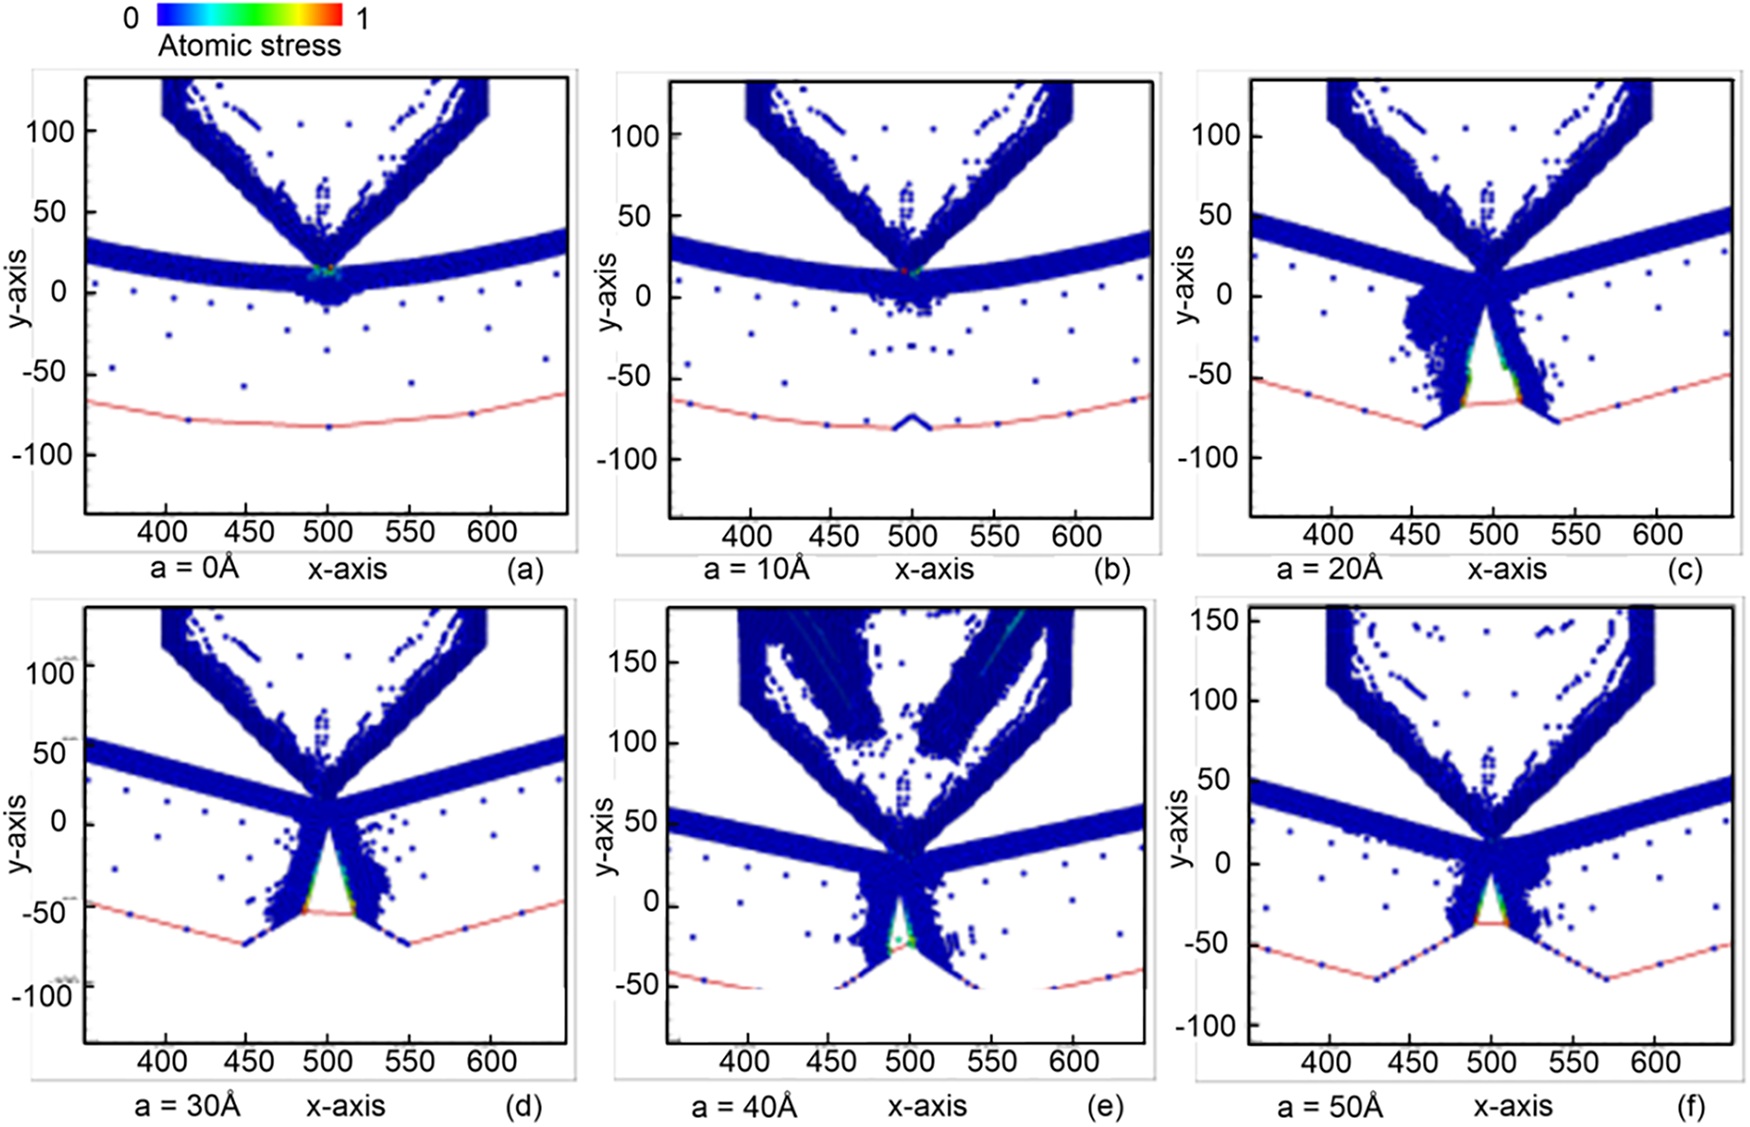
Figure 6: Equivalent atomic stress diagram of the sample under the conical indenter for different pre-crack heights: (a) 0 Å; (b) 10 Å; (c) 20 Å; (d) 30 Å; (e) 40 Å; and (f) 50 Å
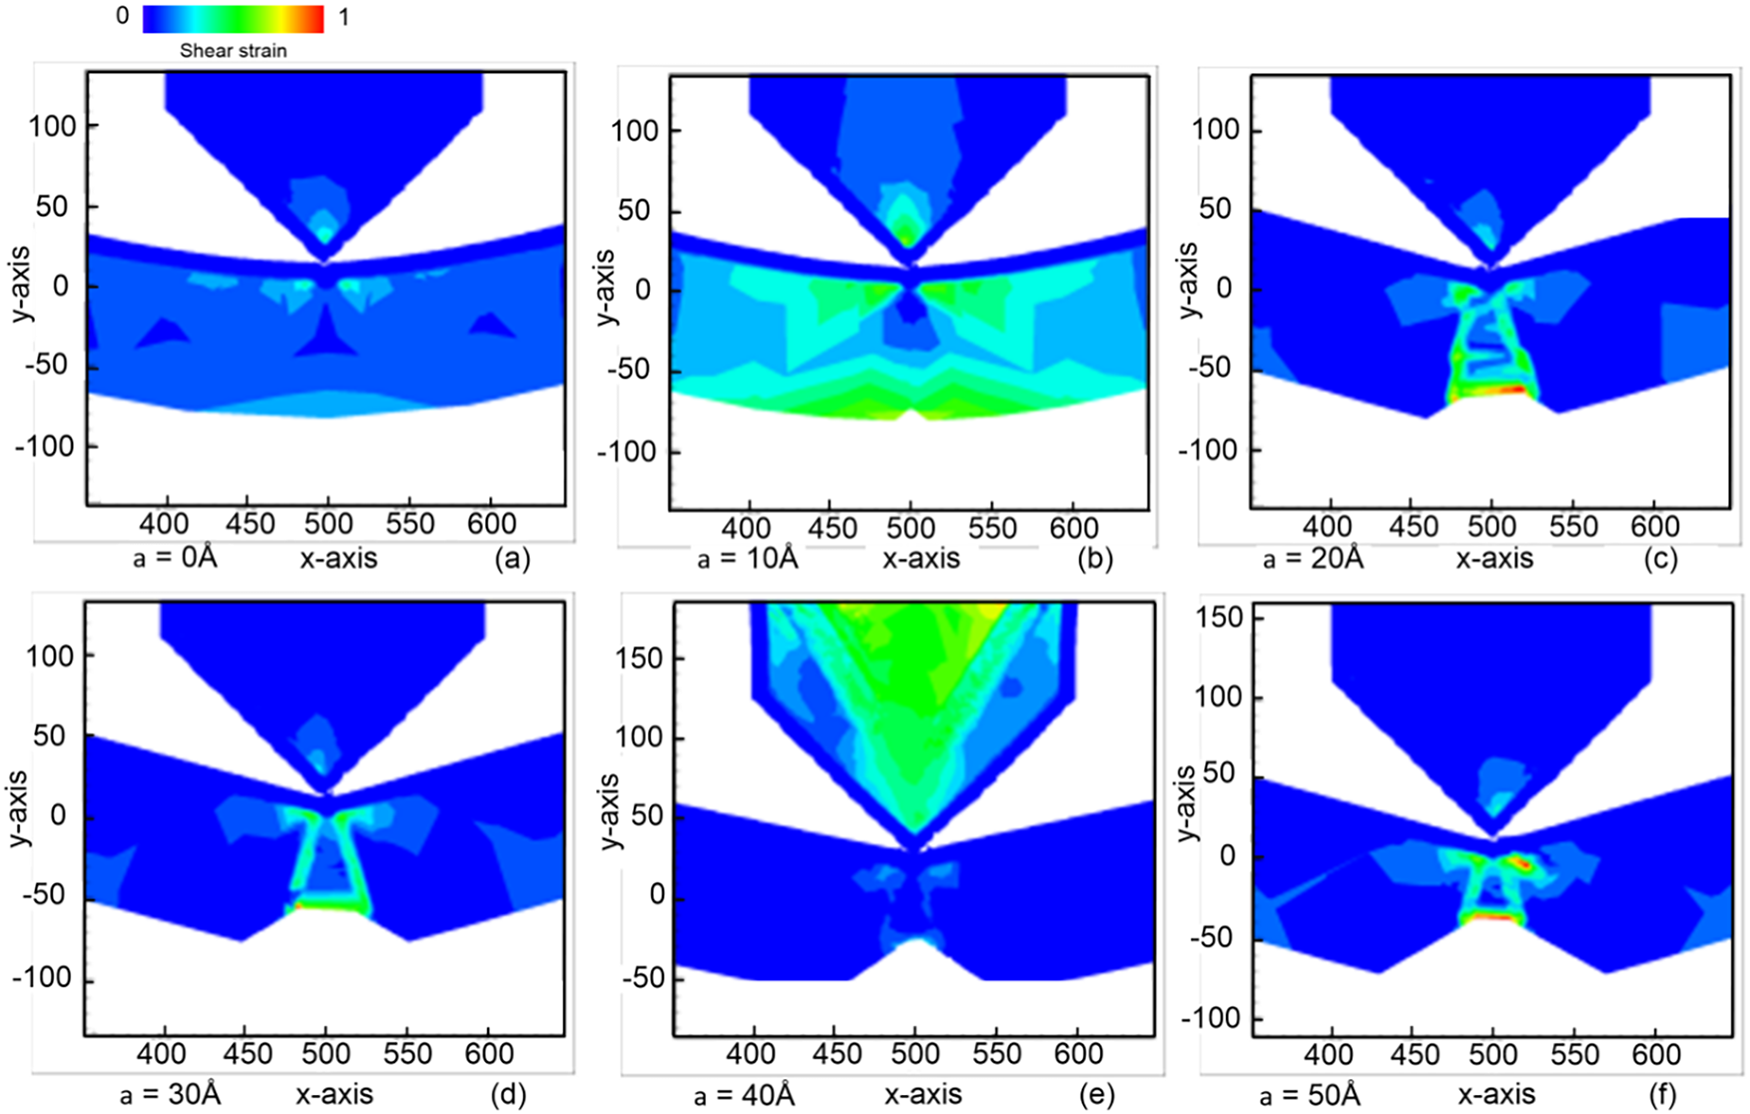
Figure 7: Atomic strain of the sample under the conical indenter when the sample contains different pre-cracks with heights: (a) 0 Å; (b) 10 Å; (c) 20 Å; (d) 30 Å; (e) 40 Å; and (f) 50 Å
The comparison of the three indenter shapes highlights distinct characteristics in stress distribution and crack propagation. The circular indenter promotes uniform stress distribution, facilitating crack expansion. In contrast, the square indenter localizes stress at its corners, restricting crack extension. Meanwhile, the non-uniform stress distribution from the conical indenter accelerates crack propagation, potentially destabilizing the structure. Prior research has investigated the influence of indenter geometry on deformation zones, energy absorption, and dislocation mechanisms [43,44]. In this study, the surfaces are considered atomically smooth, so classical friction coefficients (dependent on roughness and material interactions) are not explicitly modeled. When referring to “friction effects” in the context of indenter shape, we mean the local stress distribution and contact response that the different indenter geometries induce. Based on these considerations, the circular indenter is employed to analyze crack deflection and growth patterns in nanostructures.
3.2 Effect of Different Sample Crystal Orientations
This section examines four common crystal orientations for simulate materials: O1 ([100], [010], [001]), O2 ([110], [001], [0
Fig. 8 shows the equivalent atomic stress diagrams for samples conducted with different crystal orientations. The results indicate that crack extension is most pronounced in the O1 direction, where the stress field is strongly concentrated at the crack tip. This orientation aligns the imprint loading with a lower atomic packing density surface, making bond breaking and slip activation easier. In the O2 direction, atomic slip occurs immediately after the indenter contacts the surface and becomes more evident at a pressing depth of 50 Å. As the indentation depth increases, differential displacement spreads over a broader region, producing a more uniform stress distribution and suppressing crack growth. This behavior is consistent with orientations in which multiple slip systems are activated simultaneously, dissipating energy away from the crack tip. For the O3 direction, the stress remains highly localized beneath the indenter due to the close-packed nature of the surface. Although crack extension slows significantly at a depth of 150 Å, lateral tearing is observed near the crack flanks, indicating resistance to further crack advancement along the loading direction. In the O4 direction, stress initially accumulates on the right side of the crack, causing slow lateral propagation. When the indentation depth reaches 200 Å, the stress intensification becomes sufficiently high to trigger rapid crack extension. The asymmetric stress distribution in this orientation makes it unsuitable for analyzing intrinsic crack-propagation characteristics.
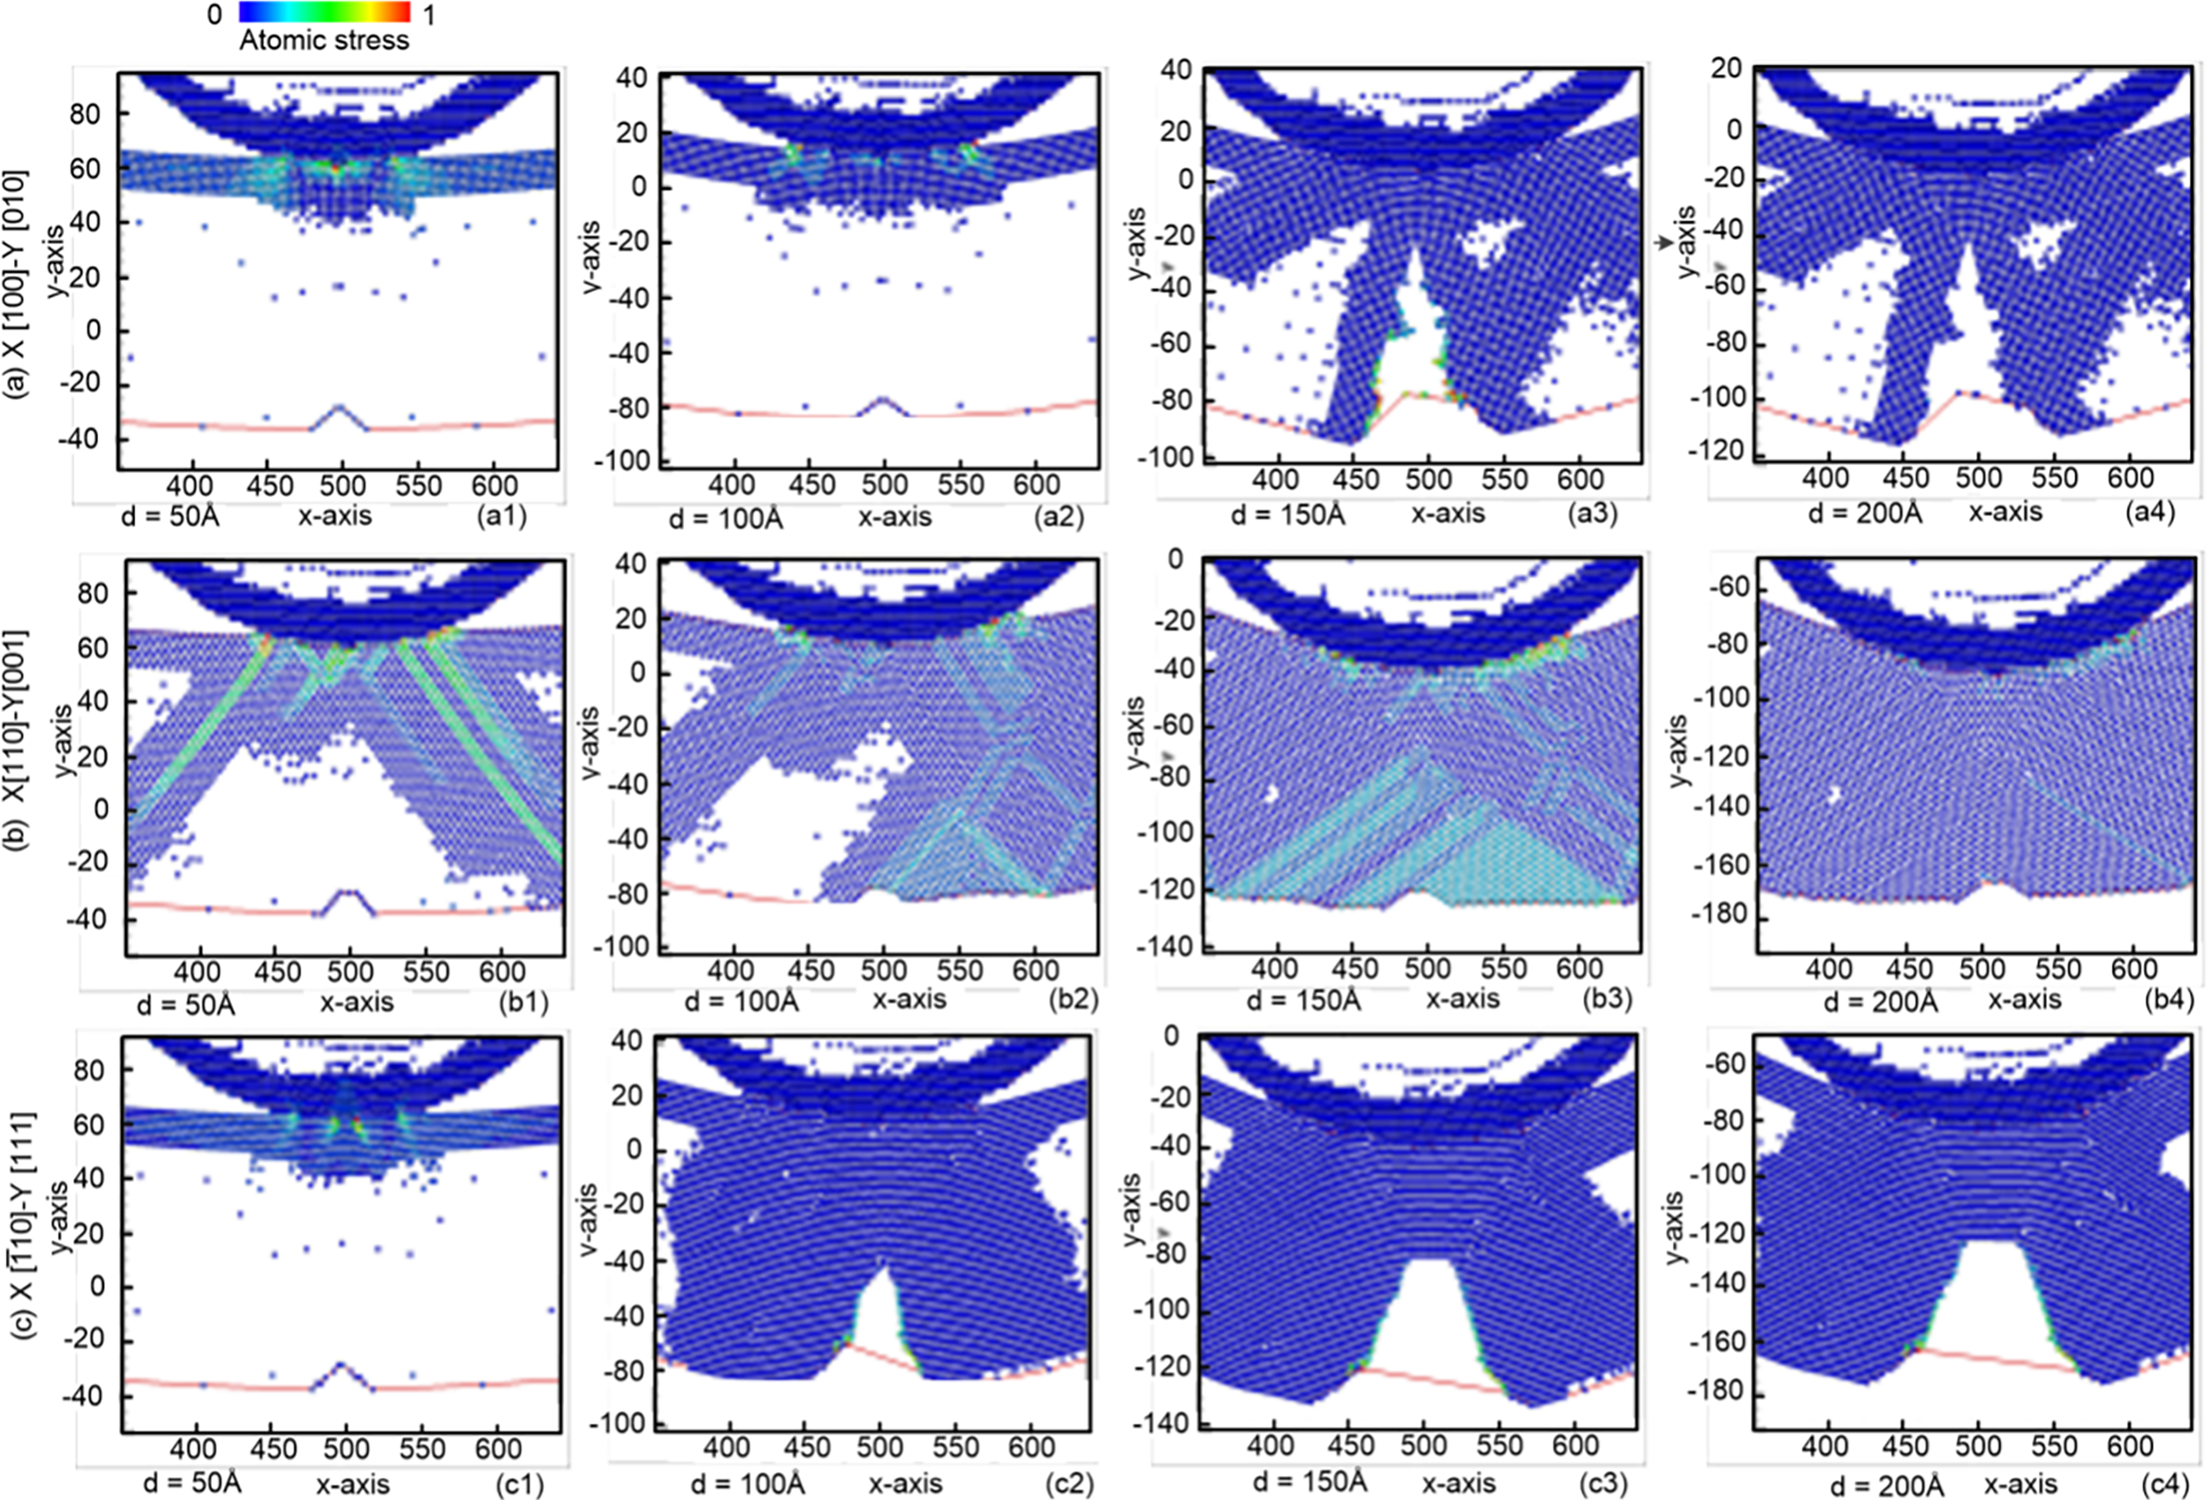
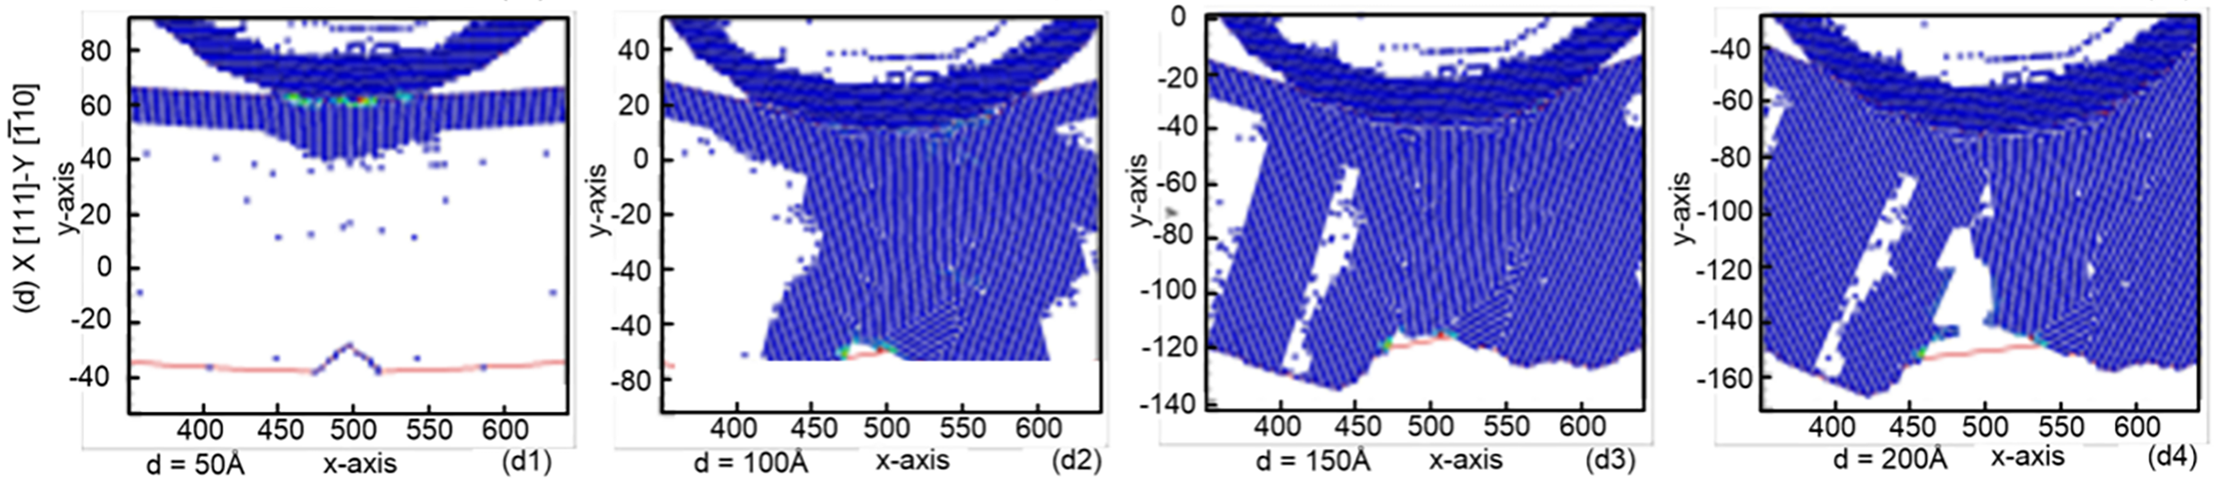
Figure 8: Equivalent atomic stress diagrams for samples conducted with different crystal orientations: (a) [100], [010], [001]; (b) [110], [001], [0
Fig. 9 shows the atomic strain diagrams for samples conducted with different crystal orientations: (a) [100], [010], [001]; (b) [110], [001], [0
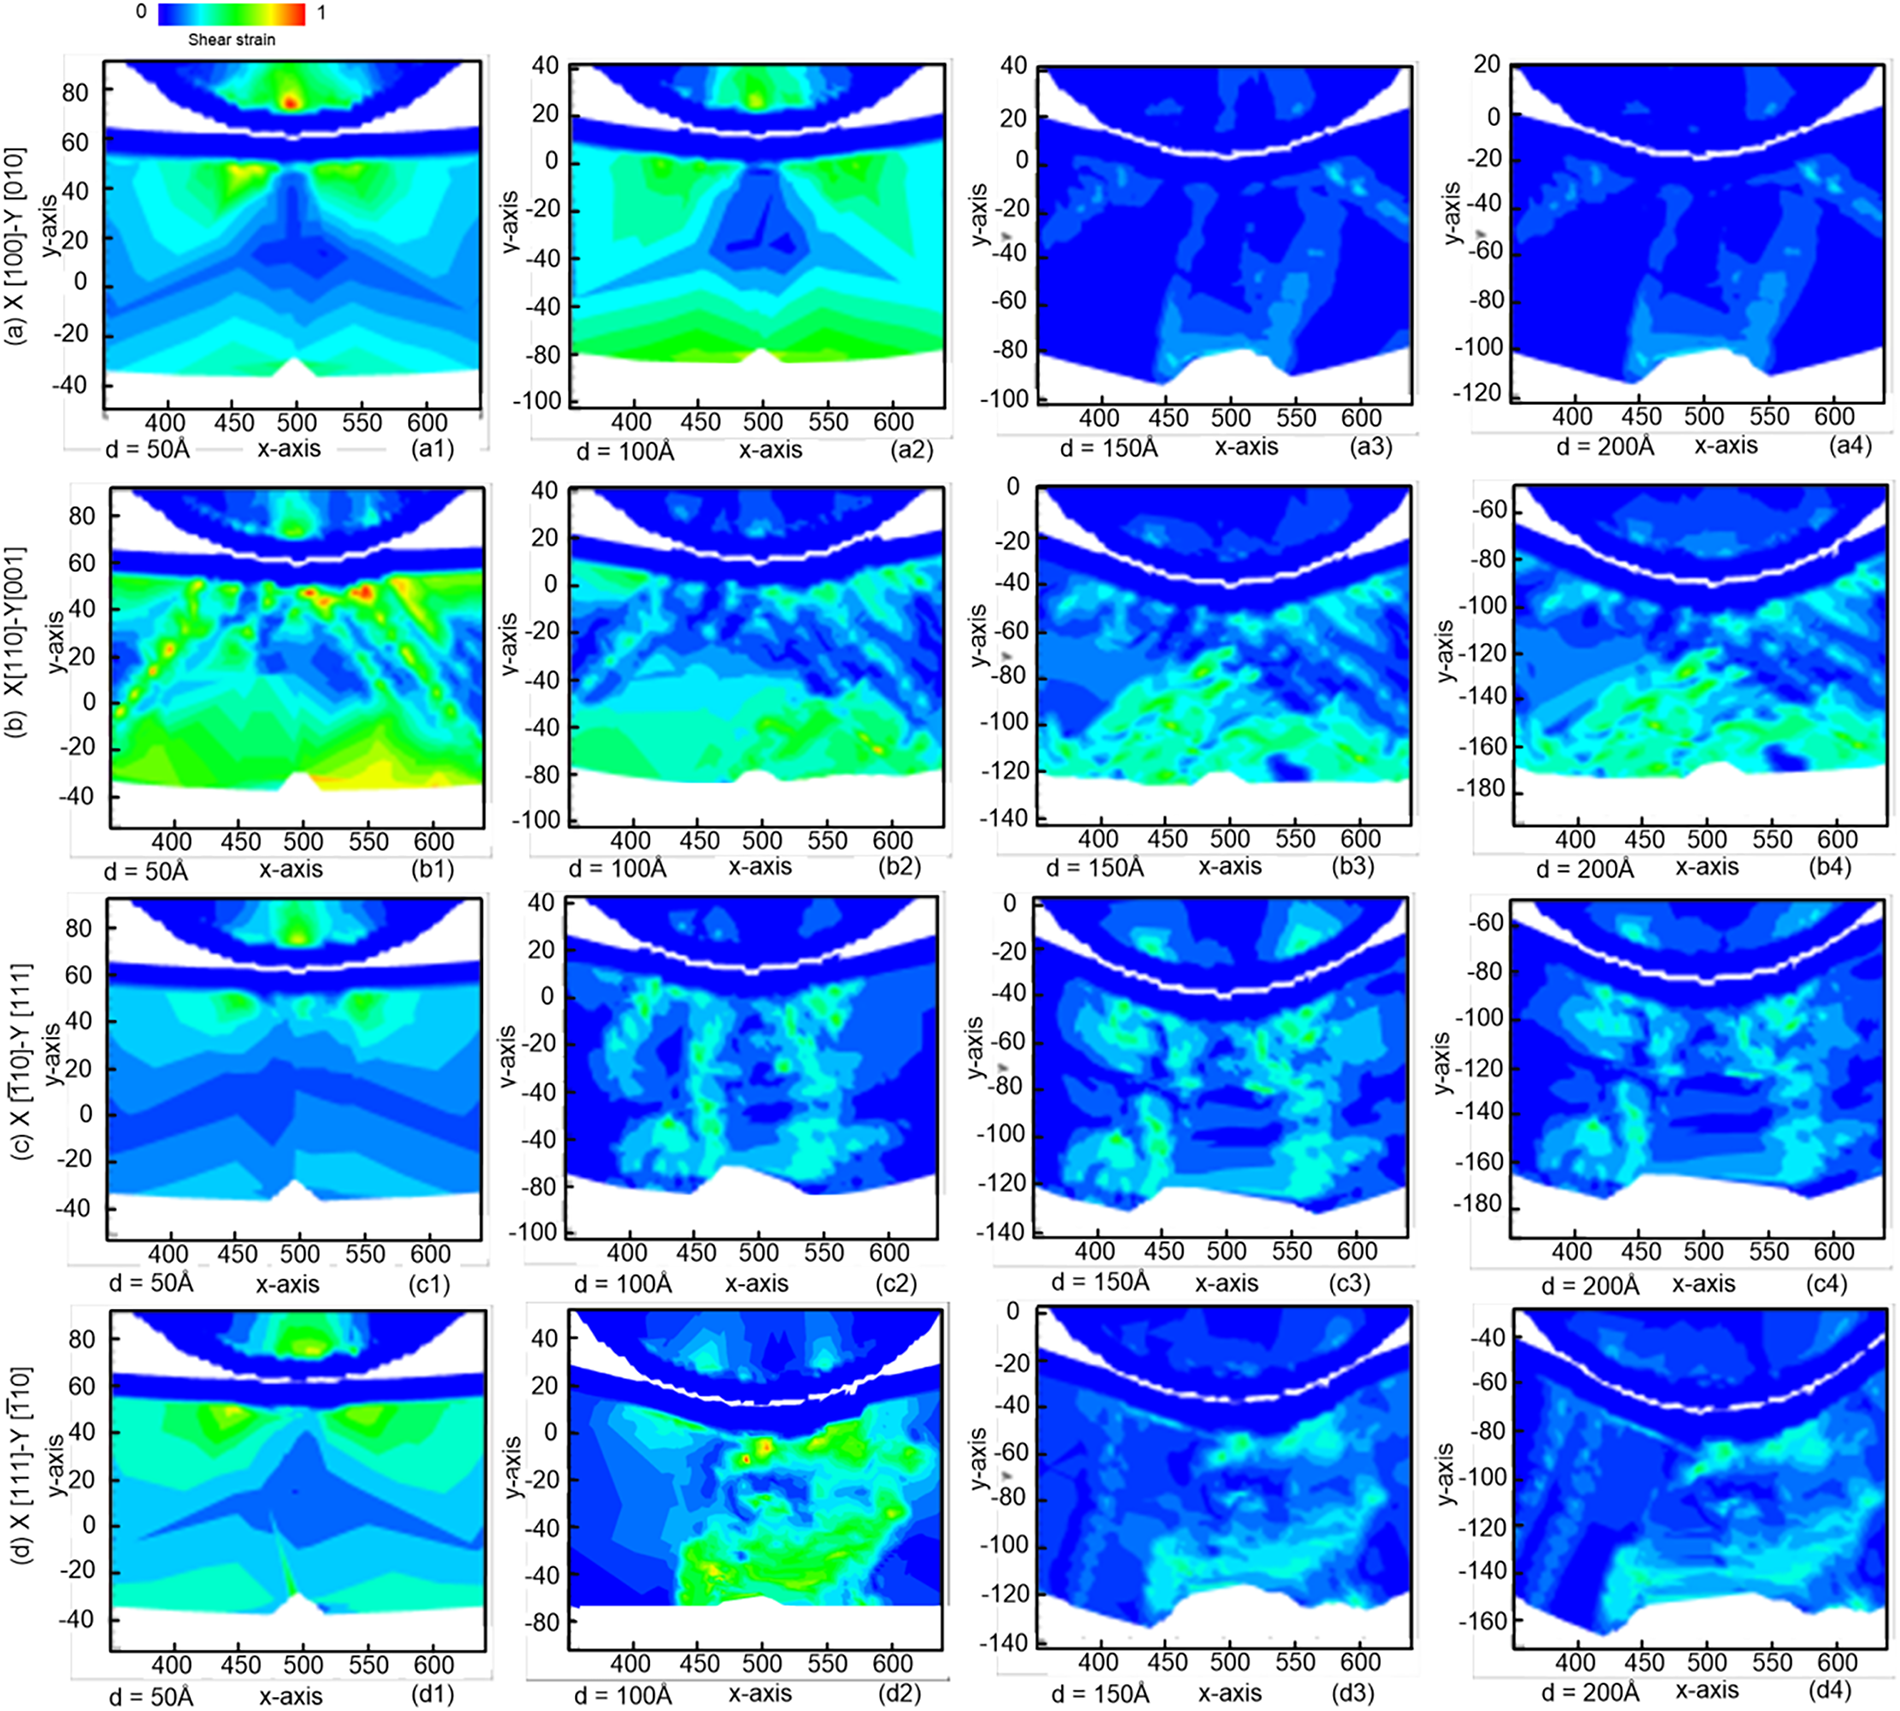
Figure 9: Atomic strain diagrams for samples conducted with different crystal orientations: (a) [100], [010], [001]; (b) [110], [001], [0
The stress-displacement curve in Fig. 10 indicates that the O1 direction presents a relatively smooth stress curve during bending. Initially, the material demonstrates linear behavior, marking the elastic interval. Once the applied force surpasses the yield strength, the material enters the plastic region, where deformation increases without a significant rise in applied force. Upon exceeding the breaking strength, the stress sharply declines to zero due to material failure. For the O2 redirection, significant vibrations are observed after pressing, and the stress increases without a subsequent drop, as the indenter does not induce material damage. In contrast, for the O3 and O4 directions, apparent yield and fracture strengths are evident. However, due to the close-packed surface structure, the material’s stress continues to increase beyond the fracture strength without visible material failure in the stress diagram. Notably, Sections 3.3 and 3.4 of this study utilize the sample with the crystal orientation O1: [100],[010],[001] as the redirection for simulation.
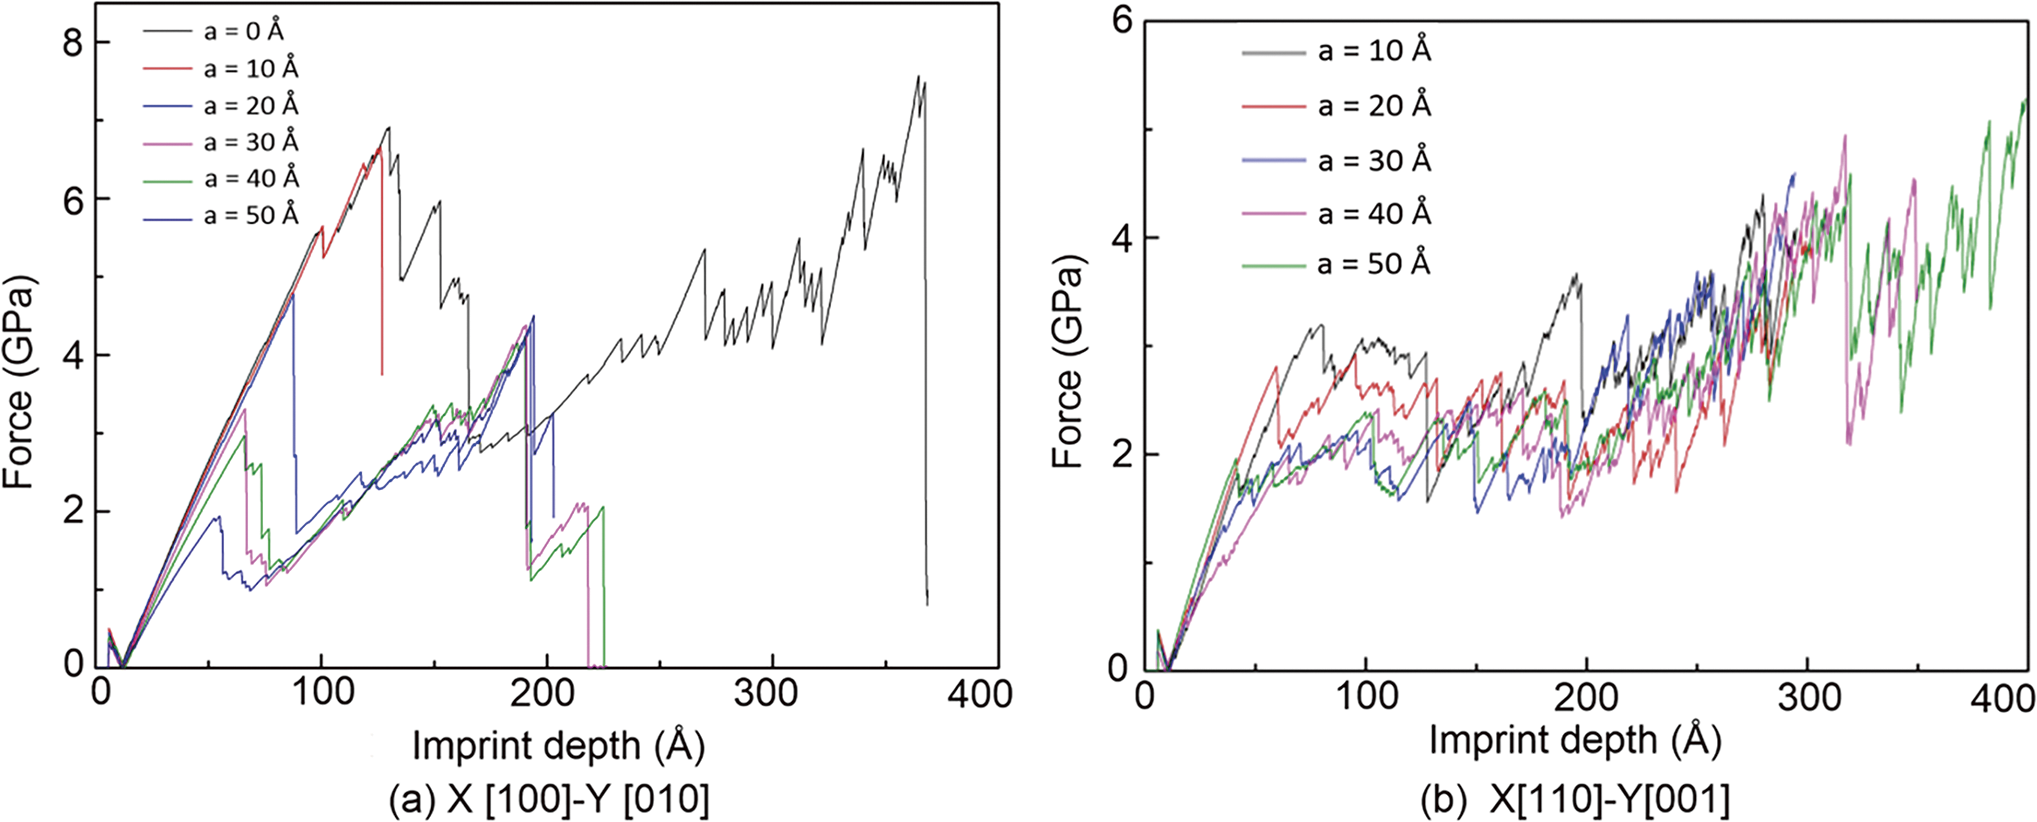
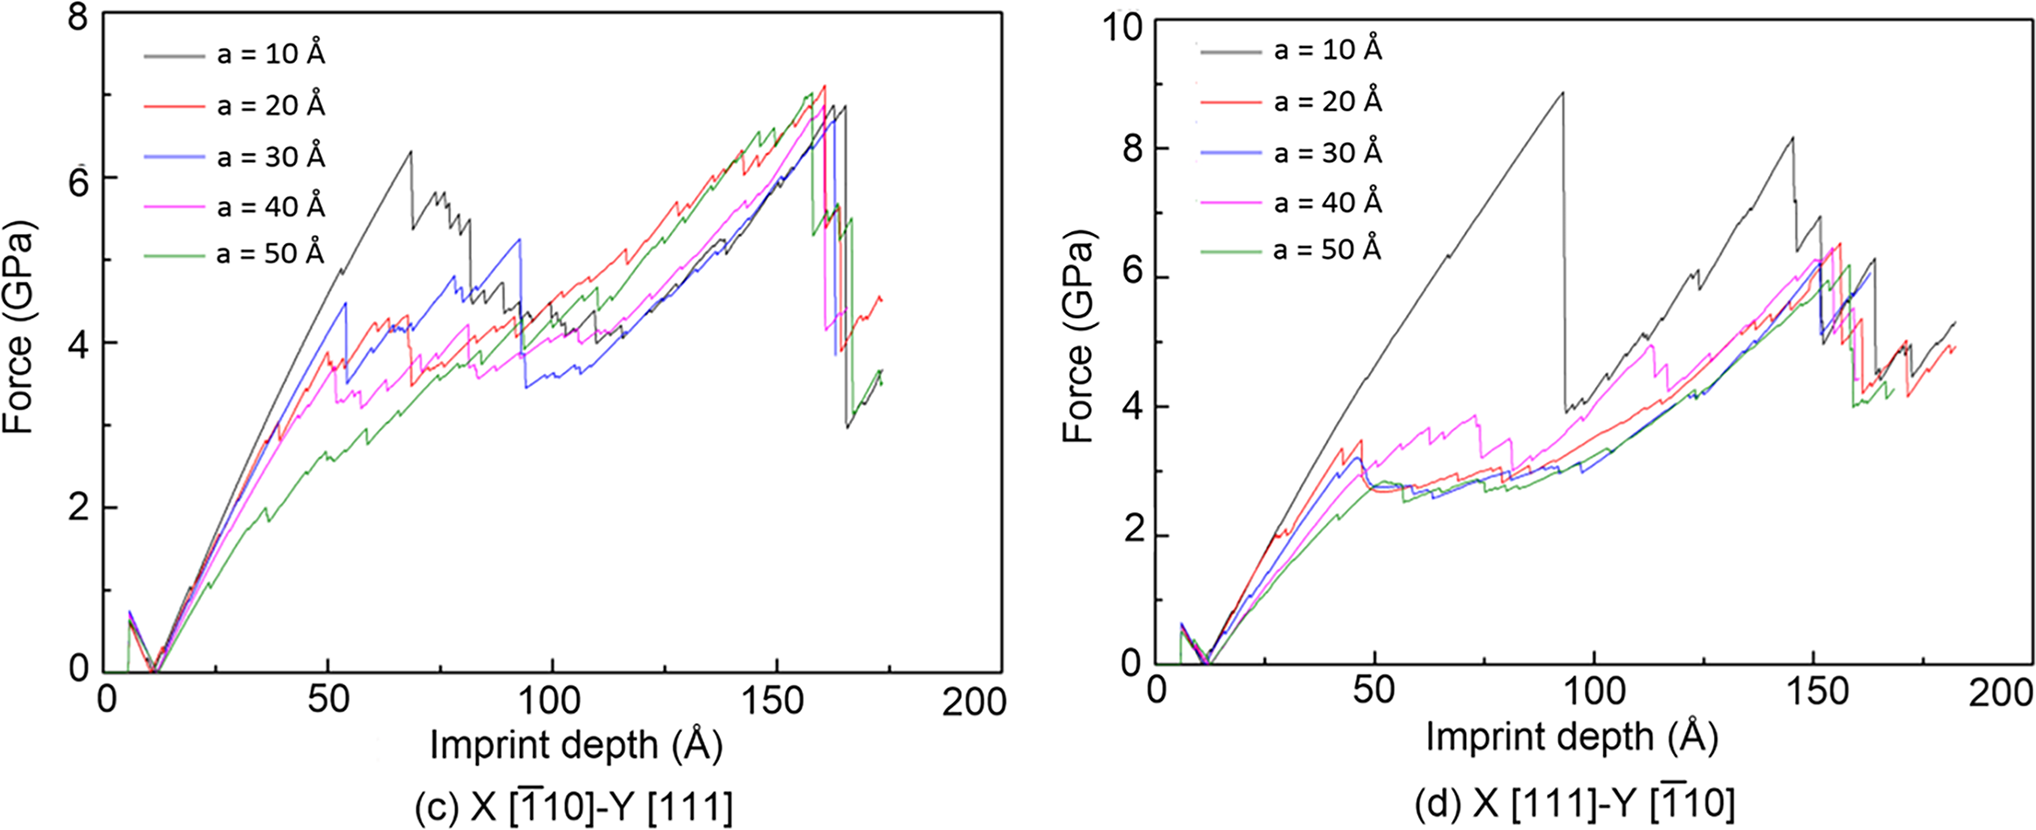
Figure 10: Force-imprint depth curves for samples conducted with different crystal orientations: (a) [100], [010], [001]; (b) [110], [001], [0
3.3 Effect of Different Imprint Depths
Pre-existing cracks refer to defects or fractures already present in materials, which can significantly influence their strength and durability. These cracks may result from imperfections formed during the manufacturing process or damage incurred during use or handling. Moreover, variations in crack height impact both the material’s strength and the progression of crack extension. This section investigates the fracture strength of the material and the crack extension trends under various imprint depths, ranging from 50 to 200 Å, for samples containing pre-cracks with heights of 0, 10, 20, 30, 40, and 50 Å. The findings are also compared to those of samples without pre-crack structures.
Under normal circumstances, if there are cracks in the material itself, the growth rate of the cracks will usually accelerate as the stress level increases. Therefore, the higher the crack height, the greater the stress at that location, and the earlier the crack will grow. This phenomenon can also be observed in this study. Fig. 11 shows the crack extension at various imprint depths when the sample contains different pre-cracks with heights of 0, 10, 20, 30, 40, and 50 Å. It can be seen that the time point at which crack extension occurs depends on the pre-crack heights; crack extension initiates earlier when the sample has a larger pre-crack height. However, when the imprint depth increases, the rate of crack development slows down for the specimen with a higher pre-crack height. In other words, the extent of crack extension is more substantial when the sample has a lower pre-crack height.
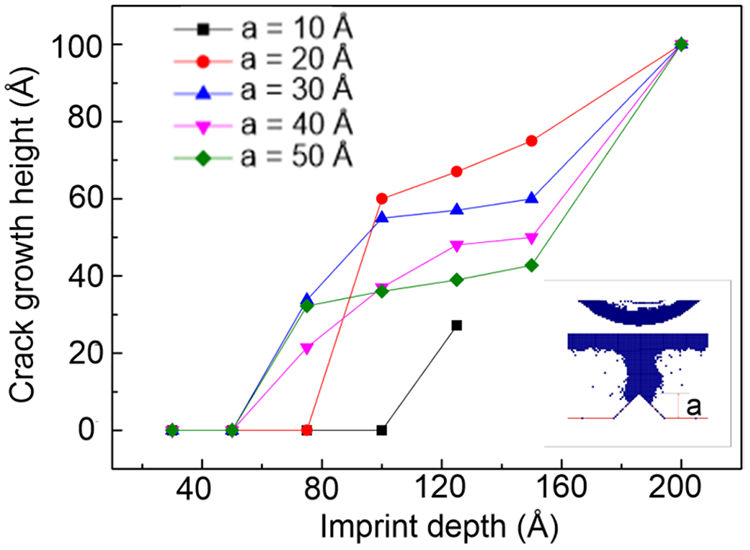
Figure 11: Crack extension under various imprint depths for samples containing pre-cracks with heights of 0, 10, 20, 30, 40, and 50 Å
Fig. 12 shows the equivalent atomic stress diagrams for samples with pre-crack heights of 10, 20, 30, 40, and 50 Å. Although a deeper pre-crack reduces the residual strength of the material, the crack tip becomes increasingly blunted and the surrounding atoms undergo larger plastic rearrangements. This reduces the effective stress concentration at the crack tip, leading to a slower crack extension rate. Furthermore, Fig. 13 shows that the stress required to initiate crack propagation is lower for deeper pre-cracks, while Fig. 14 indicates that the strain distribution around the crack tip becomes more uniform at larger crack depths. This combination of reduced stress concentration and increased atomic rearrangement contributes to the slower propagation rate observed in deeper cracks. Therefore, the crack extension trend becomes more stable and consistent when the pre-crack height reaches 50 Å, justifying the use of 50 Å, as the reference crack depth in Section 3.4.
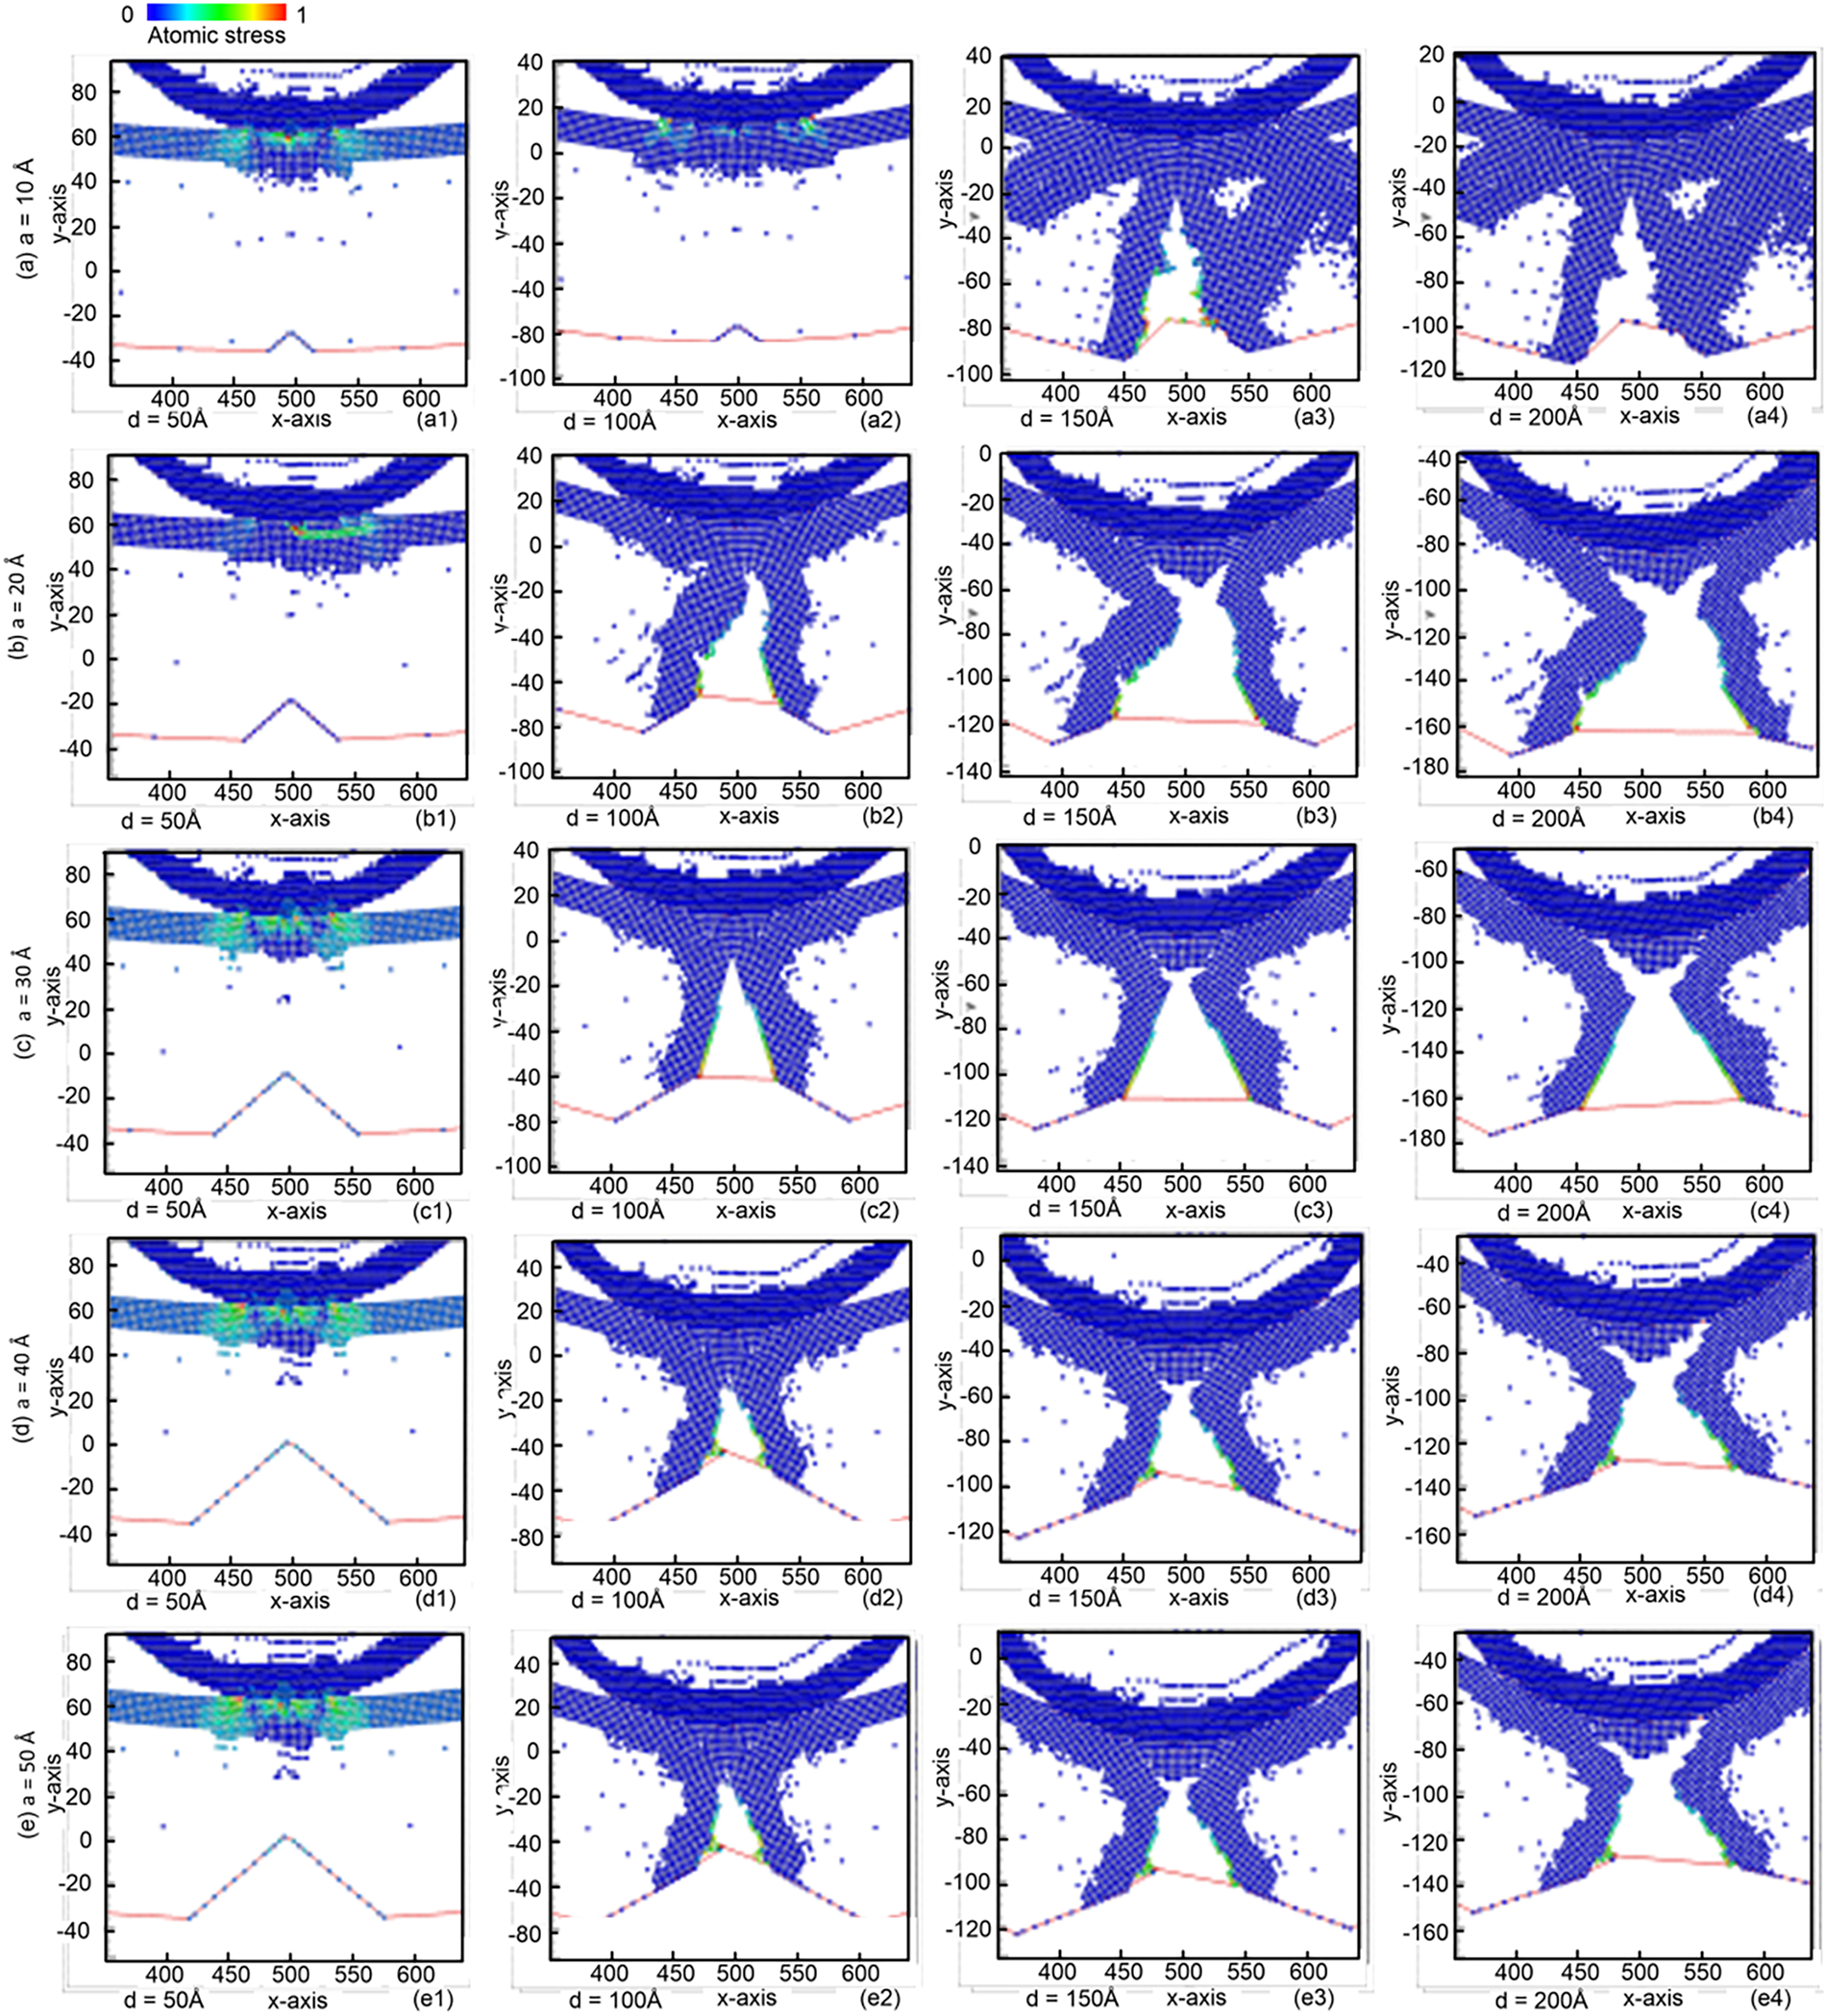
Figure 12: Equivalent atomic stress diagrams for samples with pre-crack heights: (a) 10 Å; (b) 20 Å; (c) 30 Å; (d) 40 Å; and (e) 50 Å. For each pre-crack height, diagrams at different crack depths are shown as follows: (a1–e1) 50 Å; (a2–e2) 100 Å; (a3–e3) 150 Å; and (a4–e4) 200 Å
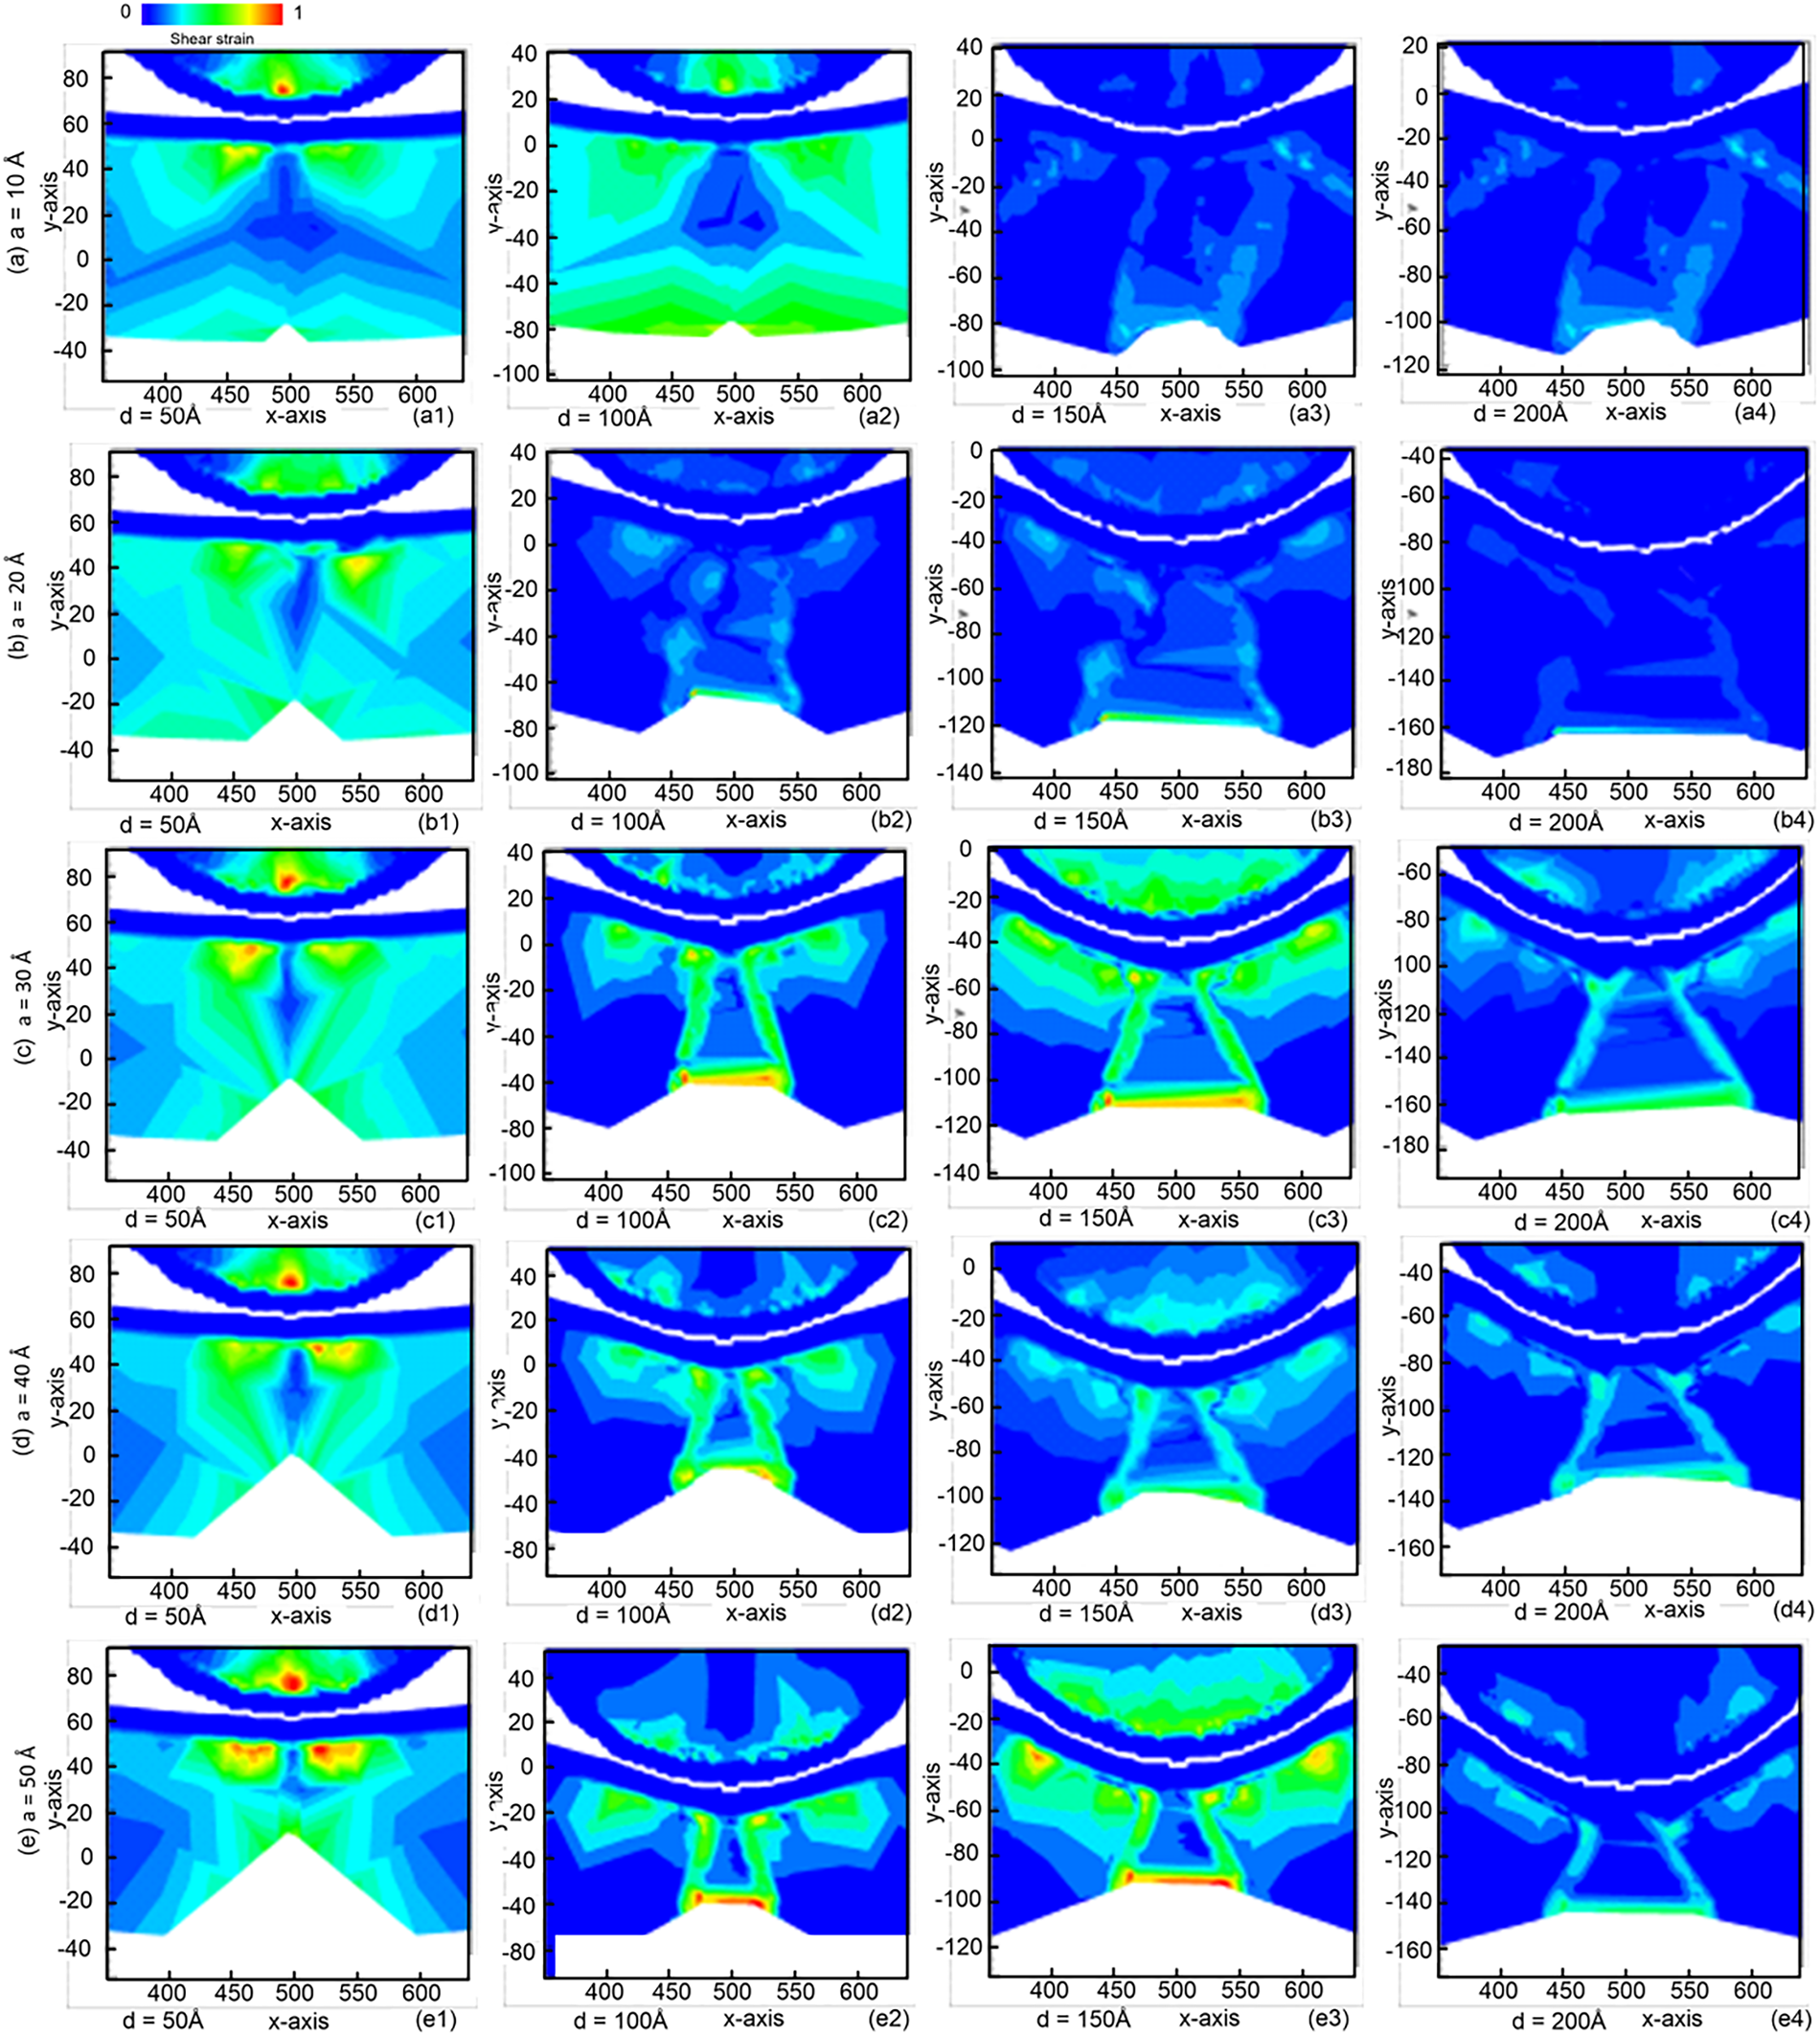
Figure 13: Atomic strain for samples with pre-crack heights: (a) 10 Å; (b) 20 Å; (c) 30 Å; (d) 40 Å; and (e) 50 Å. For each pre-crack height, diagrams at different crack depths are shown as follows: (a1–e1) 50 Å; (a2–e2) 100 Å; (a3–e3) 150 Å; and (a4–e4) 200 Å
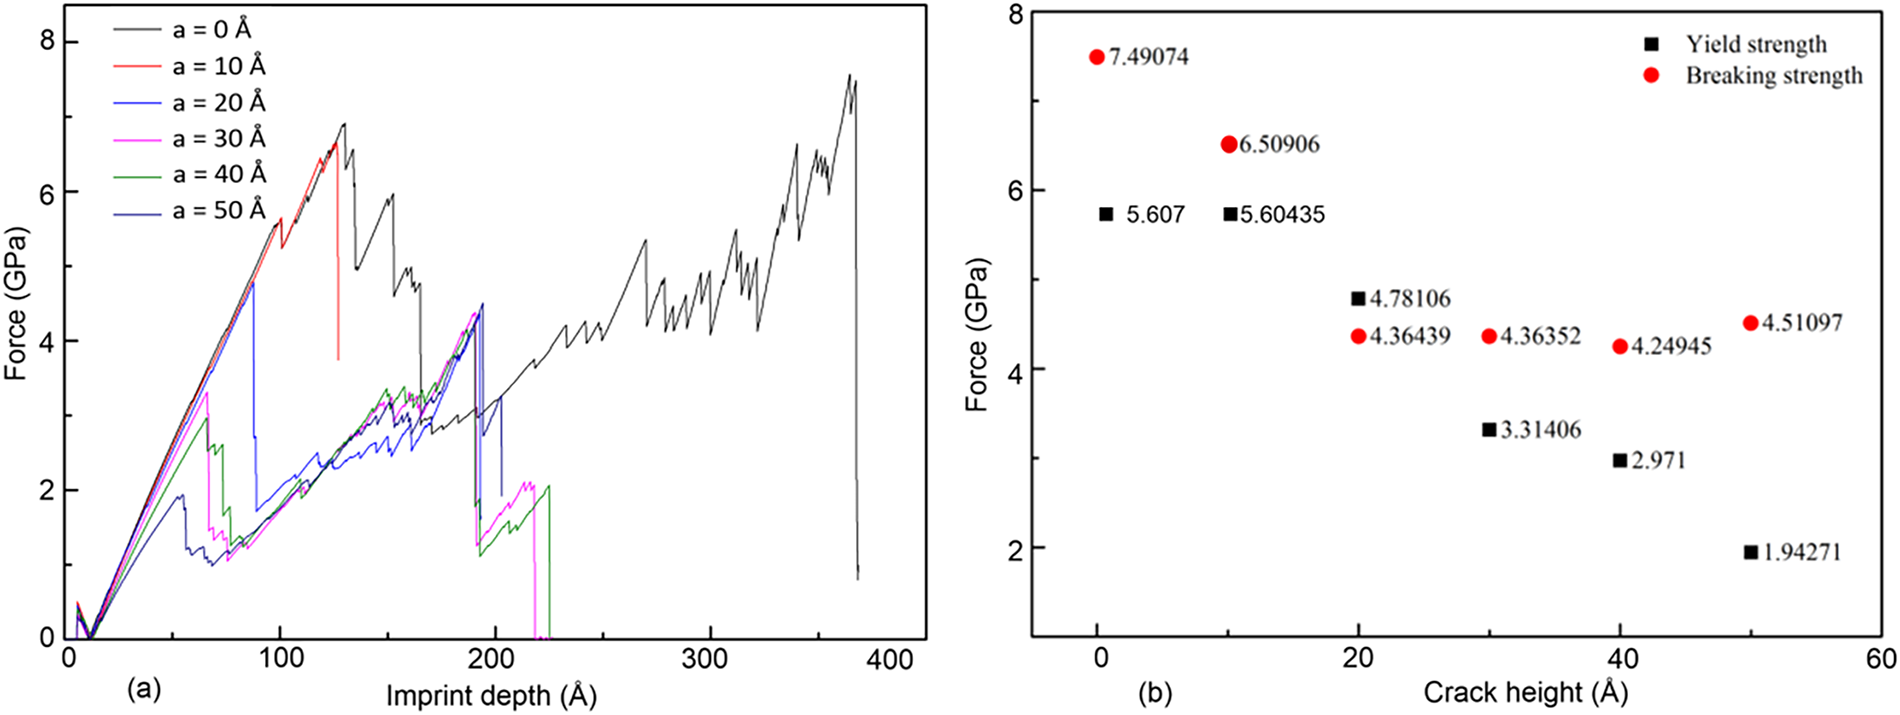
Figure 14: (a) force-imprint depth curve, (b) yield strength and breaking strength for samples with pre-crack heights of 0, 10, 20, 30, 40, and 50 Å
Fig. 14a shows the force-imprint depth curve for samples with various pre-crack heights of 0, 10, 20, 30, 40, and 50 Å. A small force component (at position A) emerges before imprinting due to adhesion between the indenter and the sample. The samples undergo a series of events, transitioning from elastic to plastic deformation and ultimately to complete fracture. The sample with a pre-crack height of 10 Å fails earlier, while the sample without a pre-crack exhibits the highest durability. The yield and breaking strengths are shown in Fig. 14b. The results indicate that yield strength decreases as the pre-crack height increases. The yield and breaking strengths for the sample with a pre-crack height of 0 Å are the highest, whereas the minimum breaking strength is observed in the sample with a pre-crack height of 40 Å.
3.4 Effect of Different Crack Angles
Fig. 15 shows the crack extension for samples with different pre-crack angles of 0°, 30°, 45°, 60°, and 90° for samples containing a pre-crack with a height of 50 Å. The results indicate that the crack extension heights for the sample with a crack angle of 60° are the largest, while they are relatively similar at the various crack angles of 0°, 30°, 45°, and 90°. The crack development process is fastest during the print depth stages from 0 to 80 Å and from 150 to 200 Å for all pre-crack samples. The specimen’s tear-off slows when the imprint depth is between 80 to 150 Å, as the deformation process inside the samples impedes crack development.
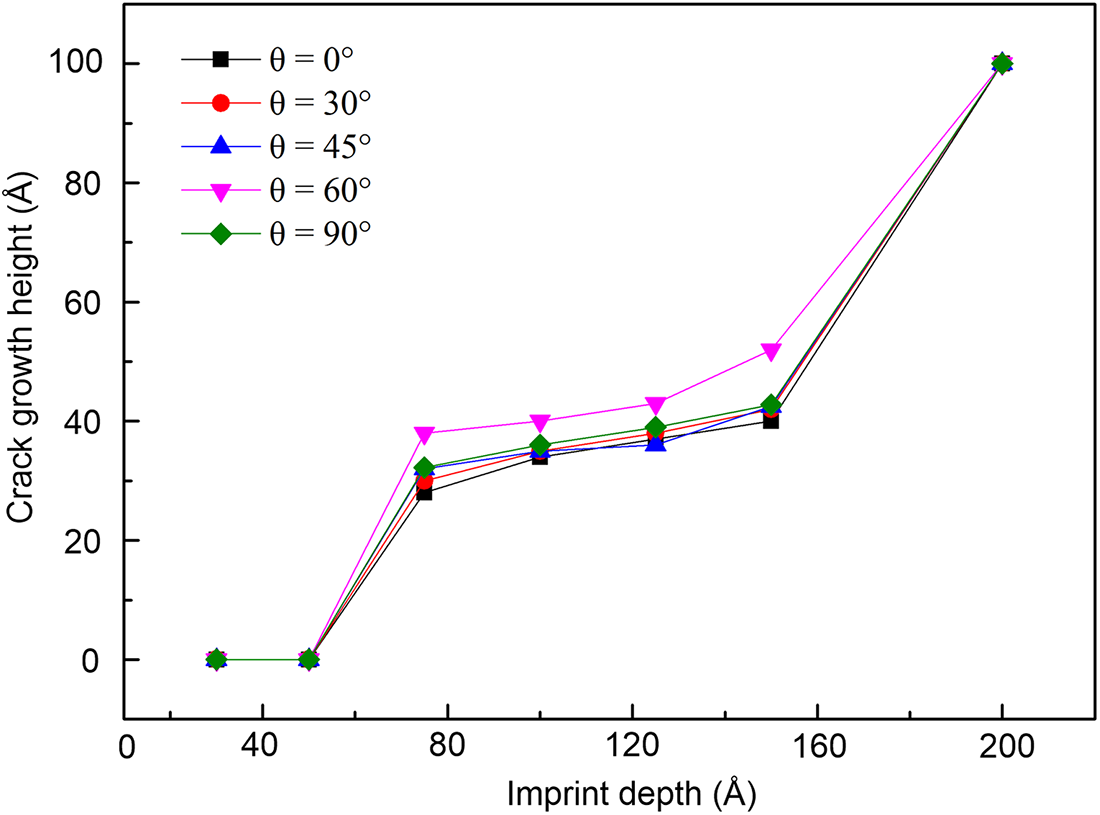
Figure 15: Crack extension for samples with different pre-crack angles of 0°, 30°, 45°, 60°, and 90° for samples containing a pre-crack with a height of 50 Å
Fig. 16 shows the equivalent atomic stress diagrams for samples with different pre-crack angles—(a) θ = 0°, (b) θ = 30°, (c) θ = 45°, (d) θ = 60°, and (e) θ = 90°, all containing a pre-crack height of 50 Å. As the crack angle increases, the stress distribution at the crack front becomes more intensified and asymmetric. A larger crack angle produces a greater difference between the maximum and minimum principal stresses, resulting in stronger stress concentration along one side of the crack. This anisotropic stress field amplifies the local driving force for crack growth, thereby promoting more pronounced crack extension.
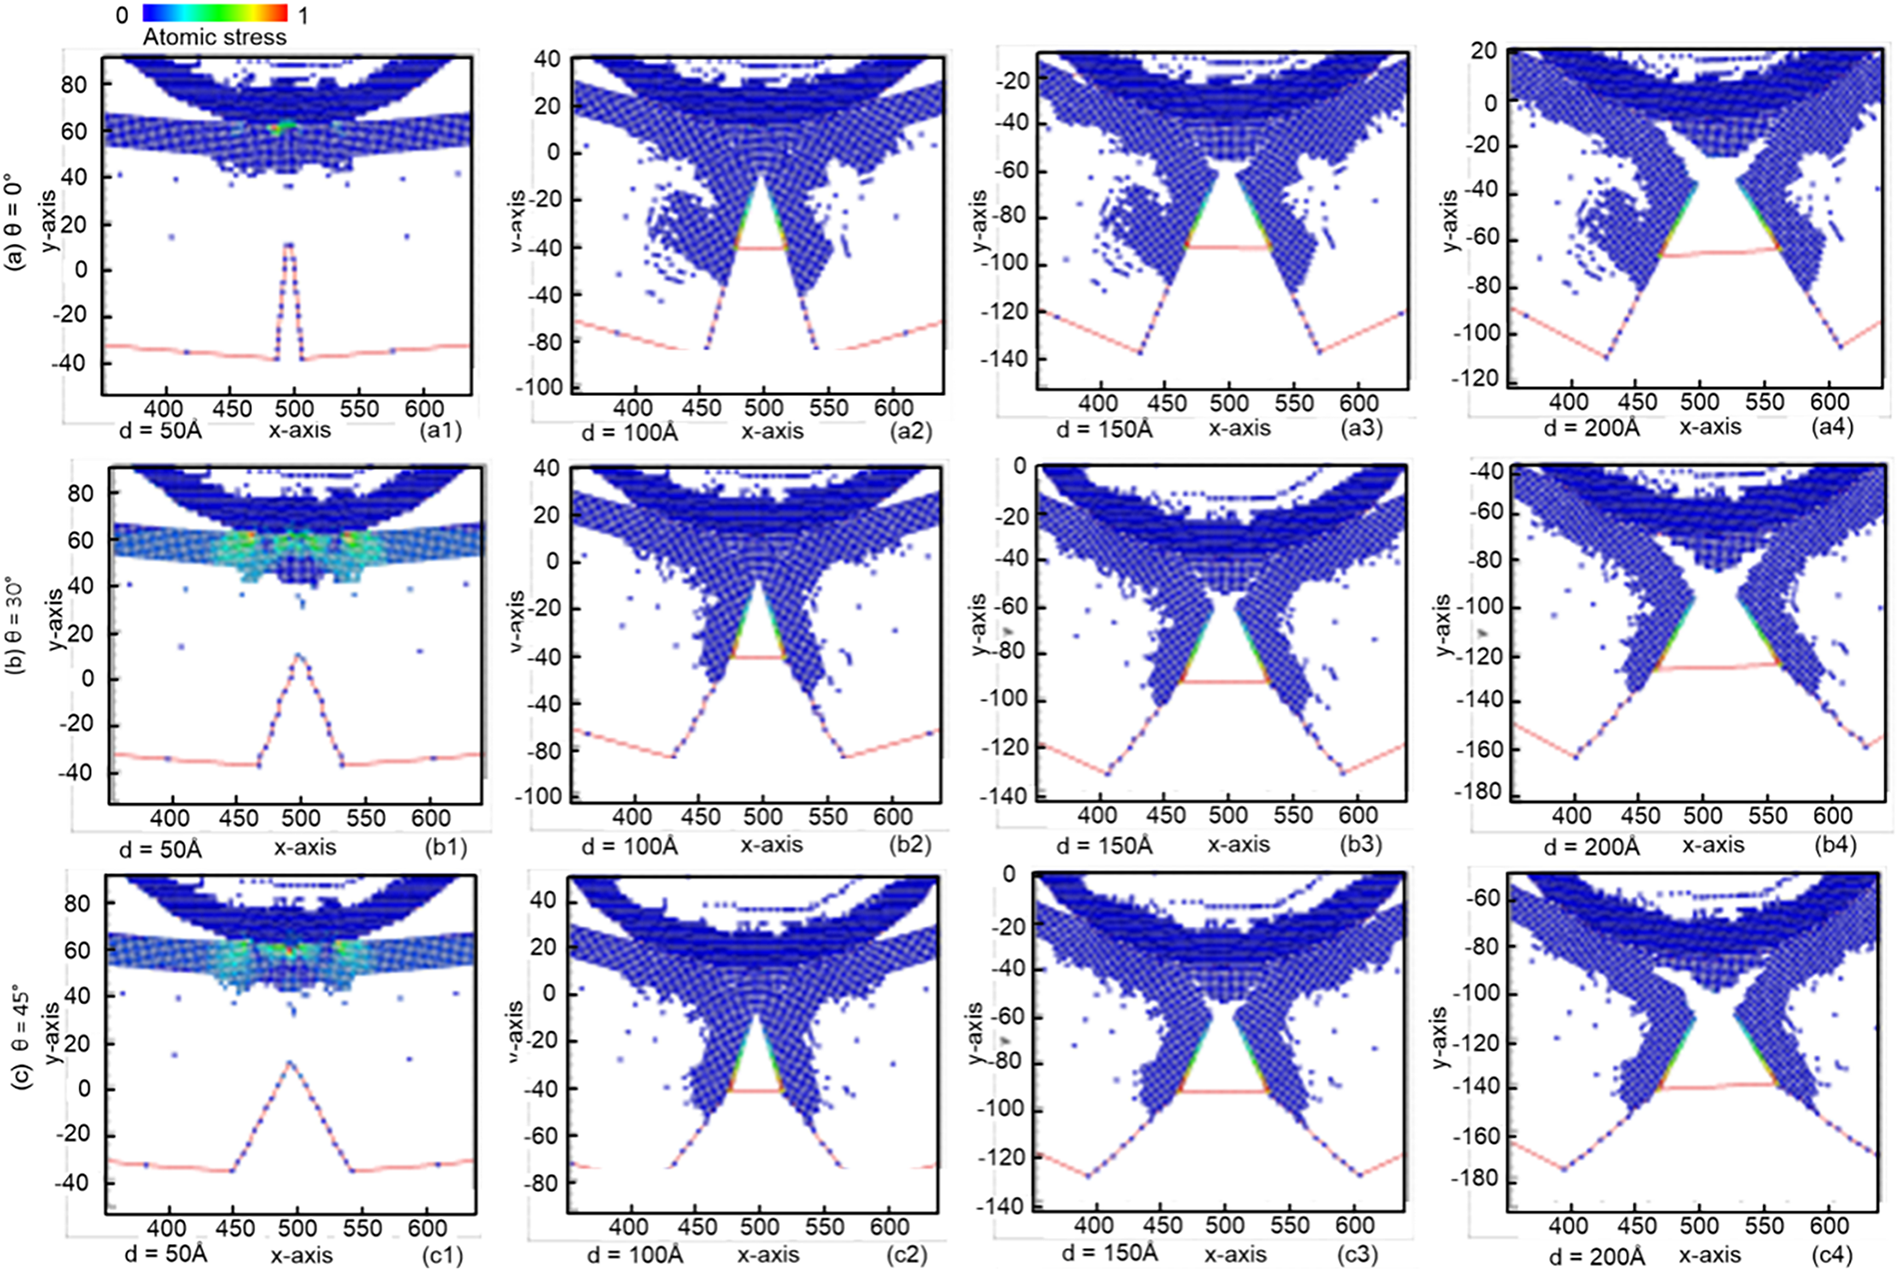
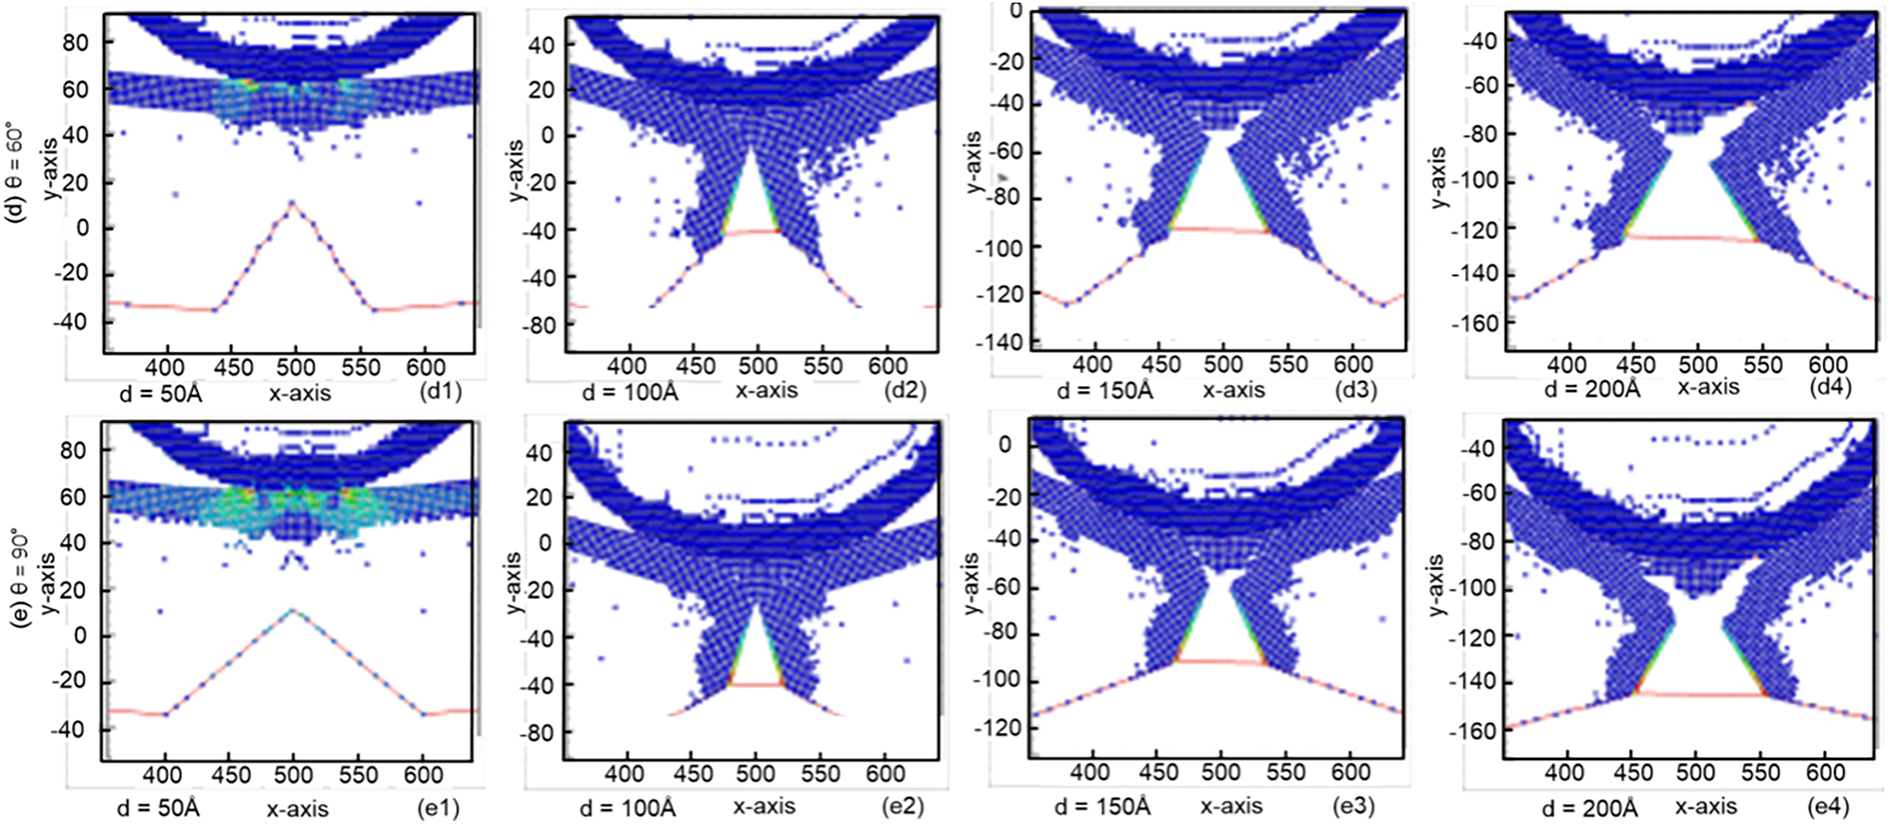
Figure 16: Equivalent atomic stress diagrams for samples with different pre-crack angles: (a) θ = 0°, (b) θ = 30°, (c) θ = 45°, (d) θ = 60°, and (e) θ = 90° for samples containing a pre-crack with a height of 50 Å
The strain field also follows similar trends. As the crack angle increases, the strain gradient in front of the crack tip becomes sharper, and the strain localization becomes more severe. Regions with steep strain gradients are more susceptible to plastic deformation, which accelerates crack propagation under imprint loading (Fig. 17). Fig. 17 shows the corresponding atomic strain distributions for the same pre-crack angles. During the early stages of imprinting (d = 50 Å), high shear-strain regions cluster at the crack tip, but the intensity of this clustering decreases with increasing crack angle. As imprint depth increases, the number of high–shear-strain atoms decreases because strain energy is progressively released through crack growth. These observations indicate that pre-crack angle strongly modifies the effective mode mixity at the crack tip. Higher angles increase the contribution of shear loading, raise the local stress intensity factor, and reduce crack-tip shielding, collectively resulting in faster and more directional crack extension.
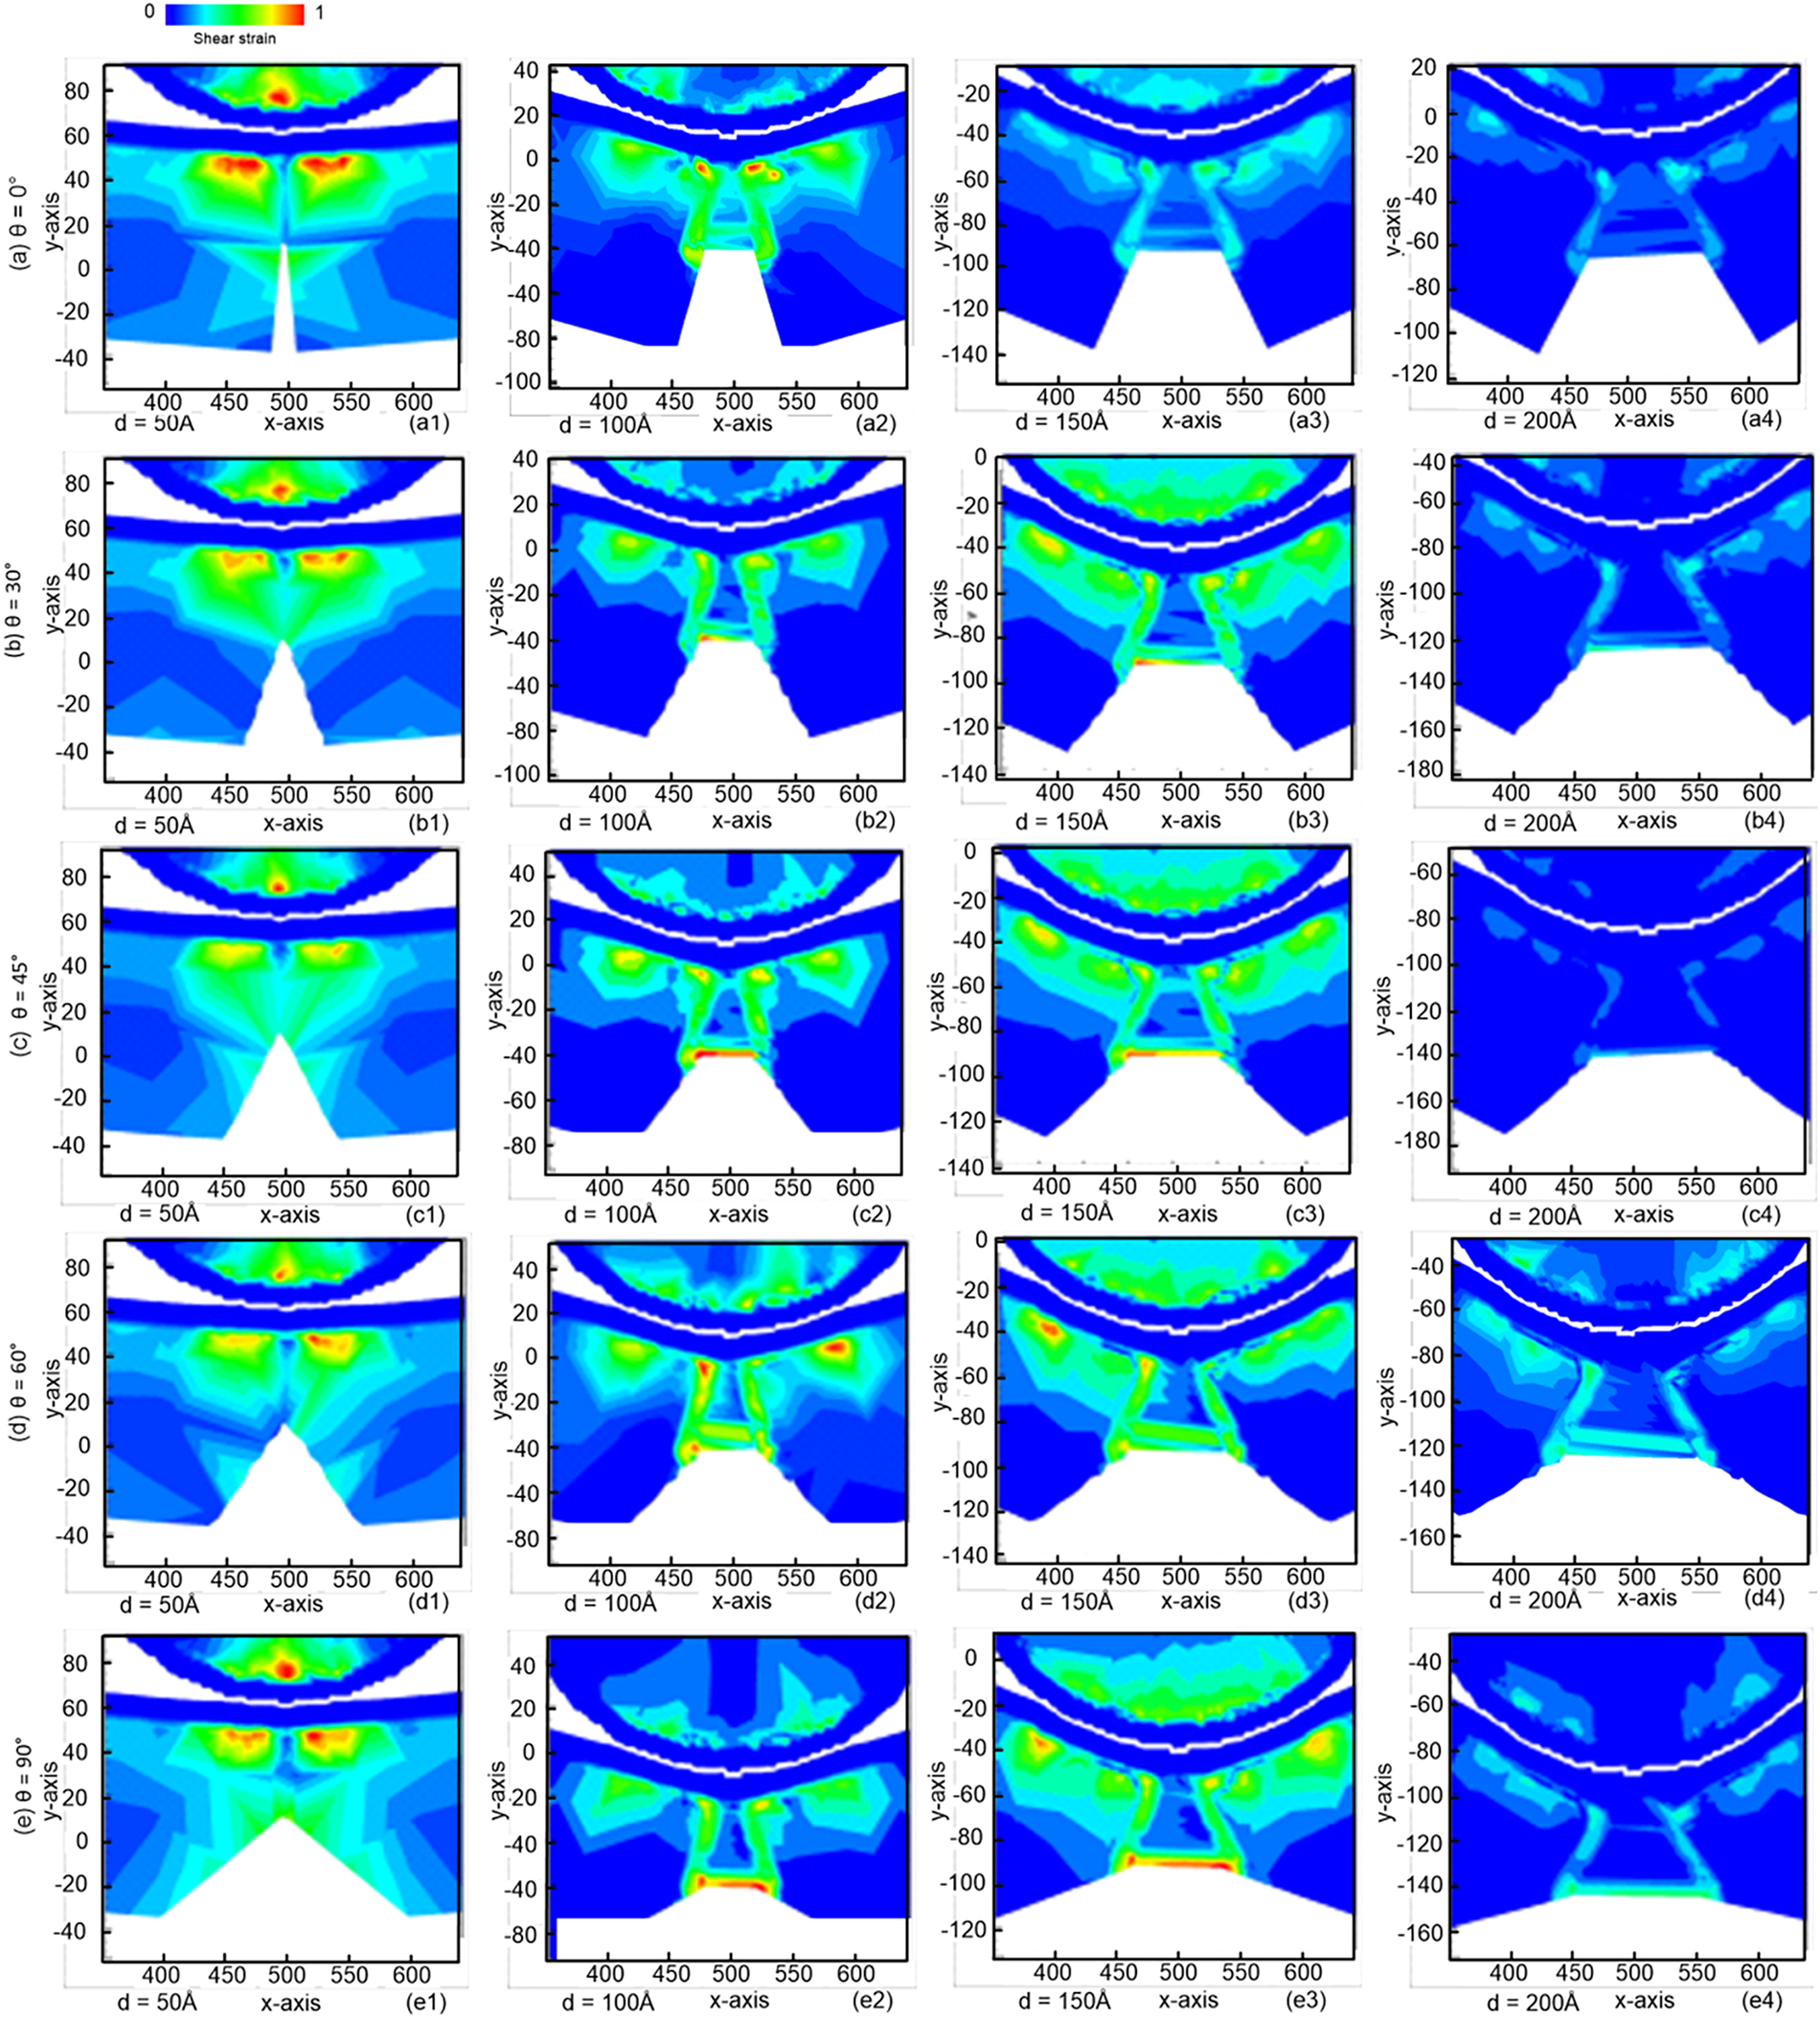
Figure 17: Atomic strain for samples for samples with different pre-crack angles: (a) θ = 0°, (b) θ = 30°, (c) θ = 45°, (d) θ = 60°, and (e) θ = 90° for samples containing a pre-crack with a height of 50 Å
Fig. 18a presents the force-imprint depth curve for samples with different pre-crack angles of 0°, 30°, 45°, 60°, and 90° for samples containing a pre-crack with a height of 50 Å. he results indicate that the stress is proportional to the displacement in the first stage (position A) due to the adhesion forces between the indenter and the substrate at the initial imprint state. The next stage corresponds to the elastic interval, reflecting the material’s elastic properties. In this interval, cracks would theoretically begin to unload. Although the phenomenon of spring back occurs, this stage is too brief, so the crack starts to unload before it has sufficient time to propagate, making it impossible to observe spring back. In the regions corresponding to the red and blue lines, representing specimens with pre-crack heights of 10 and 20 Å, irregular curves are observed. This occurs because the damage to the overall material structure by the cracks is not significant enough to be clearly observed. Therefore, the indenter must exert a greater force during the pressing process. However, since the indenter is not a perfect nickel body, the top of the indenter also sustains damage during the pressing, which affects the detection of stress changes and contributes to the observed phenomenon. The breaking strength point at the far right side of the curve represents the fracture strength of the material. According to the material’s characteristics, the fracture strength is greater than the yield strength. This study also observes a similar phenomenon when the pre-crack angles are 45°, 60°, and 90°. However, for pre-crack angles of 0° and 30°, the breaking strength points are smaller than the yield strength, as a small number of substrate atoms remain connected due to the slight pre-crack angle. Fig. 18b provides a clearer comparison of yield and rupture strength stress values. When discussing the structure containing pre-cracks, the highest fracture strength is 4.51 GPa for a crack angle of 90°, while the lowest fracture strength is 1.978 GPa for a crack angle of 30°.
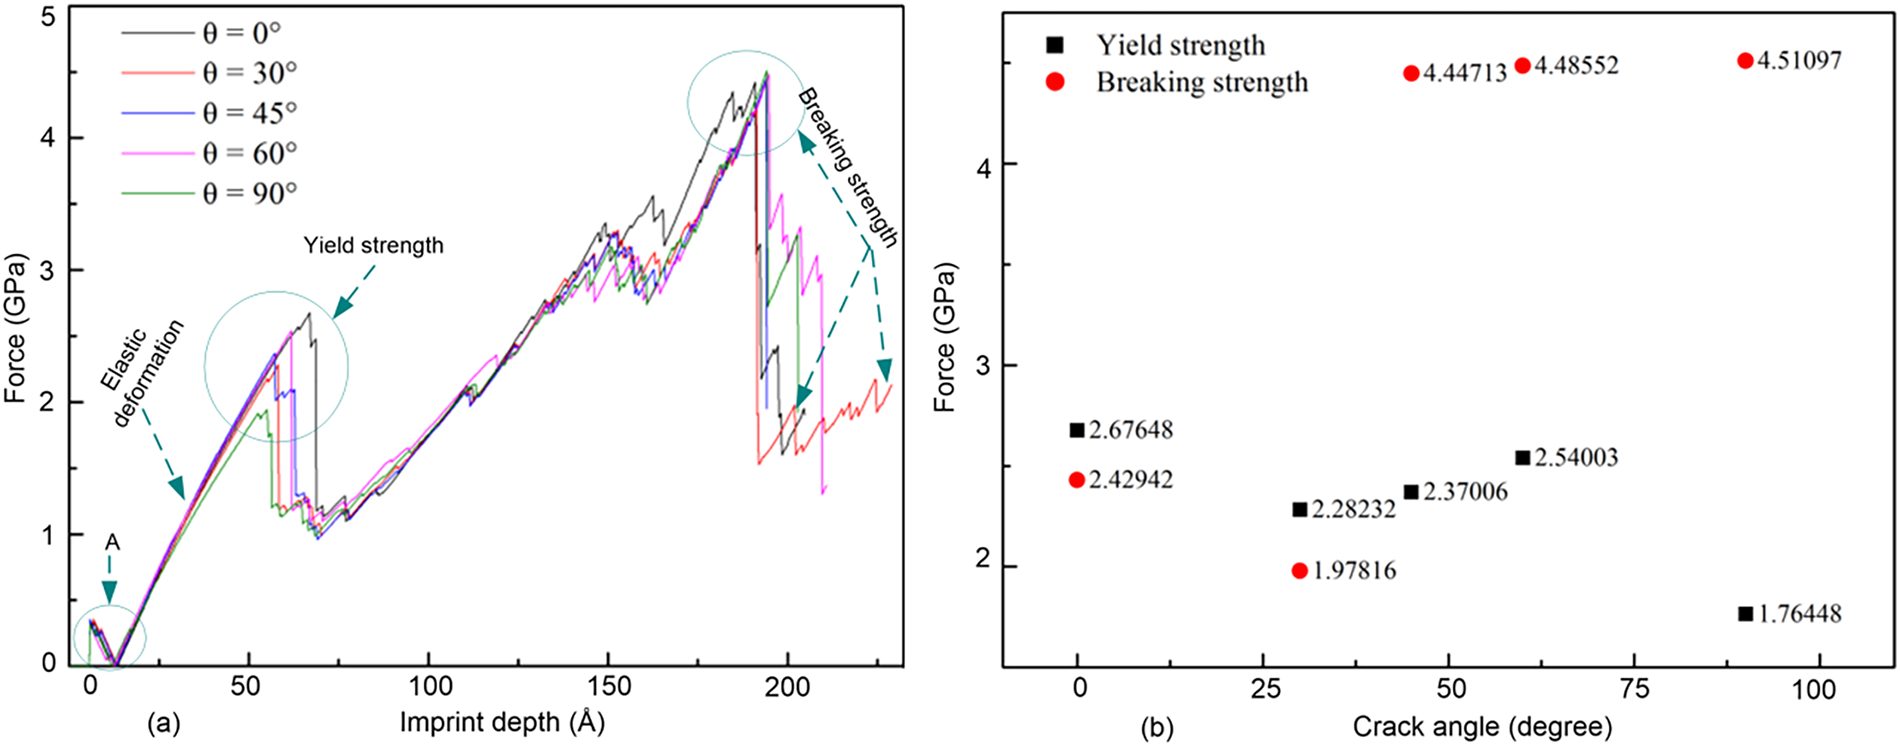
Figure 18: (a) force-imprint depth curve, (b) yield strength and breaking strength for samples with different pre-crack angles of 0°, 30°, 45°, 60°, and 90° for samples containing a pre-crack with a height of 50 Å
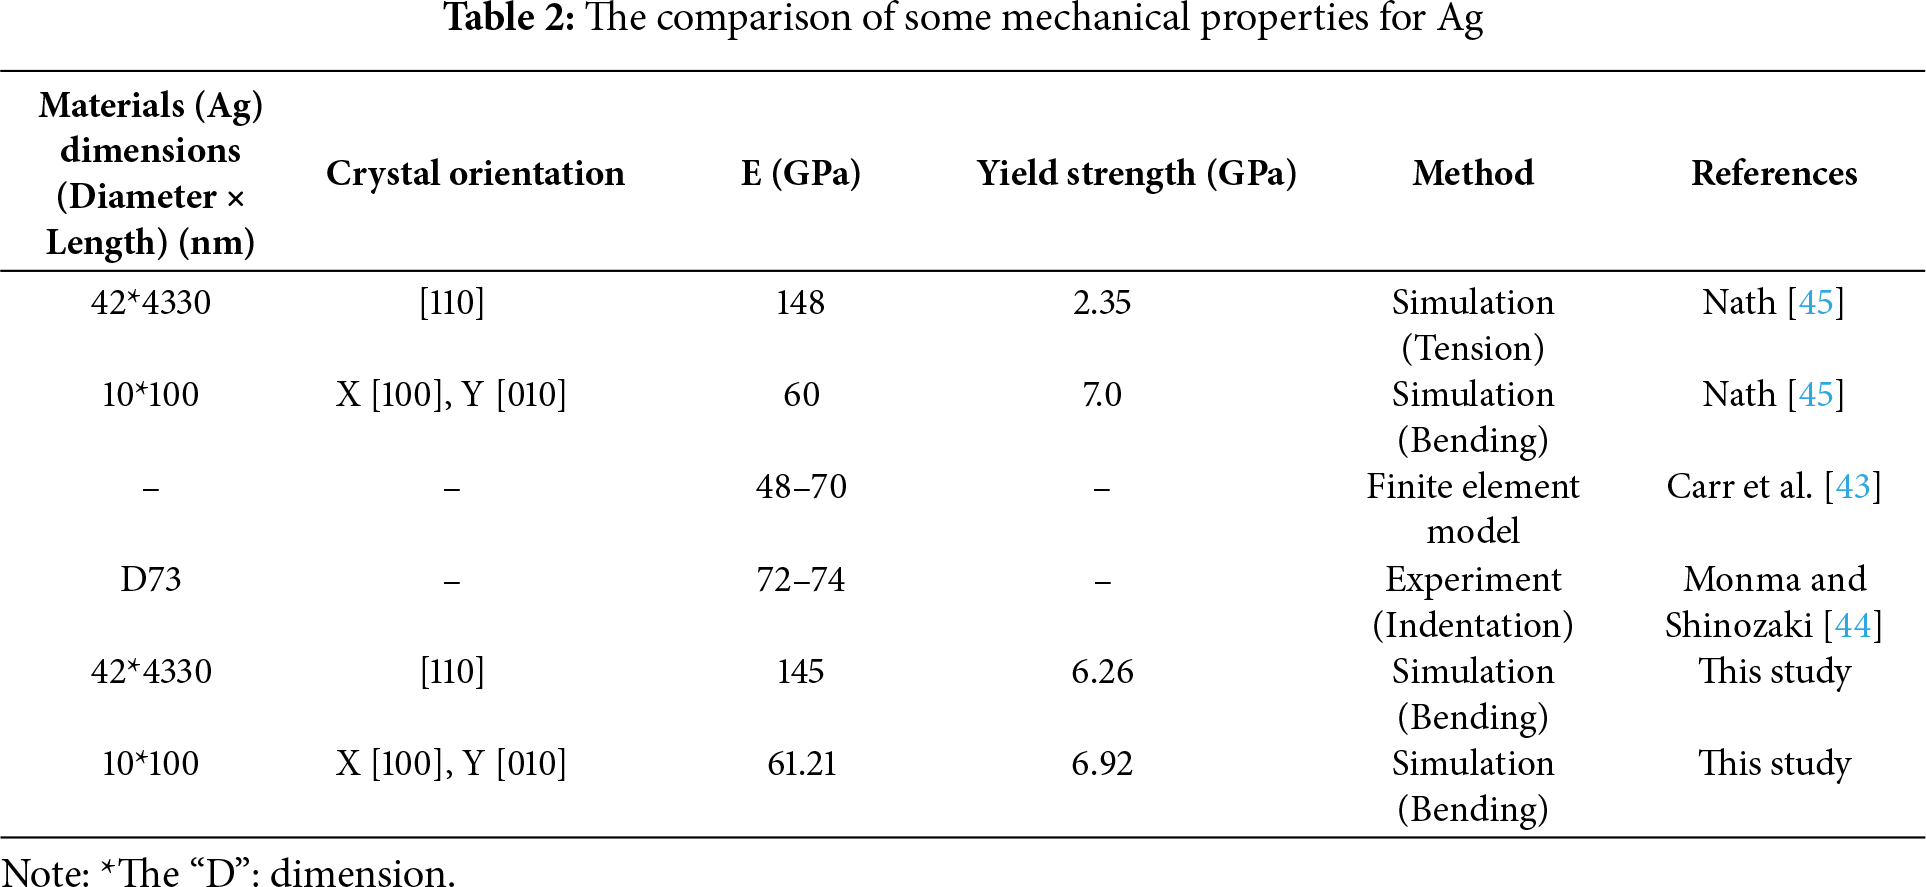
Table 2 compares the E and yield strength of the Ag material. In this study, E and yield strength were calculated for Ag round bars with dimensions (Diameter × Length) of 10 × 100 nm2 and 42 × 4330 nm2 using 3D bending simulations, to facilitate comparison with previous studies. The larger Ag nanowires (42 × 4330 nm2) were oriented along the [110] crystallographic direction, while the smaller wires (10 × 100 nm2) were aligned along the X [100] and Y [010] directions to properly account for the lattice orientation in the cross-section. The results indicate that the Young’s modulus of intact silver in this study is 145 and 61.21 GPa, which differ by only about 2% from the values of 145 and 60 GPa reported by Nath [45] for samples with dimensions of 42 × 4330 nm2 and 10 × 100 nm2, respectively. The yield strength obtained in this study is 6.92 GPa, differing by only 0.2% from the 7 GPa reported in the literature. These results show that both the Young’s modulus and yield strength in this study are in good agreement with the values reported by Nath [45]. The validation in this study refers exclusively to baseline material properties and the established performance of the optimized QC methodology. Previous works have shown that this QC framework accurately reproduces indentation responses, dislocation nucleation, and crack-tip processes in FCC metals, confirming the numerical fidelity of the model. These validations ensure the reliability of the method, but do not correspond to the validation of the novel mechanistic findings presented in this work. The fracture strengths obtained here (1–5 GPa) are much higher than the macroscopic UTS of bulk silver (0.1–0.2 GPa) due to defect-free nanoscale samples and surface-dominated energy states, consistent with previous MD and QC studies of Ag nanowires and other FCC metals.
In this work, the optimized quasi-continuum (QC) method was employed to investigate the imprint-induced crack-extension behavior of single-crystal silver nanowires with various indenter geometries, crystal orientations, pre-crack heights, and pre-crack angles. Within the scope of the present simulation conditions, the following conclusions can be made:
Effect of indenter geometry: The circular indenter tends to produce a more uniform stress distribution around the crack tip, which may promote smoother crack extension. In contrast, the square indenter generates stress concentrations at its corners, reducing the likelihood of stable crack growth. The non-uniform stress field induced by the conical indenter can lead to rapid crack propagation, potentially reducing structural stability.
Effect of crystal orientation: Among the four investigated crystal orientations, only the O1 orientation exhibits a strain distribution that promotes stable crack extension under imprinting. In the O2, O3, and O4 orientations, strain localization or asymmetric stress fields hinder smooth crack propagation, resulting in slower crack growth or premature rupture. Therefore, within the scope of this study, O1 is the orientation most favorable for crack extension.
Effect of pre-crack height: Increasing pre-crack height generally enhances the extent of crack extension under imprinting. In the present simulations, the most pronounced crack growth was observed for a pre-crack height of 50 Å.
Effect of pre-crack angle: Larger pre-crack angles tend to facilitate crack extension under imprint loading. The combination of a 50 Å crack height and a 60° crack angle produced the greatest crack-extension increment, whereas the highest fracture strength (4.51 GPa) was obtained for the 50 Å crack with a 90° angle. The high fracture strength values are consistent with the theoretical strength of defect-free nanoscale Ag and therefore substantially exceed bulk experimental values.
Overall, these findings provide atomistic insights into how nanoscale crack geometry and crystal orientation influence deformation and fracture during imprinting. The results should be interpreted within the limitations of the current simulations, and future work incorporating experimental validation or larger-scale atomistic models would further strengthen the conclusions.
Acknowledgement: The authors acknowledge the assistance of the computational facility team for providing simulation resources. No funding information appears in this section.
Funding Statement: This research was supported by the National Science and Technology Council (NSTC), Taiwan, under Grant Nos. NSTC 114-2221-E-992-029-MY3 (Te-Hua Fang), NSTC 114-2221-E-992-030-MY3 (Te-Hua Fang), and NSTC 113-2221-E-992-067-MY3 (Te-Hua Fang), and by the Industry–Academia Cooperation Project No. 113A00262 (Te-Hua Fang). URLs to the sponsor websites are available at: https://www.nstc.gov.tw.
Author Contributions: The authors confirm contribution to the paper as follows: Study conception and design: Te-Hua Fang, Thi-Xuyen Bui. Data collection: Thi-Xuyen Bui. Analysis and interpretation of results: Thi-Xuyen Bui, Yu-Sheng Lu, Yu-Sheng Liao. Draft manuscript preparation: Thi-Xuyen Bui, Yu-Sheng Lu, Yu-Sheng Liao. All authors reviewed the results and approved the final version of the manuscript.
Availability of Data and Materials: The data that support the findings of this study are available from the corresponding author, Te-Hua Fang, upon reasonable request.
Ethics Approval: Not applicable. This study did not involve human participants or animal subjects.
Conflicts of Interest: The authors declare no conflicts of interest to report regarding the present study.
References
1. Chen Y, He Y, Guo J, Yang X, Guo B, Shen H, et al. A new one-component electrically conductive adhesive with excellent electrical conductivity and mechanical properties using tetra-functional polyurethane acrylate oligomers and silver particle fillers. Int J Adhes Adhes. 2023;124:103388. doi:10.1016/j.ijadhadh.2023.103388. [Google Scholar] [CrossRef]
2. Liu CH, Yu X. Silver nanowire-based transparent, flexible, and conductive thin film. Nanoscale Res Lett. 2011;6(1):75. doi:10.1186/1556-276X-6-75. [Google Scholar] [PubMed] [CrossRef]
3. Huang GW, Xiao HM, Fu SY. Paper-based silver-nanowire electronic circuits with outstanding electrical conductivity and extreme bending stability. Nanoscale. 2014;6(15):8495–502. doi:10.1039/c4nr00846d. [Google Scholar] [PubMed] [CrossRef]
4. Hwang B, Seol JG, An CH, Kim SH. Bending fatigue behavior of silver nanowire networks with different densities. Thin Solid Films. 2017;625(1):1–5. doi:10.1016/j.tsf.2017.01.048. [Google Scholar] [CrossRef]
5. Lee SH, Lim S, Kim H. Smooth-surface silver nanowire electrode with high conductivity and transparency on functional layer coated flexible film. Thin Solid Films. 2015;589(1):403–7. doi:10.1016/j.tsf.2015.05.073. [Google Scholar] [CrossRef]
6. Chen C, Nagao S, Suganuma K, Jiu J, Zhang H, Sugahara T, et al. Self-healing of cracks in Ag joining layer for die-attachment in power devices. Appl Phys Lett. 2016;109(9):093503. doi:10.1063/1.4962333. [Google Scholar] [CrossRef]
7. Tan D, Jiang C, Li Q, Bi S, Song J. Silver nanowire networks with preparations and applications: a review. J Mater Sci Mater Electron. 2020;31(18):15669–96. doi:10.1007/s10854-020-04131-x. [Google Scholar] [CrossRef]
8. Kumar A, Shaikh MO, Chuang CH. Silver nanowire synthesis and strategies for fabricating transparent conducting electrodes. Nanomaterials. 2021;11(3):693. doi:10.3390/nano11030693. [Google Scholar] [PubMed] [CrossRef]
9. Lee CJ, Park KH, Han CJ, Oh MS, You B, Kim YS, et al. Crack-induced Ag nanowire networks for transparent, stretchable, and highly sensitive strain sensors. Sci Rep. 2017;7(1):7959. doi:10.1038/s41598-017-08484-y. [Google Scholar] [PubMed] [CrossRef]
10. Seo Y, Ha H, Matteini P, Hwang B. A review on the deformation behavior of silver nanowire networks under many bending cycles. Appl Sci. 2021;11(10):4515. doi:10.3390/app11104515. [Google Scholar] [CrossRef]
11. Nguyen VT, Phan GAV. Atomistic insight into welding silver nanowires and interfacial characteristics of the welded zone. Mater Today Commun. 2023;34:105051. doi:10.1016/j.mtcomm.2022.105051. [Google Scholar] [CrossRef]
12. Luo H, Zhu H, Ayingmo AD, Zhang Y, Yu L. Ultra-stable Ag NWs transparent conductive film protected by AgCl and PbO2 passivation layer. Mater Sci Eng B. 2024;303:117304. doi:10.1016/j.mseb.2024.117304. [Google Scholar] [CrossRef]
13. Bui TX, Fang TH, Lee CI. Effects of flaw shape and size on fracture toughness and destructive mechanism inside Ni15Al70Co15 metallic glass. Comput Mater Sci. 2020;183:109807. doi:10.1016/j.commatsci.2020.109807. [Google Scholar] [CrossRef]
14. Li J, Wang Z, Zhang N, Shi T, Gilbert EP, Chen G, et al. Crack-tip plasticity mediated grain refinement and its resisting effect on the fatigue short crack growth. Int J Plast. 2024;181:104102. doi:10.1016/j.ijplas.2024.104102. [Google Scholar] [CrossRef]
15. Irwin GR. Analysis of stresses and strains near the end of a crack traversing a plate. J Appl Mech. 1957;24(3):361–4. doi:10.1115/1.4011547. [Google Scholar] [CrossRef]
16. Neto DM, Hajli S, Sérgio ER, Borrego L, Jesus J, Antunes FV, et al. Fatigue crack growth in AA6082-T6/AA7050-T6 bi-materials: effect of plastic zone ahead of crack tip. Int J Fatigue. 2024;186:108423. doi:10.1016/j.ijfatigue.2024.108423. [Google Scholar] [CrossRef]
17. Srawley JE, Brown WF. Fracture toughness testing. Washington, DC, USA: National Aeronautics and Space Administration; 1965. [Google Scholar]
18. Bui TX, Fang TH, Lee CI. Effects of inclusion type and inclusion radius on deformation characteristic and failure mechanism inside monocrystalline NiFeCr alloy. J Alloys Compd. 2023;962:171062. doi:10.1016/j.jallcom.2023.171062. [Google Scholar] [CrossRef]
19. Choi S, Lee S, Lee B, Yoon J, Lee CY, Kim T, et al. Crack-inducing strain sensor array using inkjet-printed silver thin film for underplate and off-centered force sensing applications. ACS Appl Mater Interfaces. 2023;15(3):4487–94. doi:10.1021/acsami.2c19372. [Google Scholar] [PubMed] [CrossRef]
20. Miller R, Tadmor EB, Phillips R, Ortiz M. Quasicontinuum simulation of fracture at the atomic scale. Model Simul Mater Sci Eng. 1998;6(5):607–38. doi:10.1088/0965-0393/6/5/008. [Google Scholar] [CrossRef]
21. Khoei AR, Sameti AR, Kazerooni YN. A continuum-atomistic multi-scale technique for nonlinear behavior of nano-materials. Int J Mech Sci. 2018;148:191–208. doi:10.1016/j.ijmecsci.2018.08.012. [Google Scholar] [CrossRef]
22. Nikravesh Y, Sameti AR, Khoei AR. An atomistic-continuum multiscale analysis for heterogeneous nanomaterials and its application in nanoporous gold foams. Appl Math Model. 2022;107:353–78. doi:10.1016/j.apm.2022.02.029. [Google Scholar] [CrossRef]
23. Urata S, Hirobe S, Oguni K, Li S. Atomistic to continuum simulations of fracture and damage evolutions in oxide glass and glass-ceramic materials: a critical review. J Non Cryst Solids X. 2022;15(1):100102. doi:10.1016/j.nocx.2022.100102. [Google Scholar] [CrossRef]
24. Miller RE, Tadmor EB. The quasicontinuum method: overview, applications and current directions. J Comput Aided Mater Des. 2002;9(3):203–39. doi:10.1023/A:1026098010127. [Google Scholar] [CrossRef]
25. Zhu A, He D, He R, Zou C. Nanoindentation simulation on single crystal copper by quasi-continuum method. Mater Sci Eng A. 2016;674:76–81. doi:10.1016/j.msea.2016.07.091. [Google Scholar] [CrossRef]
26. Dobson M, Luskin M. An analysis of the effect of ghost force oscillation on quasicontinuum error. Math Model Numer Anal. 2009;43(3):591–604. doi:10.1051/m2an/2009007. [Google Scholar] [CrossRef]
27. Shimokawa T, Mortensen JJ, Schiøtz J, Jacobsen KW. Matching conditions in the quasicontinuum method: removal of the error introduced at the interface between the coarse-grained and fully atomistic region. Phys Rev B. 2004;69(21):214104. doi:10.1103/physrevb.69.214104. [Google Scholar] [CrossRef]
28. Wu YC, Shao JL. FCC-BCC phase transformation induced simultaneous enhancement of tensile strength and ductility at high strain rate in high-entropy alloy. Int J Plast. 2023;169:103730. doi:10.1016/j.ijplas.2023.103730. [Google Scholar] [CrossRef]
29. Bui TX, Fang TH, Lee CI. Deformation and machining mechanism of nanocrystalline NiCoCrFe high entropy alloys. J Alloys Compd. 2022;924:166525. doi:10.1016/j.jallcom.2022.166525. [Google Scholar] [CrossRef]
30. Bui TX, Lu YS, Fang TH. Competing failure modes in void and inclusion NiCoCrFeCu alloy under tensile simulation using molecular dynamic. Mater Today Commun. 2024;38:107795. doi:10.1016/j.mtcomm.2023.107795. [Google Scholar] [CrossRef]
31. Shenoy VB, Miller R, Tadmor EB, Rodney D, Phillips R, Ortiz M. An adaptive finite element approach to atomic-scale mechanics—the quasicontinuum method. J Mech Phys Solids. 1999;47(3):611–42. doi:10.1016/S0022-5096(98)00051-9. [Google Scholar] [CrossRef]
32. Miller RE, Tadmor EB. QC reference manual version 1.3. 2007 [cited 2025 Jan 1]. Available from: http://qcmethod.org/qcrefmanual_v1.3.pdf. [Google Scholar]
33. Foiles SM, Baskes MI, Daw MS. Embedded-atom-method functions for the fcc metals Cu, Ag, Au, Ni, Pd, Pt, and their alloys. Phys Rev B. 1986;33(12):7983–91. doi:10.1103/physrevb.33.7983. [Google Scholar] [PubMed] [CrossRef]
34. Islam MA, Kader MA, Hazell PJ, Escobedo JP, Brown AD, Saadatfar M. Effects of impactor shape on the deformation and energy absorption of closed cell aluminium foams under low velocity impact. Mater Des. 2020;191:108599. doi:10.1016/j.matdes.2020.108599. [Google Scholar] [CrossRef]
35. Dobson M, Luskin M. Iterative solution of the quasicontinuum equilibrium equations with continuation. J Sci Comput. 2008;37(1):19–41. doi:10.1007/s10915-008-9208-6. [Google Scholar] [CrossRef]
36. Müser MH, Sukhomlinov SV, Pastewka L. Interatomic potentials: achievements and challenges. Adv Phys X. 2023;8(1):2093129. doi:10.1080/23746149.2022.2093129. [Google Scholar] [CrossRef]
37. Rassoulinejad-Mousavi SM, Zhang Y. Interatomic potentials transferability for molecular simulations: a comparative study for platinum, gold and silver. Sci Rep. 2018;8(1):2424. doi:10.1038/s41598-018-20375-4. [Google Scholar] [PubMed] [CrossRef]
38. Knap J, Ortiz M. An analysis of the quasicontinuum method. J Mech Phys Solids. 2001;49(9):1899–923. doi:10.1016/S0022-5096(01)00034-5. [Google Scholar] [CrossRef]
39. Tadmor EB, Ortiz M, Phillips R. Quasicontinuum analysis of defects in solids. Philos Mag A. 1996;73(6):1529–63. doi:10.1080/01418619608243000. [Google Scholar] [CrossRef]
40. Lee BJ, Baskes MI, Kim H, Koo Cho Y. Second nearest-neighbor modified embedded atom method potentials for bcc transition metals. Phys Rev B. 2001;64(18):184102. doi:10.1103/physrevb.64.184102. [Google Scholar] [CrossRef]
41. Lu YS, Bui TX, Cai YR, Fang TH. Interface diffusion behavior of machining NiFeCo/Cu polycrystalline/single-crystal multilayers. J Manuf Process. 2024;127:409–20. doi:10.1016/j.jmapro.2024.08.007. [Google Scholar] [CrossRef]
42. Ma JP, Yuan L, Zong YY, Zheng MY, Shan DB, Guo B. Crack-tip cleavage/dislocation emission competition behaviors/mechanisms in magnesium: ALEFM prediction and atomic simulation. Int J Plast. 2024;182:104134. doi:10.1016/j.ijplas.2024.104134. [Google Scholar] [CrossRef]
43. Carr J, Milhet X, Gadaud P, Boyer SAE, Thompson GE, Lee P. Quantitative characterization of porosity and determination of elastic modulus for sintered micro-silver joints. J Mater Process Technol. 2015;225:19–23. doi:10.1016/j.jmatprotec.2015.03.037. [Google Scholar] [CrossRef]
44. Monma H, Shinozaki K. Enhancement of fracture toughness of sol-gel silica glass coating by small amount of silver particle dispersion. Ceram Int. 2024;50(19):35820–4. doi:10.1016/j.ceramint.2024.06.283. [Google Scholar] [CrossRef]
45. Nath SKD. Elastic, elastic-plastic properties of Ag, Cu and Ni nanowires by the bending test using molecular dynamics simulations. Comput Mater Sci. 2014;87:138–44. doi:10.1016/j.commatsci.2014.02.013. [Google Scholar] [CrossRef]
Cite This Article
 Copyright © 2026 The Author(s). Published by Tech Science Press.
This work is licensed under a Creative Commons Attribution 4.0 International License , which permits unrestricted use, distribution, and reproduction in any medium, provided the original work is properly cited.
 Downloads
 Citation Tools