
 Submit a Paper
 Propose a Special lssue
 Open Access
ARTICLE
Layered Feature Engineering for E-Commerce Purchase Prediction: A Hierarchical Evaluation on Taobao User Behavior Datasets
1 Department of Information Systems, Hanyang University, Seoul, 04763, Republic of Korea
2 Department of Artificial Intelligence, Hanyang University, Seoul, 04763, Republic of Korea
* Corresponding Author: Eunchan Kim. Email:
(This article belongs to the Special Issue: Big Data Technologies and Applications for a Data-Driven World)
Computers, Materials & Continua 2026, 87(1), 78 https://doi.org/10.32604/cmc.2025.076329
Received 18 November 2025; Accepted 10 December 2025; Issue published 10 February 2026
 View Full Text
 Download PDF
Abstract
Accurate purchase prediction in e-commerce critically depends on the quality of behavioral features. This paper proposes a layered and interpretable feature engineering framework that organizes user signals into three layers: Basic, Conversion & Stability (efficiency and volatility across actions), and Advanced Interactions & Activity (cross-behavior synergies and intensity). Using real Taobao (Alibaba’s primary e-commerce platform) logs (57,976 records for 10,203 users; 25 November–03 December 2017), we conducted a hierarchical, layer-wise evaluation that holds data splits and hyperparameters fixed while varying only the feature set to quantify each layer’s marginal contribution. Across logistic regression (LR), decision tree, random forest, XGBoost, and CatBoost models with stratified 5-fold cross-validation, the performance improved monotonically from Basic to Conversion & Stability to Advanced features. With LR, F1 increased from 0.613 (Basic) to 0.962 (Advanced); boosted models achieved high discrimination (0.995 AUC Score) and an F1 score up to 0.983. Calibration and precision–recall analyses indicated strong ranking quality and acknowledged potential dataset and period biases given the short (9-day) window. By making feature contributions measurable and reproducible, the framework complements model-centric advances and offers a transparent blueprint for production-grade behavioral modeling. The code and processed artifacts are publicly available, and future work will extend the validation to longer, seasonal datasets and hybrid approaches that combine automated feature learning with domain-driven design.Keywords
Online users continuously generate browsing, clicking, interaction, and other behavioral tracks when using e-commerce, providing valuable data for consumer decision modeling.
To improve prediction accuracy, traditional algorithms, such as collaborative filtering, are widely used for user preference prediction [1]. However, such methods are often constrained by data sparsity and cold start problems, which reduce the effectiveness of recommendations [2]. To overcome these limitations, some studies have proposed clickstream tree models based on session order and dwell time [3] or have used multi-model stacking ensemble (MMSE) methods to improve recommendation performance [4]. In addition to algorithm improvement, feature engineering is an important part of the prediction task. Existing studies have utilized a feature engineering framework of user-item, user-category, user, product, and category features, as well as cross-features, to obtain better F1 scores [5]. Other studies have used sequential forward selection (SFS) methods for feature selection or exploratory data analysis (EDA) in e-commerce behavior data, particularly for online review helpfulness prediction [6] and to identify key patterns and relationships between features [7]. However, existing research is often limited to single models or local feature design, lacking a feature engineering framework that can be extended to user behavior–purchase prediction scenarios, and existing methods and model improvements still face significant challenges in real e-commerce scenarios. Although some studies have proposed frameworks for predicting repeat buyers [8], most focus on model-level improvements, such as adjusting the number of long short-term memory (LSTM) layers [9] or removing key network modules [10], rather than evaluating the contributions of feature sets. Therefore, designing effective and generalizable feature representations remains a fundamental bottleneck.
To address these shortcomings, this study proposes a three-layer feature engineering framework and evaluates its feasibility by employing a hierarchical evaluation framework to quantify the marginal contribution of each layer. Each layer is composed of basic statistical features, conversion and stability features, and higher-level interaction features, which collectively characterize users’ purchasing propensity from the perspectives of behavioral efficiency, stability, and relevance. Furthermore, this study compares and analyzes the performance of various machine learning and ensemble models with and without temporal features, and the results verify the effectiveness of the proposed feature engineering framework.
The core contributions of this study are as follows:
• We propose a hierarchical, behavior-driven feature engineering framework that structures user actions into meaningful layers rather than performing simple step-wise feature addition.
• We introduce a layer-wise evaluation methodology that quantifies the causal and incremental contribution of each feature layer under fixed, controlled model conditions.
• We empirically validate the effectiveness of this framework across multiple models, showing consistent performance improvements as feature layers progress.
Alibaba’s large-scale user behavior data provide an ideal foundation for modeling personalized recommendations and purchase predictions. For example, the deep interest network (DIN) model learns adaptive user interest representations from historical behavior through a local activation mechanism [11]. To further enhance sequential modeling, the behavior sequence transformer (BST) introduces a transformer-based architecture to capture complex temporal dependencies in user behavior, showing superior performance in large-scale online environments [12].
2.2 Predictive Analysis Methods
Analyzing and predicting user purchasing behavior is a crucial foundation for improving service quality, optimizing marketing strategies, and enhancing recommendation systems. Research on prediction frameworks is another way to enhance prediction accuracy. Existing purchase prediction research can be roughly divided into algorithm improvement, feature engineering, and those related to baseline and ensemble learning models.
For specific prediction tasks, researchers have explored various advanced strategies. For example, Qin et al. proposed a click-through rate prediction framework based on user behavior retrieval (UBR4CTR), which effectively improved the accuracy of click-through rate prediction [13]. Many researchers have used model fusion strategies to purposefully mine user purchase data. For example, combining feature engineering with fully fusion ensemble learning using the F-Ensemble method has been shown to improve purchase prediction accuracy on imbalanced e-commerce data [14]. Moreover, a recent study proposed a deep adaptive evolutionary ensemble (DAEE) model by combining deep forest with evolutionary learning, achieving a 5.02% improvement in AUC over baseline models [15]. These studies showed that user behavior analysis has broad value in various application scenarios.
In the research on benchmark models, ensemble learning models, and the selection of specific models, the academic community has explored a variety of effective analysis methods. Among the many methods, logistic regression (LR) and decision tree (DT) are often used as baseline models owing to their good interpretability and robustness. LR models are used in fields such as behavior prediction [16] and review classification [17]. Ma et al. [18] proposed a customer interest classification method for e-commerce trading platforms based on DT. This method effectively reduced the classification error and improved the classification effect through Deep Feature Sparse Decomposition (DFSD) fusion and multimodal feature extraction.
In their quest for higher prediction accuracy, researchers have gradually turned to more powerful ensemble learning methods, among which random forest (RF) [19], XGBoost [20], and CatBoost are outstanding representatives. As a classic ensemble algorithm, RF is not only used to predict purchase [21] intention in conversational data but also to analyze and predict customer churn [22]. Improved versions of XGBoost, an efficient engineering implementation of the gradient boosting algorithm, have been used in research on user consumption behavior prediction [23] and the intelligent classification of e-commerce customers [24]. Other studies have used CatBoost models to analyze and predict whether consumers will purchase a particular product [25] or to improve the accuracy of predictions of user purchase intentions by using hyperparameter-adjusted CatBoost classifiers [26].
However, despite the performance improvements brought about by advanced algorithms and ensemble learning methods, their performance ceilings are still constrained by the quality of input features. Therefore, in recent years, researchers have gradually begun to focus on the role of feature engineering in purchase prediction.
In e-commerce scenarios, the main goal of user behavior analysis is to predict subsequent behavior and increase purchase rates. Enriching user behavior feature sets and combining them with ensemble learning has proven to be very effective in this regard [27]. To further improve prediction accuracy, existing research indicates that, in addition to dynamic behavioral signals, static customer characteristics are also key predictors of purchasing decisions [28]. In addition to individual attributes, recent research indicates that the stage from browsing to adding to cart is a key factor in improving conversion rates [29], which further supports the continued stability of the purchasing behavior funnel in contemporary e-commerce system.
When combined with machine learning, appropriate feature selection can improve both accuracy and interpretability [30]. In reality, the distribution of datasets is often skewed, which creates difficulties for machine learning algorithms [31].
To address this issue, some studies have shown that feature engineering and feature selection can significantly improve model performance by identifying high-value predictors. For example, variables such as “page value” and “bounce rate” have been shown to be key indicators for predicting profitable sessions [32]. Furthermore, recent research proposed a hybrid model that integrates Random Forest with XGBoost to analyze churn determinants, achieving a 1.4% reduction in RMSE and a peak accuracy of 94.6%, thereby demonstrating superior performance in e-commerce churn prediction [33].
Therefore, existing research is more inclined towards the final results, and in terms of feature engineering, priority is given to manually mining features that have learning value and research significance for the model. In summary, the core contribution of this study is the development of a multi-dimensional feature engineering framework based on Alibaba’s real user behavior logs, which integrates manual insights and automated mining to effectively improve the accuracy of purchase behavior prediction and model robustness.
3.1 Feature Engineering Process
The overall research process is illustrated in Fig. 1. First, the raw behavioral data were cleaned, missing values were handled, and a binary target variable was constructed. Next, three hierarchical feature layers—Basic, Conversion, and Advanced—were generated through feature engineering to capture user activity, conversion efficiency, and behavioral stability. Finally, these features were applied to the LR model for baseline testing, followed by model training and cross-validation to evaluate performance.
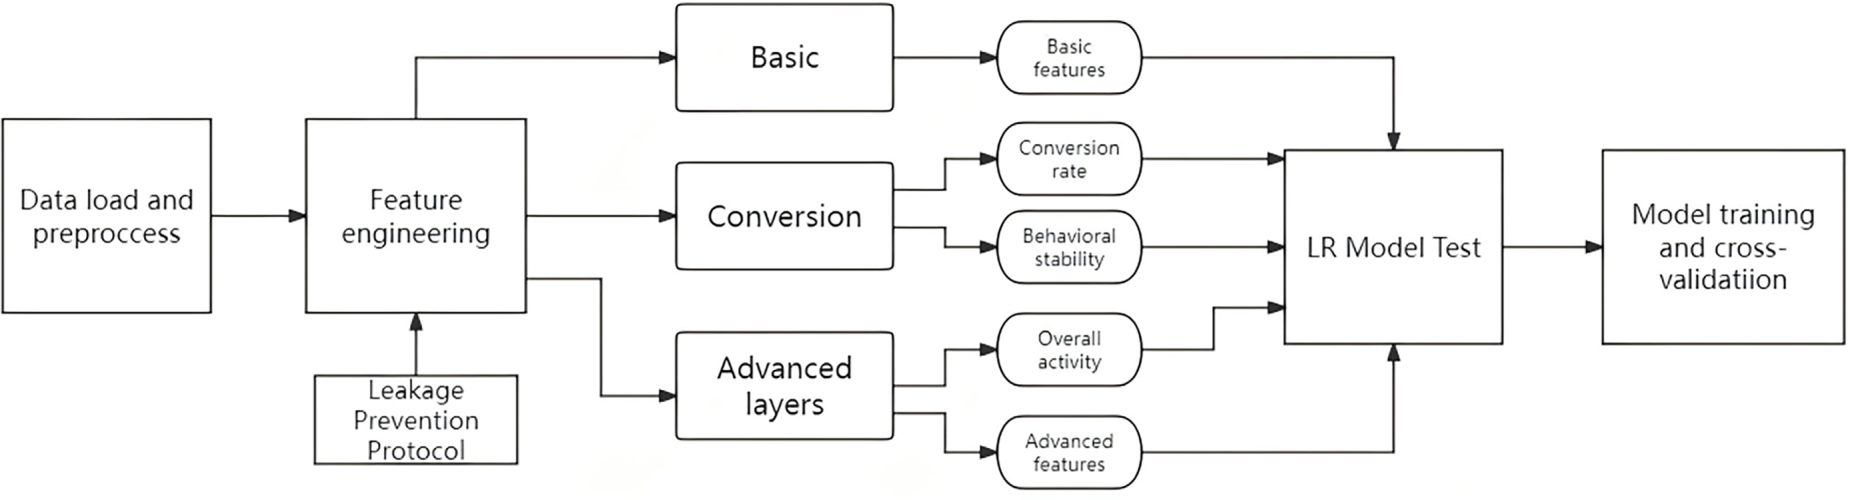
Figure 1: Flowchart illustrating the process of building a user purchase behavior prediction model
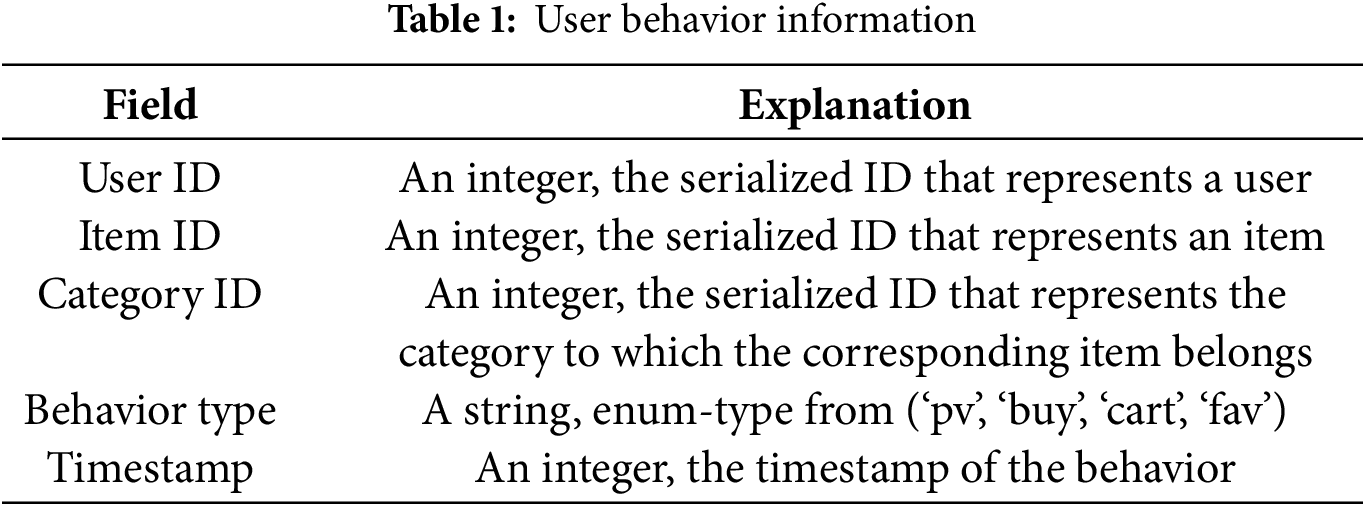
The data used in this study were obtained from the publicly available Taobao User Behavior Dataset provided by Alibaba. The data were collected from Taobao and consisted of 57,976 valid records covering 10,203 users. The dataset contains only one user behavior log table, which records user behavior data for clicks, purchases, add-to-cart, and favorites from 25 November to 03 December 2017. The user behavior data in the dataset are described in Table 1.
Data preprocessing included data cleaning, integration, transformation, and summarization. To reduce the impact of noise on data quality, we first converted all timestamps to Shanghai Time (UTC+8). Subsequently, we extracted two new categorical features: day_type (weekday vs. weekend) and time_period (e.g., morning, afternoon, evening). During the data integration phase, using user_id as the primary key, we aggregated each user’s browsing, add-to-cart, and favorite behavior logs for the entire observation period (2017-11-25 to 2017-12-03) to generate user-level feature representations.
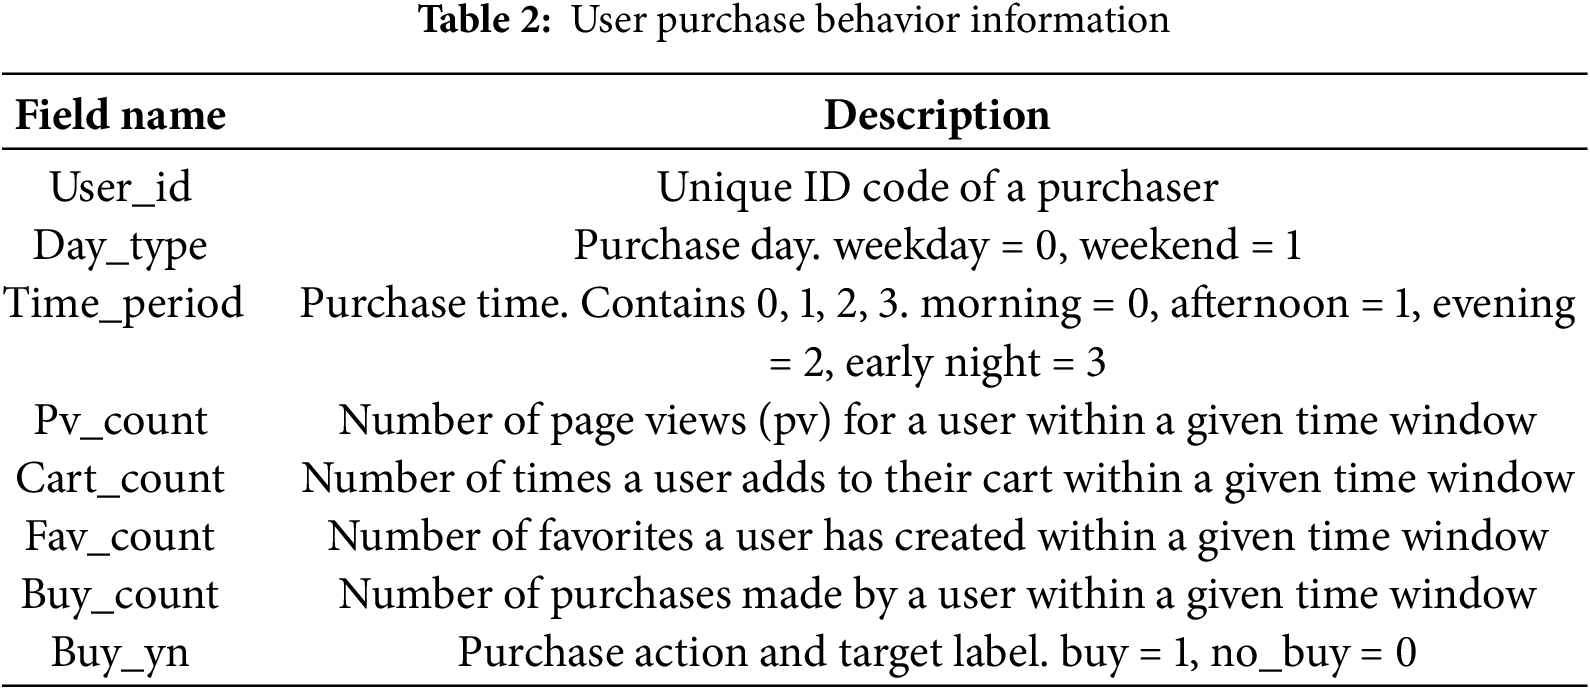
To completely avoid the risk of label leakage, we removed all features directly or indirectly related to purchasing behavior prior to model training. This includes purchase statistics, purchase ratios, purchase interaction terms, and purchase stability indicators. The final model was trained exclusively on non-purchase behavioral signals, ensuring the purity of the feature set, the rigor of the data processing pipeline, and the interpretability of the experimental results. The structure of the integrated user purchase behavior information is presented in Table 2.
After categorizing the data, there were no missing values. The e-commerce environment includes instances of scraping and order manipulation, which differ from normal purchasing behavior and are therefore considered abnormal. We found that the proportion of users with high browsing but no purchases was 0.5295%, whereas the proportion of users with high purchases but low browsing was 0.0535%. After identifying these abnormal users, we deleted the related data.
The primary objective of this research was to build a user behavior analysis framework. This framework should be independent of specific products or categories to enable greater cross-domain generalization. Therefore, we chose not to use product ID and category ID features, focusing instead on uncovering universal patterns in user behavior.
This study employed LR, DT, RF, XGBoost, and CatBoost as analytical models because of their complementary nature in the research design. LR and DT, as interpretable baseline methods, help validate the effectiveness of constructed features and provide a clear basis for decision-making. RF can capture complex nonlinear relationships with a low risk of overfitting, making them suitable as nonlinear baselines. Furthermore, XGBoost and CatBoost, which are the most representative gradient boosting ensemble algorithms, are widely used in structured data modeling. By introducing a diverse range of models, from simple baselines to advanced ensembles, this study provides a more comprehensive examination of the robustness and generalizability of the feature engineering framework.
LR: LR is currently one of the three basic models used for recommendation systems and advertising prediction. Logistic regression is a supervised classification algorithm that models how a set of independent variables influences a binary or multiclass categorical outcome [34]. In essence, the logistic model predicts the logit of Y from X, modeling the log-odds of the outcome as a linear combination of predictors [35]. In this study, we focus on dichotomous outcomes only. The simple logistic model takes the form of Eq. (1).
RF: RF is a machine learning method for classification and regression that can effectively capture complex nonlinear relationships in user behavior data. It is robust against overfitting and can provide feature importance ranking; therefore, it was used as a strong nonlinear benchmark model in this study. The final result of the RF model is obtained through ordinary majority voting across individual trees [36]. The decision function is given by Eq. (2).
where
XGBoost: XGBoost is an efficient and flexible engineering implementation of the DT algorithm. It corrects the prediction error of the previous tree by iteratively training a new DT. XGBoost has the advantages of high model training efficiency and good robustness and is often used as a training model. XGBoost is constructed of an additive model form as shown in Eq. (3), where the final prediction
Each non-leaf node in the DT represents a test of the case attribute, each branch corresponds to the result of the test, and each leaf node represents a class prediction. Due to its “white-box” characteristics, DT is widely used in personalized recommendation systems, and its transparency helps to intuitively understand the impact of features on classification results. The DT model makes predictions by dividing the feature space into
CatBoost: CatBoost is an open-source gradient boosting algorithm developed by the Yandex team, designed for efficient handling of categorical features. As one of the most widely used gradient boosting ensemble methods, it effectively mitigates overfitting and enhances prediction accuracy through ordered boosting and target statistics. Eq. (5) [39] encodes the category features by calculating a smoothed target mean. When calculating the encoding value of sample
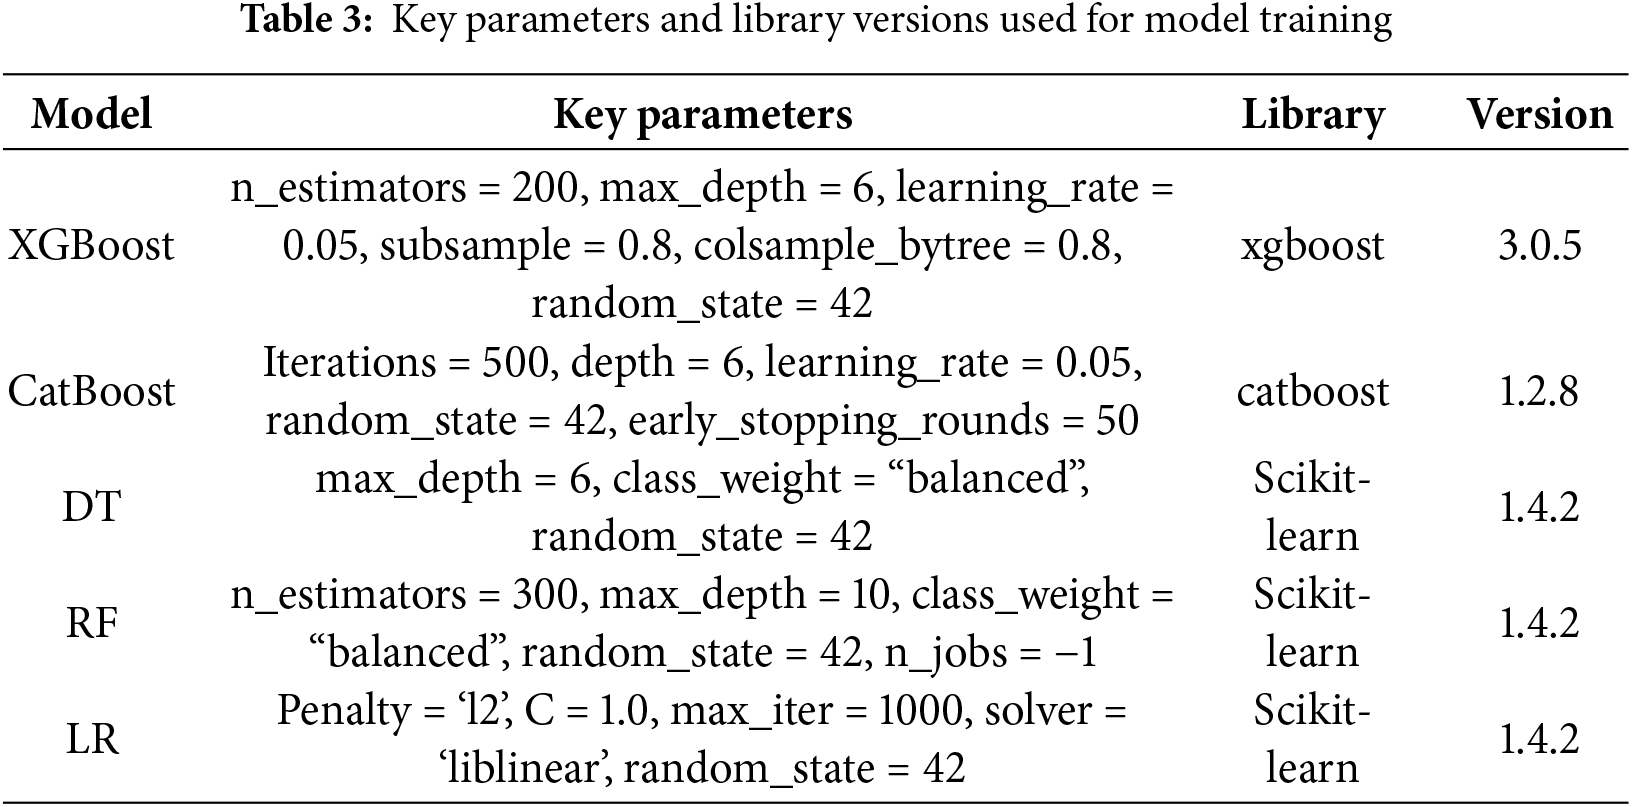
Table 3 summarizes the main hyperparameters of each model in this study and the library versions used. For the tree models, XGBoost and CatBoost used similar structural parameters to ensure comparability. The baseline models (DT and RF) were implemented using Scikit-learn, using balanced class weights and fixed random states to ensure reproducible results. All experiments were conducted in Python 3.12.4, with the relevant library versions listed in the table.
To ensure that the layer-wise evaluation isolates feature contributions rather than model-level differences, all hyperparameters, data splits, and evaluation protocols were kept strictly identical across feature layers. Only the feature inputs were changed while every modeling condition remained fixed.
3.6 Experimental Setup and Validation Strategy
We evaluated model performance by incrementally adding feature sets, starting with basic statistical features, then adding conversion features, and finally incorporating the full set of advanced features. This allowed for a clear measurement of the performance gains at each layer of feature complexity.
During model training, the target variable was buy_yn. After data preprocessing and feature engineering, all original variables directly related to purchases and features directly derived from purchase actions were removed to prevent leakage.
During the feature selection phase, recursive feature elimination (RFE) was employed. This process, which is based on LR as the base learner, iteratively removes the least contributing features. LR was used as a base learner because the iterative nature of RFE requires repeated model training, which is much faster than computationally intensive ensemble learners, such as XGBoost and CatBoost. Additionally, LR serves as a stable and interpretable baseline model, ensuring that a generally robust feature subset is selected through linear contributions before applying more complex nonlinear models. This method reduces the model complexity while improving training efficiency and interpretability. The final classification model was trained on the RFE training set.
To systematically evaluate the generalization ability of the model, this study employed stratified 5-fold cross-validation. The dataset was stratified according to the class ratio of the target variable and then randomly divided into five mutually exclusive subsets. In each iteration, one fold was selected as the validation set, and the remaining four folds were used as the training set. This process was repeated five times to ensure that all samples had a chance to be used as the validation set.
We used accuracy (ACC), F1-score, recall, and area under receiver operating characteristic (ROC) curve (AUC) as the metrics for evaluating the model’s classification ability. The purchase prediction rate is inherently binary, meaning that it determines whether a user will purchase, with a positive class (1) and negative class (0). The model may predict a positive (purchase) or negative (no purchase) result, and then the following four conditions can be arranged and combined: TP, FN, FP, and TN, representing the numbers of samples in the four categories of true positive, false negative, false positive, and true negative, respectively. This forms the confusion matrix shown in Fig. 2.
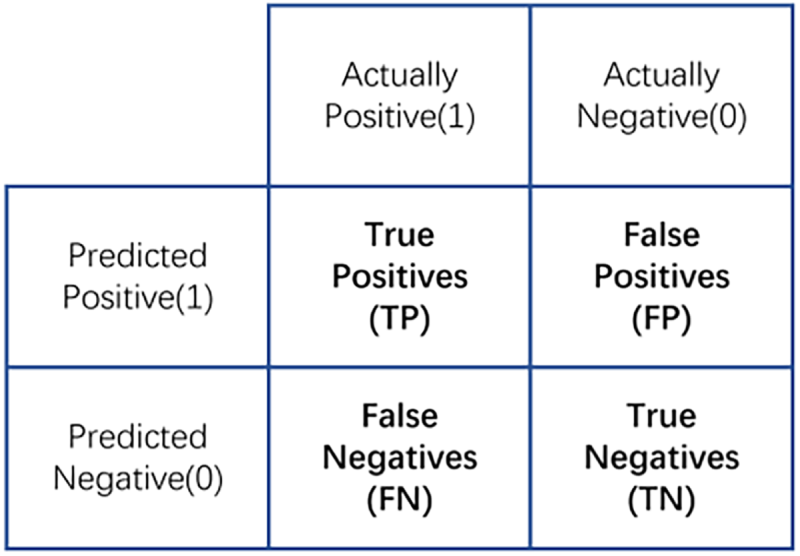
Figure 2: Confusion matrix
ACC is the ratio of the number of correctly classified samples to the total number of samples, which measures the overall classification accuracy. It is calculated as Eq. (6).
Recall is the ratio of the number of samples correctly identified as positive to the total number of positive samples, emphasizing the ability to identify all TP samples (purchasing users). It is calculated as Eq. (7).
F1 score, also known as the balanced F-score, is defined as the harmonic mean of precision and recall. It is used to comprehensively measure a model’s performance by balancing precision and recall into a single metric. It is calculated as Eq. (8).
AUC reflects the discriminatory ability of the model at different thresholds. The ROC curve plots the relationship between the true positive rate (recall) and FP rate at different classification thresholds.
3.8 Hierarchical Evaluation Procedure
To concretely quantify the impact of our proposed feature engineering method, we designed a tiered evaluation strategy by employing an incremental layer-by-layer evaluation. We defined three feature layers:
Let
where
Before conducting in-depth feature engineering, we first conducted a preliminary exploration of the effectiveness of the basic features. We selected day_type, time_period, and basic user behavior counts (pv_count, cart_count, fav_count, buy_count) as the initial feature set. To verify the necessity of time dimension features (day_type and time_period), we conducted comparative experiments using the LR, DT, and RF models on datasets with and without these features. The results are summarized in Table 4.
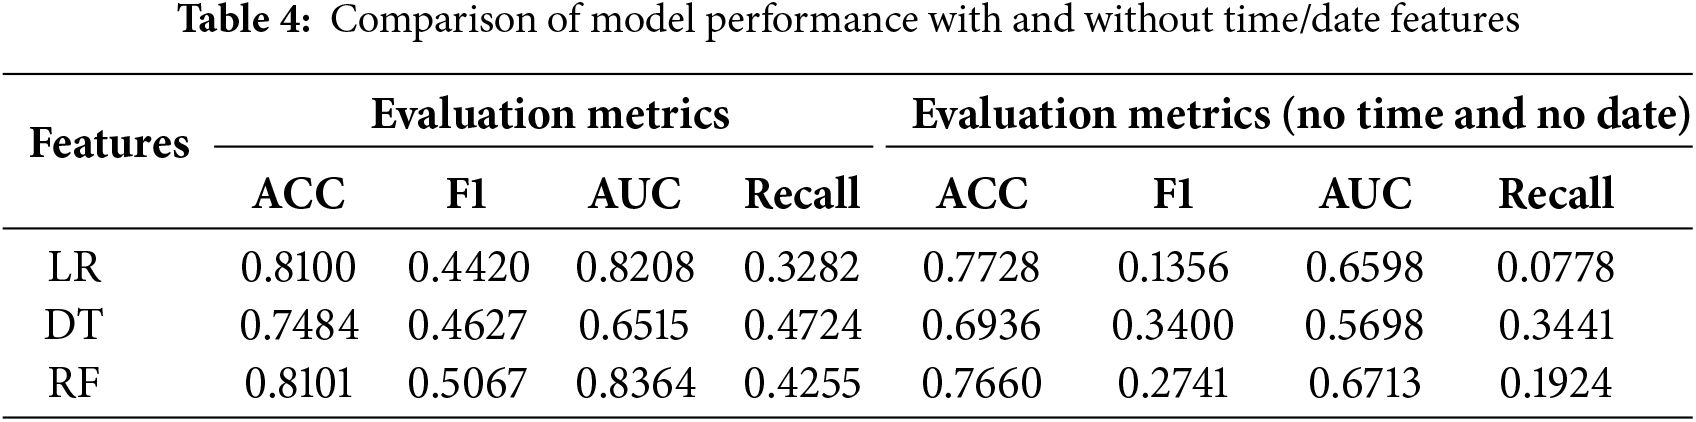
The experimental results in Table 4 show that time and date features significantly improve model performance when comparing experiments with and without time features. However, time and date features have poor transferability. Therefore, subsequent evaluation focused on behavior-centric features to achieve generalizability and interpretability. Moreover, this study focused on building a general framework that is independent of time and centered around user behavior. To quantify the contribution of purely behavioral features, we excluded the time dimension.
Furthermore, incorporating the time dimension into aggregation calculations introduces significant data redundancy. As shown in the feature redundancy heatmap in Fig. 3, statistical features (such as pv_avg and pv_max) are identical for the same user across different time periods. This high degree of feature homogeneity does not bring any information gain. Instead, it dilutes the effective signal by repeating samples with the same feature representations, thereby increasing the risk of overfitting. Therefore, to ensure that the model learns robust decision boundaries, we exclude these time variables (time_period and day_type) and prioritize user ID-based aggregation in subsequent feature engineering.
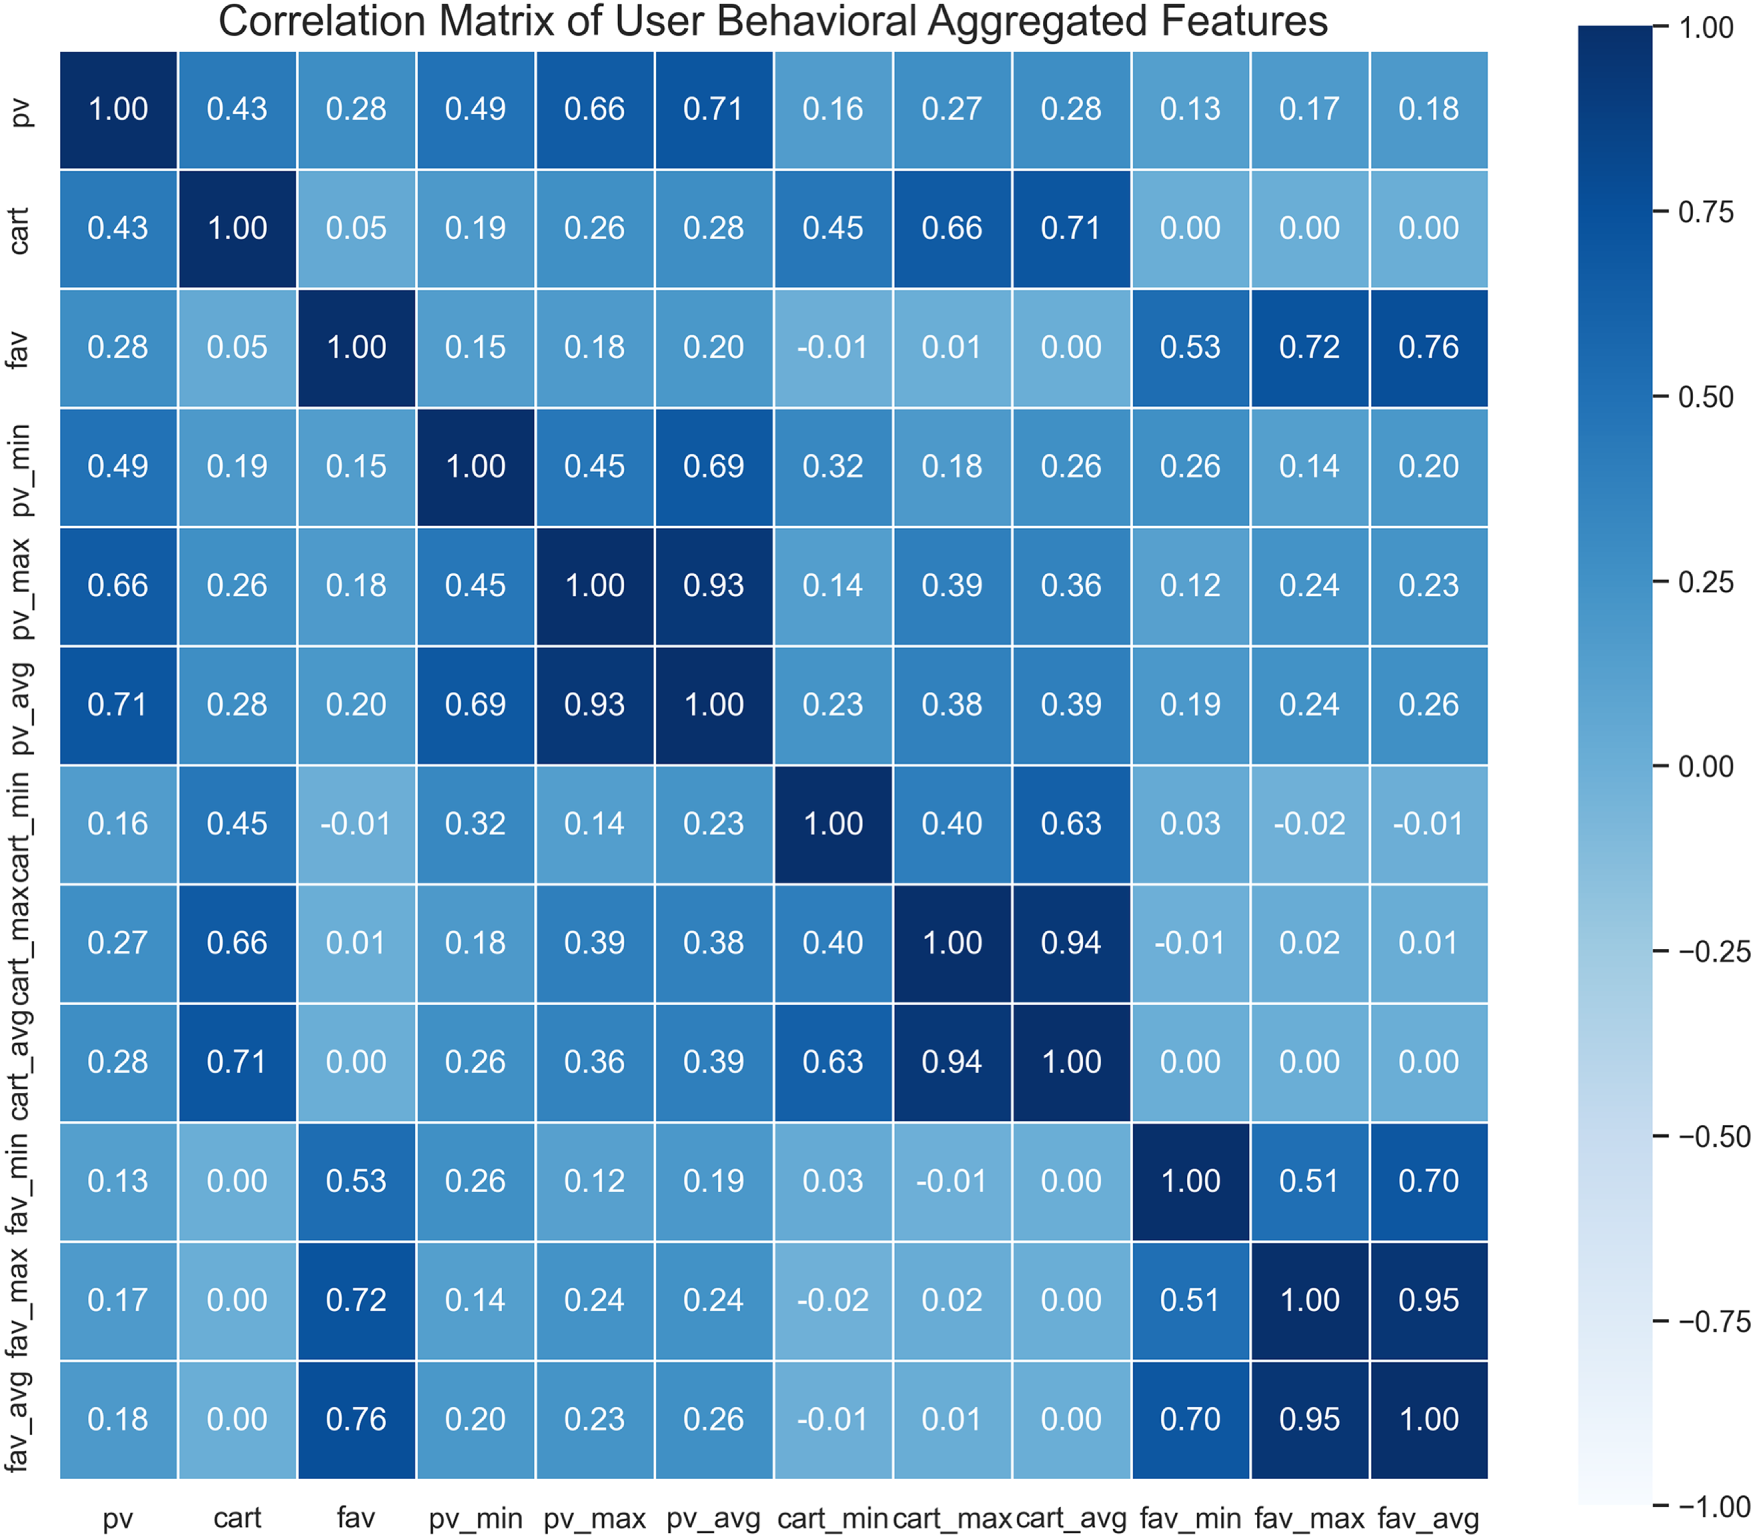
Figure 3: Heatmap of statistical feature values aggregated by day type and time period
In this pilot experiment, to ensure interpretability, we prioritized LR as the linear baseline model. We then tested the popular RF and XGBoost ensemble models. The variables, algorithms, and results are listed in Table 5.
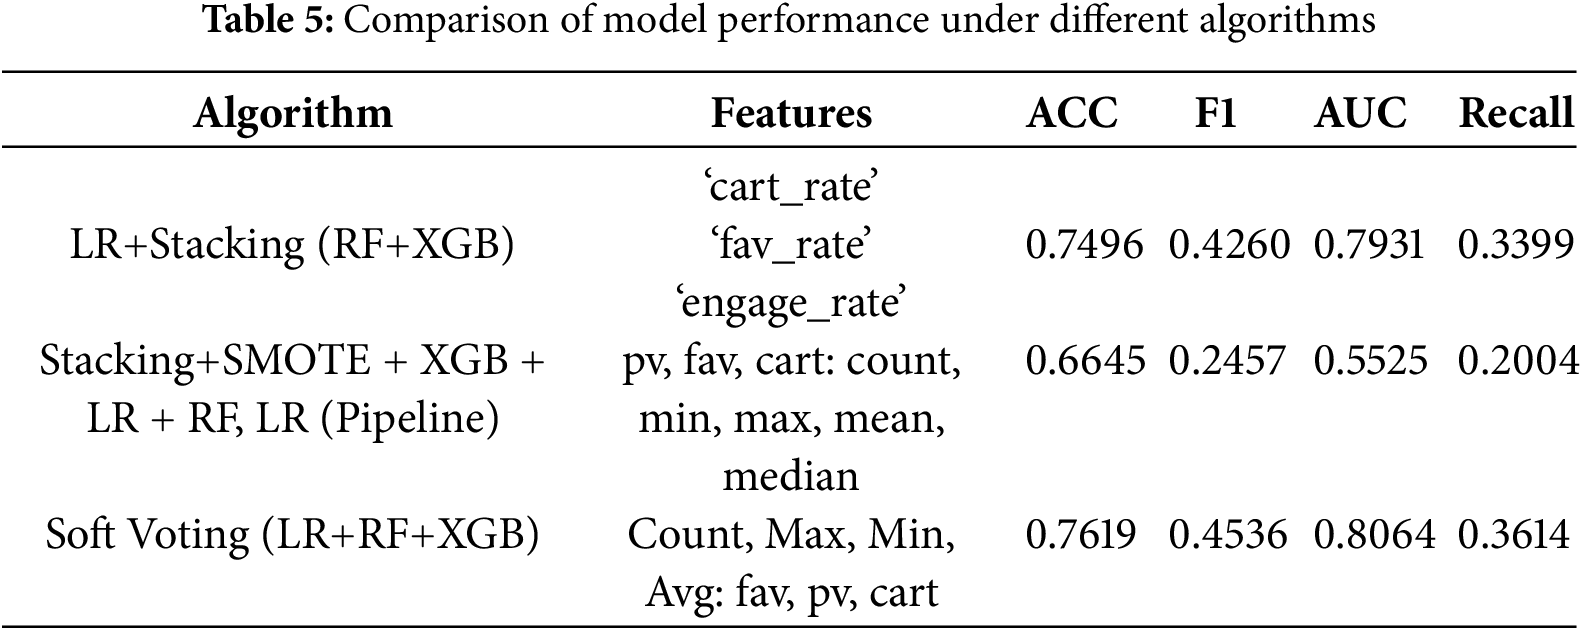
Various models and ensemble strategies were tested in preliminary experiments; however, the overall performance still demonstrated certain limitations. For example, some models performed poorly in terms of recall and F1 score, making it difficult to effectively capture minority class samples. Furthermore, the models were sensitive to feature selection, indicating that existing features were insufficient for the models to learn and improve prediction accuracy. Therefore, further research is necessary to expand and optimize feature engineering to better reflect user conversion behavior.
As shown in Fig. 4, the proposed feature engineering framework is organized into three hierarchical layers.
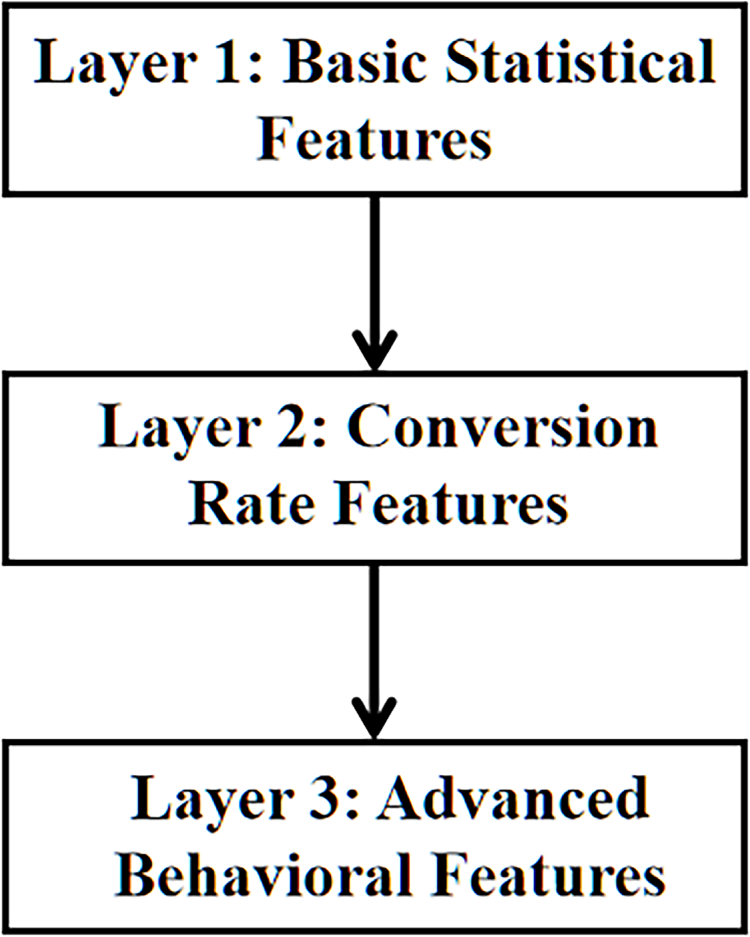
Figure 4: Feature hierarchy conceptual diagram illustrating the conceptual flow among feature layers
Basic Features: This layer contains fundamental statistical features extracted directly from the raw behavioral logs, including the mean, maximum, minimum, and average values.
Conversion Features: This layer builds upon the basic feature set and introduces features that measure conversion rate and behavior stability between behavioral stages, such as cart_to_pv_rate (cart-to-view ratio) and intent_to_pv_rate (intent-to-view ratio).
Advanced Features: This set builds on the conversion feature set and further adds features that measure overall activity and advanced interactions.
4.3.1 Conversion Rate Features
To measure the efficiency of user decision-making, we developed a single conversion rate metric, as defined in Eq. (10). This metric captures not only the conversion rate of behavioral actions but also the conversion rate based on total page views (pv_count; see Appendix A.1).
Intent Conversion Rate (
where e is an exceedingly small value (e.g., 10−6) to prevent division by zero.
We constructed behavior stability metrics to measure the volatility and consistency of user behavior patterns (see Appendix A.2).
Behavior Range (
Behavior Stability (
4.3.3 Overall Activity and Preference Features
This section captures users’ overall activity levels and behavioral preferences from a macro perspective (see Appendix A.3).
Total Activity (
Behavioral Preference Ratio (
4.3.4 High-Level Interaction Features
High-level interaction features are used to capture the synergy between different operations and users’ deep preferences, including proportional balance and behavioral consistency features (based on stability; see Appendix A.4).
Behavior-Pair Interaction (
Preference and Balance (
Comprehensive Metrics (
Potential and Dominance (
Comprehensive Intent Intensity (
Activity Level: Categorizes users into four activity levels to capture the differences in overall behavioral intensity. This stratification captures differences in overall behavioral intensity.
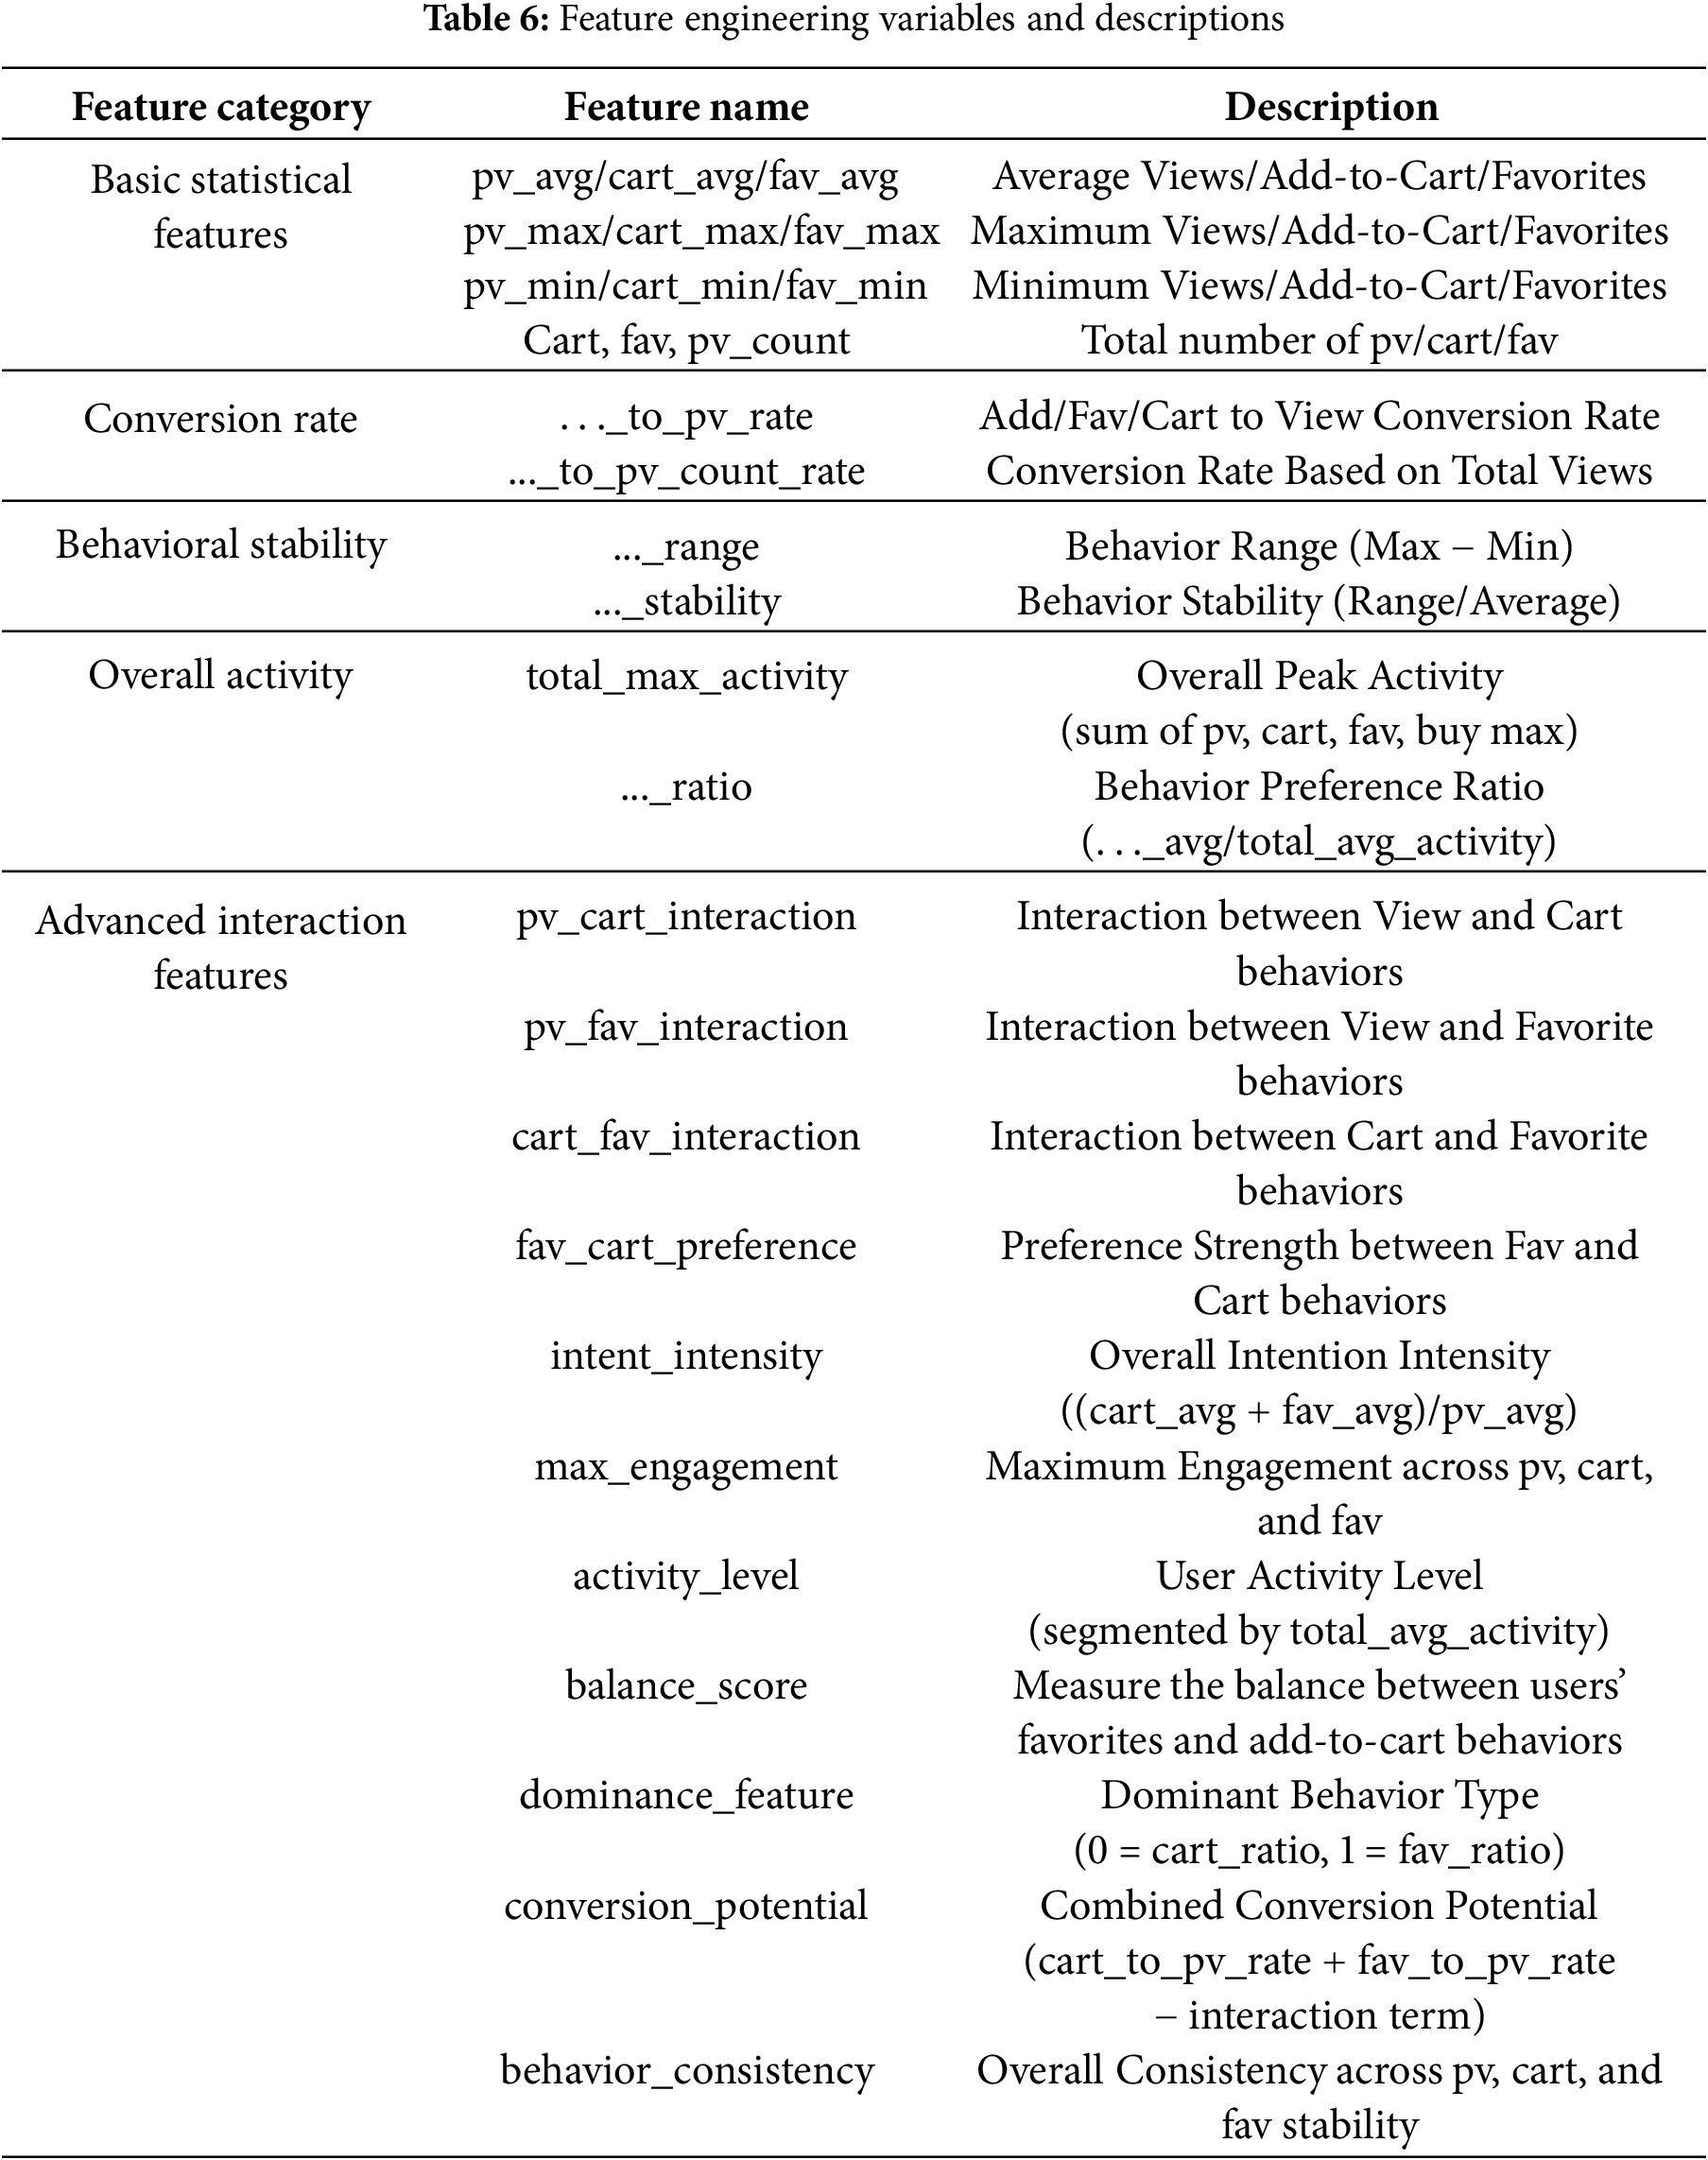
4.3.5 Feature Engineering Model Testing
After completing feature selection, we used LR as the base model for the final feature engineering. Table 6 lists the features used in model training (also see Appendix A.5). The test automatically selected important features using the RFE method.
To further verify the impact of dataset balancing on model performance, we conducted comparative experiments using LR and XGBoost with and without SMOTE. To ensure that synthetic samples did not introduce distributional shifts, we examined the stability of feature distributions before and after oversampling.
We selected four representative non-purchase behavioral features (pv_avg, pv_count, cart_avg, fav_avg) because they capture core user activity patterns and are completely free of purchase-related leakage. As shown in Fig. 5, the box plots indicate that the medians, quartiles, and overall distribution shapes of these features remain highly consistent between the original and SMOTE-augmented datasets. Even the distribution of outliers is preserved, suggesting that the synthetic samples respect the inherent variance of user behaviors.
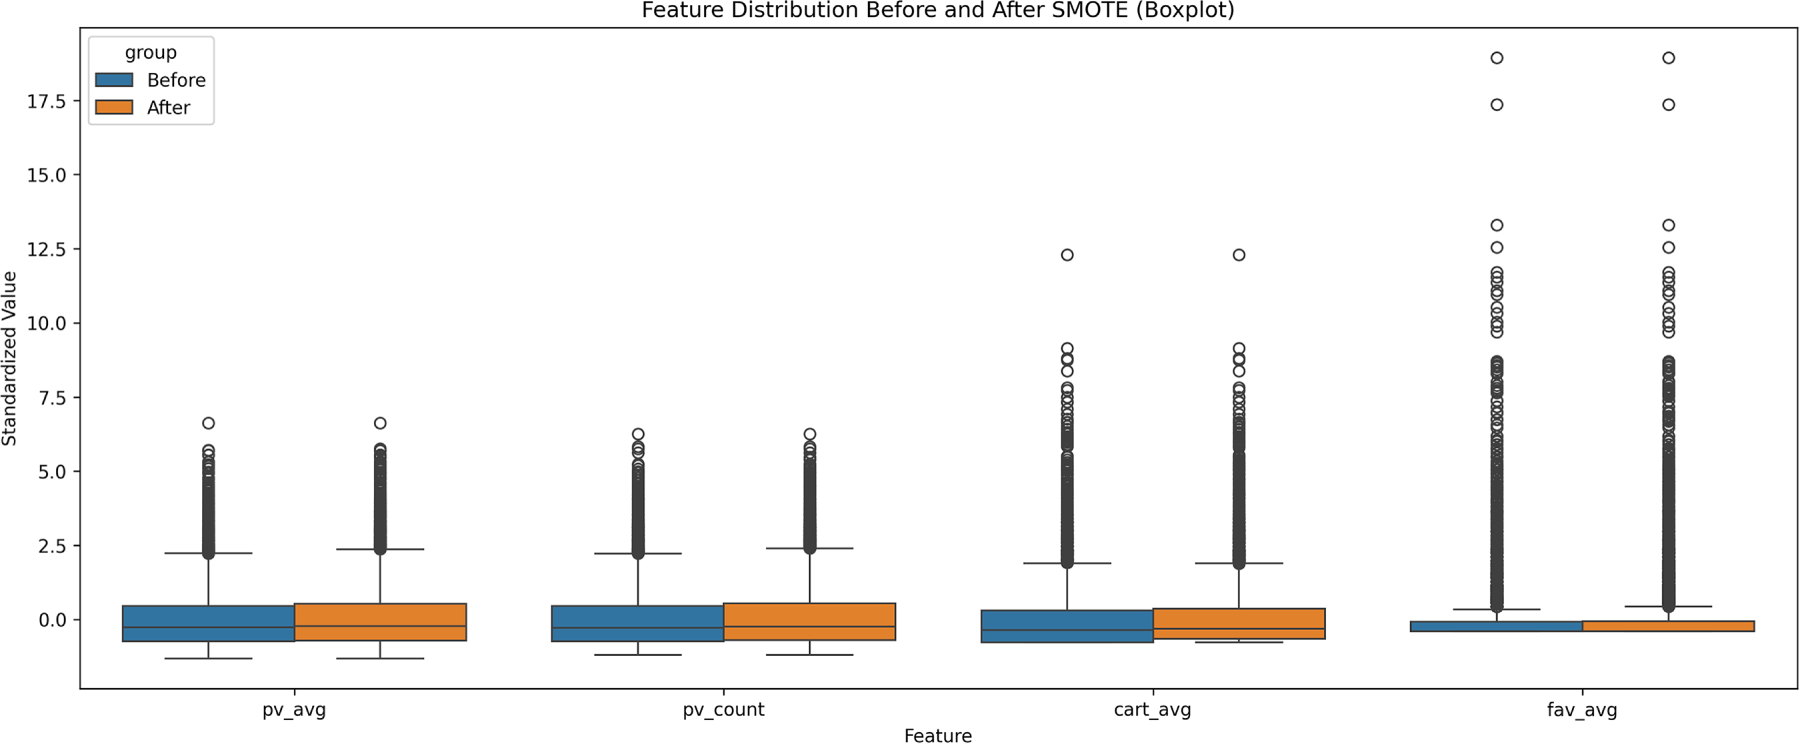
Figure 5: Distributional comparison of key features before and after SMOTE
These findings confirm that SMOTE effectively balances the classes without altering the statistical structure of the data. Therefore, the performance improvements result from corrected class imbalance rather than artifacts introduced by oversampling, ensuring the robustness of the experimental conclusions.
Based on the results in Table 7, we evaluated the impact of SMOTE on model performance. For the XGBoost model, all metrics before and after SMOTE were nearly identical, demonstrating that the tree-based ensemble model is robust to slight class imbalance (approximately 7:3). By contrast, the results of the LR model showed slight fluctuations: ACC, recall, and F1 score all decreased slightly, while AUC remained relatively stable. Therefore, oversampling did not help the linear model improve its balance between precision and F1 on this dataset.
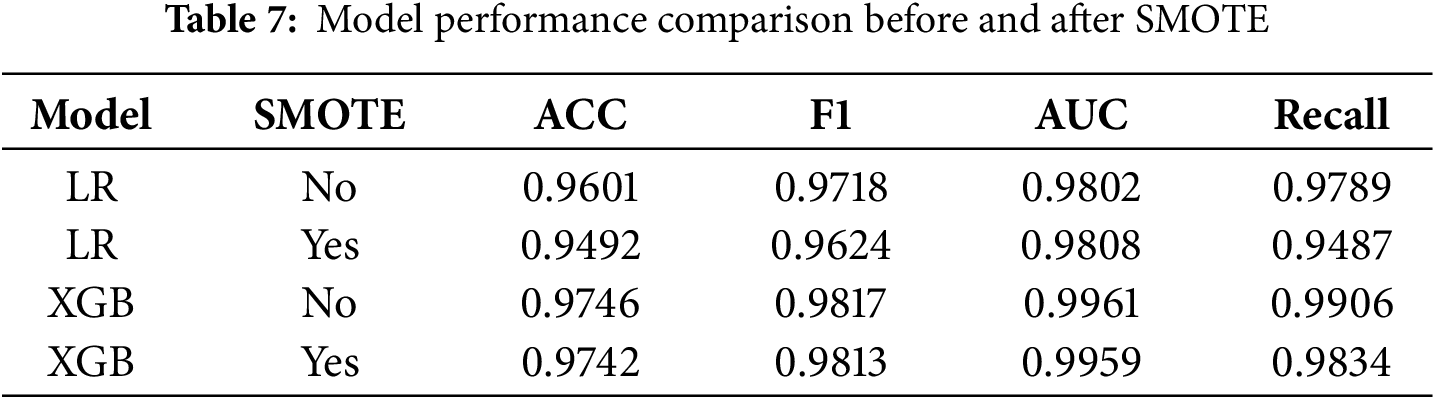
In summary, XGBoost is inherently robust to unbalanced data. Although SMOTE did not significantly improve the key metrics of the LR model (F1 and ACC), we adopted SMOTE in subsequent modeling, considering the model’s generalization ability and sensitivity to minority classes.
In real-world business data, the numerical distribution of features often contains extreme outliers. These outliers can adversely affect model training (especially after data normalization). To enhance model robustness, this study employed the interquartile range (IQR) approach to identify and handle these outliers.
The IQR method defines the statistical boundaries for detecting outliers based on the dispersion of the middle 50% of the data. Specifically, IQR is calculated as the difference between the third quartile (
The lower and upper bounds of the acceptable range are then determined using the conventional 1.5 × IQR rule, shown in Eqs. (12) and (13):
Data points falling outside these thresholds are identified as outliers and subsequently processed through a clipping operation.
Fig. 6 illustrates this process using the pv_ratio feature as a case study. The boxplot visualizes the data distribution of the feature, clearly revealing its central tendency and dispersion. While the majority of the sample values for the pv_ratio feature are concentrated within the box, a significant number of data points, identified as outliers, exist beyond the lower whisker. We use the clipping method to address these outliers. Furthermore, to prevent data leakage, the entire outlier handling process is embedded within the cross-validation loop.
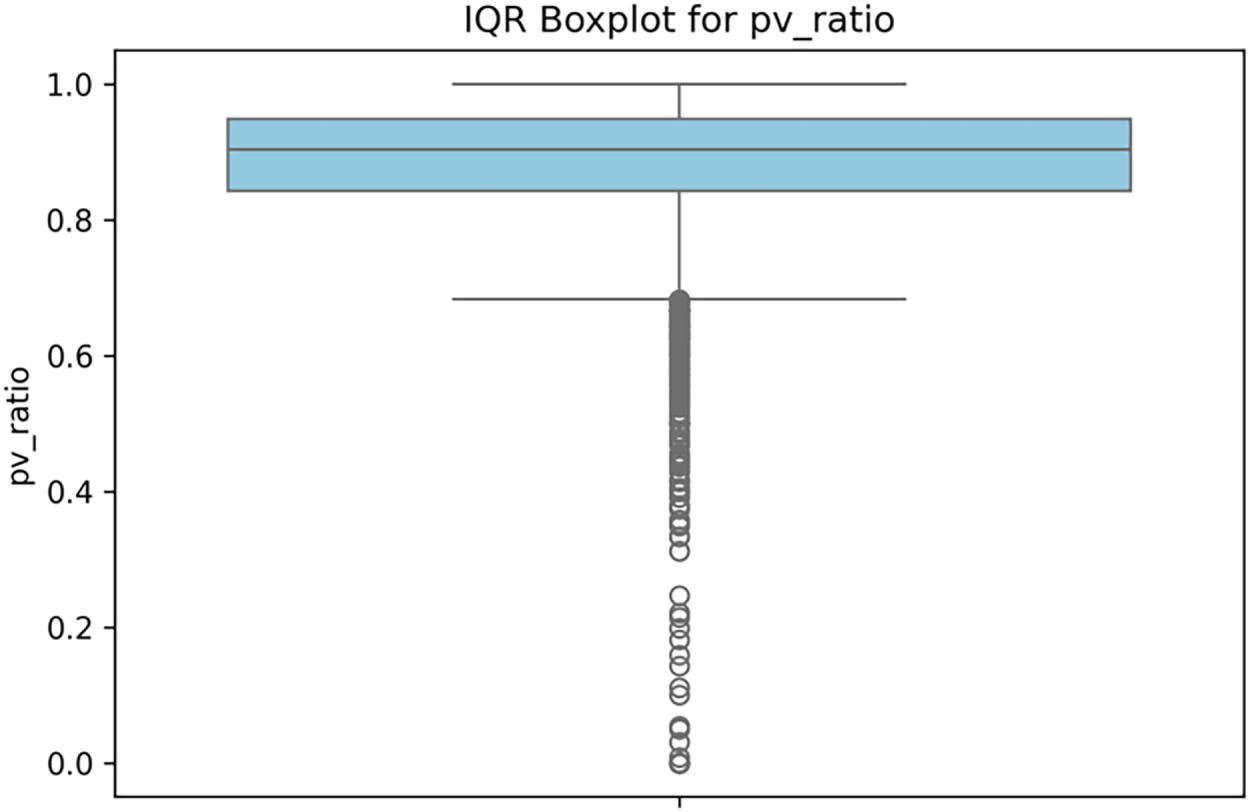
Figure 6: Boxplot of feature pv_ratio and outlier distribution
To better utilize the large number of features generated after feature engineering, filter out effective features, and reduce model training complexity, we used the RFE method to automatically select important features for model training.
This study aimed to evaluate the impact of different layers of feature engineering on the performance of user purchase behavior prediction. We used LR as the baseline classification model and trained and evaluated it on three feature sets with different characteristics. We output the top 20 important features. The results are summarized in Table 8.
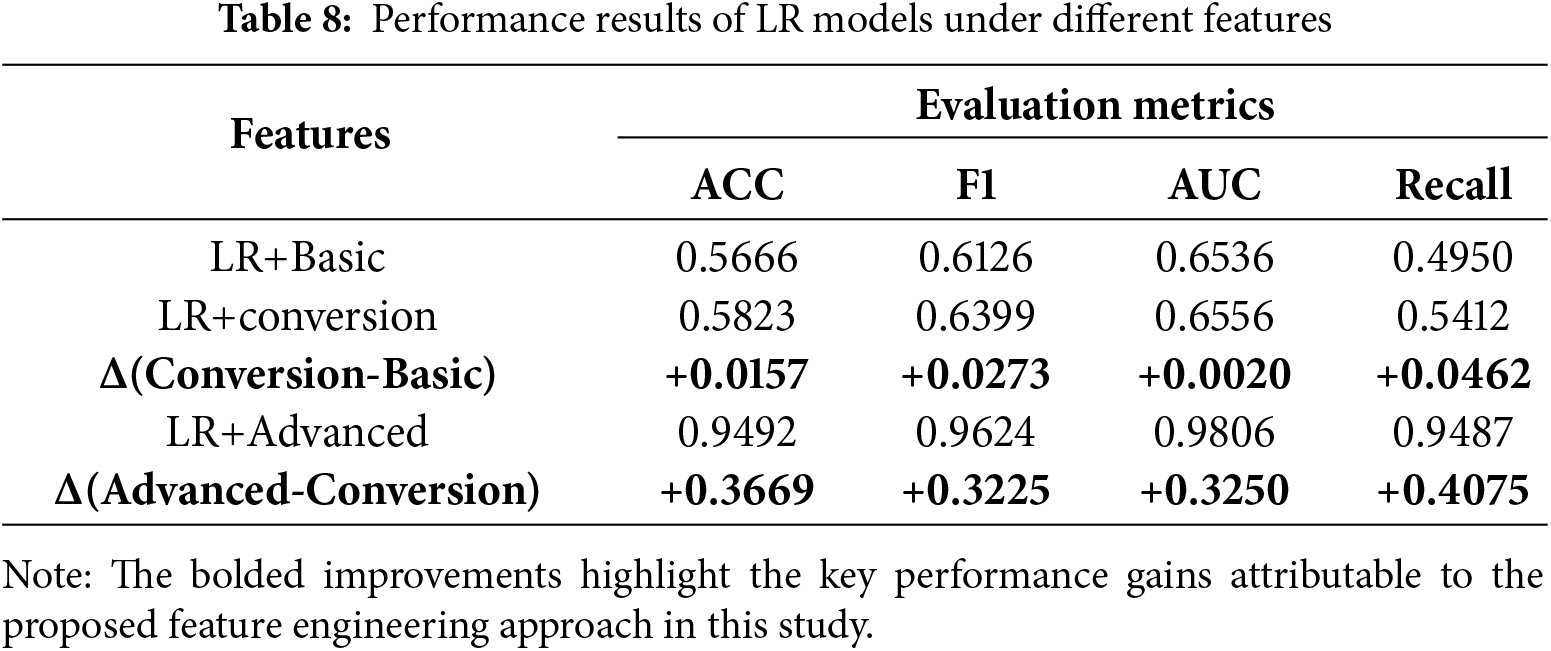
These results validate our two core contributions strongly. First, they demonstrate the effectiveness of our advanced feature set, improving the F1 score from 0.6126 with basic features to 0.9624. Second, and equally importantly, these results show the successful application of our tiered evaluation approach. The gradual performance improvement from the basic to transformed and finally to advanced set clearly quantifies the incremental value of each layer of feature engineering, demonstrating the effectiveness of our evaluation approach.
To further evaluate the reliability and stability of the model in predicting probability, the precision−recall (PR) and calibration curves were plotted.
As shown in Fig. 7, the probability predictions of the model were reliable. In the high probability range (>0.8), the predicted values were close to the ideal line, indicating that the model’s predictions for high purchase intentions were relatively reliable. However, in the medium probability range (approximately 0.4−0.7), the curve is above the ideal line, indicating that the model slightly overestimated probability in this range.
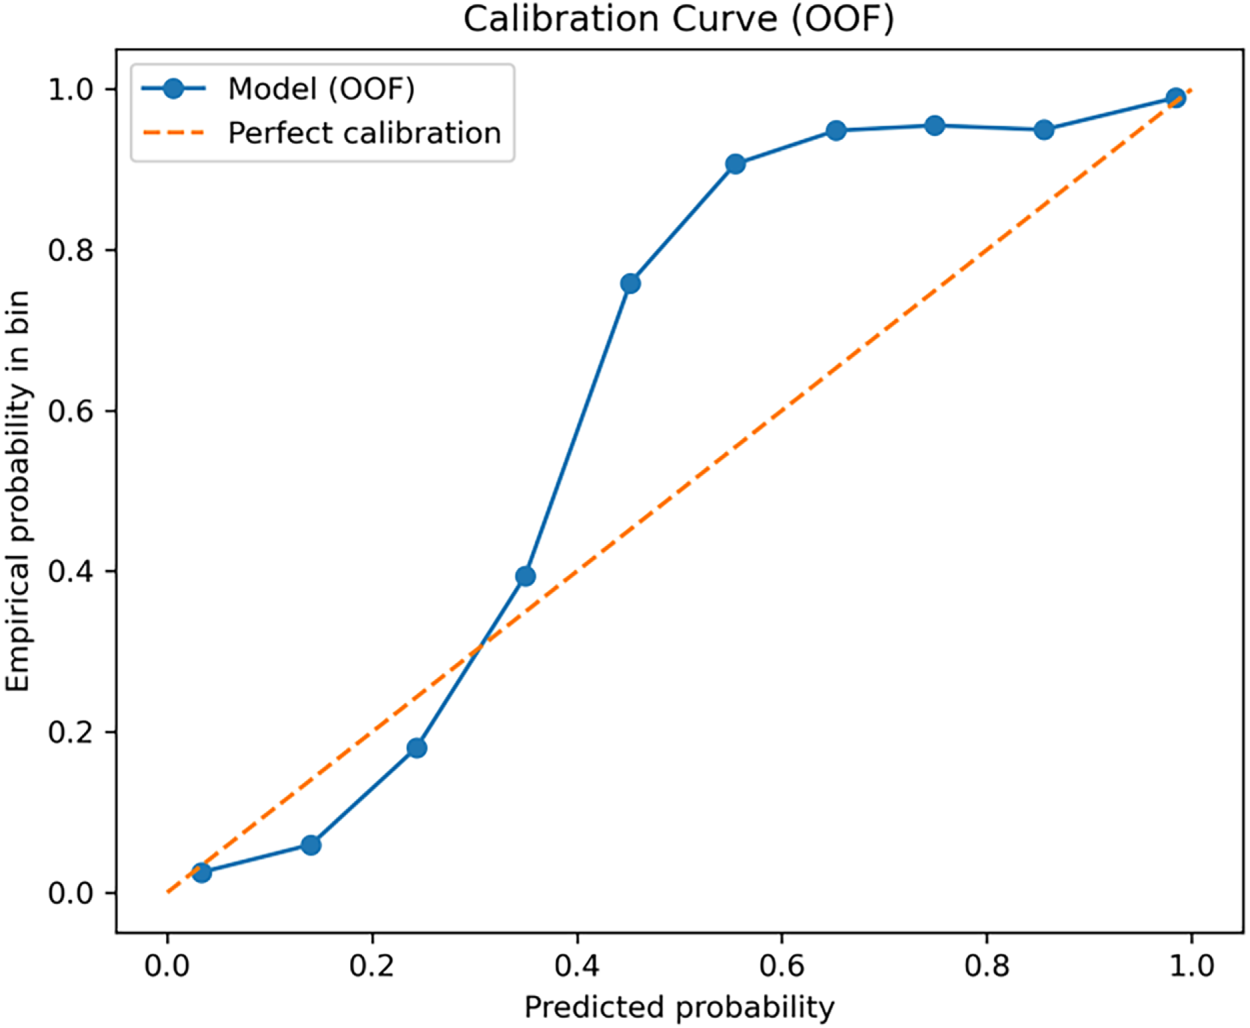
Figure 7: Advanced calibration curve for LR
As shown in Fig. 8, the PR curve was computed from out-of-fold (OOF) predictions aggregated across the five stratified folds. The model maintained high precision over a broad recall range, achieving an average precision (AP) of 0.99, which supports the strong discriminative performance of the proposed feature engineering framework.
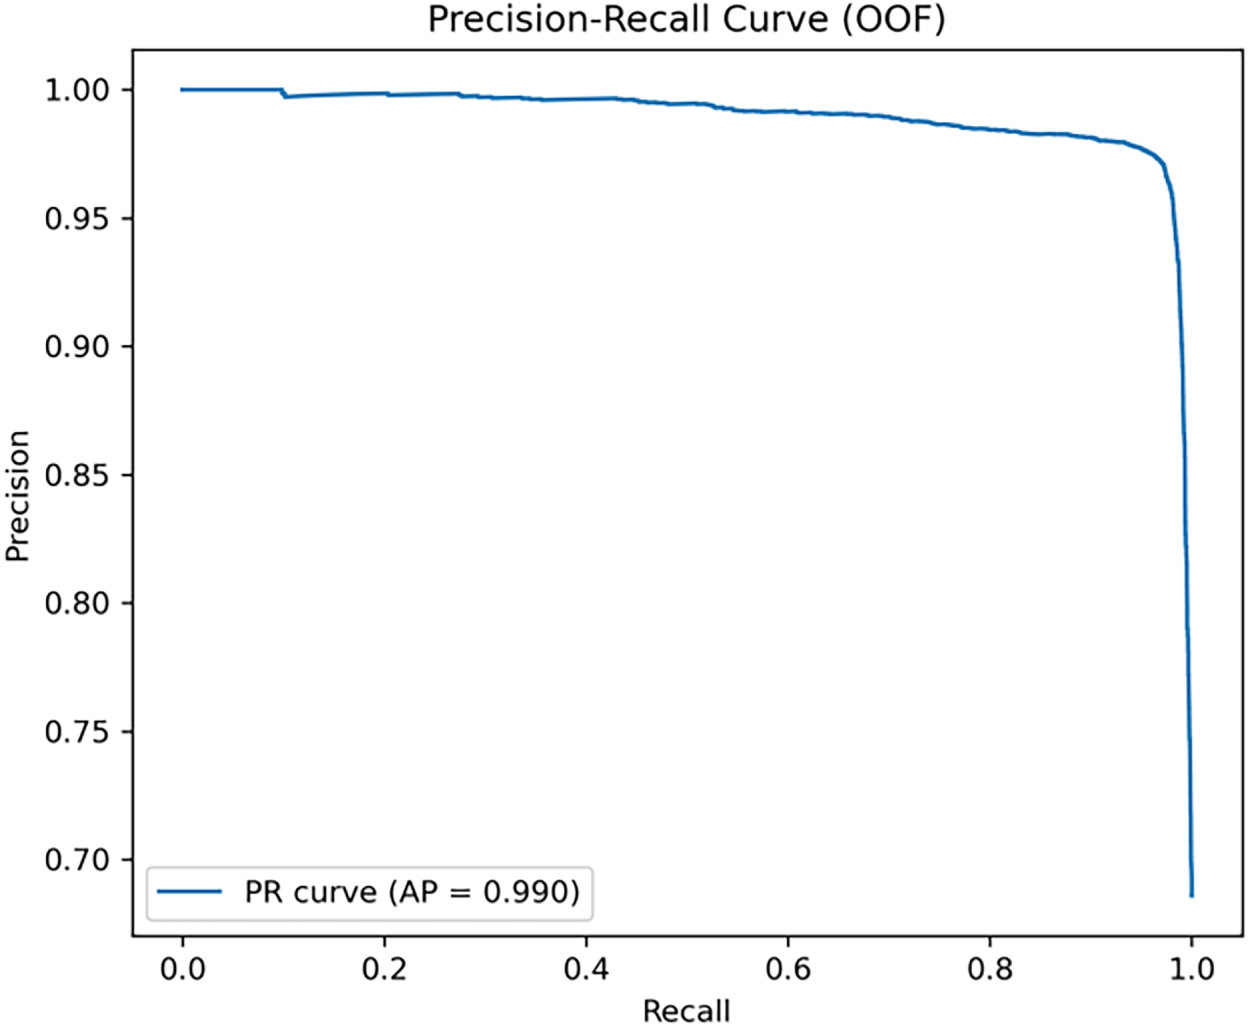
Figure 8: Advanced PR curve for LR
We also visualized the top 20 most important features identified through RFE-based cross-validation, as shown in Fig. 9. The most influential feature was pv_ratio. A higher pv_ratio indicates that users frequently browse products but do not purchase them, thus providing a stronger discriminative signal. Second, intent_to_pv_rate and intent_intensity reflect the efficiency with which browsing behavior converts into concrete purchase intent, making them key indicators of conversion likelihood.
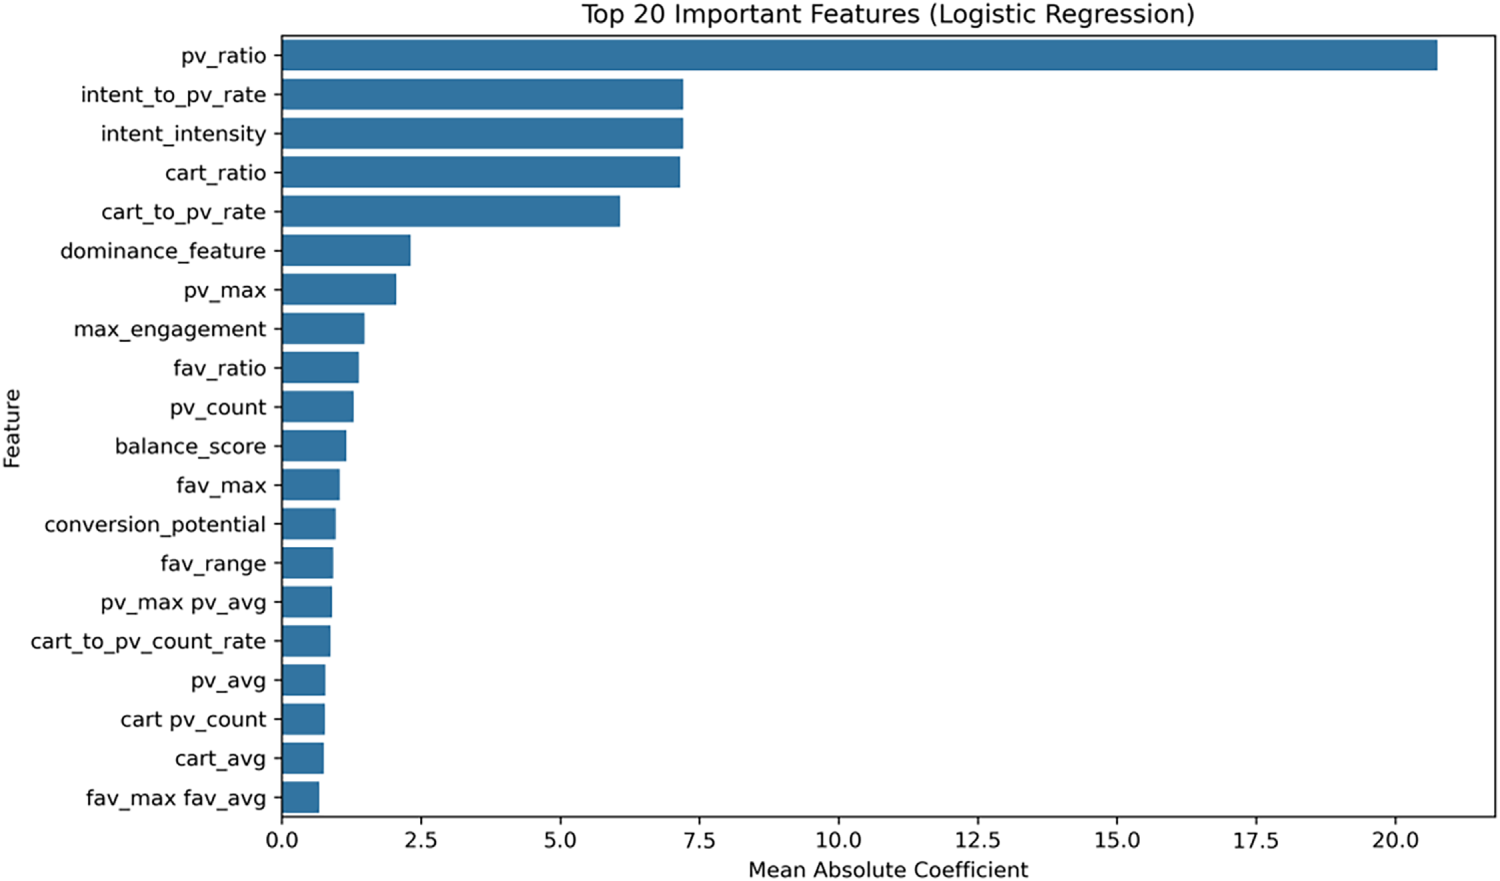
Figure 9: Top 20 important features (LR on RFE-based features)
Among the features related to the shopping cart, cart_ratio and cart_to_pv_rate exhibited high importance, indicating that adding to the shopping cart has a greater impact on the final purchase decision than adding to a collection. The dominance_feature (which captures whether a user is cart-dominant or collection-dominant) highlights its relevance in discriminating user behavioral preferences.
Furthermore, features such as pv_max, max_engagement, and pv_count indicate that users with higher browsing intensity and overall engagement tend to have a higher probability of purchase. These findings collectively validate the effectiveness of the proposed hierarchical feature engineering framework, where the behavior ratio, conversion metrics, and interaction features collectively enhance the discriminative power of the model.
Through feature validation analysis and comparative experiments, we found that user browsing activity, add-to-cart behavior, and favorites, as well as their interactions, are the core factors influencing purchase decisions. Therefore, a feature engineering framework that can help improve the accuracy of purchase predictions is presented. This framework includes basic statistical features, conversion rate features, behavioral stability features, and overall activity and preferences.
To make the results more interpretable, after verifying the feasibility and effectiveness of feature engineering on LR, we further tested the same feature framework using other models to evaluate cross-model robustness. The results are summarized in Table 9.
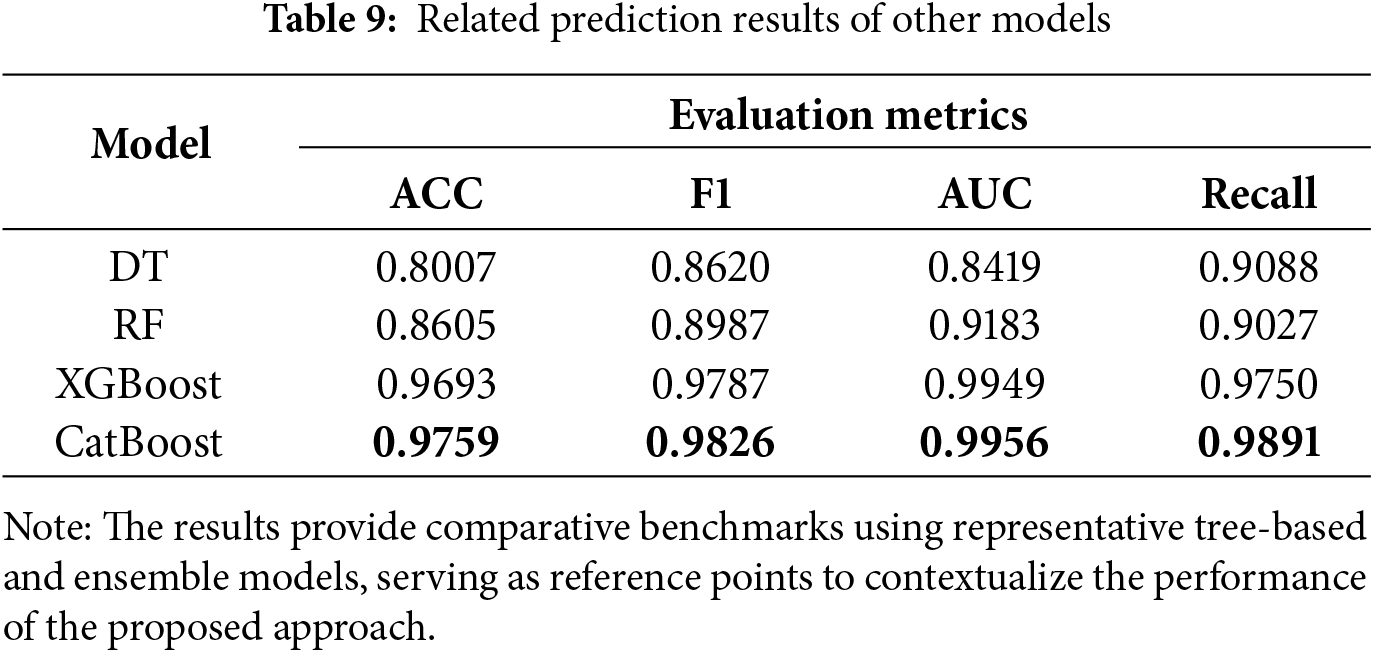
The evaluation results clearly show that the model based on the gradient-boosted DT presents significant advantages, demonstrating that behavioral stability and interactive features contribute significantly to purchase prediction. Both models performed similarly in terms of AUC, demonstrating strong predictive power. The slight advantage of CatBoost may stem from its unique design. First, its built-in ordered boosting strategy can more effectively handle categorical features and reduce target leakage, thereby yielding unbiased gradient estimates. Second, its default symmetric tree structure plays a strong regularization role, which can more effectively prevent the model from overfitting to noise when dealing with the large number of high-order interactive features that we designed. By contrast, the traditional DT and RF models performed relatively poorly with the same feature set.
Compared to the LR model (Fig. 9), the CatBoost model (Fig. 10) exhibited a distinct distribution of feature importance. The LR model (Fig. 9) relies more evenly on multiple ratio-based conversion metrics such as pv_ratio, intent_to_pv_rate, and cart_ratio. By contrast, the CatBoost model (Fig. 10) exhibited highly concentrated feature importance, with pv_ratio and intent_to_pv_rate being dominant. Notably, CatBoost also incorporates basic statistical features such as pv_min and pv_count, which are not highly valued by the LR model. Although advanced features, such as cart_range and behavior_consistency, are included, their importance is lower.
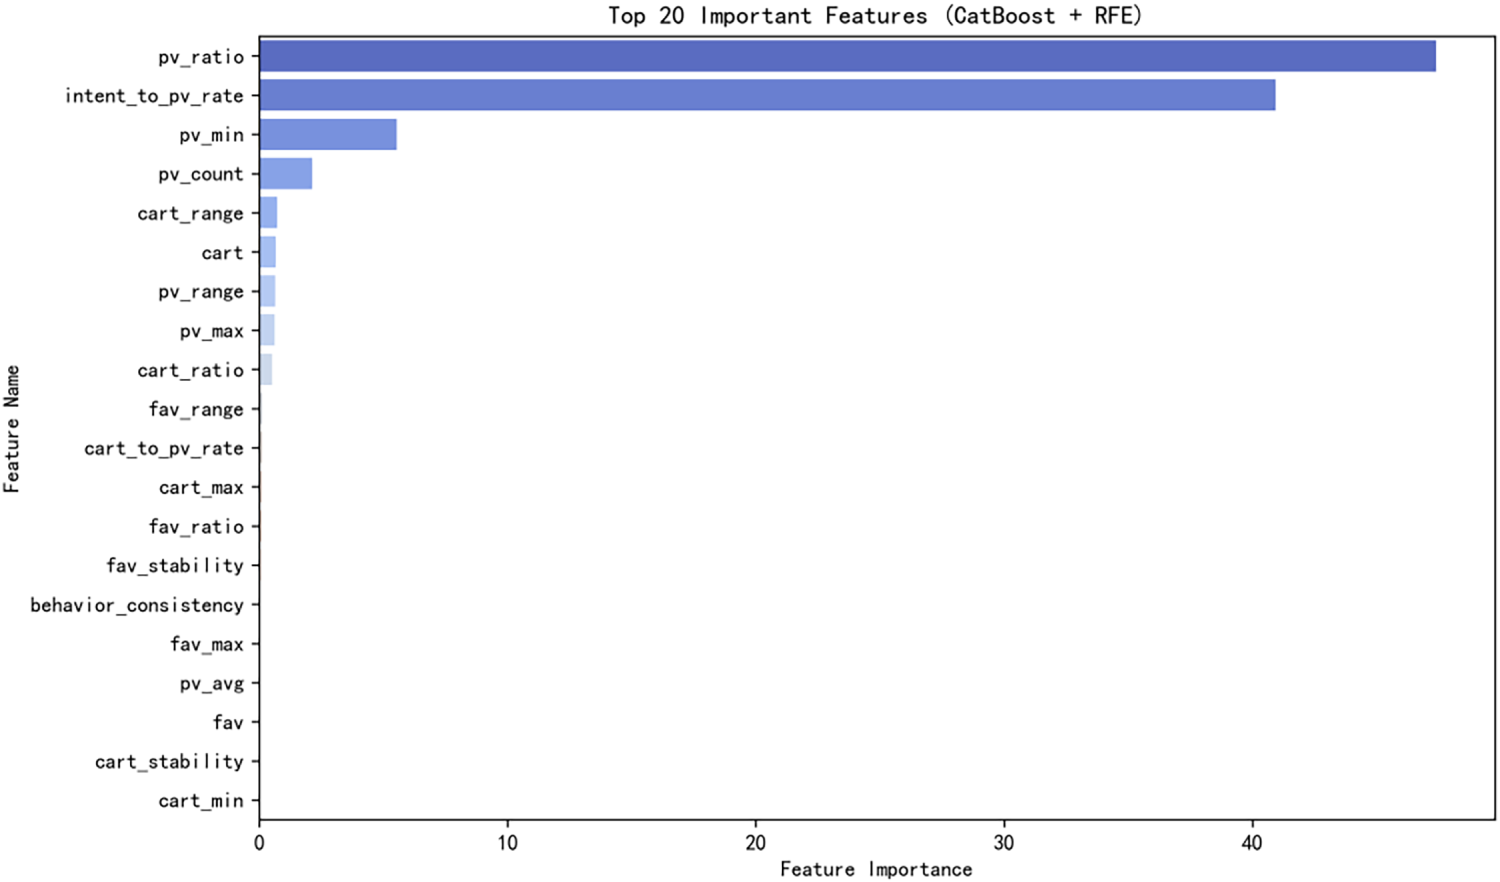
Figure 10: Top 20 important features (CatBoost on RFE-based features)
Therefore, unlike LR, which primarily relies on a set of (or multiple) linear ratio features, CatBoost, through its nonlinear capabilities, further exploits the predictive potential of its two core features, pv_ratio and intent_to_pv_rate, while also extracting signals from base-level features (such as pv_min) that are beyond the reach of linear models. This result demonstrates that CatBoost’s superior performance stems from its ability to exploit the complex nonlinear dependencies between features at different layers (base and transformation layers), thereby validating the effectiveness of the hierarchical feature engineering framework.
In the hierarchical evaluation process, the model performance continued to improve with increasing feature layers, with the most significant gains seen with high-level behavioral features. In other words, in addition to basic statistical and conversion features, behavioral stability, interactions, and user preference patterns play a crucial role in improving purchase prediction accuracy.
Regarding model performance, CatBoost and XGBoost showed strong robustness across feature layers, whereas DT and RF underperformed. We attribute this to DT’s tendency to over-expand dimensionality when handling large sets of derived features, and to RF’s difficulty in filtering noisy high-order signals. This suggests that gradient-boosting models are better suited for layered, behavior-driven feature structures.
Although the high-level features achieved excellent results, the unusually high F1 scores (up to 0.98) may partially reflect biases inherent to the dataset and its short time span (9 days). Prior work has shown that user behavior in e-commerce often exhibits seasonal and long-term dynamics, and such temporal structures can substantially influence model evaluation and generalizability [40]. In this regard, temporal fluctuations may have contributed to the observed performance.
While the core of our framework relies on relative behavioral metrics such as conversion efficiency, behavioral stability, and interaction-based signals, validating these metrics on longer and multi-period datasets is necessary to fully assess their generalizability beyond the short observational window used in this study.
In this study, we define behavioral stability strictly within a short-term horizon, namely as consistency observed across the 9-day window rather than as evidence of long-term periodicity or seasonality. Therefore, the findings should be interpreted as preliminary insights into short-term behavioral patterns. Future work will expand this framework to multi-week and multi-month datasets to examine seasonal effects, habit formation processes, and long-term behavioral stability more comprehensively.
Beyond temporal considerations, we also address platform generalization. Although some raw features originate from Taobao’s logging schema, the proposed hierarchical framework remains funda-mentally platform independent. Each feature layer abstracts user behavior into universal constructs such as efficiency, volatility, interaction intensity, and activity synergy dimensions that can be consistently defined across diverse e-commerce systems regardless of event naming conventions [41]. This abstraction allows platform-specific logs to be mapped onto a common behavioral funnel (e.g., view → consider → purchase), ensuring broad applicability across heterogeneous e-commerce environments.
In future work, we plan to verify temporal and platform-level generalization by incorporating longer-term user logs, including data spanning major sales cycles such as Double 11 and 618. Additionally, time-series and deep neural models (e.g., LSTM, CNN-based sequential encoders) may complement the proposed framework by capturing behavioral dynamics beyond what manual feature design can provide.
Lastly, this study did not engage in extensive hyperparameter optimization. Future research will employ automated search methods to systematically investigate the optimal configurations and further refine model performance.
In summary, despite certain limitations, our results demonstrate the effectiveness and interpretability of the proposed hierarchical feature engineering framework and highlight its practical value for real-world e-commerce behavioral modeling.
In the increasingly complex e-commerce landscape, the core contribution of this research lies in proposing and validating, through a hierarchical evaluation approach, a multi-dimensional feature engineering framework that significantly improves the ability to predict user purchasing behavior. When applied to the machine learning models selected for this study, the XGBoost and CatBoost models performed particularly well, achieving high F1 scores of 0.9787 and 0.9826, respectively, demonstrating that high-quality features can improve model performance.
Our feature engineering framework systematically integrates three layers of features: Basic (Basic Features), Conversion (Conversion Rate and Behavior Stability,), and Advanced (Overall Activity and Advanced Interactions). The results strongly confirm that constructing these composite features significantly enhances the ability of the model to identify potential purchasers and demonstrate the importance of more detailed feature engineering in commercial machine learning applications.
In summary, this study provides both a validated technical approach for e-commerce purchase prediction and a transparent hierarchical evaluation methodology that quantifies the contribution of each feature layer. This study reaffirms the enduring value of manual, domain-driven feature engineering in complementing automated methods. However, this study was limited by its short observation period and use of a single dataset. Future research should extend this framework to multi-period data and explore hybrid approaches that integrate automated feature learning.
Acknowledgement: The authors gratefully acknowledge the support of Hanyang University, Seoul, Republic of Korea. The authors further acknowledge Alibaba Group for providing access to the dataset, which is anonymized and publicly released for non-commercial research use through the Tianchi Big Data Platform. Liqiu Suo, Lin Xia, and Yoona Chung contributed equally to this work.
Funding Statement: This research was supported by the research fund of Hanyang University (HY-202500000001616).
Author Contributions: Conceptualization, Liqiu Suo and Eunchan Kim; Methodology, Liqiu Suo and Eunchan Kim; Software, Liqiu Suo; Validation, Liqiu Suo and Eunchan Kim; Formal analysis, Liqiu Suo, Lin Xia, and Eunchan Kim; Investigation, all authors; Resources, Liqiu Suo; Data curation, Liqiu Suo and Eunchan Kim; Visualization, Liqiu Suo; Supervision, Eunchan Kim; Project administration, Eunchan Kim; Funding acquisition, Eunchan Kim; Writing—original draft, Liqiu Suo and Eunchan Kim; Writing—review & editing, Eunchan Kim and Yoona Chung. All authors reviewed the results and approved the final version of the manuscript.
Availability of Data and Materials: The dataset is anonymized and publicly released for non-commercial research use by Alibaba through the Tianchi Big Data Platform (https://tianchi.aliyun.com/dataset/649?lang=en-us, accessed on 12 December 2025). All pre-processing scripts, experimental code, and processed data for this study are available on GitHub (https://github.com/SodaQiu/A_Hierarchical_Feature_Engineering_and_Evaluation_Framework_for_E-commerce_Purchase_Prediction, accessed on 01 December 2025).
Ethics Approval: Not applicable.
Conflicts of Interest: The authors declare no conflicts of interest to report regarding the present study.
This section provides the mathematical definitions and computational logic of the feature engineering framework described in Section 4.3.
All formulas were implemented in Python (NumPy and Pandas) for reproducibility.
Appendix A.1 Conversion Rate Features
Behavioral transition efficiency is captured as
where
Similarly, we define purchase-oriented rates as follows:
We define conversion rate based on total views as follows:
Appendix A.2 Behavior Stability Metrics
Behavioral fluctuation and stability are calculated as follows:
where
We define intention intensity as
Appendix A.3 Overall Activity and Ratios
Overall user engagement is quantified as
Preference ratios are quantified as
Appendix A.4 Interaction and Consistency Features
Inter-feature synergy is measured as
Preference strength between Fav and Cart behaviors is defined as
Behavioral consistency is defined as
We also define the feature max-engagement as
The balance-score is defined as the balance between the user’s “add-to-cart” and “collect” intentions:
Appendix A.5 Removed Variables
For fair evaluation, all features directly linked to purchase outcomes (e.g.,
References
1. Jia R, Li R, Yu M, Wang S. E-commerce purchase prediction approach by user behavior data. In: 2017 International Conference on Computer, Information and Telecommunication Systems (CITS); 2017 Jul 21–23; Dalian, China. p. 1–5. doi:10.1109/CITS.2017.8035294. [Google Scholar] [CrossRef]
2. Patro SGK, Mishra BK, Panda SK, Kumar R, Long HV, Taniar D. Cold start aware hybrid recommender system approach for E-commerce users. Soft Comput. 2023;27(4):2071–91. doi:10.1007/s00500-022-07378-0. [Google Scholar] [CrossRef]
3. Gündüz Ş, Özsu MT. A Web page prediction model based on click-stream tree representation of user behavior. In: Proceedings of the Ninth ACM SIGKDD International Conference on Knowledge Discovery and Data Mining; 2003 Aug 24–27; Washington, DC, USA. p. 535–40. doi:10.1145/956750.956815. [Google Scholar] [CrossRef]
4. Zhou A, Ren K, Li X, Zhang W. MMSE: a multi-model stacking ensemble learning algorithm for purchase prediction. In: 2019 IEEE 8th Joint International Information Technology and Artificial Intelligence Conference (ITAIC); 2019 May 24–26; Chongqing, China. p. 96–102. doi:10.1109/itaic.2019.8785711. [Google Scholar] [CrossRef]
5. Li Q, Gu M, Zhou K, Sun X. Multi-classes feature engineering with sliding window for purchase prediction in mobile commerce. In: 2015 IEEE International Conference on Data Mining Workshop (ICDMW); 2015 Nov 14–17; Atlantic City, NJ, USA. p. 1048–54. doi:10.1109/ICDMW.2015.172. [Google Scholar] [CrossRef]
6. Du J, Rong J, Michalska S, Wang H, Zhang Y. Feature selection for helpfulness prediction of online product reviews: an empirical study. PLoS One. 2019;14(12):e0226902. doi:10.1371/journal.pone.0226902. [Google Scholar] [PubMed] [CrossRef]
7. Astuti IA, Nuraminudin M, Rahmi AN, Ikmah, Widjiyati, N, Gusti, KW. Enhancing E-commerce revenue prediction using ensemble models and feature engineering: a comparative study. In: 2024 International Conference on Informatics, Multimedia, Cyber and Information System (ICIMCIS); 2024 Nov 20–21; Jakarta, Indonesia. p. 773–8. doi:10.1109/ICIMCIS63449.2024.10956410. [Google Scholar] [CrossRef]
8. Zhang M, Lu J, Ma N, Edwin Cheng TC, Hua G. A feature engineering and ensemble learning based approach for repeated buyers prediction. Int J Comput Commun Control. 2022;17(6):1–17. doi:10.15837/ijccc.2022.6.4988. [Google Scholar] [CrossRef]
9. Du C, Li Y. E-commerce sales forecasting based on deep learning algorithm. Procedia Comput Sci. 2025;261:1157–64. doi:10.1016/j.procs.2025.04.699. [Google Scholar] [CrossRef]
10. Lin Z, Tan J, Ou D, Chen X, Yao S, Zheng B. Deep bag-of-words model: an efficient and interpretable relevance architecture for Chinese E-commerce. In: Proceedings of the 30th ACM SIGKDD Conference on Knowledge Discovery and Data Mining; 2024 Aug 25–29; Barcelona, Spain. p. 5398–5408. doi:10.1145/3637528.3671559. [Google Scholar] [CrossRef]
11. Zhou G, Zhu X, Song C, Fan Y, Zhu H, Ma X, et al. Deep interest network for click-through rate prediction. In: Proceedings of the 24th ACM SIGKDD International Conference on Knowledge Discovery & Data Mining; 2018 Aug 19–23; London, UK. p. 1059–68. doi:10.1145/3219819.3219823. [Google Scholar] [CrossRef]
12. Chen Q, Zhao H, Li W, Huang P, Ou W. Behavior sequence transformer for e-commerce recommendation in Alibaba. In: Proceedings of the 1st International Workshop on Deep Learning Practice for High-Dimensional Sparse Data; 2019 Aug 5; Anchorage, AK, USA. p. 1–4. doi:10.1145/3326937.3341261. [Google Scholar] [CrossRef]
13. Qin J, Zhang W, Wu X, Jin J, Fang Y, Yu Y. User behavior retrieval for click-through rate prediction. In: Proceedings of the 43rd International ACM SIGIR Conference on Research and Development in Information Retrieval; 2020 Jul 25–30; Virtual. p. 2347–56. doi:10.1145/3397271.3401440. [Google Scholar] [CrossRef]
14. Zhang W, Liu F. F-ensemble: a full fusion ensemble model for predicting E-commerce user purchasing behavior. In: Proceedings of the 2024 7th International Conference on Information Management and Management Science; 2024 Aug 23–25; Beijing, China. p. 117–23. doi:10.1145/3695652.3695715. [Google Scholar] [CrossRef]
15. Zhang Y, Yu Q, Zhang L. User purchase intention prediction based on improved deep forest. Comput Model Eng Sci. 2024;139(1):661–77. doi:10.32604/cmes.2023.044255. [Google Scholar] [CrossRef]
16. Alkan Ö, Güney E, Kılınç A. Predictors of online shopping behavior of women in Turkey: a model and empirical study. Int J Contemp Econ Admin Sci. 2023;13(1):410–42. [Google Scholar]
17. Patra GK, Kuraku CK, Konkimalla SK, Boddapati VN, Sarisa M, Rajaram SK, et al. A sentiment analysis of customer product review based on machine learning techniques in e-commerce. J Artif Intell Cloud Comput. 2023;2(4):1–7. [Google Scholar]
18. Ma X, Yao X, Guo S. Customer interest classification method of e-commerce trading platform based on decision tree algorithm. Int J Netw Virtual Organ. 2023;29(3/4):419–34. doi:10.1504/ijnvo.2023.135955. [Google Scholar] [CrossRef]
19. Sunarya PA, Rahardja U, Chen SC, Lic YM, Hardini M. Deciphering digital social dynamics: a comparative study of logistic regression and random forest in predicting E-commerce customer behavior. J Appl Data Sci. 2024;5(1):100–13. doi:10.47738/jads.v5i1.155. [Google Scholar] [CrossRef]
20. Li Y, Qi J, Jin H, Tian D, Mu W, Feng J. An improved genetic-XGBoost classifier for customer consumption behavior prediction. Comput J. 2024;67(3):1041–59. doi:10.1093/comjnl/bxad041. [Google Scholar] [CrossRef]
21. Alamsyah R. Using random forest and support vector machine algorithms to predict online shopper purchase intention from E-commerce session data. Int J Appl Inf Manage. 2024;4(2):84–96. doi:10.47738/ijaim.v4i2.81. [Google Scholar] [CrossRef]
22. Arshad S, Iqbal K, Naz S, Yasmin S, Rehman Z. A hybrid system for customer churn prediction and retention analysis via supervised learning. Comput Mater Contin. 2022;72(3):4283–301. doi:10.32604/cmc.2022.025442. [Google Scholar] [CrossRef]
23. Gan L. XGBoost-based E-commerce customer loss prediction. Comput Intell Neurosci. 2022;2022:1858300. doi:10.1155/2022/1858300. [Google Scholar] [PubMed] [CrossRef]
24. Ni Y, Duan J. Intelligent classification method for e-commerce customers based on improved XGboost model. J Comput Meth Sci Eng. 2025;2021:14727978251366486. doi:10.1177/14727978251366486. [Google Scholar] [CrossRef]
25. Dou X. Online purchase behavior prediction and analysis using ensemble learning. In: 2020 IEEE 5th International Conference on Cloud Computing and Big Data Analytics (ICCCBDA); 2020 Apr 10–13; Chengdu, China. p. 532–6. doi:10.1109/icccbda49378.2020.9095554. [Google Scholar] [CrossRef]
26. Swetha T, Roopa R, Sajitha T, Vidhyashree B, Sravani J, Praveen B. Forecasting online shoppers purchase intentions with cat boost classifier. In: 2024 International Conference on Distributed Computing and Optimization Techniques (ICDCOT); 2024 Mar 15–16; Bengaluru, India. p. 1–6. doi:10.1109/ICDCOT61034.2024.10515309. [Google Scholar] [CrossRef]
27. Wang W, Xiong W, Wang J, Tao L, Li S, Yi Y, et al. A user purchase behavior prediction method based on XGBoost. Electronics. 2023;12(9):2047. doi:10.3390/electronics12092047. [Google Scholar] [CrossRef]
28. Chaudhuri N, Gupta G, Vamsi V, Bose I. On the platform but will they buy? Predicting customers’ purchase behavior using deep learning. Decis Support Syst. 2021;149:113622. doi:10.1016/j.dss.2021.113622. [Google Scholar] [CrossRef]
29. Zhao X, Keikhosrokiani P. Sales prediction and product recommendation model through user behavior analytics. Comput Mater Contin. 2022;70(2):3855–74. doi:10.32604/cmc.2022.019750. [Google Scholar] [CrossRef]
30. Verdonck T, Baesens B, Óskarsdóttir M, Vanden Broucke S. Special issue on feature engineering editorial. Mach Learn. 2024;113(7):3917–28. doi:10.1007/s10994-021-06042-2. [Google Scholar] [CrossRef]
31. Rawat SS, Mishra AK. Review of methods for handling class imbalance in classification problems. In: Data engineering and applications. Singapore: Springer Nature; 2024. p. 3–14. doi:10.1007/978-981-97-0037-0_1. [Google Scholar] [CrossRef]
32. Baghla S, Gupta G. Performance evaluation of various classification techniques for customer churn prediction in E-commerce. Microprocess Microsyst. 2022;94:104680. doi:10.1016/j.micpro.2022.104680. [Google Scholar] [CrossRef]
33. Wang T. Risk assessment of customer churn in e-commerce platforms by integrating RF algorithm and extreme gradient boosting algorithm. Serv Oriented Comput Appl. 2025;203:1–17. doi:10.1007/s11761-025-00455-w. [Google Scholar] [CrossRef]
34. Alquhtani SA, Muniasamy A. Analytics in support of E-commerce systems using machine learning. In: 2022 International Conference on Electrical, Computer and Energy Technologies (ICECET); 2022 Jul 20–22; Prague, Czech Republic. p. 1–5. doi:10.1109/ICECET55527.2022.9872592. [Google Scholar] [CrossRef]
35. Hosmer DW Jr, Lemeshow S, Sturdivant RX. Applied logistic regression. Hoboken, NJ, USA: John Wiley & Sons, Inc.; 2013. [Google Scholar]
36. Breiman L. Random forests. Mach Learn. 2001;45(1):5–32. doi:10.1023/A:1010933404324. [Google Scholar] [CrossRef]
37. Chen T, Guestrin C. XGBoost: a scalable tree boosting system. In: Proceedings of the 22nd ACM SIGKDD International Conference on Knowledge Discovery and Data Mining; 2016 Aug 13–16; San Francisco, CA, USA. p. 785–94. doi:10.1145/2939672.2939785. [Google Scholar] [CrossRef]
38. Cho YH, Kim JK, Kim SH. A personalized recommender system based on web usage mining and decision tree induction. Expert Syst Appl. 2002;23(3):329–42. doi:10.1016/s0957-4174(02)00052-0. [Google Scholar] [CrossRef]
39. Prokhorenkova L, Gusev G, Vorobev A, Dorogush AV, Gulin, A. CatBoost: unbiased boosting with categorical features. Adv Neural Inf Process Syst. 2018;31:1–11. [Google Scholar]
40. Zhou S, Hudin NS. Advancing e-commerce user purchase prediction: integration of time-series attention with event-based timestamp encoding and Graph Neural Network-Enhanced user profiling. PLoS One. 2024;19(4):e0299087. doi:10.1371/journal.pone.0299087. [Google Scholar] [PubMed] [CrossRef]
41. Gu Y, Ding Z, Wang S, Yin D. Hierarchical user profiling for E-commerce recommender systems. In: Proceedings of the 13th International Conference on Web Search and Data Mining; 2020 Feb 3–7; Houston, TX, USA. p. 223–31. doi:10.1145/3336191.3371827. [Google Scholar] [CrossRef]
Cite This Article
 Copyright © 2026 The Author(s). Published by Tech Science Press.
This work is licensed under a Creative Commons Attribution 4.0 International License , which permits unrestricted use, distribution, and reproduction in any medium, provided the original work is properly cited.
 Downloads
 Citation Tools