
 Submit a Paper
 Propose a Special lssue
 Open Access
ARTICLE
Experimental Investigation on Fatigue Life of Carbon Fiber-Reinforced Nylon (Onyx) Based on Extrusion Printing
1 School of Engineering and Sciences, Tecnologico de Monterrey, Puebla, Mexico
2 Technical Development, Volkswagen de Mexico, Puebla, Mexico
3 SEPI ESIME Ticoman, Instituto Politecnico Nacional, CDMX, Mexico
* Corresponding Author: Moises Jimenez-Martinez. Email:
Computers, Materials & Continua 2026, 87(2), 18 https://doi.org/10.32604/cmc.2026.074260
Received 07 October 2025; Accepted 20 January 2026; Issue published 12 March 2026
 View Full Text
 Download PDF
Abstract
Most failures in component operation occur due to cyclic loads. Validation has been performed under quasistatic loads, but the fatigue life of components under dynamic loads should be predicted to prevent failures during component service life. Fatigue is a damage accumulation process where loads degrade the material, depending on the characteristics and number of repetitions of the load. Studies on the mechanical fatigue of 3D-printed Onyx are limited. In this paper, the strength of 3D-printed Onyx components under dynamic conditions (repetitive loads) is estimated. Fatigue life prediction is influenced by manufacturing processes, material properties, and applied loads, which can cause scatter in the results due to the interplay of these factors. By utilizing synthetic parameters derived from mechanical properties, the accuracy of fatigue life predictions has been improved significantly, from 23.13% to 98.33%. Additive manufacturing is flexible, but this flexibility generates scatter in the mechanical properties of produced components. This work also proposes the use of synthetic data with a neural network to improve the fatigue life prediction of printed Onyx subjected to tension–tension loads. Experimental uniaxial loads were used to characterize the mechanical behavior of printed specimens. The experimental data were used to evaluate the numerical predictions obtained through finite element analysis using commercial software and an artificial neural network. The results showed that the use of synthetic data helped improve fatigue life prediction.Keywords
For sustainable mobility, the weight of vehicles should be reduced to improve their performance and reduce their emissions during their manufacturing and operation. Their manufacturing techniques include additive manufacturing (AM), which is gaining traction; it includes various techniques, of which the most commonly used is material extrusion. The invention of AM has expanded the boundaries of manufacturing because it does not need special tooling; furthermore, temporary supports can be used during manufacturing and then removed after printing. Designs in manufacturing are limited by the infeasibility of some designs for injection, foundries, or molding due to their need for special tooling. AM reduces the carbon footprint of the manufacturing process [1–3].
Some filaments are reinforced, such as Onyx, a nylon-reinforced material with chopped carbon fiber. However, it generates new challenges regarding mechanical strength prediction; in particular, the same printed geometry results in different mechanical properties due to the flexibility and customizability of the process [4–6].
Printed components undergo severe loads during normal operation or abuse loads that depending on its safety requirements are evaluated under its represented conditions. Safety elements (e.g., chassis components) are critical, and their failure can be catastrophic; by contrast, vehicles can continue operating despite the failure of nonsafety elements (e.g., interior components). Different load cases should be considered in component design, such as quasistatic, cyclic, and transient loads. Over 90% of vehicle component failures are due to cyclic loads.
Although mechanical fatigue has been studied in conventional materials and processes, improvements in the useful life prediction of components are ongoing. In the case of printed components, there is an opportunity due to the flexibility of the process generates a nonstandard mechanical strength properties. For example, if the same component is printed on different printers, it can lead to differences in mechanical properties. More specifically, even if they are printed on the same printer but a manufacturing parameter varies between repetitions, the mechanical behavior will change. In order to transform printed components from spare parts or prototypes to structural components is mandatory to predict its mechanical behaviour. While finite element analysis contributes to predict the behaviour of components manufactured in traditional process, the prediction of AM is a challenge, due to the process itself.
Finite element analysis (FEA) is a numerical method that can be performed physically or virtually for design evaluation while meeting requirements. FEA involves reducing an infinite number of degrees of freedom by dividing (discretizing) a model. Elements that can be 0D, 1D, 2D, or 3D, along with special elements, are generated. The same model can be represented by different elements, such as those for masses, connections, addition of cross sections, and descriptions of component thickness or characteristics. Discretizing the model reduces the degrees of freedom to a finite number. The physics of a case study is represented by boundary conditions [6]. Different load cases can be evaluated in virtual environments, where different responses are obtained, such as strain and stress-time histories, which can be used to predict fatigue life using special software, such as nCode, FEMFAT, and fe-safe [7–12].
In this paper, experimental tests were conducted to characterize standardized specimens of printed Onyx to understand their mechanical fatigue. Consequently, the Wöhler curve was determined under a tension–tension condition, with a triangular waveform. This process was performed on a universal testing machine to measure the reduction in rigidity in the first ten cycles and in the cycle before failure. FEA was performed using the program Altair HyperMesh and the solver OptiStruct to predict this analysis numerically. The results were sent in H3D format to FEMFAT, which generated the material properties based on the experimental tests, resulting in a mean error of 52%. This error was reduced by using a neural network (NN) and adding synthetic data. These data depended on the relationships between the ultimate tensile and compressive strengths and stiffness reduction. This resulted in a maximum error of 10% at a 1100 N load. Considering six load levels, a mean error of 1.67% was obtained. The material degradation process was used as synthetic data in the NN to improve the fatigue life prediction of the printed materials. The reliability of using NNs depends on the amount of data used. The novelty of this work is its inclusion of synthetic data generated using material properties to predict fatigue life using experimental tests.
Fatigue failure varies according to material type. Fatigue failure is sudden and destructive in metals. In polymers with or without reinforcement, among other materials, fatigue failure can nucleate in the first stage of material life and propagate throughout the material life. This process is shown in Fig. 1.
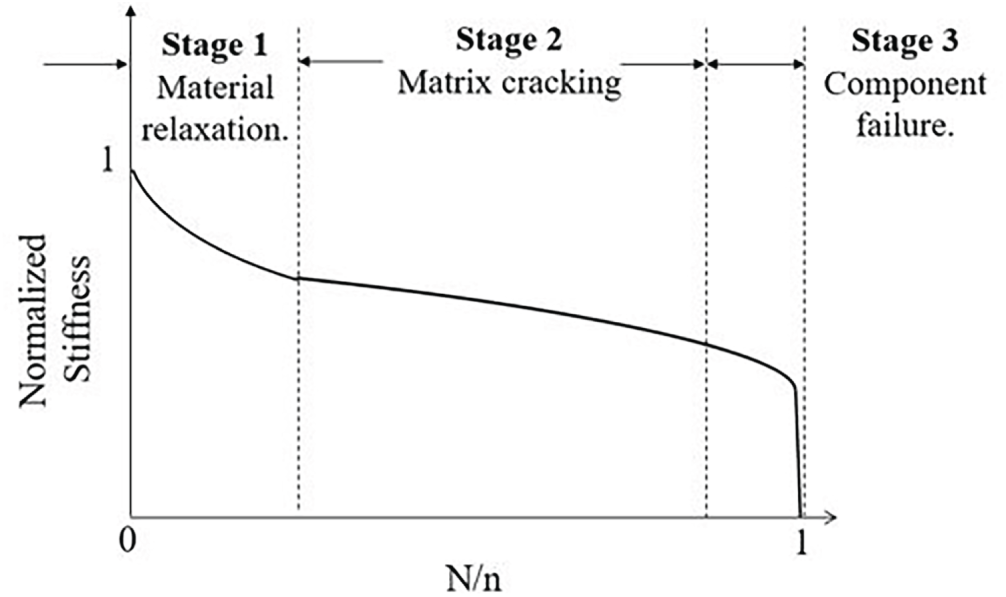
Figure 1: Schematic stiffness reduction under dynamic cyclic loads.
Unlike static failure, mechanical fatigue may occur when the load is in the linear region. Many factors modify fatigue life damage in service environments, such as temperature, corrosion, and the stress ratio [13]. Fatigue strength is a statistical process that depends on the geometry, material, and process parameters in manufacturing and their relationships (Fig. 2); economic feasibility is also considered, even for the optimal design. If the material, manufacturing process, or posttreatment of a technically optimal design incurs excessive costs, then it is financially infeasible [14,15].
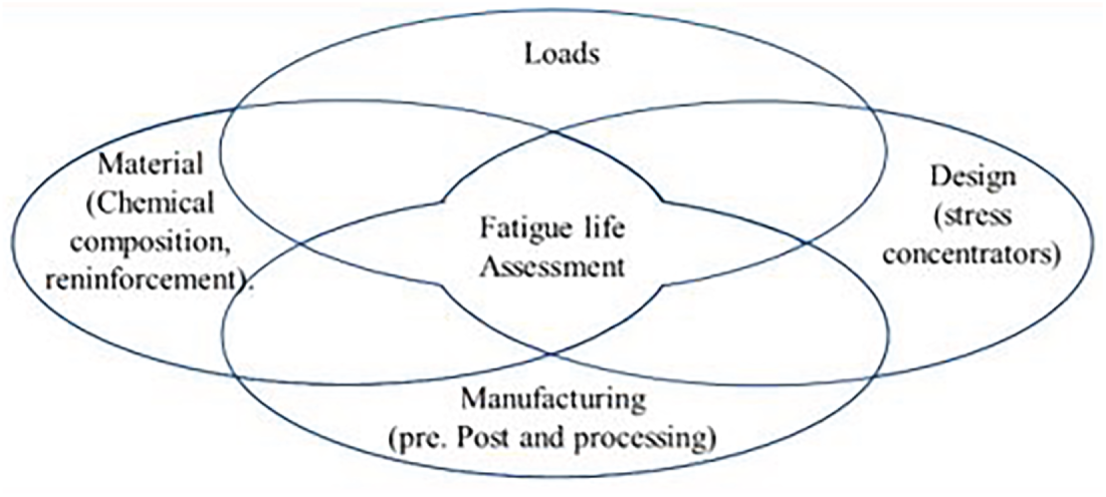
Figure 2: Parameters influencing fatigue assessment.
The relationships between these areas are used for fatigue assessment. Although processes and conditions are standardized, all processes exhibit some deviation, generating scatter by the parameter combination [16]. Design deviations are considered in terms of nominal dimensions and their tolerances. Manufacturing processes have parameters within parameters (pressure, velocity, clamping, and lubricants), which depend on the material lot, the material chemical composition, or the matrix and its reinforcements. All areas related to fatigue generate variability, which is expressed by its scatter, generating different failure modes. The maximum loads are compared with the component with the minor strength. When the load exceeds the mechanical strength, failure begins. This area is critical for fatigue design. A highly robust component reduces the probability of failure, thereby decreasing scatter strength, but compromises the economic aspect. The load conditions of certain components include severe loads. Under the most severe load, failure occurs in the component with the lowest properties, Fig. 3.
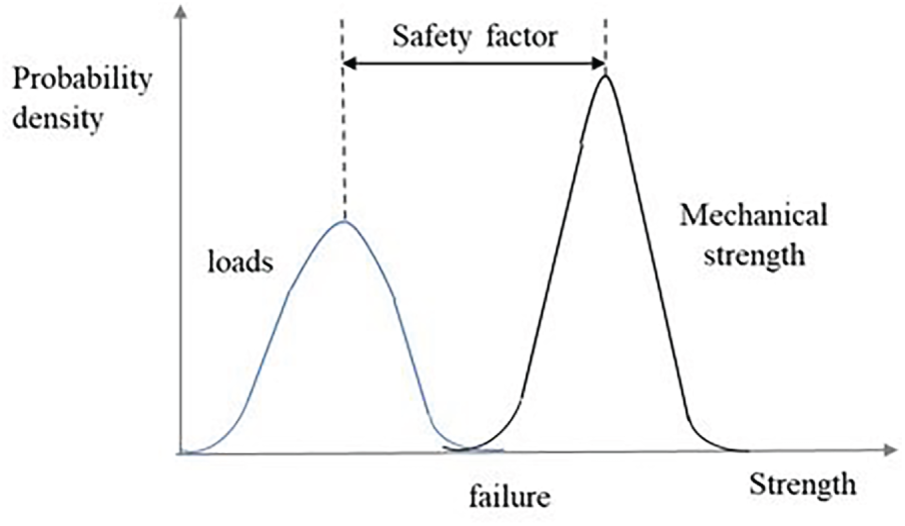
Figure 3: Likely hood of failure.
Damage detection is challenging due to the presence of complex failure modes. However, the uncertainty of mechanical fatigue can be reduced by combining experimental and simulation data [17,18]. A fault generally nucleates on the material surface; specifically, the material begins to separate, forming a fissure. However, depending on the load level, material, and type of manufacturing process, failure may originate within the material. Later, the fissure grows into a crack until it reaches a critical dimension and failure occurs. Failure can be monitored through temperature measurement; however, stiffness, which is affected by material degradation (it drops to a critical level before failure), can also be monitored.
The fatigue properties and performance of industrial components should be thoroughly considered during their design to avoid fatigue failure phenomena under user conditions. Before final release, the prototype of a new vehicle, with all components assembled, should undergo durability assessment to validate the durability, strength, and service life of its optimally designed components against those specified in its design. Vehicle service loads can be described using their properties, such as time histories, load amplitudes, frequencies, load relationships, and load sequences [19]. Load profiles can be at constant or variable amplitude (Fig. 4).
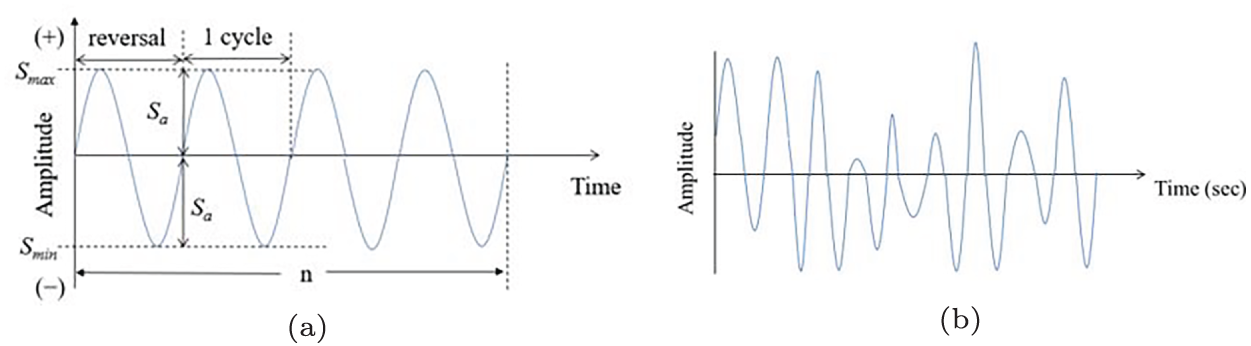
Figure 4: Schematic load profiles (a) constant amplitude and (b) variable amplitude.
The loads applied to components are defined by obtaining measurements, generating load histories, which can be of variable or constant amplitudes. Researchers have replicated these histories in durability tests, but in some cases, the most severe load can be applied to conduct accelerated life tests. The best relationship is obtained by statistically analyzing the loads to obtain the load spectrum, which is compared with the mechanical resistance to cyclic loads, as expressed by Wöhler curves. The loading frequency is determined by the time needed to complete a cycle. Some counting methods consider the loading amplitude and the number of times the cycle repeats throughout the load history.
The mechanical fatigue of conventional materials and processes has been studied, but research on improvements in the useful life prediction of components is ongoing. Printed components present a research opportunity: the flexibility of the printing process results in nonstandard properties related to mechanical strength. Printed components should be transformed from spare parts or prototypes to structural components to predict their mechanical behavior. Although FEA helps predict the behavior of traditionally manufactured components, prediction in the case of AM is challenging due to the process itself. Artificial intelligence can be used to perform this prediction and improve fatigue assessment. Kishino et al. evaluated the fatigue life of polymer films using a random forest [20]. Zhang et al. proposed a deep learning model for evaluating fatigue life [21]. Zhou et al. evaluated fatigue damage in composites [22].
Mimicking the biological nervous system, an NN is a structure consisting of interconnected neurons generating layers. The network topology can be used to solve regression problems. An artificial NN (ANN) consists of an input layer, a hidden layer, and an output layer. The behavior of a single neuron is
The input
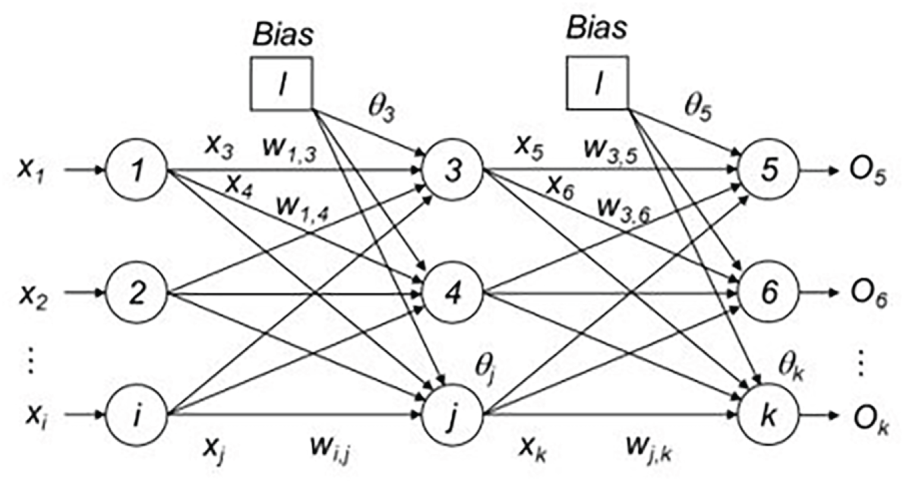
Figure 5: ANN topology.
Sigmoid, hyperbolic tangent, and rectified linear unit functions are commonly used activation functions. The feedforward network in this study consists of only one hidden layer with 44 neurons and uses a binary sigmoid transfer function to activate the neurons. Network performance is evaluated by analyzing the prediction capability using the root mean square error.
where
The data set used to make the prediction included experimental data. The primary variables defined were the applied load level (both maximum and minimum values) and the relationship between them. The material’s properties, such as stiffness (expressed by Young’s modulus) and ultimate strength values for tension and compression, were also considered. Additionally, synthetic values describing the failure process based on both static and dynamic mechanical properties were integrated. Mechanical fatigue is a complex process as it is a result of manufacturing processes, loads, and materials. To improve the assessment, experimental tests, finite element simulation, and synthetic data are used to improve the fatigue life prediction of printed Onyx.
Dog-bone specimens were manufactured using a Markforged Mark Two [24] printer to evaluate the mechanical performance of printed Onyx components. The geometry was based on ASTM D638 [25] type I; the gauge had a thickness of 3.2 mm, a calibrated length of 50 mm, and a width of 13 mm; the total length was 165 mm (Fig. 6). This standard was selected because the Onyx manufacturer, Markforged, specifically recommends this standard when evaluating material properties without reinforcing fibers, as mentioned in their material datasheet [26]. Since the purpose of this research is to analyze the intrinsic fatigue behavior of Onyx, the use of any reinforcement during manufacturing is omitted.
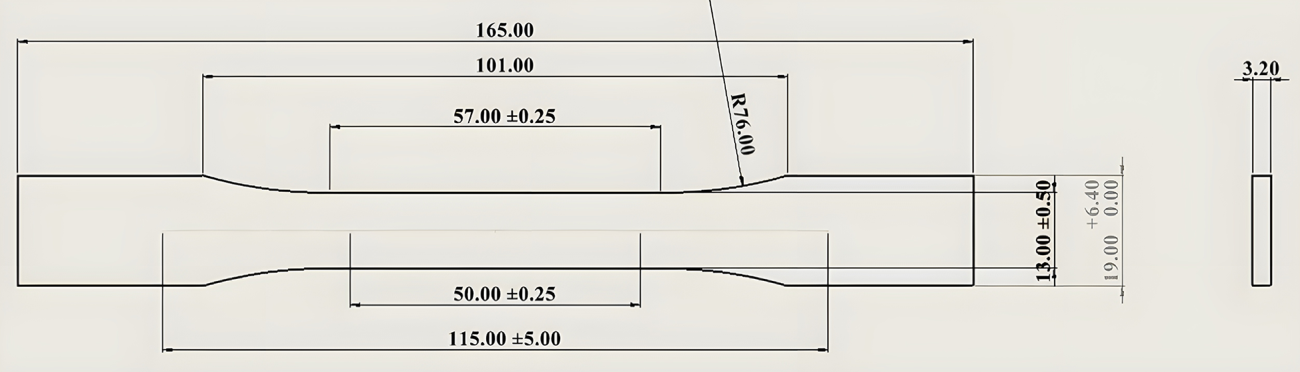
Figure 6: Specimen design (ASTM D638; unit: mm).
The computer-aided design model was developed in the software CATIA and exported as a stereolithography file. The printing parameters were customized to have an infill percentage of 100%, no reinforcement. Complete set of printing parameters is shown in Table 1 The thickness was aligned with the z axis of the machine to stack the layers in the thickness direction as is shown in Fig. 7. This type of printer has a cold print bed that does not heat up to any specific temperature during the process.
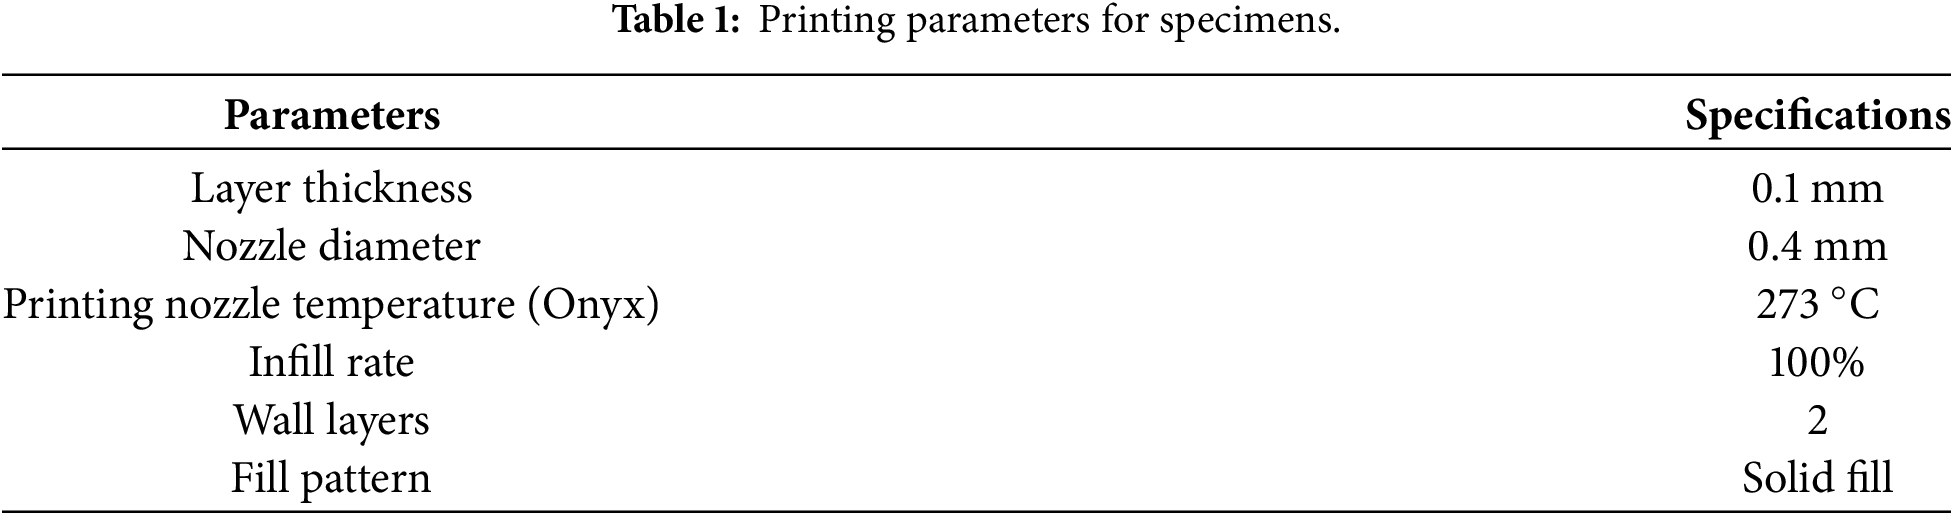
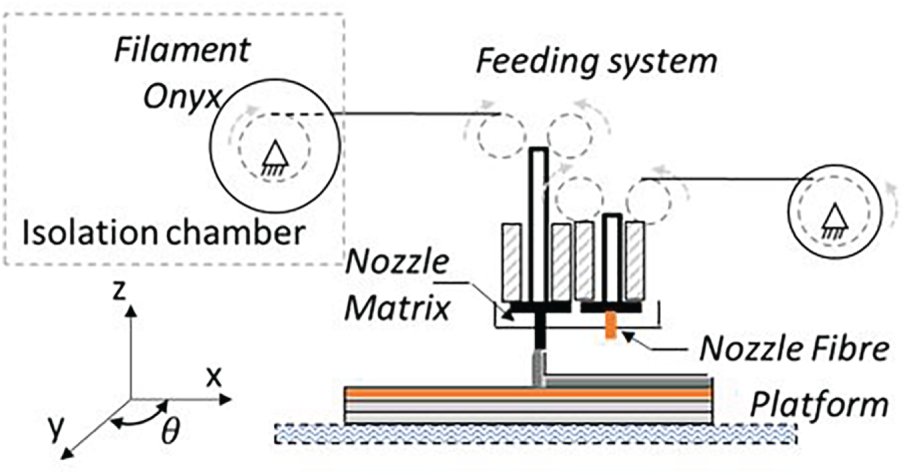
Figure 7: Schematic diagram of 3D printing process.
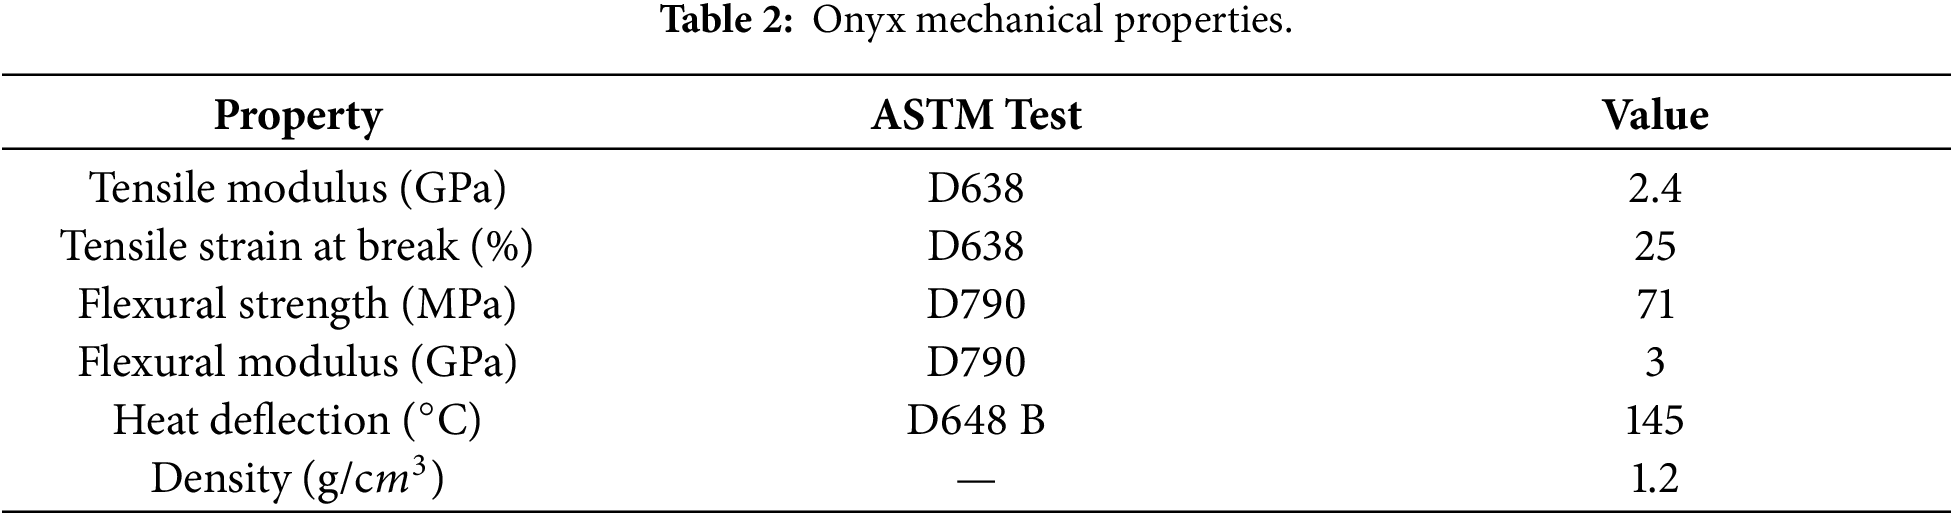
The manufacturer also lists the mechanical properties of Onyx in its pure state, mentioning the standards used to calculate the values. A summary is shown in Table 2 [26].
The specimen was located in the printer bed using a raster angle of
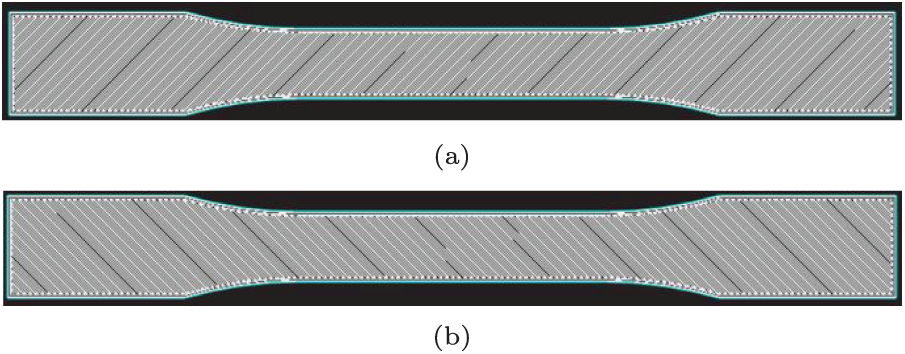
Figure 8: Internal printing pattern: (a) first and odd-numbered layers and (b) second and even-numbered layers.
An overview of the internal patterns of the print is shown in the composition of Fig. 9. The layer distribution is in Fig. 9a, and some dispersed fibers following the printing pattern are depicted in Fig. 9b.
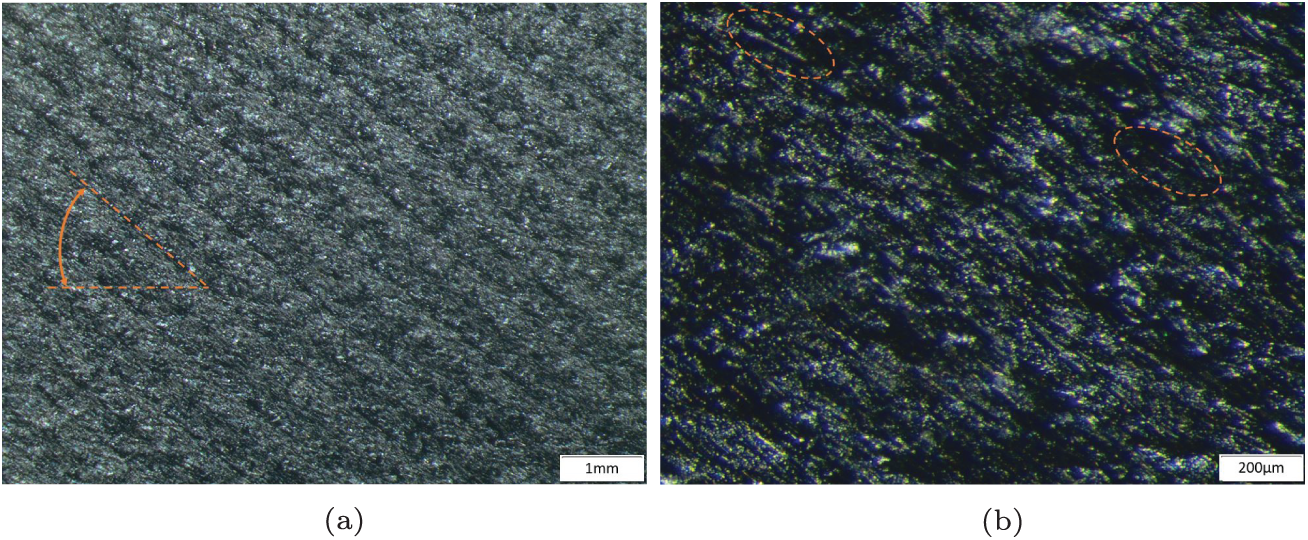
Figure 9: Internal printing results: (a) general view and (b) pattern orientation.
The test method is shown in Fig. 10. Specimens were printed for mechanical fatigue prediction. The first stage consisted of quasistatic tests, and the load levels were determined to characterize the material dynamically. Quasistatic tests were performed using an Instron universal testing machine with a Bluehill controlle, at a loading rate of 5 mm/min and a sampling rate of 0.2 s at room temperature to obtain responses under tensile and compression loads. The following equations were solved for the graphs obtained from the force and displacement signals:
where F is the force applied at each test point,
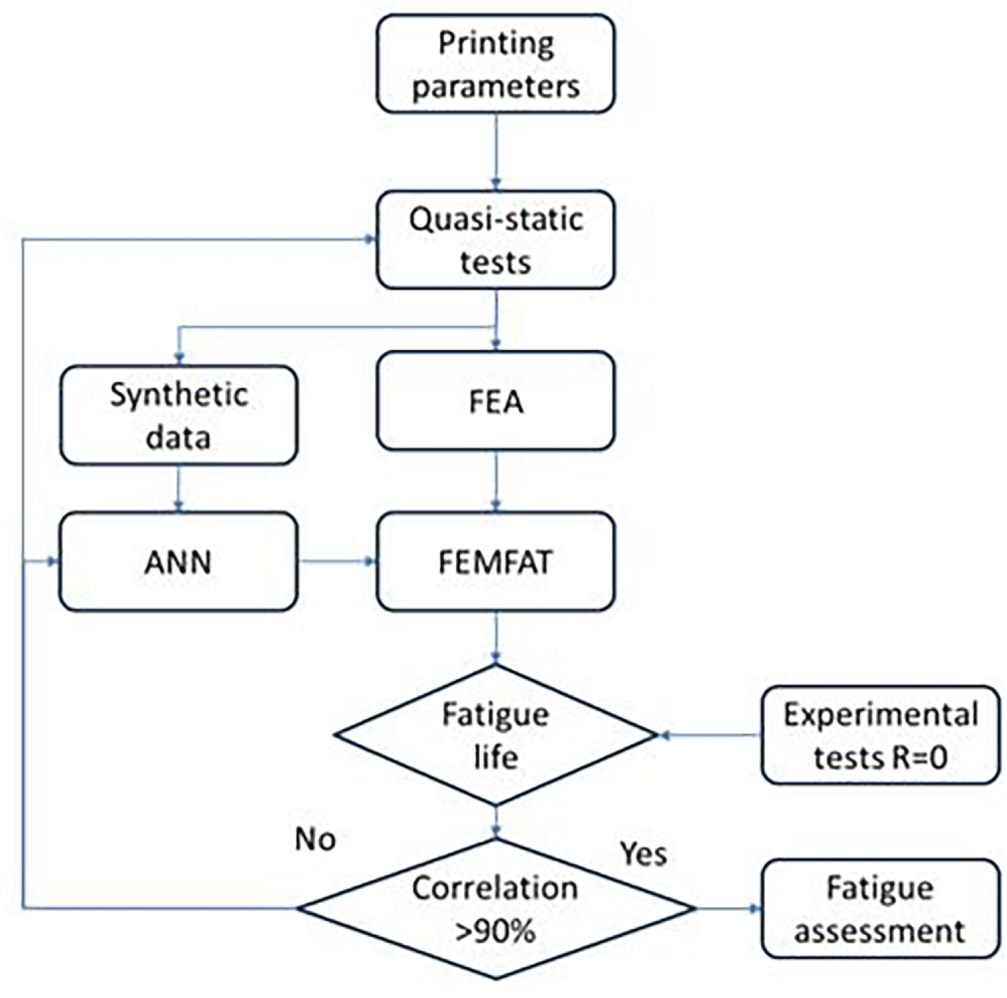
Figure 10: Methodology process.
Considering the statistical results, including the mean values, finite element simulation evaluation was performed. The first case was static, where the aforementioned result history was exported to FemFat to perform dynamic loading. The waveform was associated with the load and the dynamic properties of the material. In the final stage, evaluation was conducted using NNs, where synthetic values were used for evaluation. The target prediction error was 10%
The damage process depends on the physical effect on the component, although tests generally use loads where the minimum and maximum amplitudes have the same magnitudes but opposite directions. This generates tension and compression loads in the same cycle. However, compression–compression and tension–tension loads can also occur, and some load ratios
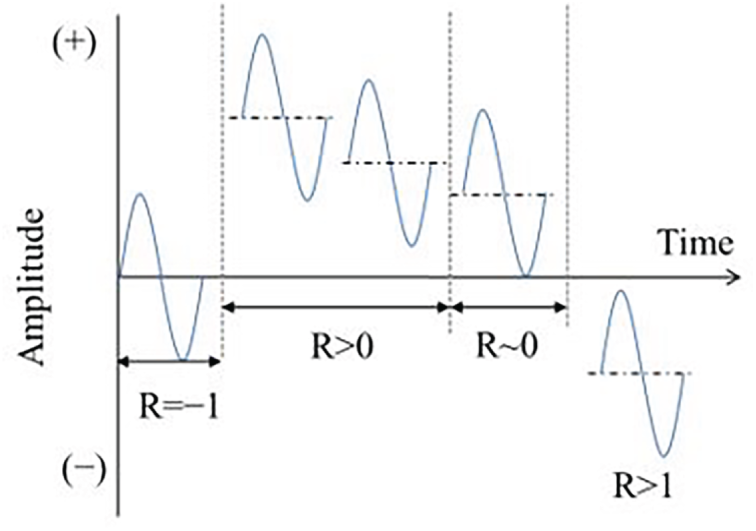
Figure 11: Relationship (R) between the maximum and minimum amplitude.
The durability of the printed Onyx specimens was evaluated through a tension–tension fatigue test at a stress ratio
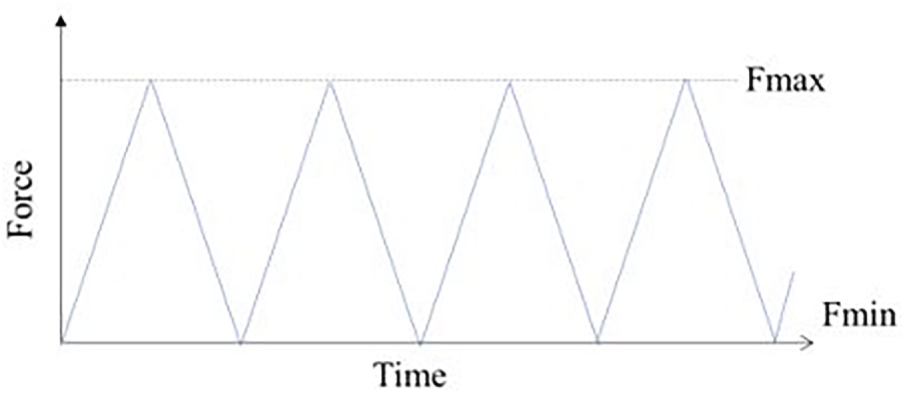
Figure 12: Schematic degradation of composite strength.
To perform the test, both the maximum and minimum stress values were defined in order to achieve a desired tension-tension relationship on the component. A key consideration in this process is the frequency test, which can adversely affect the results by causing overheating. Self-heating can alter the failure generation and propagation processes. For polymer materials, it is generally recommended to use a frequency between 1 and 25 Hz for both sine and triangular load waveforms. However, the ASTM 7791 standard suggests keeping the frequency under 5 Hz to avoid such adverse effects [27]. In this experimental setup, the frequency range was between 0.22 and 0.13 Hz, corresponding to loads of 1100 and 1600 N, respectively. These conditions ensure that the experiment stays well within the recommended range, minimizing the risk of self-heating and maintaining the reliability of the test results. Each specimen was evaluated until failure to determine its fatigue life. Dispersion was analyzed to ensure the reliability of the experimental results.
The tensile tests were performed until fracture (Fig. 13a). The compression tests were performed until the stress was 75% of its maximum value, by test control machine parameter (Fig. 13b). The limit of 75% in the reduction of the maximum value was established, with the target of obtaining the maximum compression strength to evaluate the relationship that exists regarding the maximum tensile related to compression value.
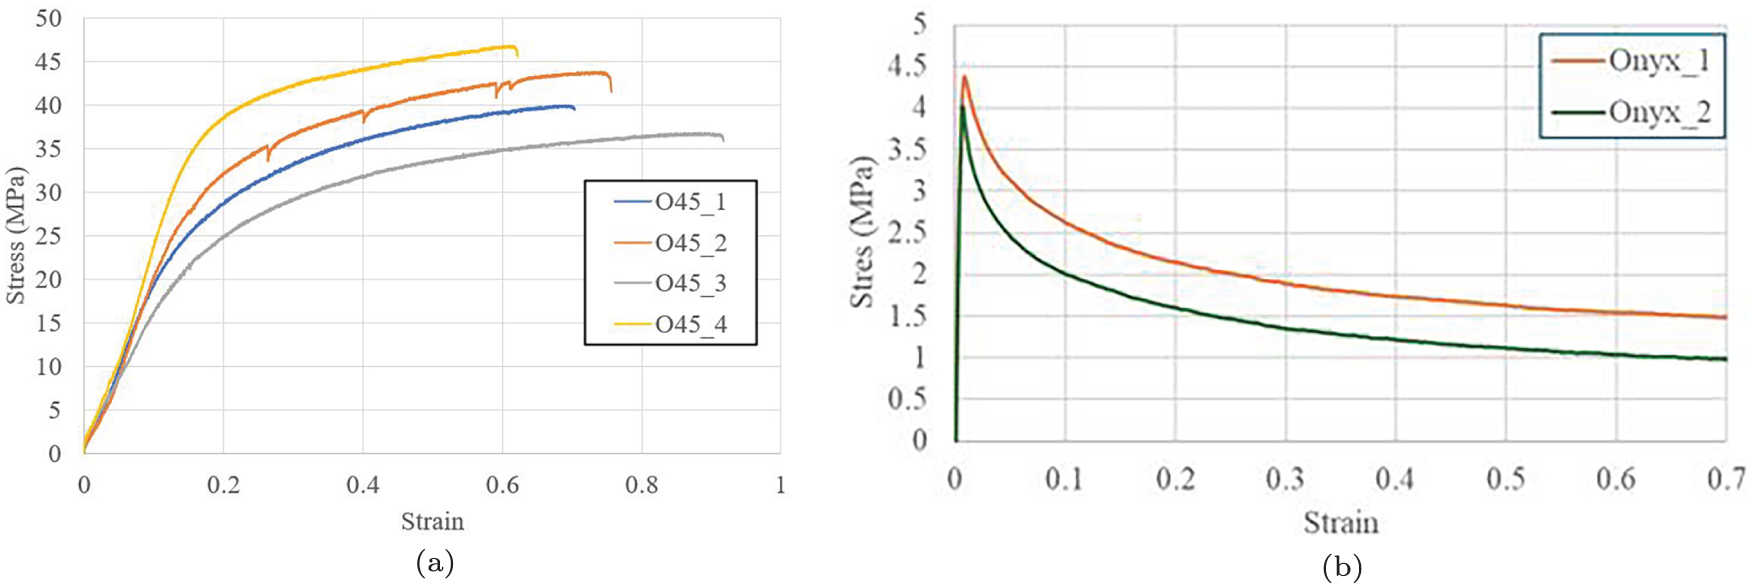
Figure 13: Traction sample according ASTM D638 (a) tensile and (b) compression tests.
Fig. 13a presents the results of tensile load tests conducted on four specimens. The tests revealed a mean tensile strength of 41.82 MPa. The highest recorded value was 48.8 MPa, while the lowest was 37.75 MPa, with a standard deviation of 4.39 MPa. In contrast, compression tests were performed on only two specimens to observe their reference behavior. These tests showed a mean compressive strength of 4.2 MPa, with the maximum and minimum values being 4.38 and 4.01 MPa, respectively. The standard deviation for the compression tests was 0.26 MPa. Based on a stress-to-compression ratio of approximately 10% of the tension, a cyclic stress–strain load tension–tension was defined to evaluate durability and prevent component buckling. The parameters obtained from both tests were used in experimental tests and fed to the finite element fatigue life software FemFat to predict durability from loads of 65%–95% of the Ultimate Tensile Strength (UTS).
Fatigue Tests
Fatigue load profile generates the responses shown in Fig. 14. The tests were performed from 1100 to 1600 N every 100 N. The load levels corresponds from 65% to 95% of the UTS. Fig. 14a shows the time history from the stress vs. displacement, for the first cycle to the n-cycle at failure, while Fig. 14b shows de strain vs. time. This figure shows the degradation of the stiffness. This degradation is monitored cycle by cycle, analyzing the dynamic stiffness response as the deformation required for the same load level increases; this trend is constant until failure occurs.
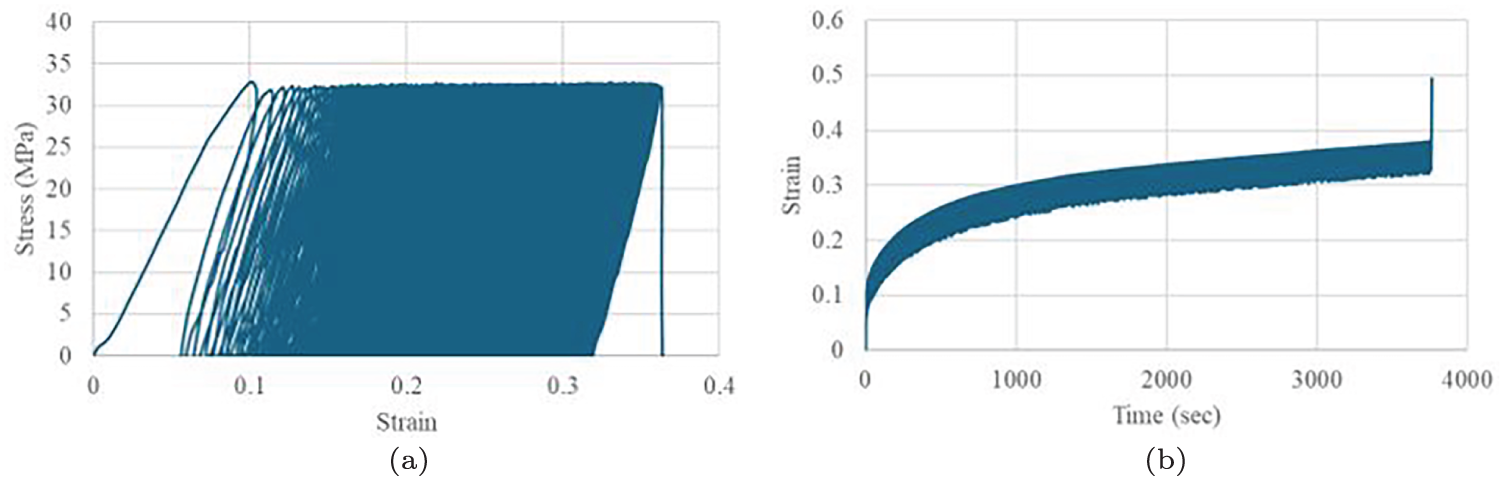
Figure 14: Schematic load time history from the first to the final load cycle (a) Stress vs. strain and (b) Strain vs. time.
The dynamic stiffness was studied to evaluate the damage process. Fig. 15a–f shows the first 10 cycles at different load levels. Specifically, Fig. 15a shows the dynamic stiffness at a load level of 1100 N (26.44 MPa), while Fig. 15b represents the response at 1200 N (28.84 MPa). Fig. 15c depicts the stiffness at a load level of 1300 N (31.25 MPa), and Fig. 15d illustrates the dynamic stiffness at 1400 N (33.65 MPa). Additionally, Fig. 15e corresponds to the time history of a load level of 1500 N (36.05 MPa), and Fig. 15f shows the mechanical response at 1600 N (38.46 MPa).
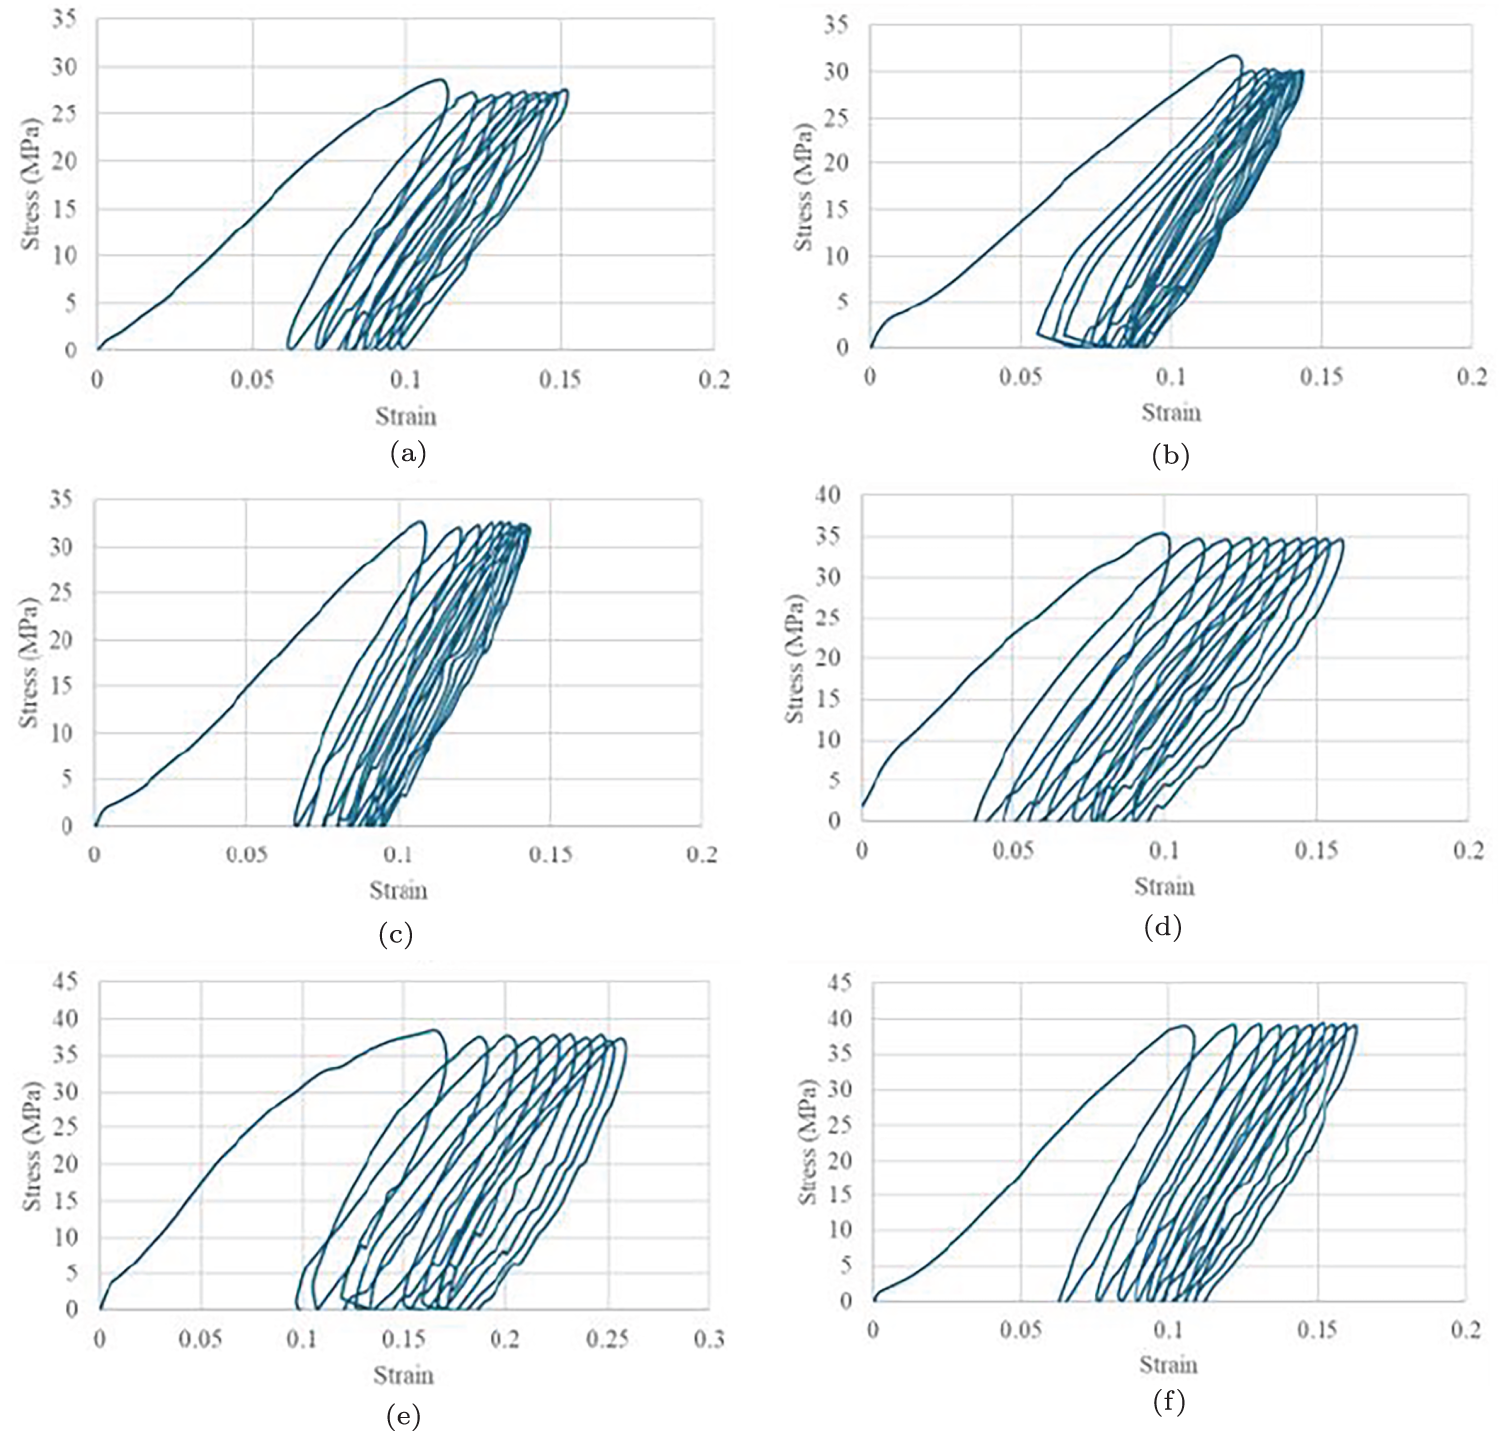
Figure 15: Time history result from first to tenth cycles, (a) 1100 N, (b) 1200 N, (c) 1300 N, (d) 1400 N, (e) 1500 N and (f) 1600 N.
A cyclic load was applied until the component failed. Fig. 16a shows pretest and posttest components. In addition to the crack, permanent deformation was seen in the posttest specimen due to the cyclic damage process. Fig. 16b shows the failure cross section, and Fig. 16c depicts the failure mechanism, specifically the ductile–brittle zone transition. The ductile zone generally lies at the ends of the cross section, where the walls are located. A brittle area is observed in the inner area of the pattern.
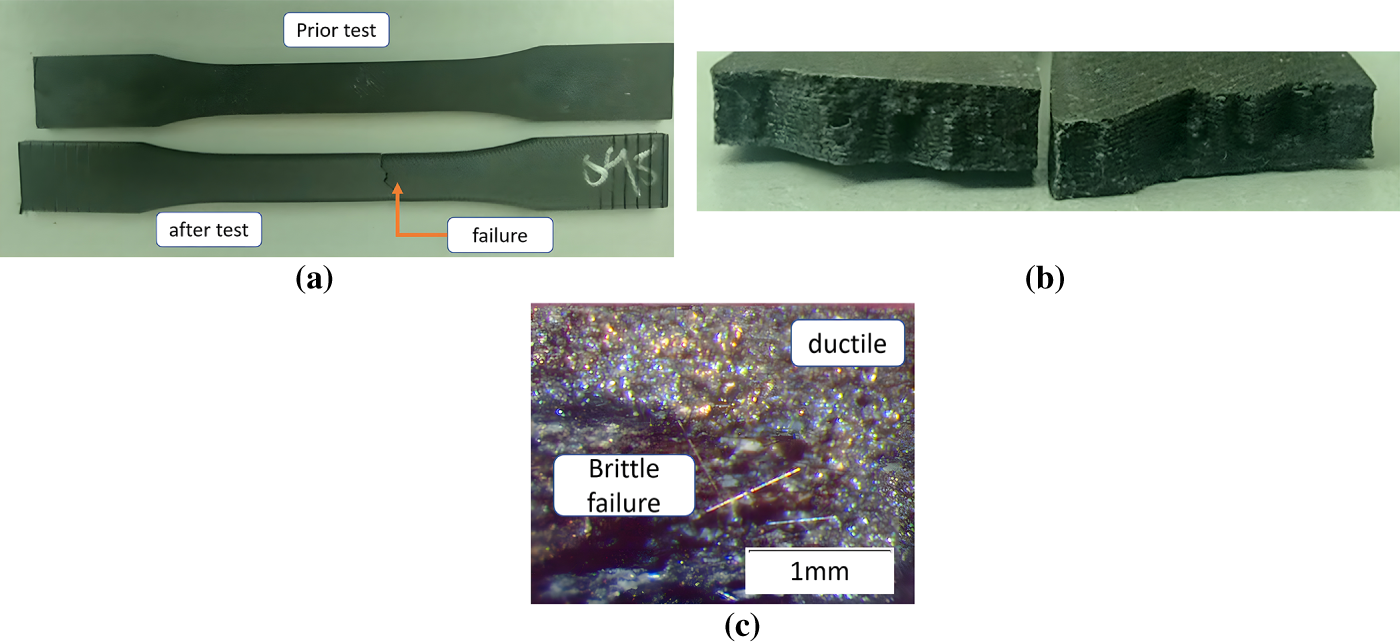
Figure 16: Failure (a) failure position, (b) cross section of the failure and (c) failure analysis.
It was observed that the behavior is ductile in the outer layers of the printed component. Additionally, the material showed signs of separation and experienced friction due to cyclic loading. This material is a nylon matrix reinforced with dispersed carbon fibers, which were observed to separate from the matrix in the brittle failure zone. The general objective of this analysis is to evaluate the macroscopic behavior during catastrophic failure, rather than investigating the failure mechanisms at a microscopic level.
The fatigue test results are summarized in Fig. 17, specifically those of tests at six load levels (1100–1600 N) up to the last cycle before failure and tests at 800 and 1000 N without failure (runout). The total number of specimens tested until failure, 24, conforms to the requirements specified in ASTM 3479 [28]. For the development of the S-N curve, a minimum of three specimens is necessary at each load level, as per ASTM 7791 [27].
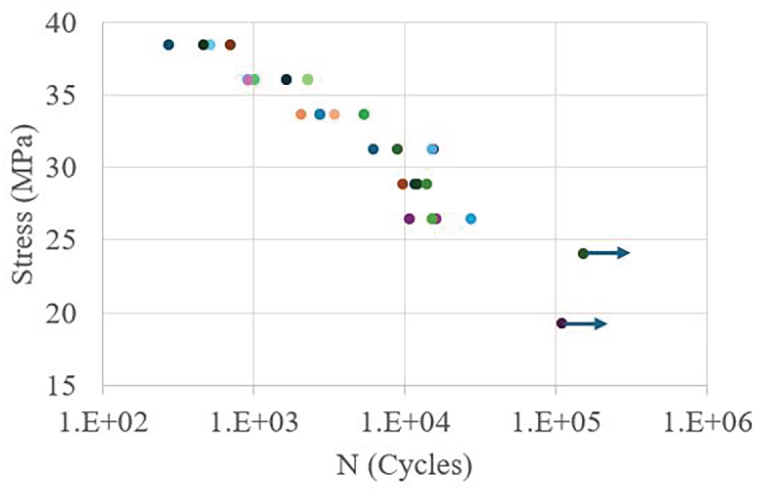
Figure 17: Uniaxial fatigue test of printed Onyx.
The standard deviation Eq. (5) represented process variability. Excessive scatter meant a higher failure probability. However, all experimental results obtained under cyclic loads presented scatter.
The results were deemed reliable because the mean value of the scatter was 0.16. The maximum value was 1300 N, with a dispersion of 0.194, whereas the minimum value was 0.066 at a load level of 1200 N. The standard deviation values across different load levels are all below 0.3, which is the maximum threshold for uni-axial fatigue tests [29]. This difference is observed in Fig. 18.
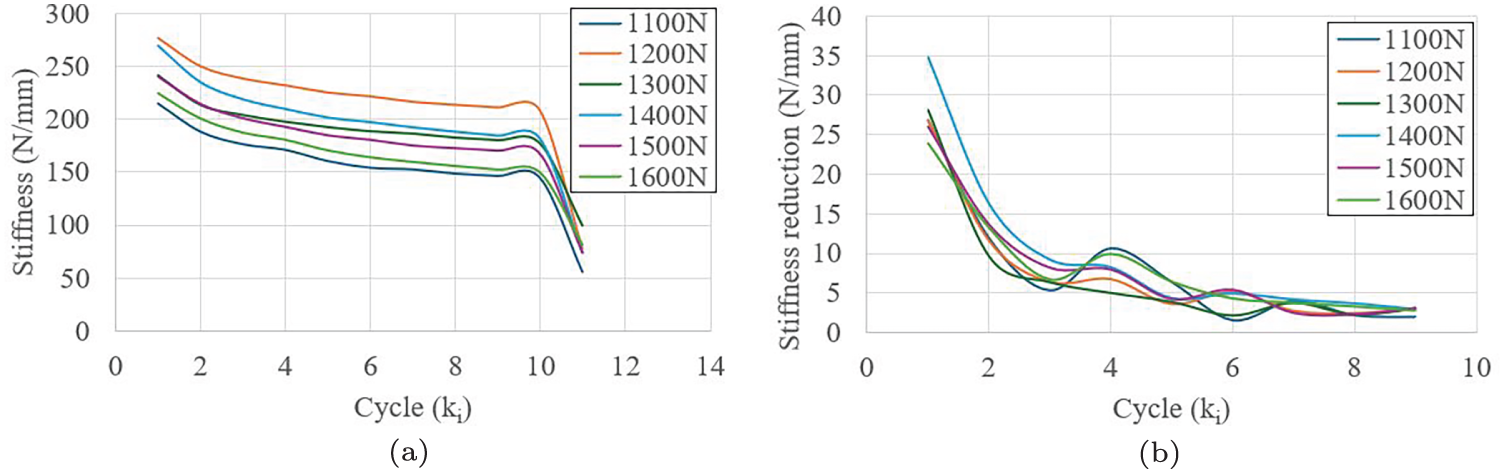
Figure 18: Dynamic stiffness (a) stiffness at n-cycle and (b) stiffness reduction between cycles.
Mechanical fatigue means the degradation of the mechanical properties of a material during cyclic loading. Dynamic stiffness is expected to reduce from the first cycle to a critical value before failure. Fig. 18a shows this reduction, measured at n-cycle. Fig. 18b shows the stiffness reduction between cycles; the reduction is greater at the beginning of cyclic loading but stabilizes later.
The test graphs show the damage accumulation process, where stiffness tends to decrease with each load cycle because the displacement increases to reach the level of force. This can be analyzed based on dynamic stiffness during the test. Due to the material’s characteristics, Onyx generates an increase in deformation until the material fails.
The total stiffness reduction from the first to the final cycle is summarized in Table 3. At the six load levels, the mean stiffness in the first cycle was 244 N/mm. In the first load cycles, the difference between the maximum and mean values was generally 35 N/mm, whereas the difference between the mean and minimum values was 28.3 N/mm. The mean stiffness in the last cycle was 76.5 N/mm, with a maximum value of 99 N/mm (at 1300 N) and a minimum value of 55.14 N/mm (at 1100 N). Therefore, fatigue failure was considered about to occur when this range of stiffness was reached.
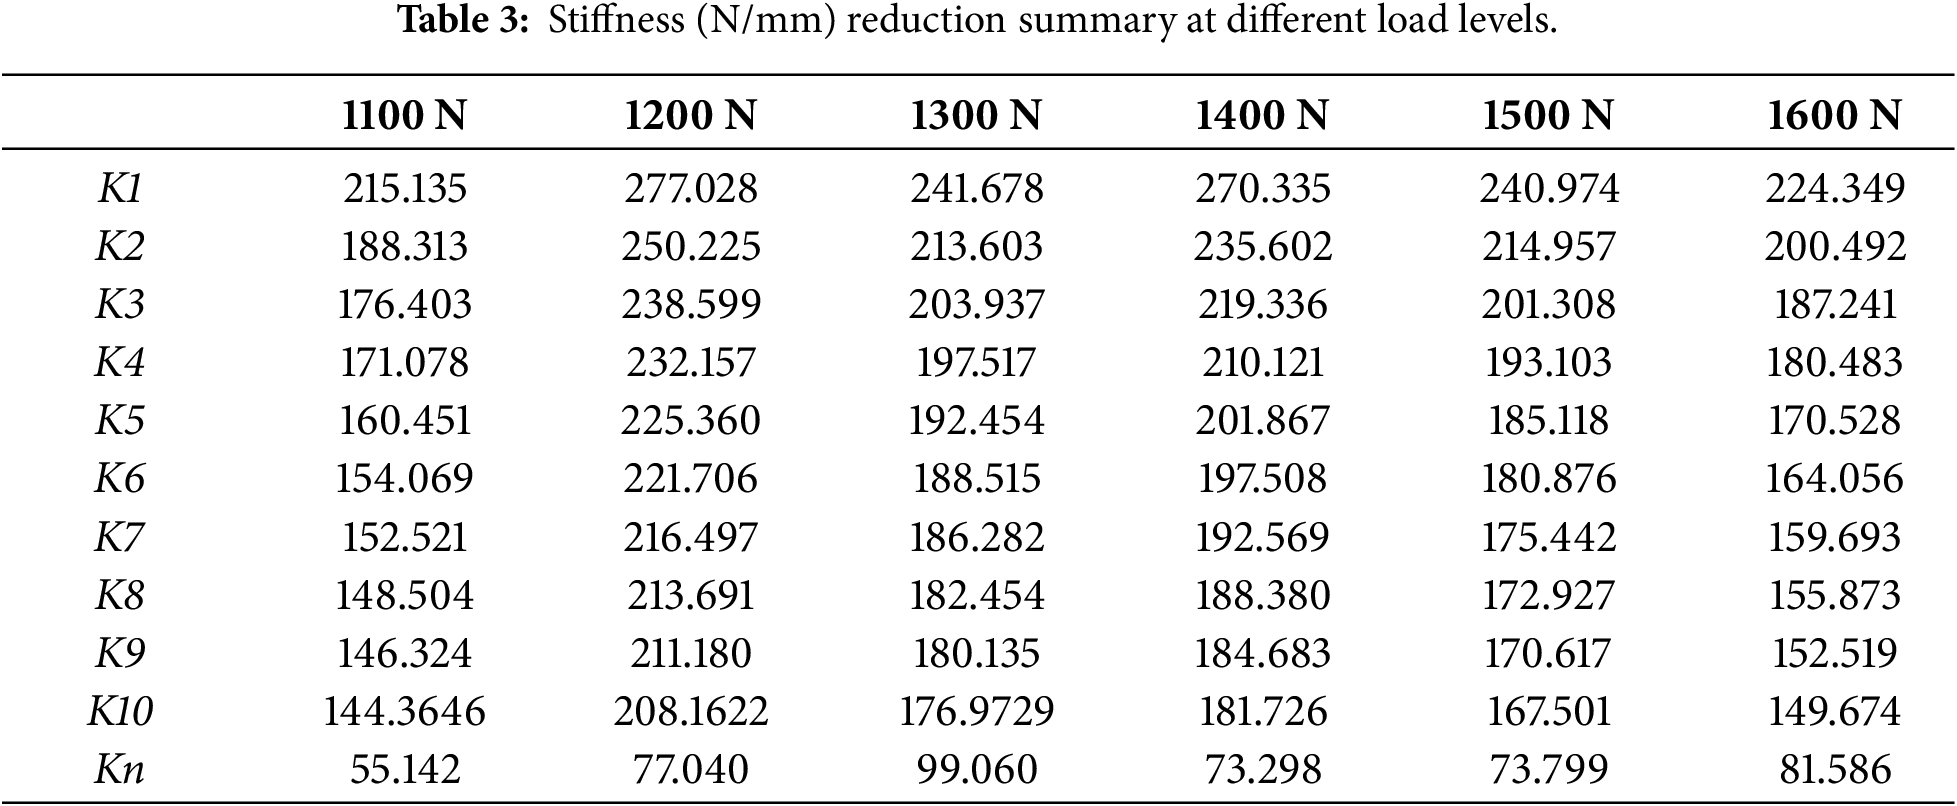
The stiffness reduction between the second and first cycles had a mean value of 26.8 N/mm. The total reduction from the first to the last cycle had a mean value of 168.26 N/mm, which corresponded to 68% of the initial stiffness value.
5 Numerical Simulation Results
Fatigue life prediction with FE was performed in two stages. In the first phase, HyperMesh was used as the preprocessor, and the finite elements were 816 CHEXA elements and 12 CPENTA first-order elements. To enhance the quality of the finite element model, 3D elements are generated from a 2D mesh. These elements are evaluated based on the defined thresholds: minimum size of 0.9, maximum size of 9.36, aspect ratio of 5, warpage of 15, skew of 40, and Jacobian of 0. All elements meet the specified criteria. The boundary conditions were modeled by using rigid elements to apply loads to the clamping area of the testing machine. Fig. 19a illustrates the boundary conditions used to model the physics of the fatigue load generated by the test machine. On one side of the model, a spatial constraint with six degrees of freedom (6DOF) is set to zero, representing a fully fixed boundary. On the opposite side, the fatigue load is applied with a load ratio (R) of 0, simulating the test conditions precisely. Meanwhile, Fig. 19b presents a wireframe view of the internal structure, highlighting how the solid elements are connected to the rigid element. This visual representation provides a clearer understanding of the model’s internal configuration and the connection integrity between different elements.
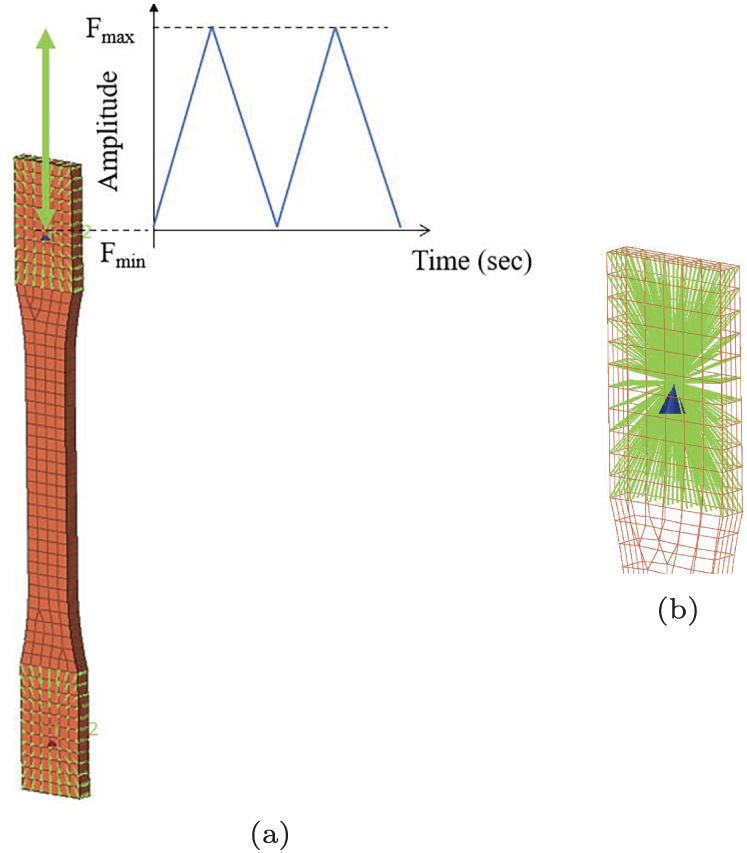
Figure 19: FE model (a) Boundary conditions and (b) rigid element connection.
The solver was OptiStruct, and the generated files were in H3D format. This result was imported into
For finite element simulation, different slopes have been reported for AM printed components. The modeling of material behavior under dynamic loads is effectively summarized by the Wöhler curve, also known as the S-N curve. This curve provides a graphical representation of the relationship between the amplitude of cyclic stresses (S) and the number of cycles to failure (N). The general depiction typically includes a slope that characterizes the material’s fatigue resistance in the high-cycle fatigue region. Additionally, there is an implication of infinite life in the very high-cycle fatigue zone, which can be adjusted to reflect the material’s specific properties and characteristics by modifying the slope.
Moreover, in the high-cycle fatigue region, the accuracy of fatigue life predictions can be enhanced by introducing multiple slopes. This adjustment is dependent on the magnitude of the applied load and the inherent characteristics of the material. According to the approach proposed by Jimenez-Martinez et al., this involves suggesting slopes that better fit the experimental data, thereby refining the representation of the material’s behavior on the S-N curve [30]. Simulation analysis was conducted under two conditions: one considering a slope of 9.54 and the other considering two slopes (15.21 [high region] and 2.5). For postprocessing, the endurance of the maximum, minimum, and central nodes (ID240) was determined (Fig. 20).
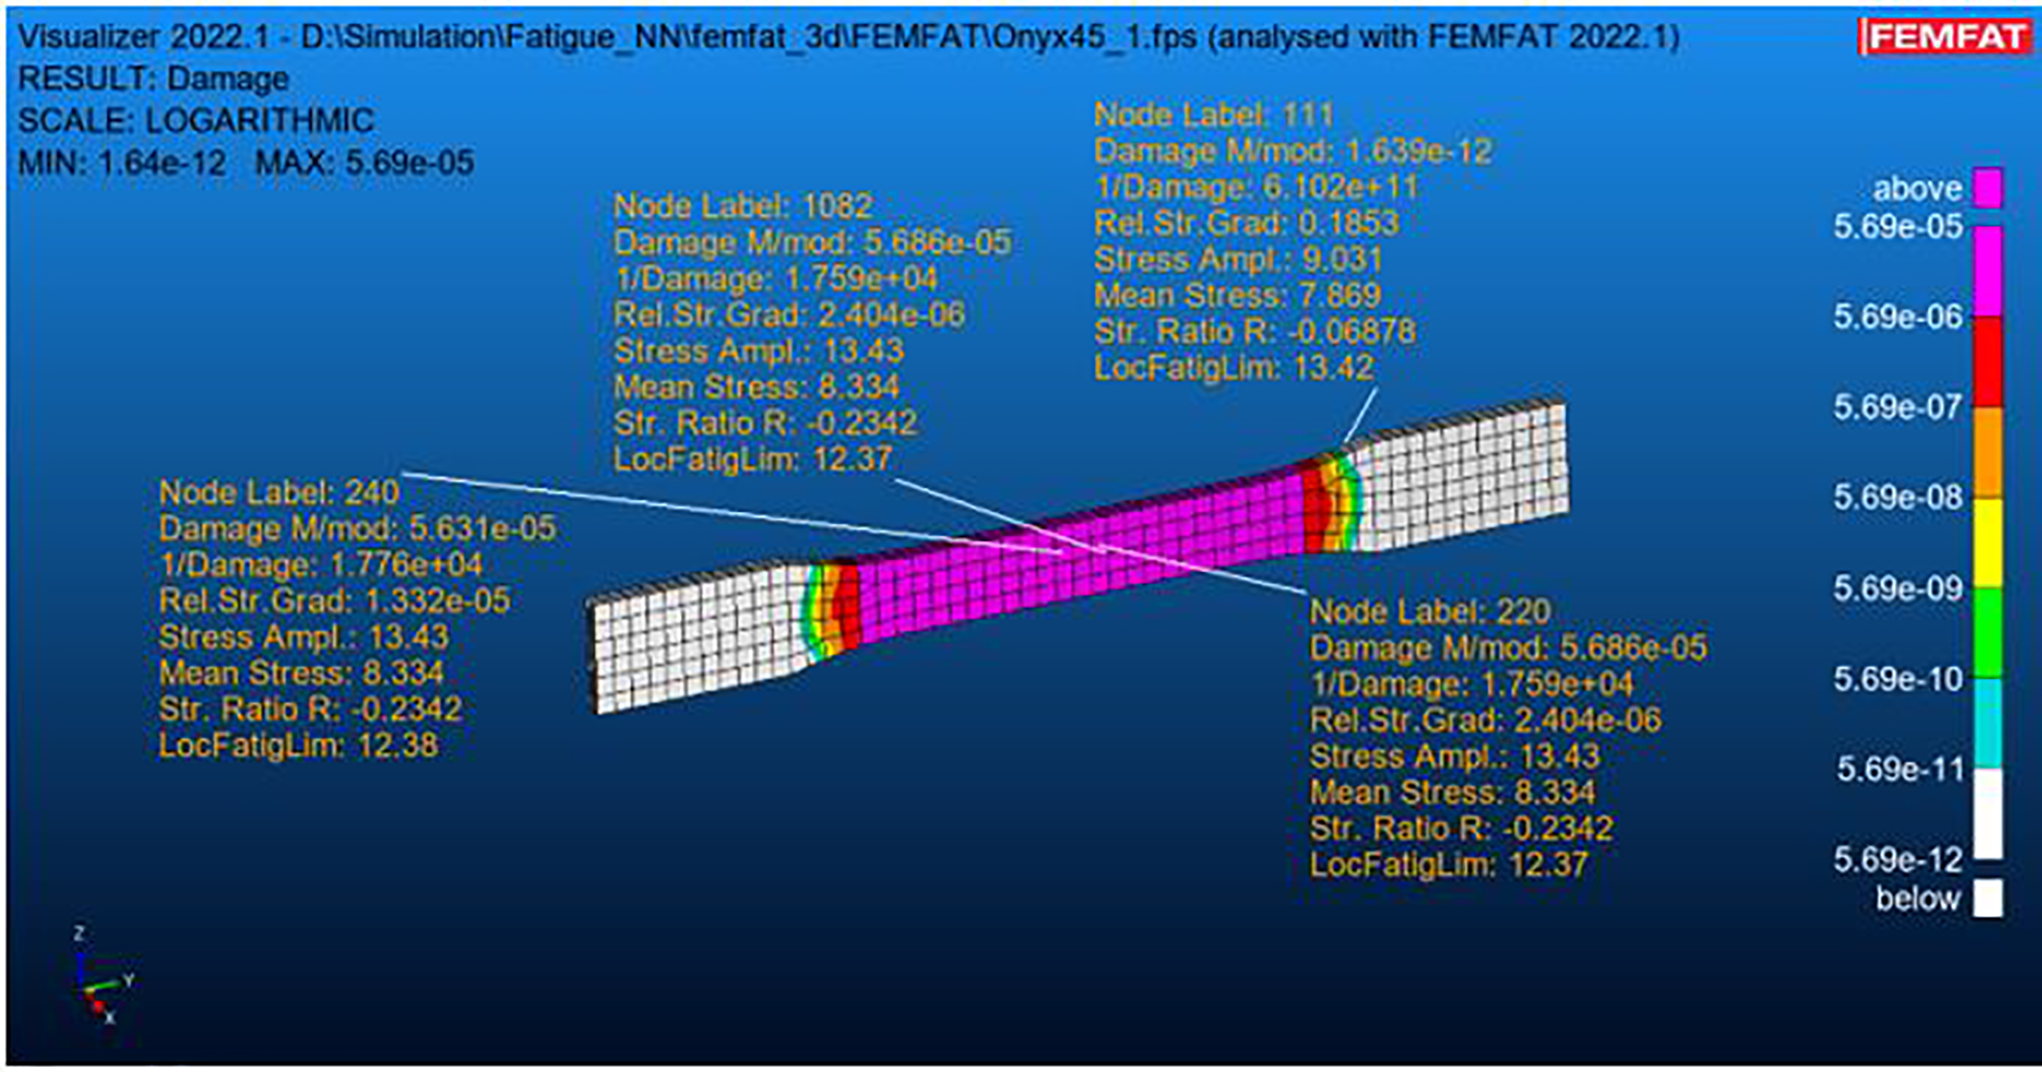
Figure 20: Fatigue life estimated with FemFat.
An NN was adopted to predict the fatigue life of printed Onyx. The inputs were
The use of artificial intelligence models is not a recent development; however, their application in predicting the mechanical fatigue behavior of printed materials remains limited. Given this limitation, enhancing the available information is crucial for accurately predicting mechanical fatigue. This research aims to address this gap by incorporating synthetic data generated from printed materials. The synthetic data is based on the relationship between the applied load and the maximum stress, linking material resistance to the level of applied load. Additionally, the damage process is considered by including the reduction in stiffness as part of the synthetic data. By doing so, this approach seeks to improve the predictive capabilities for mechanical fatigue in printed materials.
Synthetic data were incorporated to improve fatigue life prediction. Mechanical fatigue prediction is widely studied regarding conventional processes and materials such as aluminum and steel. However, the implementation of such knowledge to AM via extrusion with polymer materials remains an opportunity. The development and correlation of quasistatic and dynamic properties are required for small test sets, as any modification in printing parameters affects the mechanical properties of components. Reducing the test set will affect the design process and carbon footprint reduction. This advancement will contribute to using AM to develop structural components instead of mere prototypes.
The development of numerical models aimed at predicting mechanical fatigue due to cyclic loads is still ongoing. Neural networks alone are insufficient to fully predict and interpret the process and evolution of damage. In this context, it is essential to interpret the physical phenomena associated with the process being modeled. While synthetic data can enhance prediction accuracy, it is limited by the necessity for additional experimental tests to understand the damage process and to validate the numerical models. This reliance on experimental data ensures the reliability of the synthetic data but also means it cannot be extrapolated to different load levels or materials that have not been experimentally tested. Consequently, this underscores the importance of integrating both synthetic data and experimental validation to improve predictive models.
In this study, the uniaxial fatigue life of printed Onyx is predicted through finite element simulation and an ANN. This process required mechanical properties obtained via measurements and a generated Wöhler curve. Information from these measurements and synthetic data were then used for fatigue life prediction.
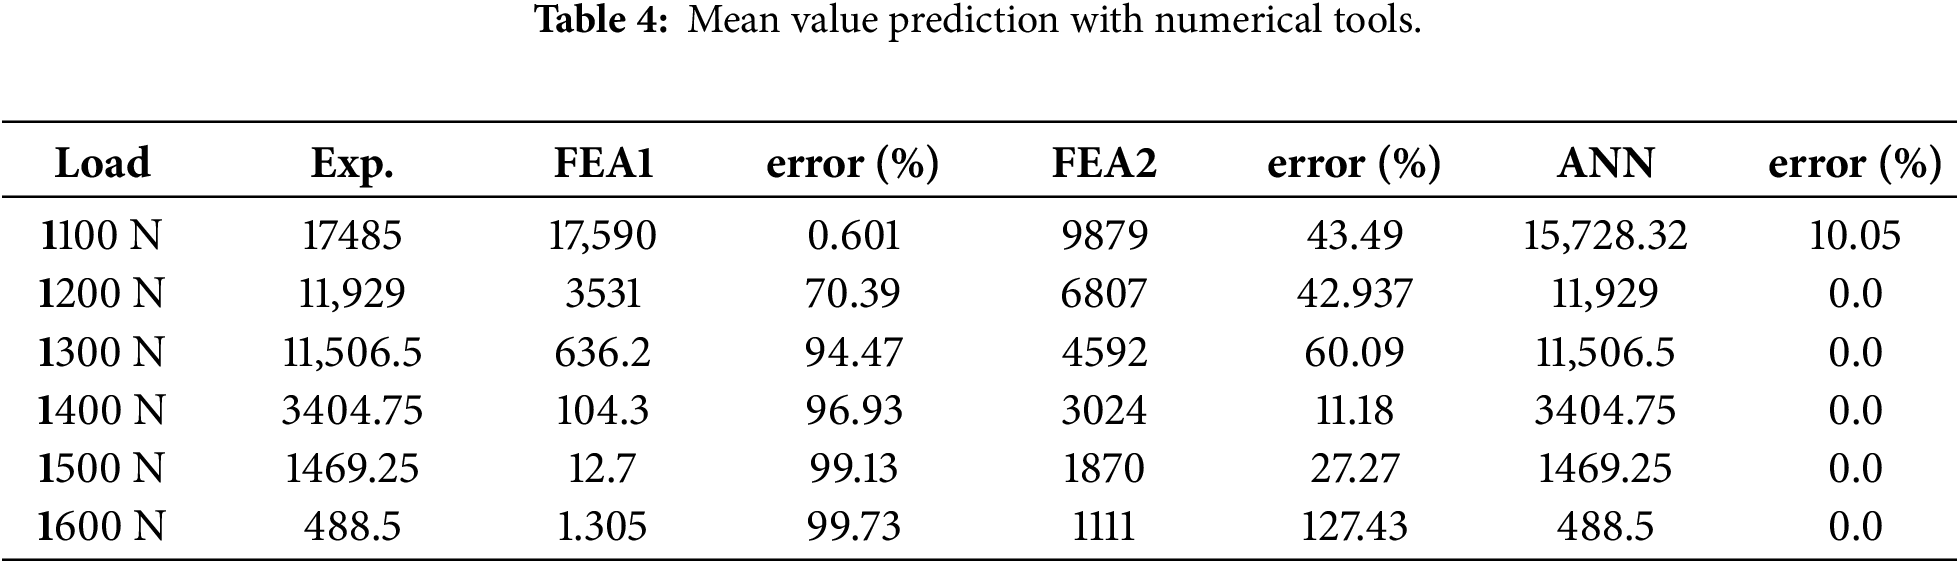
The generated curve, which was the basis for new evaluations of Onyx subjected to cyclic loads, is valid for printed components. Depending on the load range, prediction can be performed using finite element simulation considering a slope for Onyx. However, this prediction has good correlation at low amplitudes of less than 75% of the maximum load. Above this value, the error increases. In the case of approximating the Wöhler curve with two slopes, the largest error occurs at loads exceeding 90% of the maximum value.
The NN yielded the best prediction due to the use of synthetic data obtained using the tests. In other words, it included the physics of the problem through the mechanical process. In this case, the damage accumulation process from fatigue through dynamic stiffness. Generating relationships without a model is a strength of NNs, but the use of synthetic data enhances the learning, validation, and testing processes, improving the reliability of predicting the mechanical fatigue of printed Onyx.
Based on the findings of our research and the supporting evidence provided by Jimenez et al. [16], Onyx demonstrates robust industrial capabilities when subjected to dynamic loads. Specifically, its performance under cyclic loads, as evidenced in shock absorber applications, underscores its potential for practical, real-world applications where durability and resilience are critical. The material’s capacity to withstand such demanding conditions highlights its suitability for various engineering and manufacturing purposes, making it a valuable asset in industries requiring reliable and high-performance materials. These findings provide the following insights for future research. The numerical prediction of mechanical fatigue must combine fundamental aspects of damage evolution. Combining this information with finite element simulation using commercial software can improve fatigue prediction within a certain load range.
Further research is needed to enrich the limited literature on the fatigue life of printed polymers by extending and validating the findings of this study.
Acknowledgement: The authors would like to thank the Tecnologico de Monterrey for providing access to the printing and testing equipment used in the experimental work. The authors also are grateful for the support of software provider Magna (FemFat), and Altair for access to specialized software used in the industry to perform structural analysis and durability assessment.
Funding Statement: Not applicable.
Author Contributions: The authors confirm contribution to the paper as follows: Conceptualization, Moises Jimenez-Martinez; investigation, Moises Jimenez-Martinez, Gael Ramirez, Giancarlo Marchetta-Cruz, Manuel Coca-Gonzalez; writing—original draft preparation, Moises Jimenez-Martinez, Gael Ramirez, Giancarlo Marchetta-Cruz; writing—review and editing, Moises Jimenez-Martinez, Manuel Coca-Gonzalez; supervision, Moises Jimenez-Martinez. All authors reviewed and approved the final version of the manuscript.
Availability of Data and Materials: Data Available within the Article.
Ethics Approval: Not applicable.
Conflicts of Interest: The authors declare no conflicts of interest.
References
1. Liu X, Wang X-L. Natural rubber components fatigue life estimation through an extreme learning machine. Proc Inst Mech Eng Part L J Mater Des Appl. 2023;237(1):81–91. doi:10.1177/14644207221102567. [Google Scholar] [CrossRef]
2. Rabbi MF, ErtterIII J, Bakis CE. Tensile fatigue behavior of short and continuous carbon fiber reinforced additively manufactured thermoplastic multiscale composite. J Reinforc Plast Compos. 2025;44(17–18):1190–204. doi:10.1177/07316844241240223. [Google Scholar] [CrossRef]
3. Jiang A, Huo Y, Demir E, Zhou Z, Yan Z, Sun Y. Low-cycle fatigue behavior and life prediction of rolled we43-t5 magnesium alloy: experiments and crystal plasticity finite element method. Mater Today Commun. 2025;48:113440. doi:10.1016/j.mtcomm.2025.113440. [Google Scholar] [CrossRef]
4. Hriberšek M, Kulovec S, Ikram A, Kern M, Kastelic L, Pušavec F. Technological optimization and fatigue evaluation of carbon reinforced polyamide 3d printed gears. Heliyon. 2024;10(13):e34037. doi:10.1016/j.heliyon.2024.e34037. [Google Scholar] [PubMed] [CrossRef]
5. Nikiema D, Balland P, Sergent A. Study of 3d-printed onyx parts reinforced with continuous glass fibers: focus on mechanical characterization, analytical prediction and numerical simulation. J Compos Mater. 2024;58(15):1717–36. doi:10.1177/00219983241247913. [Google Scholar] [CrossRef]
6. Coca-Gonzalez M, Diaz-Montiel P, Varela J, Torres-Cedillo SG, Cortes-Perez J, Jimenez-Martinez M. Young’s modulus correction and failure mode transition in onyx-kevlar composites across fiber volume fractions and real effective area. J Mater Sci. 2025;60:17627–48. doi:10.1007/s10853-025-11485-2. [Google Scholar] [CrossRef]
7. Irsel G. Design of a precision planter chassis using computer-aided engineering and experimental validation. Proc Inst Mech Eng Part C J Mech Eng Sci. 2023;237(22):5426–42. doi:10.1177/09544062231159008. [Google Scholar] [CrossRef]
8. Yuan Z, Lu Y, Hong T, Ma H. Research on the load equivalent model of wheel loader based on pseudo-damage theory. Proc Inst Mech Eng Part C J Mech Eng Sci. 2022;236(2):1036–48. doi:10.1177/0954406220920326. [Google Scholar] [CrossRef]
9. Ning X, Zheng S, Xie W. Design principle of active load spectrum for shafting components in wheel hub reducer of electric vehicle. Proc Inst Mech Eng Part D. 2019;233(10):2546–58. doi:10.1177/0954407018800569. [Google Scholar] [CrossRef]
10. Yang L, Zeng X, Kou H, Sun R, Zhao P, Zhang X. Modeling of creep-fatigue features of hydrogen storage bed and its parameter optimizing based on finite element method and orthogonal experimental design with artificial neural networks. Int J Press Vessel Pip. 2024;208:105127. doi:10.1016/j.ijpvp.2024.105127. [Google Scholar] [CrossRef]
11. İrsel G. Experimental, analytical, and numerical investigations on the flexural and fatigue behavior of steel thin-walled x-section beam. Proc Inst Mech Eng Part C. 2022;236(22):11041–65. doi:10.1177/09544062221111053. [Google Scholar] [CrossRef]
12. Tenghiri L, Khalil Y, Abdi F, Bentamy A. Structural design and analysis of a small wind turbine blade using simple load model, fast-mlife codes, and ansys ncode designlife. Wind Eng. 2021;45(2):213–30. doi:10.1177/0309524X19882430. [Google Scholar] [CrossRef]
13. Yang D, Jin A, Li Y. A novel physics-guided neural network for predicting fatigue life of materials. Appl Sci. 2024;14(6):2502. doi:10.3390/app14062502. [Google Scholar] [CrossRef]
14. Rumor L, Andrade-Campos A. On the need for material model databases: a state-of-the-art review. Adv Mech Eng. 2022;14(10):16878132221130575. doi:10.1177/16878132221130575. [Google Scholar] [CrossRef]
15. Jimenez-Martinez M, Varela-Soriano J, Carreón JJR, Torres-Cedillo SG. Waveform load analysis for fatigue in the printed pla. Heliyon. 2023;9(8):e18480. doi:10.1016/j.heliyon.2023.e18480. [Google Scholar] [PubMed] [CrossRef]
16. Jimenez-Martinez M, Narvaez G, Diaz-Montiel P. Low cycle fatigue of thin-wall printed onyx in energy absorption. Heliyon. 2025; 11(2):e42120. [Google Scholar] [PubMed]
17. Salvati E, Tognan A, Laurenti L, Pelegatti M, De Bona F. A defect-based physics-informed machine learning framework for fatigue finite life prediction in additive manufacturing. Mater Des. 2022;222:111089. doi:10.1016/j.matdes.2022.111089. [Google Scholar] [CrossRef]
18. Liu C, Xu X, Wu J, Zhu H, Wang C. Deep transfer learning-based damage detection of composite structures by fusing monitoring data with physical mechanism. Eng Appl Artif Intell. 2023;123:106245. doi:10.1016/j.engappai.2023.106245. [Google Scholar] [CrossRef]
19. Yu J, Zhao L, Ma J, Zheng S, Yu H. Load spectrum compilation for vehicle road simulation test by applying a new time domain threshold editing method. Proc Inst Mech Eng Part D. 2024;238(1):277–90. doi:10.1177/09544070221118442. [Google Scholar] [CrossRef]
20. Kishino M, Matsumoto K, Kobayashi Y, Taguchi R, Akamatsu N, Shishido A. Fatigue life prediction of bending polymer films using random forest. Int J Fatigue. 2023;166:107230. doi:10.1016/j.ijfatigue.2022.107230. [Google Scholar] [CrossRef]
21. Zhang X-C, Gong J-G, Xuan F-Z. A deep learning based life prediction method for components under creep, fatigue and creep-fatigue conditions. Int J Fatigue. 2021;148:106236. doi:10.1016/j.ijfatigue.2021.106236. [Google Scholar] [CrossRef]
22. Zhou J, Wu Z, Liu Z, Wei H. A novel normalized fatigue progressive damage model for complete stress levels based on artificial neural network. Int J Fatigue. 2024;187:108447. doi:10.2139/ssrn.4803878. [Google Scholar] [CrossRef]
23. Halamka J, Bartošák M, Španiel M. Using hybrid physics-informed neural networks to predict lifetime under multiaxial fatigue loading. Eng Fract Mech. 2023;289:109351. doi:10.1016/j.engfracmech.2023.109351. [Google Scholar] [CrossRef]
24. Markforged Inc. Mark Two 3D Printer. Watertown, MA, USA: Markforged Inc. 2025 [cited 2025 Nov 18]. Available from: https://markforged.com/3d-printers/mark-two/. [Google Scholar]
25. ASTM D638-14. Standard test method for tensile properties of plastics. West Conshohocken, PA, USA: ASTM International; 2015. [Google Scholar]
26. Markforged Inc. Onyx filament. Watertown, MA, USA: Markforged Inc. 2025 [cited 2025 Nov 18]. Available from: https://markforged.com/materials/onyx/. [Google Scholar]
27. ASTM D7791-22. Standard test method for uniaxial fatigue properties of plastics. West Conshohocken, PA, USA: ASTM International; 2022. [Google Scholar]
28. ASTM D3479/D3479M 12. Standard test method for tension-tension fatigue of polymer matrix composite materials. West Conshohocken, PA, USA: ASTM International; 2019. [Google Scholar]
29. Jimenez-Martinez M, Alfaro-Ponce M. Fatigue damage effect approach by artificial neural network. Int J Fatigue. 2019;124:42–7. doi:10.1016/j.ijfatigue.2019.02.043. [Google Scholar] [CrossRef]
30. Jimenez-Martinez M, Varela-Soriano J, Carreon JJR, Torres-Cedillo SG. Mechanical fatigue of pla in additive manufacturing. Eng Fail Anal. 2023;149:107273. doi:10.1016/j.engfailanal.2023.107273. [Google Scholar] [CrossRef]
Cite This Article
 Copyright © 2026 The Author(s). Published by Tech Science Press.
This work is licensed under a Creative Commons Attribution 4.0 International License , which permits unrestricted use, distribution, and reproduction in any medium, provided the original work is properly cited.
 Downloads
 Citation Tools