
 Submit a Paper
 Propose a Special lssue
 Open Access
ARTICLE
Optimizing CNN Class Granularity for Power-Efficient Edge AI in Sudden Unintended Acceleration Verification
1 Elkanah Research and Development Center, Elkanah Corp, Seoul, Republic of Korea
2 Department of Computer Engineering, Jeju National University, Jeju, Republic of Korea
* Corresponding Author: Joon-Min Gil. Email:
(This article belongs to the Special Issue: Integrating Computing Technology of Cloud-Fog-Edge Environments and its Application)
Computers, Materials & Continua 2026, 87(2), 73 https://doi.org/10.32604/cmc.2026.074511
Received 13 October 2025; Accepted 15 January 2026; Issue published 12 March 2026
 View Full Text
 Download PDF
Abstract
Given the growing number of vehicle accidents caused by unintended acceleration and braking failure, verifying Sudden Unintended Acceleration (SUA) incidents has become a persistent challenge. A central issue of debate is whether such events stem from mechanical malfunctions or driver pedal misapplications. However, existing verification procedures implemented by vehicle manufacturers often involve closed tests after vehicle recalls; thus raising ongoing concerns about reliability and transparency. Consequently, there is a growing need for a user-driven framework that enables independent data acquisition and verification. Although previous studies have addressed SUA detection using deep learning, few have explored how class granularity optimization affects power efficiency and inference performance in real-time Edge AI systems. To address this problem, this work presents a cloud-assisted artificial intelligence (AI) solution for the reliable verification of SUA occurrences. The proposed system integrates multimodal sensor streams including camera-based foot images, On-Board Diagnostics II (OBD-II) signals, and six-axis measurements to determine whether the brake pedal was actually engaged at the moment of a suspected SUA. Beyond image acquisition, convolutional neural network (CNN) models perform real-time inference to classify the driver’s pedal operation states with the resulting outputs transmitted and archived in the cloud. A dedicated dataset of brake and accelerator pedal images was collected from 15 vehicles produced by 6 domestic and international manufacturers. Using this dataset, transfer learning techniques were applied to compare and analyze model performance and generalization as the CNN class granularity varied from coarse to fine levels. Furthermore, classification performance was evaluated in terms of latency and power efficiency under different class configurations. The experimental results demonstrated that the proposed solution identified the driver’s pedal behavior accurately and promptly, with the two-class model achieving the highest F1-score and accuracy among all granularity settings.Keywords
Reports of sudden unintended acceleration (SUA) incidents involving various manufacturers and vehicle models have been intermittently documented worldwide, and disputes over responsibility between driver pedal misapplication and mechanical defects remain [1,2]. Such incidents have continuously occurred in several countries including the United States, Europe, and India, resulting in prolonged debates between automobile manufacturers and consumers [3,4]. In South Korea, approximately 430 SUA-related complaints are filed annually—corresponding to an average of 1.7 cases per day—and several fatal accidents have been reported recently [5]. Large-scale recalls and legal actions regarding SUA have been concentrated in major automakers such as Toyota and Lexus since the 2000s. A joint investigation by NASA and National Highway Traffic Safety Administration (NHTSA) in 2011 cited the low likelihood of electronic control system defects [6]. However, subsequent studies have demonstrated that a simple 5-V short circuit could trigger unintended acceleration events without being detected as a fault by the Engine Control Unit (ECU) [7], and that firmware analysis revealed the possibility of throttle control task freezing due to task scheduling errors [8,9]. Furthermore, several works have identified potential Real-Time Operating System (RTOS) instabilities in the electronic throttle control system (ETCS) of multiple manufacturers, i.e., the throttle task may remain blocked and fail to release acceleration commands under certain conditions such as temperature variations, CAN bus latency, or watchdog reset failures [10].
In recent years, the issue of SUA has reemerged with the rise of electric and hybrid vehicles as well as advanced driver-assistance systems (ADAS) particularly due to possible control errors in the so-called one-pedal driving mode [11]. The causes of SUA can be broadly categorized into two groups, one of which is vehicle-related mechanical or electronic malfunction. Although SUA has been associated with faults in electronic systems, software errors, and mechanical defects, a single definitive cause has yet to be identified [12]. The second cause is driver-related pedal misapplication, primarily involving confusing the accelerator pedal with the brake pedal. This phenomenon is more likely to occur among elderly drivers whose slower reaction times under emergency conditions increase the risk of pedal misapplication accidents [13]. Moreover, the number of drivers claiming SUA after any vehicle collision has recently increased, leading to prolonged and costly investigations. As the number of SUA-related claims continues to rise, investigators frequently encounter difficulties due to the absence of video evidence at the time of the incident. To date, no court ruling in South Korea has recognized vehicle defects as the primary cause of SUA or assigned liability to the manufacturer [14].
The verification process for SUA incidents currently involves the vehicle manufacturer retrieving the vehicle and conducting internal, non-disclosed testing before notifying the owner of the results. Because these tests are performed privately, persistent concerns have been raised regarding the reliability and transparency of the collected data. The situation is further complicated by the fact that the primary data used by manufacturers to determine whether SUA occurred originate from the Event Data Recorder (EDR) [15]. Originally designed to record the deployment process and conditions of airbag systems, the EDR device is not fundamentally intended as an accident data recorder. Unlike the electronic control unit (ECU) directly governing electronic control systems, EDR cannot capture precise sensor information but passively records signals transmitted from the engine control module (ECM) instead. Consequently, numerous works have reported the inaccuracy and unreliability of data recorded by EDR systems [16,17]. Using EDR data to verify SUA incidents in conventional fuel vehicles is already problematic, but applying the same approach to electric vehicles (EVs) that employ one-pedal driving systems—where braking is rarely performed—is even less appropriate. In such cases, distinguishing regenerative braking from mechanical braking is difficult, and data interpretation can easily be distorted.
In other words, drivers may intentionally reduce the degree of pressing the accelerator pedal to decelerate; however, this behavior is often inadequately reflected in standardized EDR parameters. As a result, accident reports showing “no brake pedal input” may falsely suggest driver error. Therefore, it is essential to interpret such data in the context of EV-specific characteristics, particularly recognizing that accelerator release automatically triggers regenerative braking. These limitations have prompted recent works proposing new methods for detecting SUA events specifically tailored to electric and eco-friendly vehicles, instead of relying on traditional EDR-based verification [18]. Several commercial solutions using pedal cameras mounted near the driver’s foot to record pedal movement have recently emerged. Verification must address the following to determine liability accurately: (1) whether the brake pedal was pressed at the moment of the incident, (2) whether it was pressed with sufficient force rather than lightly, and (3) whether the accelerator pedal was pressed and whether both pedals were pressed simultaneously. However, these systems are insufficient for verifying all three major conditions required to establish reliable evidence of an SUA event. Table 1 summarizes representative studies related to SUA verification and vehicle behavior analysis to provide context for the proposed framework. While earlier works mainly focused on EDR data or single-sensor detection, recent approaches introduced AI-based recognition but still lacked multimodal integration and power-efficient Edge deployment.
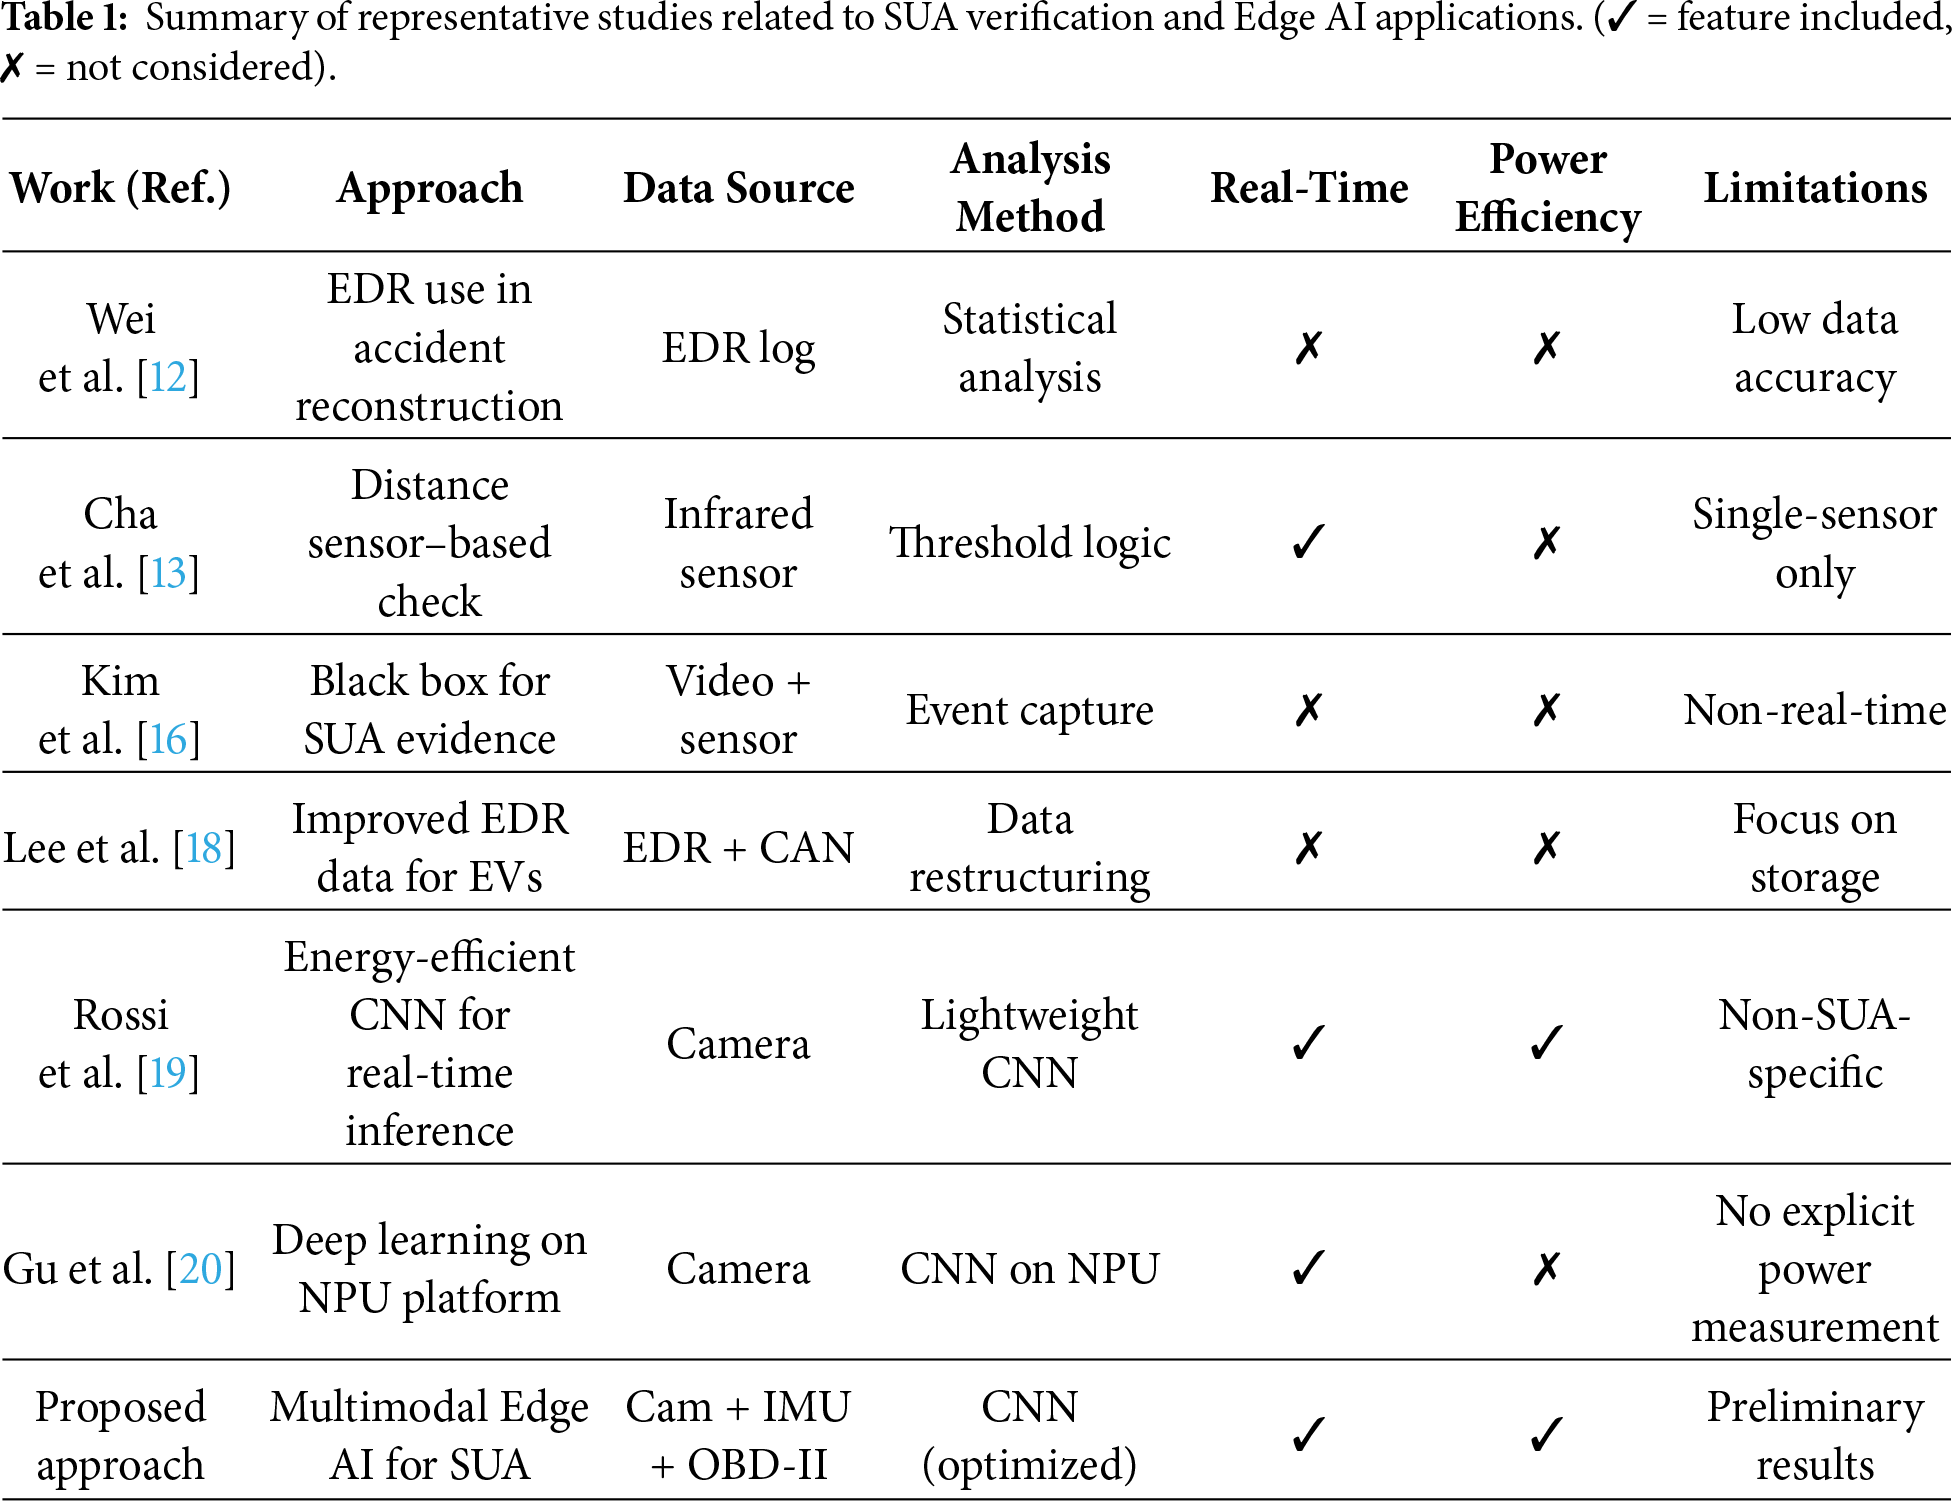
Moreover, most existing AI-based approaches still rely on single-sensor inputs or simple classification architectures; hence the difficulty in precisely distinguishing complex pedal operations and driver behaviors in real-world driving scenarios. In addition, the computational efficiency and energy consumption of AI models deployed on edge devices remain underexplored. Although several studies have attempted to detect SUA occurrences using vision- or sensor-based approaches, few have systematically investigated how CNN class granularity optimization affects inference accuracy and power efficiency in real-time Edge AI environments. To address these gaps, this work proposes a multimodal AI-based framework that enables reliable, explainable, and user-verifiable SUA analysis.
The proposed system integrates infrared (IR) cameras, six-axis inertial measurement unit (IMU), and On-Board Diagnostics II (OBD-II) interfaces installed in the vehicle to collect multimodal data for precise inference. Using convolutional neural network (CNN) models, the system performs real-time inference based on the camera data collected at the moment of the incident to classify the driver’s foot position into two situations: brake-pedal pressing and accelerator-pedal pressing. The results are stored in the cloud for further analysis.
For efficient inference performance, the CNN model’s class granularity is systematically varied from coarse to fine levels to conduct quantitative analyses of AI accuracy, model execution time, and power consumption. In addition, a six-axis inertial sensor (three-axis accelerometer and three-axis gyroscope) is mounted behind the brake pedal. The accelerometer measures the brake pedal displacement to quantify the amount of pedal depression, with the gyroscope detecting impact signatures to determine whether the pedal was physically pressed even when no braking action occurred. Finally, data collected through the OBD-II interface provide complementary information regarding accelerator pedal engagement and displacement.
The proposed framework enables clear identification of the root cause of SUA events through this work, distinguishing between system malfunctions and driver pedal misapplications. Moreover, the proposed solution enhances consumer confidence and improves the overall Quality of Experience (QoE) for drivers who are concerned about potential acceleration anomalies by offering a transparent, data-driven method for verifying suspected SUA incidents.
Meanwhile, edge AI systems have emerged in recent years as a promising solution for real-time data processing on embedded or on-vehicle devices. Edge AI performs inference locally unlike conventional cloud-based AI, minimizing network latency, reducing power consumption, and enabling instant decision making. These characteristics are particularly important for safety-critical scenarios such as vehicle SUA verification where rapid and reliable inference is required.
The main contributions of this study are summarized as follows:
(1) We propose a multimodal edge AI framework integrating IR cameras, six-axis IMU, and OBD-II signals to verify Sudden Unintended Acceleration (SUA) incidents in real time.
(2) We conduct a systematic analysis of CNN class granularity to evaluate its effect on inference accuracy, latency, and power efficiency under various class configurations.
(3) We implement and evaluate the proposed system on an edge AI platform (Jetson Orin Nano), demonstrating real-time inference capability and energy-efficient performance.
(4) We present a transparent, user-verifiable SUA verification pipeline that enables objective interpretation of driver behavior based on multimodal data fusion.
Recent years have seen a continuous increase in the number of SUA incidents reported in various countries, including Korea. When such accidents occur, the vehicle is typically retrieved by the manufacturer and tested internally in a closed environment. The driver or consumer has no access to the raw data or testing procedure, and the final judgment on whether the case qualifies as SUA is unilaterally determined by the manufacturer. Consequently, there is no transparent or objective mechanism for consumers to verify the authenticity of the manufacturer’s conclusion or to prove their own innocence in disputed cases. Recent investigations by NHTSA and NASA have found that most SUA cases are attributed to driver input misinterpretation or system-level ambiguity—not necessarily software defects—but also acknowledge the lack of transparent verification processes available to consumers [21].
2.1 Limitations of Current Verification Methods
The current verification process relies heavily on the Event Data Recorder (EDR), a module originally designed to record airbag-deployment events rather than comprehensive driving dynamics. However, EDR suffers from low data resolution in both temporal and physical aspects. Its sampling frequency is typically limited to 1 Hz or less, which means that short and transient pedal actions occurring within a few hundred milliseconds cannot be captured. Furthermore, it stores only discrete or binary signals such as brake-switch ON/OFF or simplified throttle-position values derived from the Engine Control Module (ECM). As a result, fine-grained variations in pedal displacement, pressure intensity, or acceleration patterns are not recorded, leading to incomplete or misleading interpretations of accident causes. Prior studies have also emphasized that the low sampling rate and non-standardized structure of EDR data make it unsuitable for detailed behavioral reconstruction in crash analysis [22].
2.2 Need for an Edge AI-Based Verification Framework
Addressing these limitations increasingly requires an Edge AI-based consumer verification framework that can independently record and analyze vehicle behavior at the source. By integrating sensors and pedal-view cameras on an embedded platform such as the NVIDIA Jetson Orin Nano, pedal operations can be continuously monitored and classified in real time. The proposed approach enables reliable inference within 100 ms latency and ensures data integrity through secure cloud synchronization. This architecture allows independent, objective, and tamper-resistant verification of driver inputs during SUA events. Recent research has demonstrated that embedded AI systems can achieve sub-100 ms latency for real-time vehicle-state inference using lightweight CNNs on Jetson-class edge devices; thus validating the feasibility of this approach [19].
2.3 Research Motivation and Goals
Ultimately, this study is aimed at establishing a technical foundation for consumer-oriented SUA verification by optimizing CNN class granularity on an edge-level AI system. Through comprehensive analysis of performance metrics including loss, accuracy, F1-score, latency, and power efficiency, the proposed method seeks to overcome the inherent limitations of EDR-centric analysis and provide an objective, transparent, legally defensible verification mechanism for future SUA investigations. Recent studies have explored the optimization of CNN class granularity to balance model interpretability and computational cost in edge-based safety systems, highlighting the potential of adaptive class design in real-time applications [20].
This section describes in detail the proposed solution for verifying SUA incidents in vehicles. Fig. 1 illustrates the overall conceptual architecture of the developed system. The proposed framework integrates multiple sensing devices including an IR camera, an OBD-II scanner, and a six-axis IMU consisting of an accelerometer and a gyroscope. Data acquired from these sensors are synchronized with a cloud server, allowing clear identification of the driver’s foot position and pedal operation during the suspected SUA event. Furthermore, a CNN-based image recognition module is implemented to perform real-time classification of pedal use, specifically whether the driver is pressing the brake or the accelerator pedal. The inference results are immediately stored in the cloud to ensure transparency and traceability. The system also includes an edge-level processing unit (on-vehicle edge server) that manages the integration of all three sensing components, enabling low-latency data fusion and on-device inference.
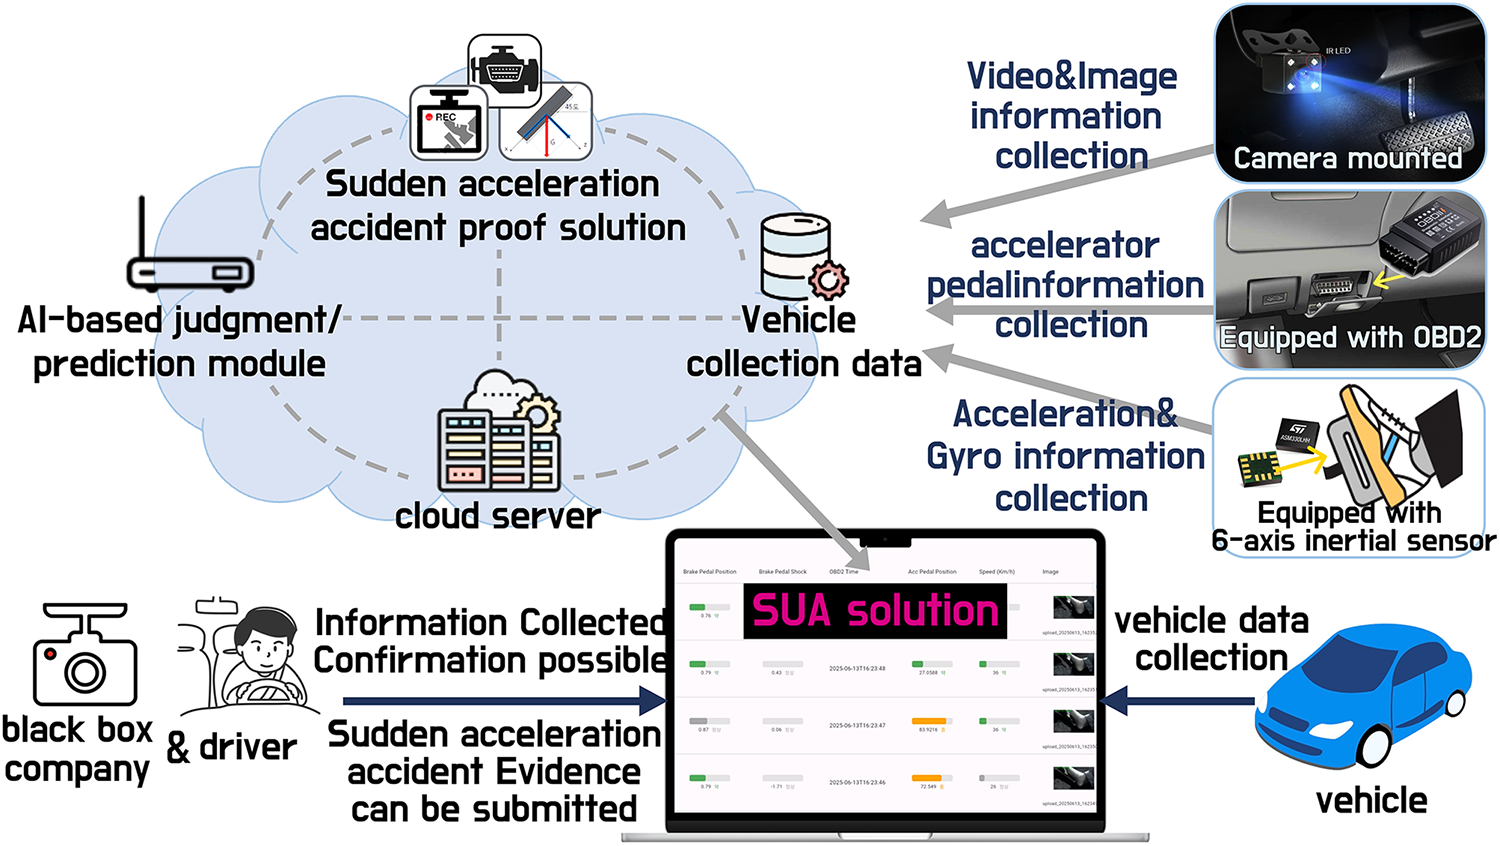
Figure 1: Conceptual diagram of the proposed SUA verification system.
The following are the roles of the edge server and the sensing devices used in the proposed solution.
• Edge Server: Serving as the core processing unit, the edge server employs an NVIDIA Jetson Orin Nano 8 GB device. It is connected to the three sensor modules, performing real-time inference while all collected data are locally stored. To ensure data integrity, one image is uploaded to the cloud server per second. Section 4.1 summarizes the detailed specifications of the edge hardware and sensors used in the experiments.
• IR Camera: Installed near the driver’s footwell, the infrared (IR) camera records which pedal is pressed by the driver during the suspected SUA event. It also determines which pedal is being operated at that moment based on real-time inference.
• OBD-II Scanner: The OBD-II scanner measures the operation and displacement of the accelerator pedal during an SUA event. This enables the system to determine whether the driver pressed the accelerator pedal or simultaneously engaged both accelerator and brake pedals.
• Six-Axis Inertial Sensor (IMU): Mounted behind the brake pedal, the IMU measures pedal displacement and shock intensity to quantify the degree of brake engagement. This allows the system to identify clearly the driver’s braking intent even during transient moments of pedal unresponsiveness caused by SUA events.
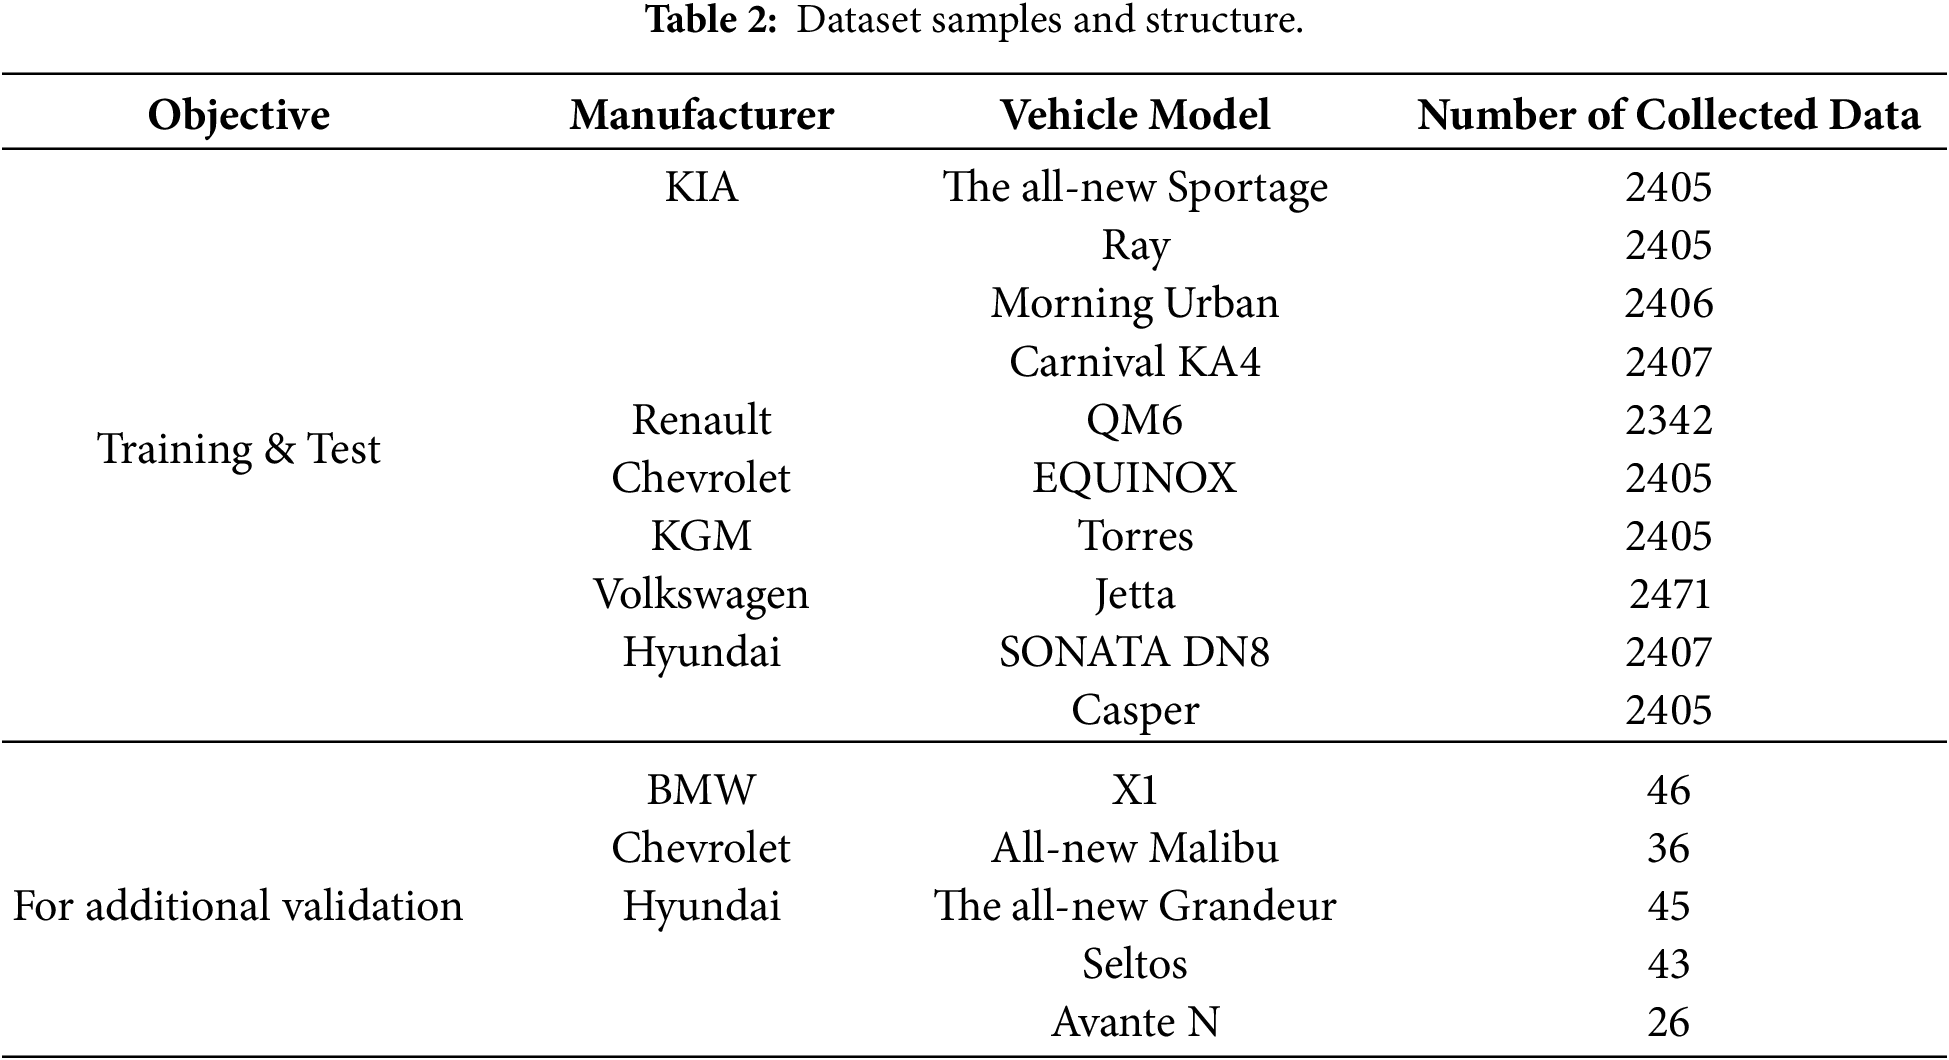
The collected dataset consists of a total of 24,743 images, with overall size of approximately 69 GB. Table 2 presents the dataset samples and structure including representative vehicle models and number of collected images. Pedal images were collected from 15 vehicle models produced by 6 different manufacturers for training and testing, with additional data included for extended validation. The dataset was divided into training and testing sets at a ratio of 80:20.
For data labeling, the Ground Truth function of AWS SageMaker was utilized to perform the annotation process [23]. The dataset was classified into four classes (4-class configuration) based on the driver’s pedal operation status: no pedal operation, slight brake operation, full brake operation, and accelerator operation. This classification scheme enables the model to distinguish between normal and abnormal pedal operations during driving. In addition, the sensing data collected from the OBD-II and six-axis inertial sensors were not subjected to missing-value imputation since abnormal or missing readings in these sensors may indicate critical events rather than noise. Fig. 2 illustrates the overall conceptual architecture of the developed system.
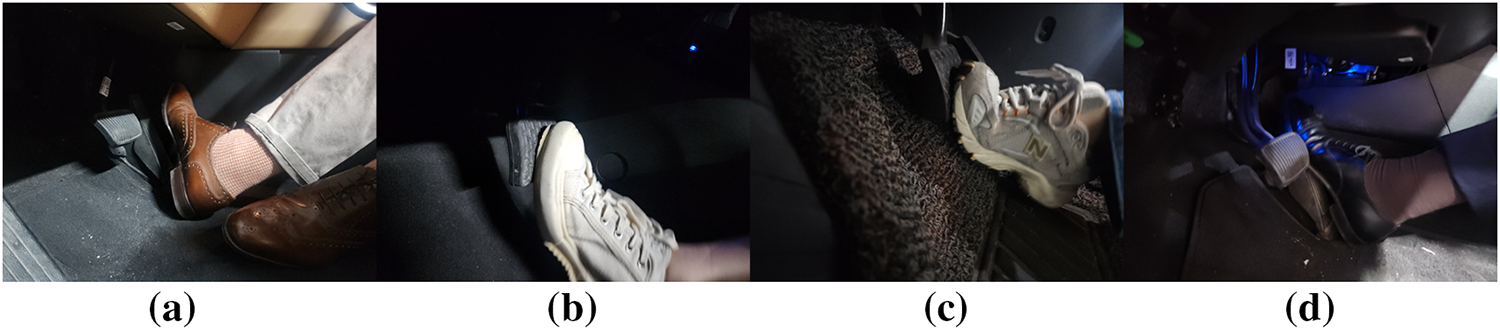
Figure 2: Data collected from the camera for 4 pedal operation classes: (a) No pedal operation; (b) Slight brake pedal operation; (c) Full brake pedal operation; (d) Accelerator pedal operation.
3.4 Application of Transfer Learning
Transfer learning leverages the knowledge acquired from a pre-trained model to enhance performance on a new task even with limited available data. Therefore, applying transfer learning to the AI-based processing of vehicle pedal black-box images makes for an effective, efficient approach. Since the pedal black-box image data are collected under diverse driving environments and conditions, training a model from scratch for every situation would be time-consuming and computationally inefficient. For example, an image-recognition model pre-trained on large-scale datasets such as ImageNet can be used to perform fine-tuning on specific pedal operation scenarios such as brake engagement or accelerator activation. The model can achieve high performance with significantly less training data by adapting the pre-trained weights to the newly collected dataset. In this work, transfer learning was implemented using PyTorch with several pre-trained CNN architectures including VGG, ResNet, EfficientNet, Inception, DenseNet, and MobileNet. The pedal black-box image dataset consists of images captured from various angles and under different environmental conditions reflecting diverse driving situations. Sensor data corresponding to brake and accelerator operations were also included. No additional lighting or region-of-interest constraints were applied to recreate realistic driving conditions.
3.5 Proposed Technical Components of the Solution
This section describes the technical components of the proposed solution in detail.
3.5.1 CNN-Based Class Granularity Design
We conducted experiments using a CNN model to analyze how class granularity affects overall inference performance. During the experiments, the number of output classes was dynamically adjusted among 4, 3, and 2 configurations according to the observed performance variations in order to identify the optimal class configuration for the proposed solution. The CNN class mapping function is defined as:
where
In this work, fine granularity refers to the use of a larger number of classes (e.g., 4-class configuration) capturing subtle variations in pedal behavior, whereas coarse granularity corresponds to a reduced number of classes (e.g., 2-class configuration) focusing on broader operational distinctions. By varying this granularity, the system can balance between interpretability, computational efficiency, and generalization performance. A comparative analysis was conducted by iteratively modifying the class configuration and evaluating its impact on loss, accuracy, F1-score, latency, and power consumption.
The detailed class configurations are summarized as follows:
• 4-class: no pedal operation, slight brake operation, full brake operation, and accelerator operation
• 3-class: no pedal operation, brake operation, and accelerator operation
• 2-class: brake operation and accelerator operation
3.5.2 Probability-Based Assessment of Driver Misapplication
In cases of suspected SUA events, the proposed system analyzes multimodal sensor data to determine whether the incident was caused by driver misapplication or non-driver-related factors. To achieve this, a conditional joint probability model representing the dependency structure among behavioral and sensor variables is constructed as expressed in Eq. (2):
where each variable represents a distinct behavioral/sensor-based feature:
•
•
•
•
•
•
•
• (Optional)
Class label
The complete evidential feature set is represented in Eq. (3):
The decision rule is then derived from the conditional posterior probability as shown in Eq. (4):
Finally, if the computed posterior probability exceeds predefined threshold
where
Prior to the performance evaluation, six pre-trained CNN models were initially employed for transfer learning to compare their performance. Models exhibiting relatively low accuracy or instability during fine-tuning were excluded in subsequent evaluations as the class granularity was adjusted.
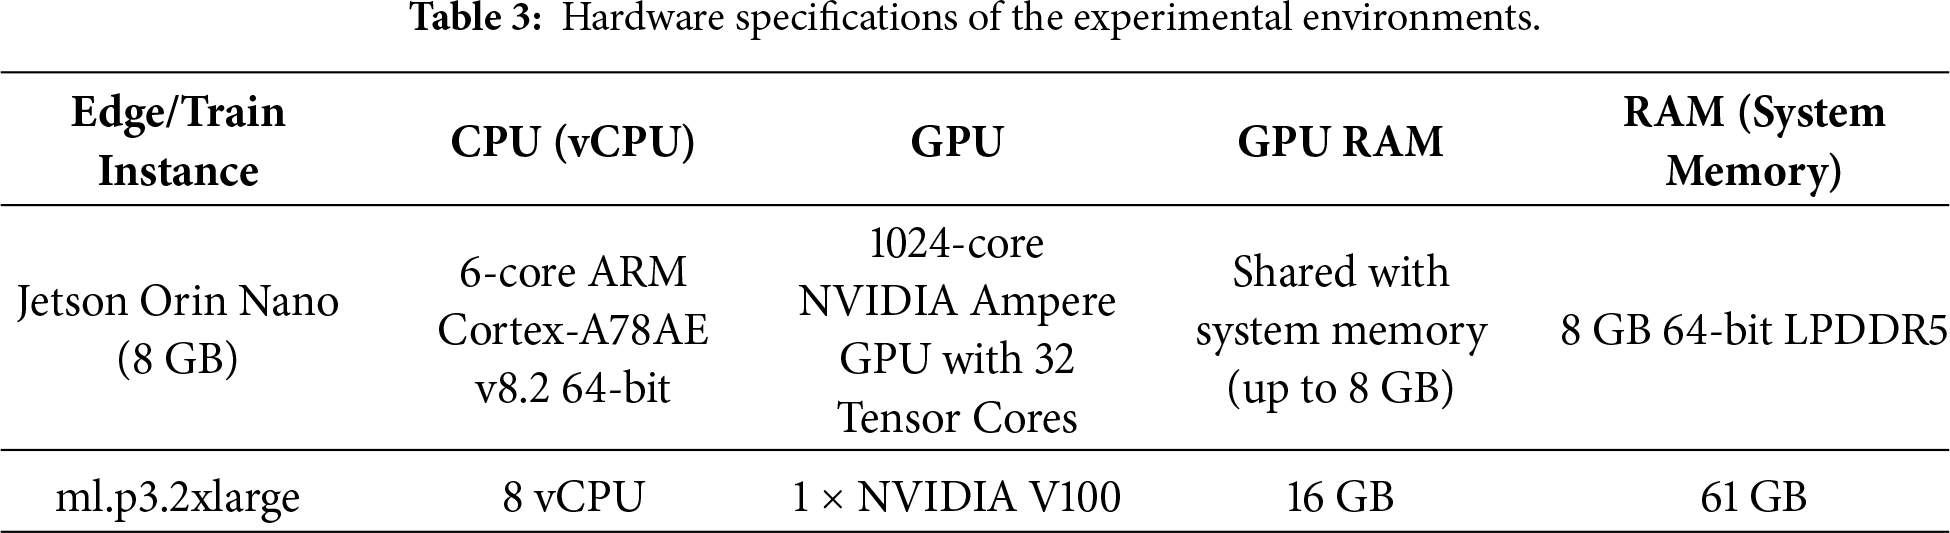
The experimental setup was implemented on an NVIDIA Jetson Orin Nano 8 GB device, which performs on-device inference in real time. The edge system was connected to three sensing modules—an infrared (IR) camera, an OBD-II scanner, and a 6-axis inertial sensor—enabling multimodal data acquisition and processing. Detailed hardware and software specifications are summarized in the tables below.
4.1.1 Hardware and Software Configurations
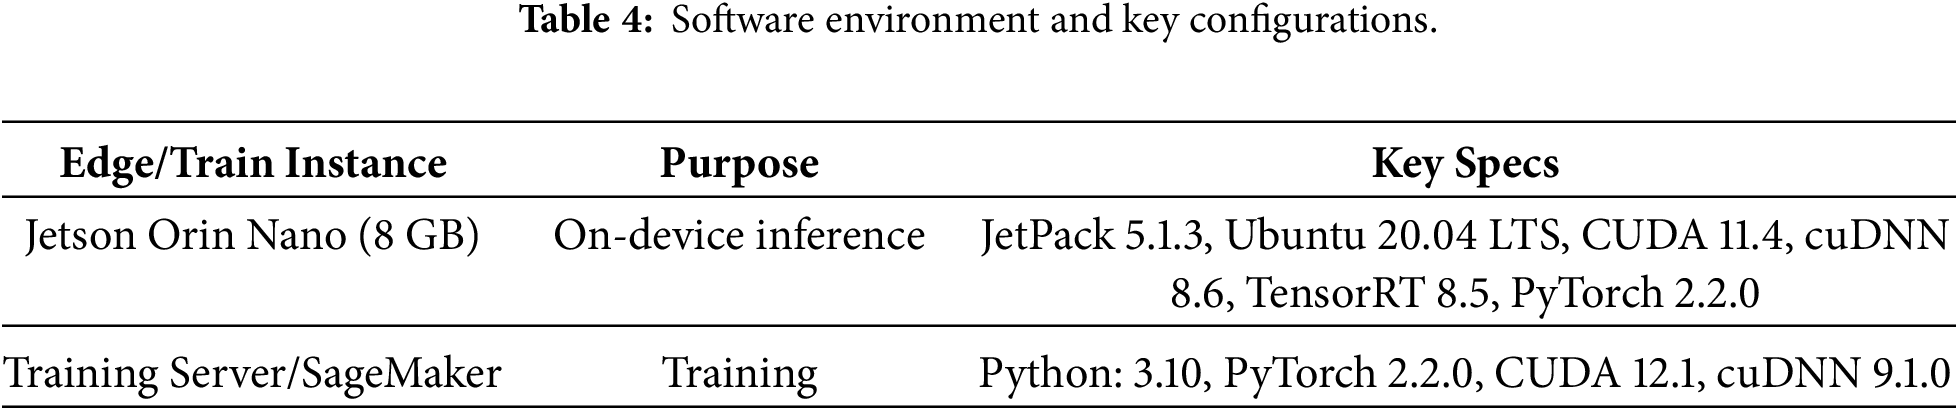
The in-vehicle inference tasks were executed on an NVIDIA Jetson Orin Nano development board, which also handled auxiliary computation and data processing on the edge. All deep learning training processes were performed on an AWS SageMaker instance. Table 3 describes the detailed hardware specifications of each environment, and Table 4 summarizes the corresponding software stacks and libraries.
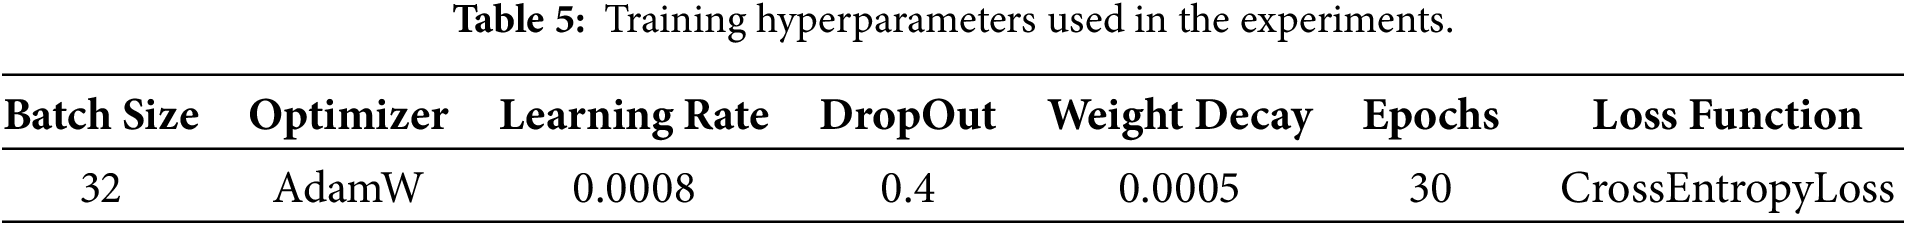
The training hyperparameters were configured as shown in Table 5. The dataset was split into 80% training and 20% validation subsets. CrossEntropyLoss was employed as the loss function during model configuration; therefore, the final Softmax activation was omitted. The AdamW optimizer was adopted, with the momentum term excluded. Since CrossEntropyLoss implicitly applies the Softmax operation, the model outputs logits during the training process. Finally, predictions were obtained during inference by applying the argmax operation to the logits.
The performance of the CNN models was evaluated using multiple metrics. For quantitative performance evaluation across different levels of CNN granularity, loss, accuracy, and F1-score were employed as key metrics. Furthermore, latency (ms/frame) was measured to verify real-time responsiveness on embedded edge devices, with power efficiency (FPS/W) analyzed to identify energy-efficient models at the system level. The primary evaluation metrics used in this study include loss, accuracy, F1-score, latency, and power efficiency, mathematically defined in Eqs. (6) and (7). Furthermore, precision and recall were used to interpret the classification balance between positive and negative samples and conceptually incorporated into the computation of F1-score. loss represents the difference between the model’s predicted output and the actual ground-truth value.
(6) latency measures the average processing time per frame in milliseconds.
(7) power efficiency expresses computational efficiency in terms of processed frames per watt.
4.3 Quantitative Performance Evaluation of CNN Granularity
Quantitative experiments were conducted to compare CNN performance across different class granularities (2-, 3-, and 4-class configurations). Each configuration was trained under identical hyperparameters and dataset conditions to ensure fair evaluation. Table 6 presents the quantitative performance results of the 4-class model.
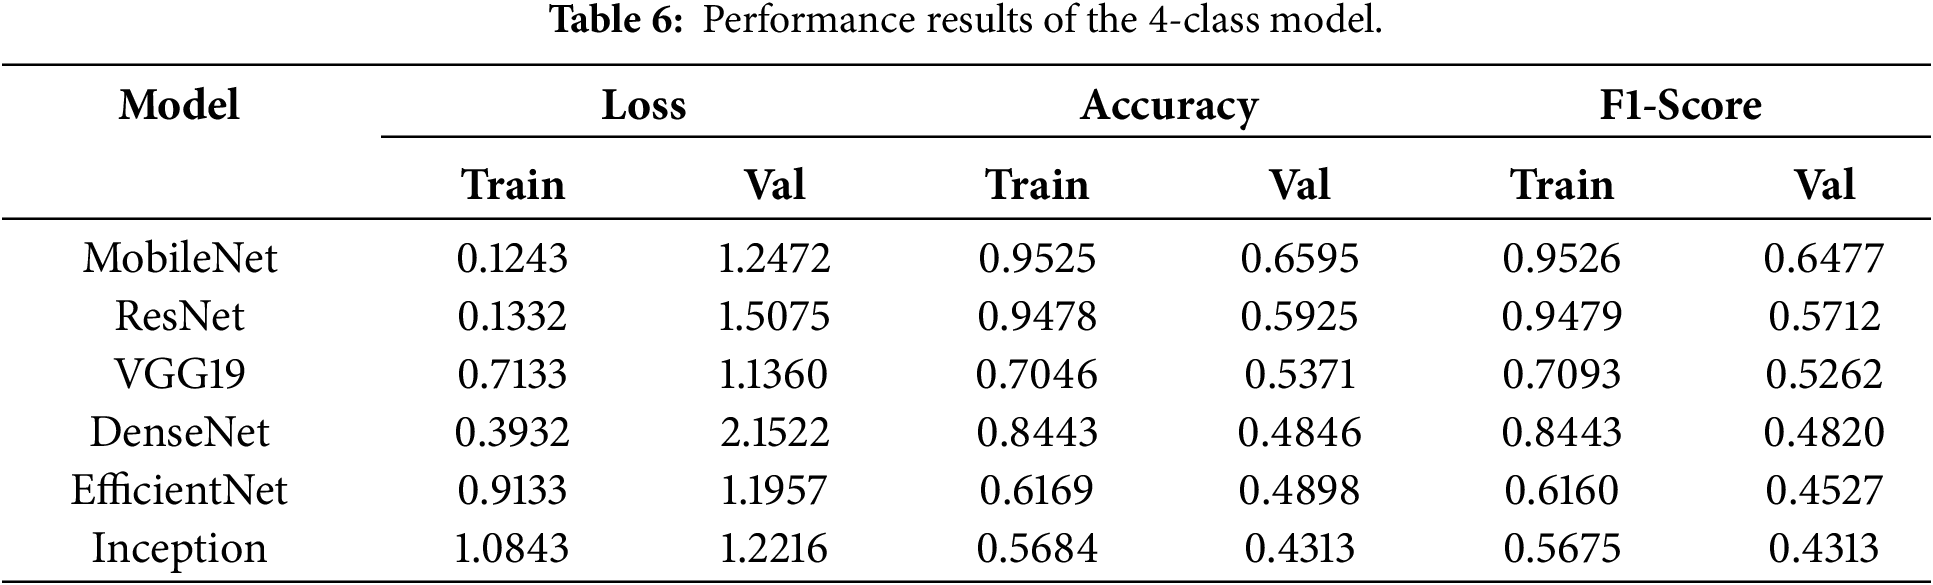
A noticeable tendency toward overfitting was observed across all six transfer learning architectures as the validation accuracy significantly declined relative to the training results. Such degradation can be attributed to the limited dataset size and increased model complexity introduced by finer class granularity. When pedal use is subdivided into four levels such as slight brake operation vs. full brake operation, the inter-class similarity becomes high; thus leading to ambiguous cases that are difficult to distinguish even for humans. Under such conditions, class boundaries become indistinct, decision boundary learning is hindered, and CNN’s discriminative capability becomes inherently constrained. As a lightweight network, MobileNet fits the training data almost perfectly and converges rapidly even with small datasets but exhibits a clear limitation in validation performance. ResNet maintains overall stable behavior thanks to its residual skip connections, but tends to achieve slightly lower validation accuracy than MobileNet. With its deep and heavy architecture, VGG19 shows signs of underfitting in this setting; despite performing well on larger datasets and longer epochs, its effectiveness here is limited. DenseNet demonstrates adequate training performance but experiences a significant drop during validation, suggesting that its dense connectivity and large number of parameters may lead to excessive model complexity and hinder generalization on small datasets. EfficientNet also exhibits mild underfitting; despite its efficient compound scaling design, it requires a minimum data scale to realize its full potential. Finally, Inception recorded the lowest performance among the six transfer learning models and—in some cases—even underperformed in terms of the baseline CNN without transfer learning. Overall, excessively fine class granularity was found to increase inter-class similarity and degrade model performance across all six architectures.
Table 7 presents the results obtained from training with the 2-class configuration. In this experiment, MobileNet—which showed the best performance in the 4-class configuration—and VGG19, which demonstrated moderate performance, were selected and trained for 30 epochs using the same protocol.
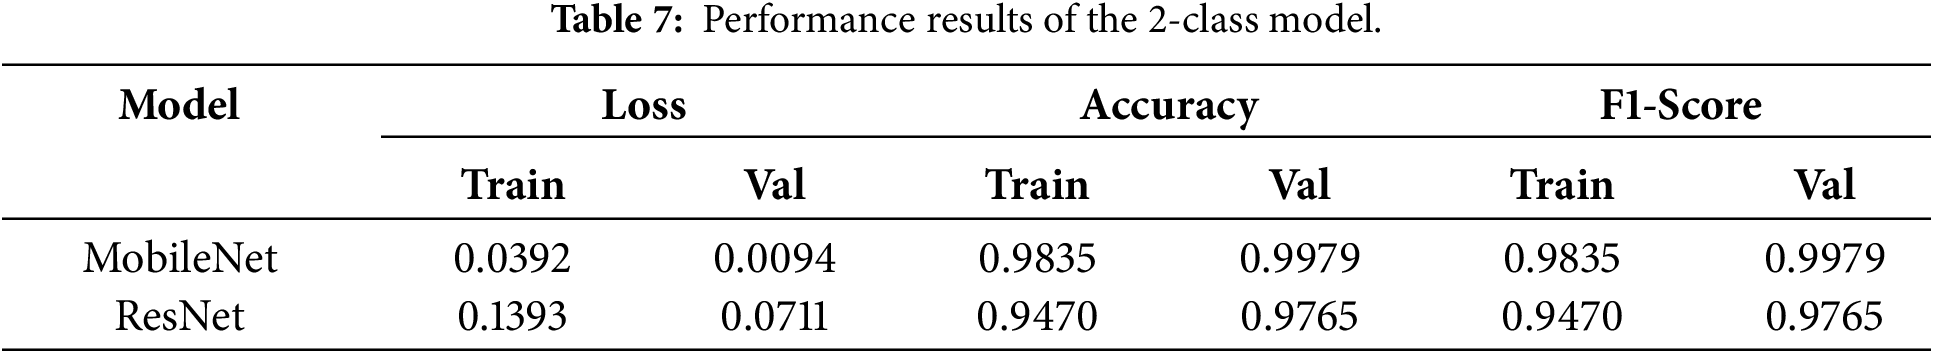
Compared with the 4-class configuration, the overall performance improved when using the 2-class setup. For MobileNet, both training and validation losses were remarkably low, convergence was stable, and almost no signs of overfitting were observed. The small gap between training and validation metrics in both models indicates strong generalization capability. Compared to VGG19, MobileNet achieved lower loss and higher accuracy and F1-score. Interestingly, instances wherein the validation performance exceeded the training performance were observed. This phenomenon may occur because regularization techniques applied during training (e.g., dropout and weight decay) intentionally constrain model capacity, but such constraints are disabled during validation. It may also be attributed to the slightly easier validation dataset than the training set or from distributional differences introduced by the train–validation split. Therefore, these results can be interpreted as a reflection of the regularization effects and dataset characteristics rather than overfitting. Table 8 presents the results obtained from training with the 3-class configuration.
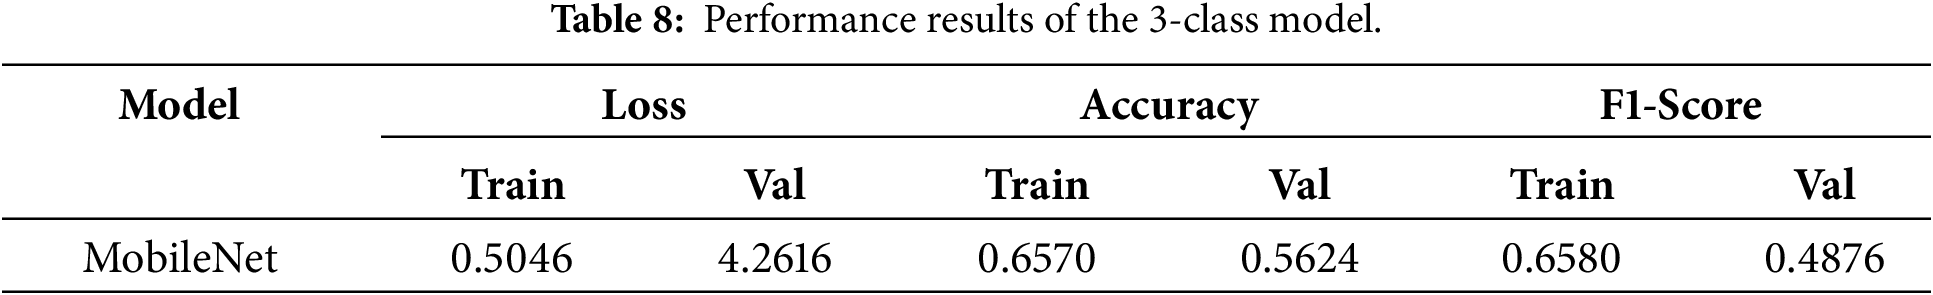
In this experiment, only MobileNet was trained as it exhibited the strongest performance in both 2-class and 4-class settings. While the 2-class configuration achieved excellent performance and the 4-class setup showed relatively stable results, the performance dropped significantly in the 3-class configuration. Clear decision boundaries can be established in the 2-class setup through binary separation, with each class remaining relatively well-defined in the 4-class configuration. When the classes are reduced to three, however, the definition of the intermediate class becomes ambiguous; thus resulting in unclear class boundaries and diminished discriminative capability. Hierarchical restructuring may also exacerbate data imbalance, leading to prediction bias toward majority classes and degraded performance for minority classes. These findings suggest that the 3-class configuration adversely affects model performance, and that careful class definition and data balance adjustment will be critical factors for future real-world vehicle field experiments. As a result, the 2-class model recorded the highest F1-score and the lowest loss, demonstrating better generalization and inference stability compared to other configurations.
4.4 Real-Time Inference Performance
Real-time inference performance was measured on the Jetson Orin Nano by evaluating frame-wise latency and throughput (FPS). To evaluate the real-time performance of the proposed CNN class models, inference latency was analyzed for each processing stage. A custom measurement script was implemented to record the elapsed time of every frame in milliseconds (ms) during TensorRT-based inference. infer_ms represents the pure GPU inference time (ms) in this experiment, measured as the duration between the start and end of CUDA events. This value corresponds to the actual execution time of TensorRT on the GPU, i.e., kernel execution time. post_ms denotes the time required to obtain the class index from the output tensor using argmax, whereas total_ms indicates the overall pipeline time required to process a single frame from image capture through preprocessing, inference, and postprocessing. Since latency is measured in milliseconds, FPS is calculated by dividing 1000 by total_ms, indicating the number of frames processed per second. Fig. 3 summarizes the average inference latency of these metrics for each class configuration.
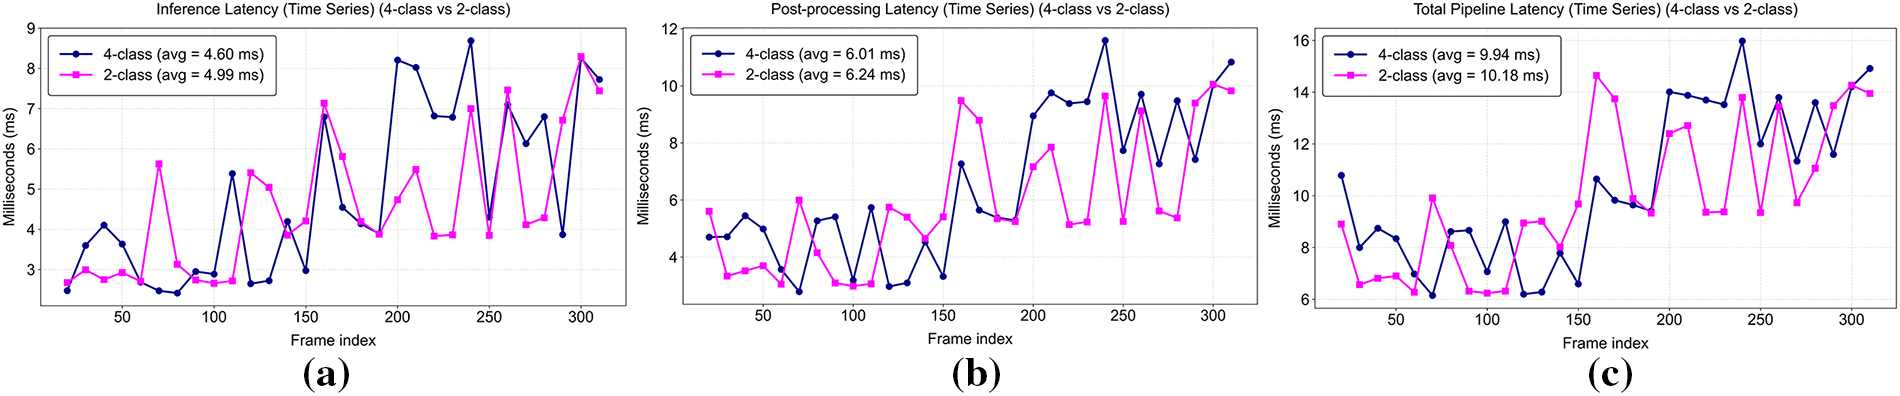
Figure 3: Frame-wise latency comparison between the 2-class and 4-class CNN models: (a) Inference latency (Time Series) showing the GPU computation delay per frame; (b) Post-processing latency (Time Series) representing the time required to obtain the class index from the output tensor; (c) Total pipeline latency (Time Series) including image acquisition, preprocessing, inference, and postprocessing stages.
The 2-class configuration achieved average total latency of 10.21 ms or approximately 12.4% lower than that of the 4-class configuration (11.65 ms), demonstrating superior end-to-end pipeline efficiency. infer_ms of the 2-class model was 8.91 ms or shorter than that of the 4-class model (10.26 ms), suggesting lower computational complexity. The difference between the two models was negligible in the case of post_ms, implying that post-processing contributed minimally to the overall latency. Consequently, the 2-class model achieved 98.0 FPS, outperforming the 4-class model (85.8 FPS) and confirming its superior real-time performance. These results confirm that reduced class granularity enhances computational efficiency for real-time applications.
However, a frame-wise comparison between the two models highlights the need to consider the frequency at which each model achieves faster processing as this factor may influence the overall interpretation of performance. Fig. 4 illustrates the frame-wise total latency differences between the 2-class and 4-class models, showing which model processed each frame more quickly.
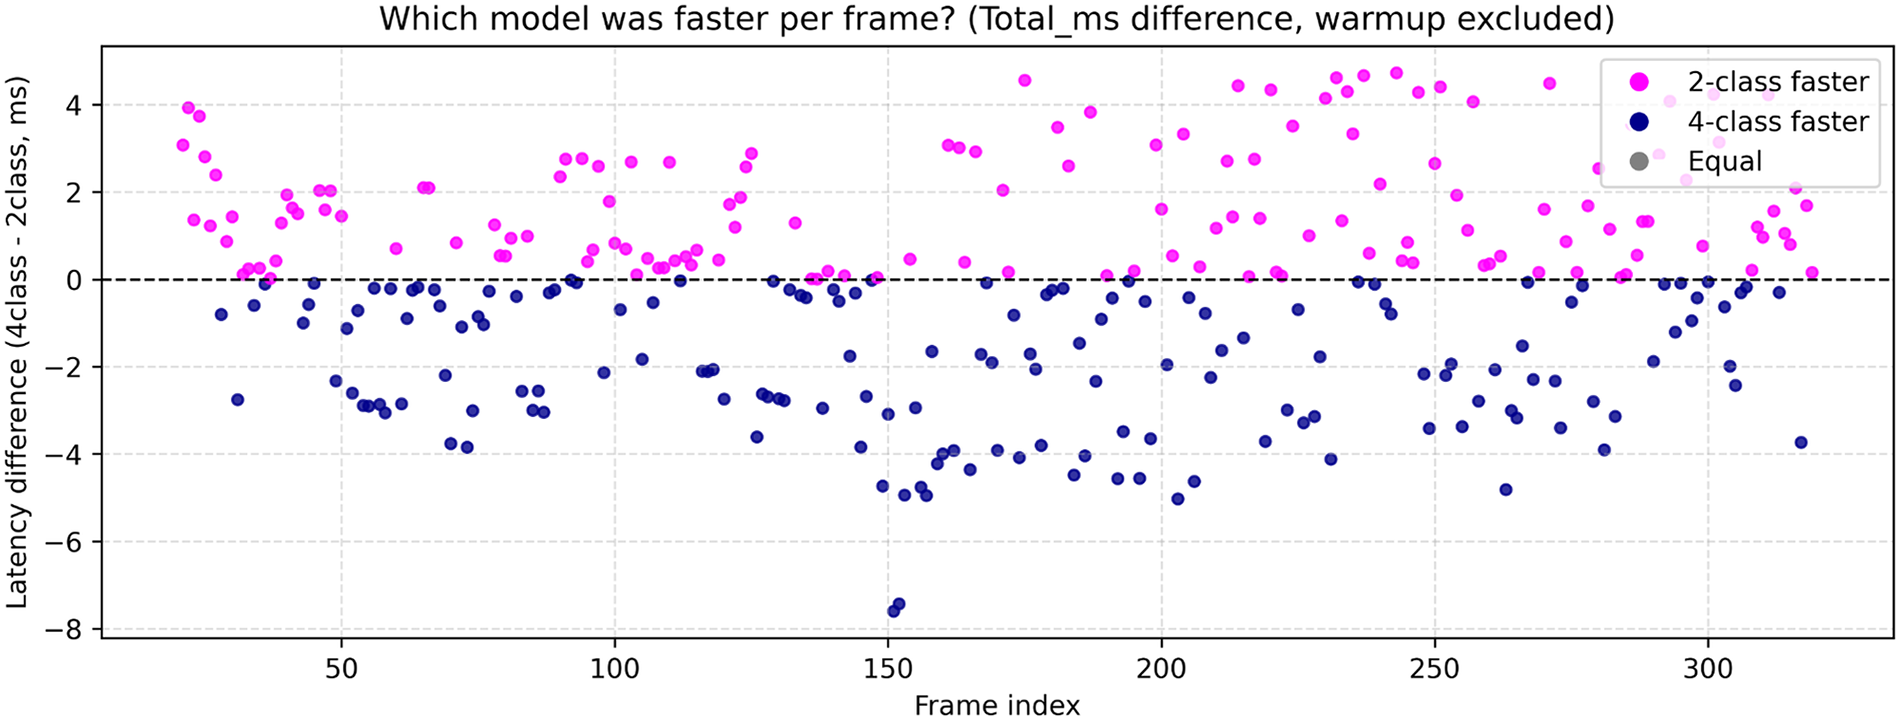
Figure 4: Frame-wise latency difference between the 2- and 4-class CNN models. Each dot represents the latency difference (4–2-class) for individual frames, where pink points indicate frames processed faster by the 2-class model and navy points represent those processed faster by the 4-class model. The distribution visually confirms that both models maintain nearly equal responsiveness across frames, although the 2-class model shows slightly lower average latency overall.
Each point represents the difference in total pipeline time (4–2-class) per frame, excluding the initial warm-up section (0–20 frames). The pink points above the zero axis indicate frames where the 2-class model was faster, whereas the navy points below the axis denote the frames where the 4-class model was faster. The 2-class model was faster for 143 frames (47.7%) but was outperformed by the 4-class model in 156 frames (52.0%). Only one frame (0.3%) showed identical latency for both models. Although the 2-class model was slightly faster on average, the frame-wise comparison reveals that both models alternately dominated with nearly equal frequency. This indicates that the latency difference between the two models is negligible yet confirms that the proposed system consistently ensures real-time responsiveness across different class granularities.
This section presents a comparative analysis of power consumption and inference efficiency across models, emphasizing the trade-off between performance and energy cost. The analysis evaluates the power consumption and inference efficiency of the proposed CNN models on the Jetson Orin Nano platform. Three major power metrics were measured using a low-level hardware monitoring script that directly accessed the INA3221 power sensor on the Jetson board. Instead of relying on high-level tools, the script read voltage (mV) and current (mA) values directly from the sensor register files under the ‘/sys/bus/i2c/.../hwmon/hwmon*/’ directory. This approach collects raw power data through the kernel driver interface, ensuring accurate readings at the hardware level. The logged measurements were saved in CSV format for subsequent analysis including VDD_IN_W, VDD_CPU_GPU_CV_W, and VDD_SOC_W.
VDD_IN_W represents the total system input power drawn from the power adapter and serves as the key reference for overall system consumption. It denotes the overall system power consumption and consequently serves as the primary reference for model comparison. VDD_CPU_GPU_CV_W indicates the combined power consumption of the CPU, GPU, and CV (Computer Vision accelerator) rails. This value is the most sensitive power metric during deep learning inference as it directly reflects computational load. VDD_SOC_W represents the SoC-level power used by memory controllers, I/O peripherals (PCIe, USB, CSI), and other subsystems. This value may also rise slightly as the CNN model size increases and memory access becomes more frequent, but varies minimally in general compared to CPU/GPU power.
Fig. 5 presents a comparison of power consumption between the 2-class and 4-class models based on the VDD_IN_W and VDD_CPU_GPU_CV_W metrics.
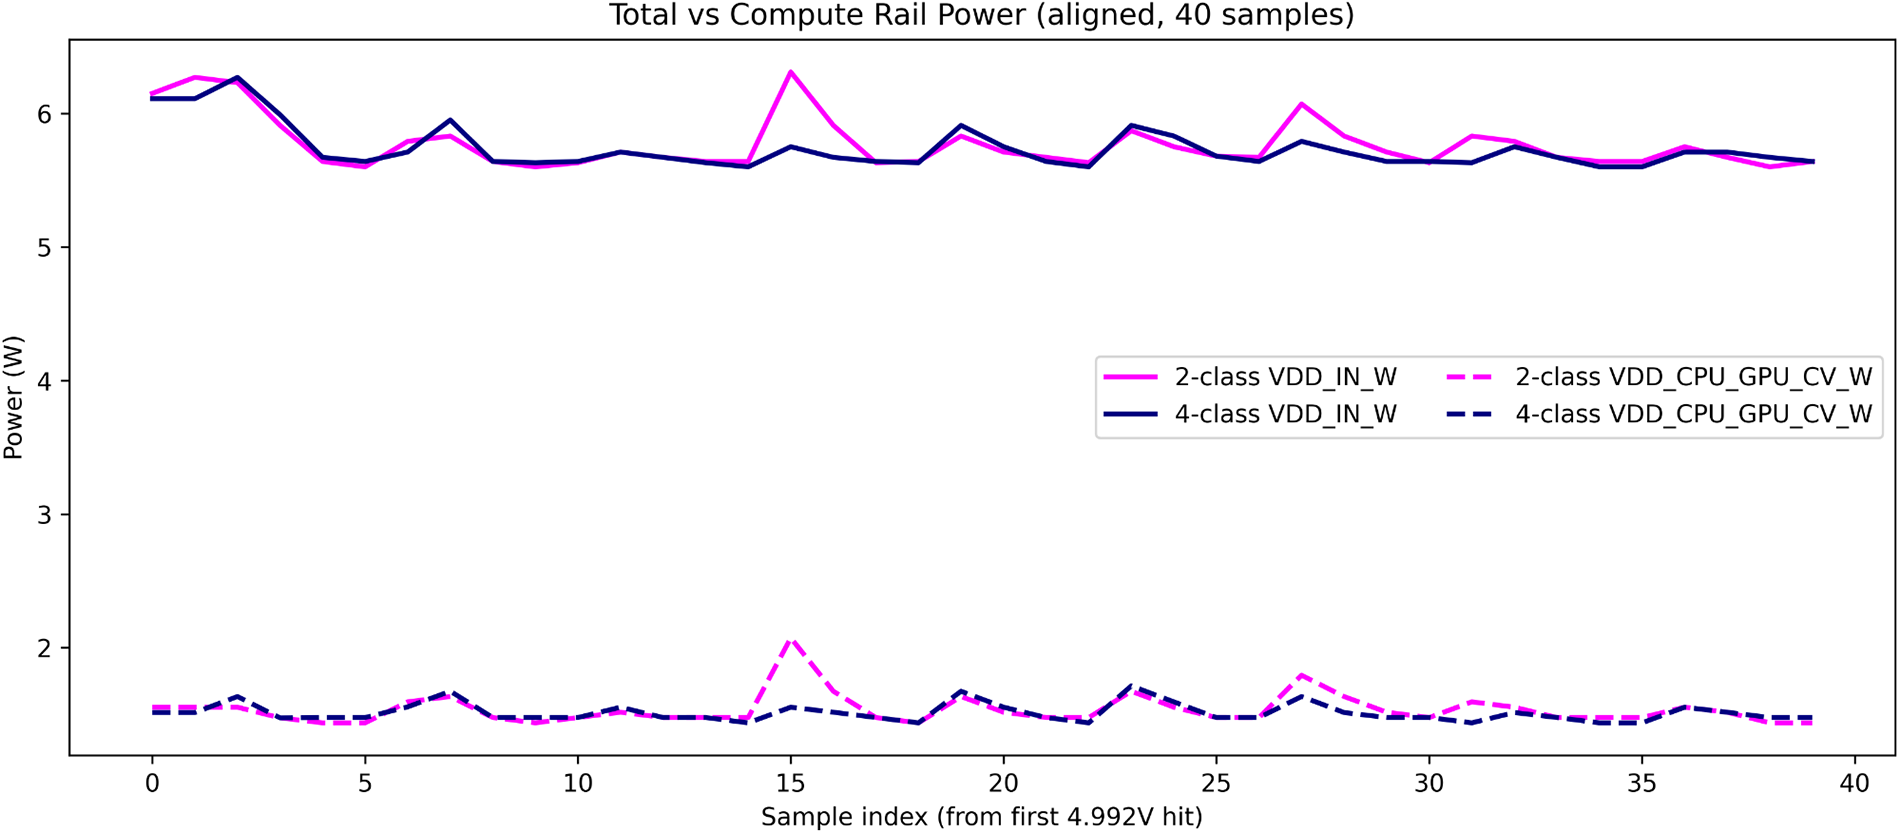
Figure 5: Comparison of total and compute rail power consumption between the 2- and 4-class CNN models. The total input power (VDD_IN_W) and compute rail power (VDD_CPU_GPU_CV_W) were measured on the Jetson Orin Nano. The 4-class model consumed slightly higher power due to increased computational load, with both configurations remaining within the stable 5–6 W operating range.
The total input power (VDD_IN_W) averaged 5.44 W for the 2-class model and 5.61 W for the 4-class model, corresponding to a marginal increase of 0.17 W (≈3.1%) in the latter. The computational rail (VDD_CPU_GPU_CV_W) averaged 1.32 and 1.44 W, respectively, indicating that the additional computational complexity of the 4-class configuration leads to modestly higher consumption. The SoC power (VDD_SOC_W) remained nearly identical (1.27 vs. 1.30 W), implying limited differences in memory or I/O load. Overall, both models maintained stable operation within the 5–6 W range, which is well within the Jetson Orin Nano’s power envelope. Table 9 and Fig. 6 summarize the comparative results of three power metrics.
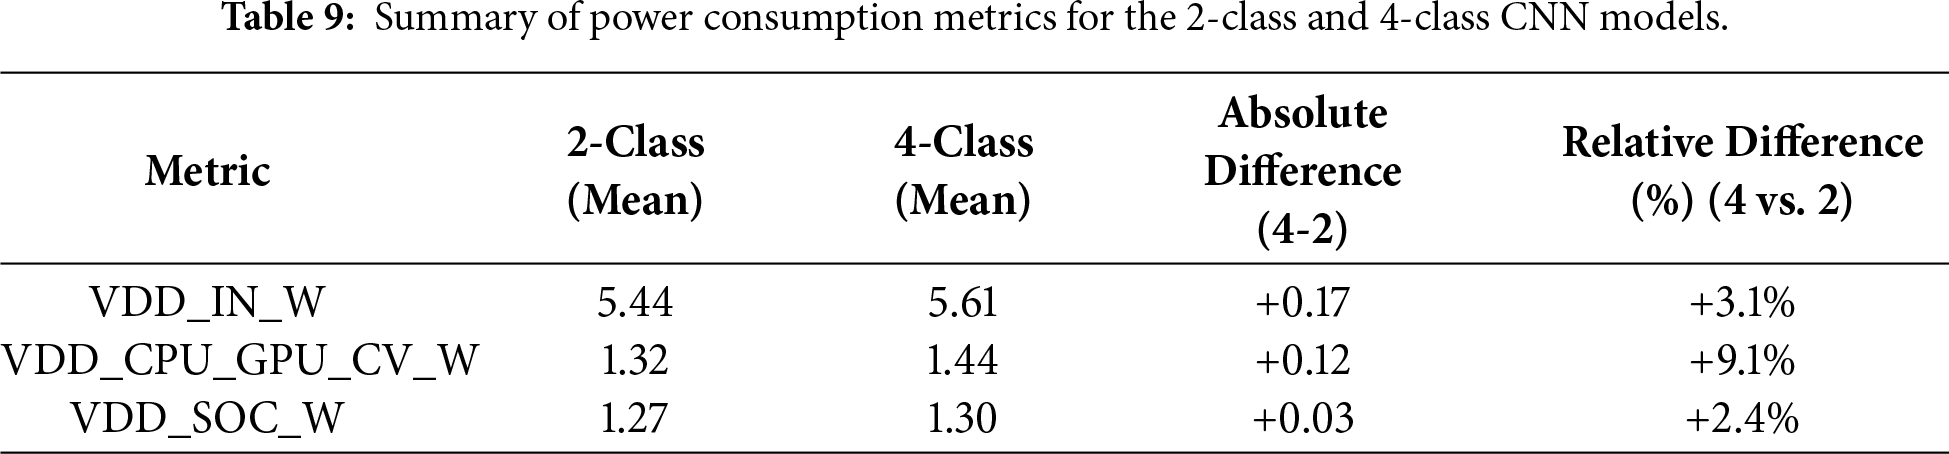
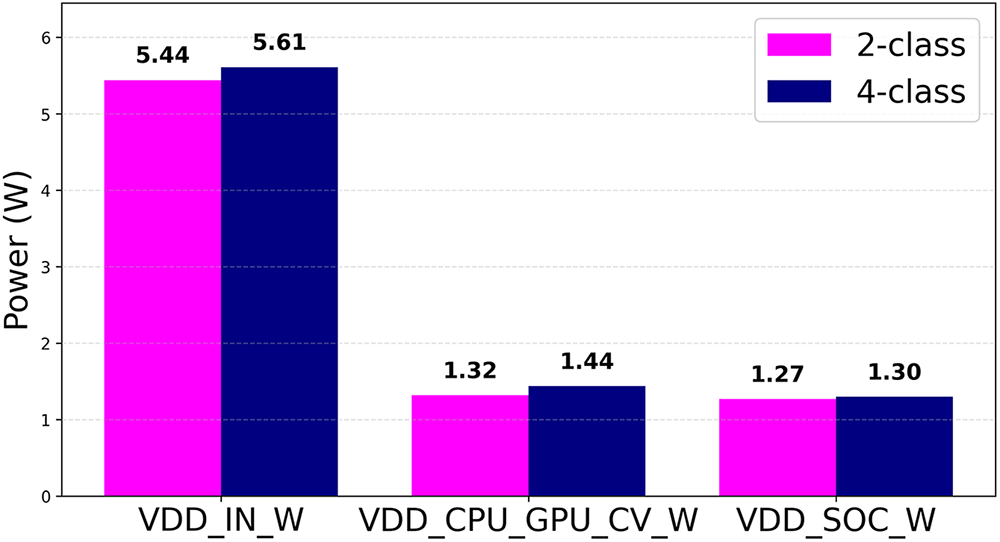
Figure 6: Summary of power consumption metrics for the 2- and 4-class CNN models.
The 4-class is approximately 3% larger in terms of total input power (VDD_IN_W), and the compute power (VDD_CPU_GPU_CV_W) is approximately 9% higher. The SoC power difference is minimal at approximately 2%. Fig. 7 illustrates the inference efficiency (FPS/Watt) comparison between the 2- and 4-class CNN models.
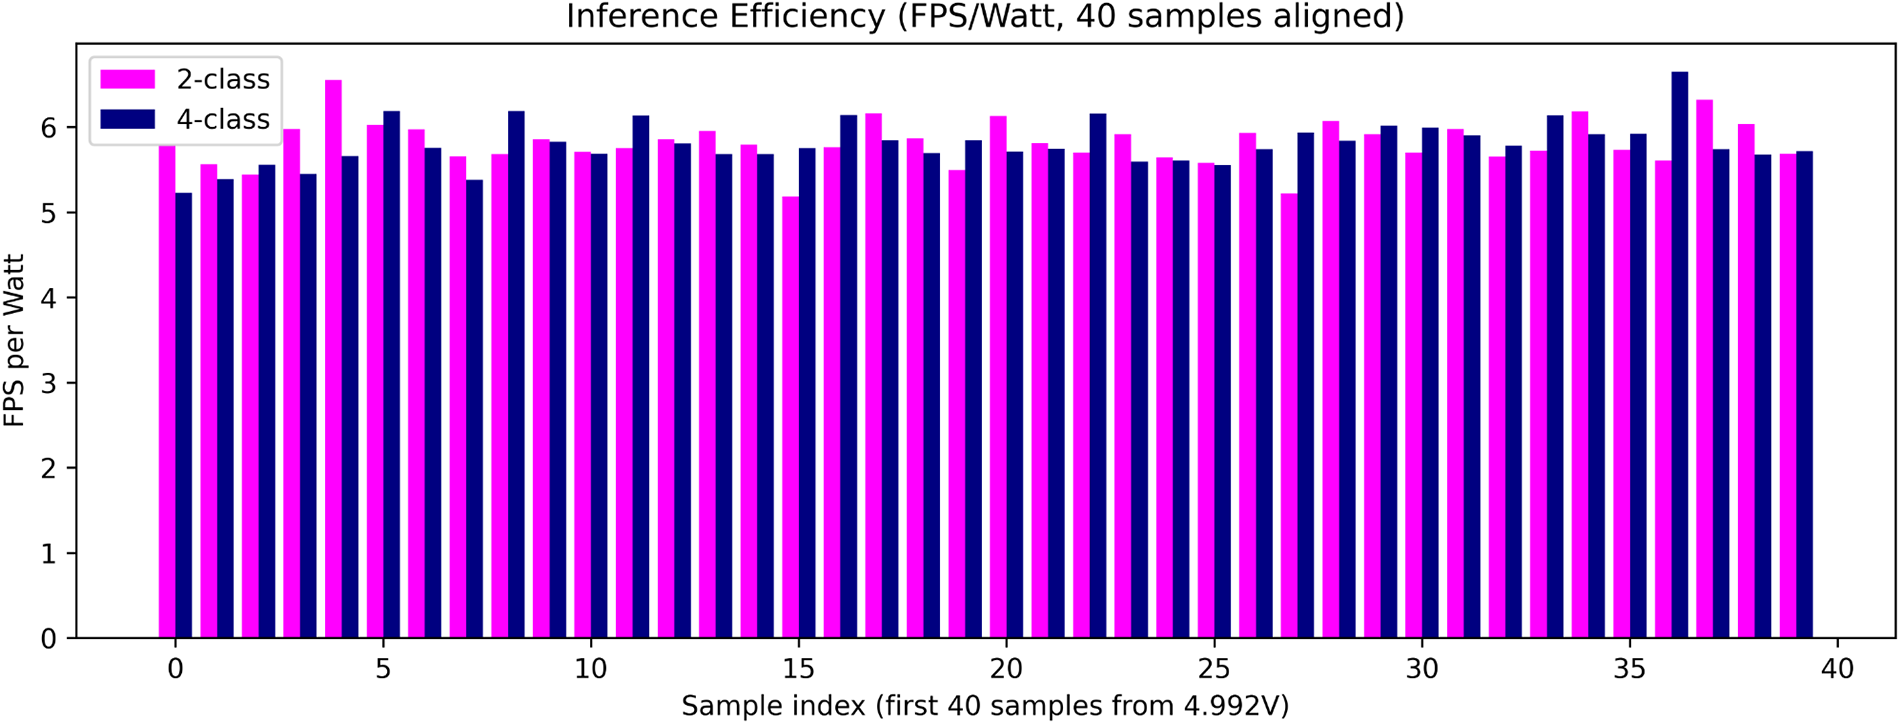
Figure 7: Comparison of inference efficiency (FPS/Watt) between the 2- and 4-class CNN models.
The 2-class model showed a minor advantage from a power efficiency perspective. Although both models achieved nearly identical inference speeds (35.38 vs. 35.16 FPS), the 2-class configuration reached 6.50 FPS/W compared to 6.26 FPS/W for the 4-class model—an improvement of roughly 4%—due to slightly lower power draw. Despite the small efficiency gap, this suggests that simpler class granularity can yield marginally better energy use under identical conditions. Both configurations exhibited stable total and rail power patterns with transient fluctuations primarily observed in the CPU/GPU compute rail, which directly reflects the inference workload. The measured power efficiency values consistently ranged from 5.5 to 6.5 FPS/W, confirming that both CNN models operate efficiently on the embedded edge platform. In conclusion, the power consumption characteristics of the two models are nearly identical with the 2-class configuration showing slightly better energy efficiency, whereas the 4-class configuration offers improved prediction stability and reduced uncertainty. Overall, the 2-class model offers slightly superior energy efficiency without compromising stability, which makes it a more practical choice for real-time embedded deployment.
In this section, the experimental results are integrated and discussed to provide a comprehensive understanding of how class granularity and model architecture affect inference performance and power efficiency. The final results are summarized in Table 10, which consolidates the accuracy, F1-score, inference latency, and power consumption across all class configurations. Note that power and latency measurements were performed only for the 2- and 4-class models (MobileNet and ShuffleNet) as part of the efficiency analysis, with their comparative results additionally visualized in Fig. 8.
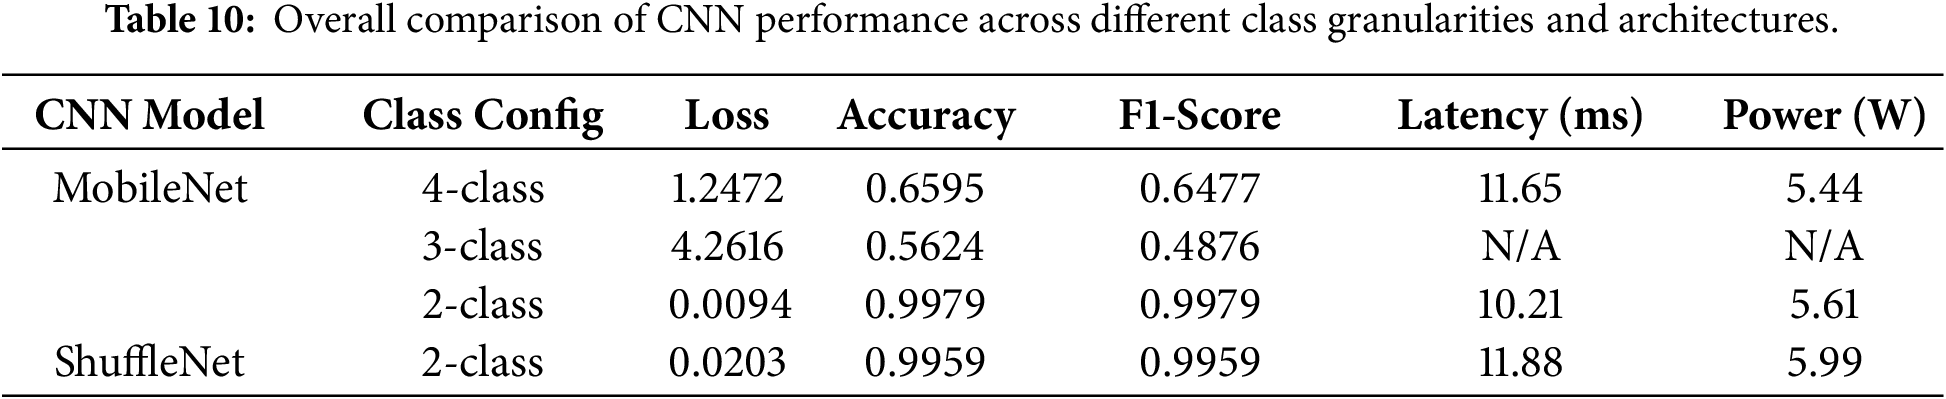
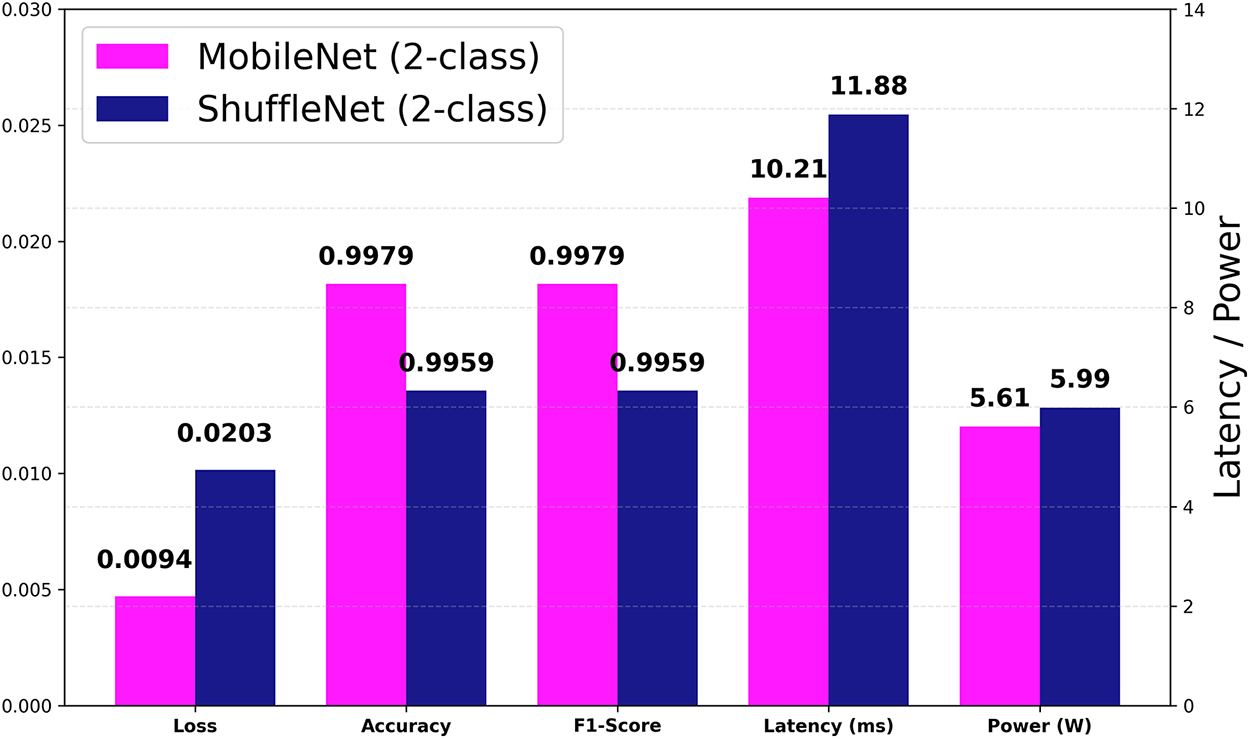
Figure 8: Comparative performance between MobileNet and ShuffleNet (2-class) across multiple metrics. The left axis shows normalized values (Loss, Accuracy, F1-Score), and the right axis represents real-time inference metrics (Latency, Power).
To ensure a fair, comprehensive comparison, an additional performance evaluation was conducted using ShuffleNet, a representative lightweight CNN architecture. The results indicate that ShuffleNet—despite achieving relatively high F1-score and accuracy—showed inferior performance in terms of inference latency and power consumption. This comparison further validates that the proposed MobileNet (2-class) model provides a more favorable trade-off between accuracy and efficiency for real-time embedded inference.
The experimental results demonstrate that the MobileNet 2-class configuration offers the most practical balance between accuracy, latency, and energy efficiency. Although fine-grained class structures provide richer interpretability, their computational overhead limits real-time usability on embedded systems. Therefore, the proposed 2-class CNN configuration is the most feasible solution for edge AI-based SUA verification in real-world vehicular environments. In conclusion, the 2-class model demonstrates both superior performance and energy efficiency, indicating a clear advantage for real-time edge deployment. Fig. 9 shows the real-time inference display of the 2-class model and the corresponding user solution interface.
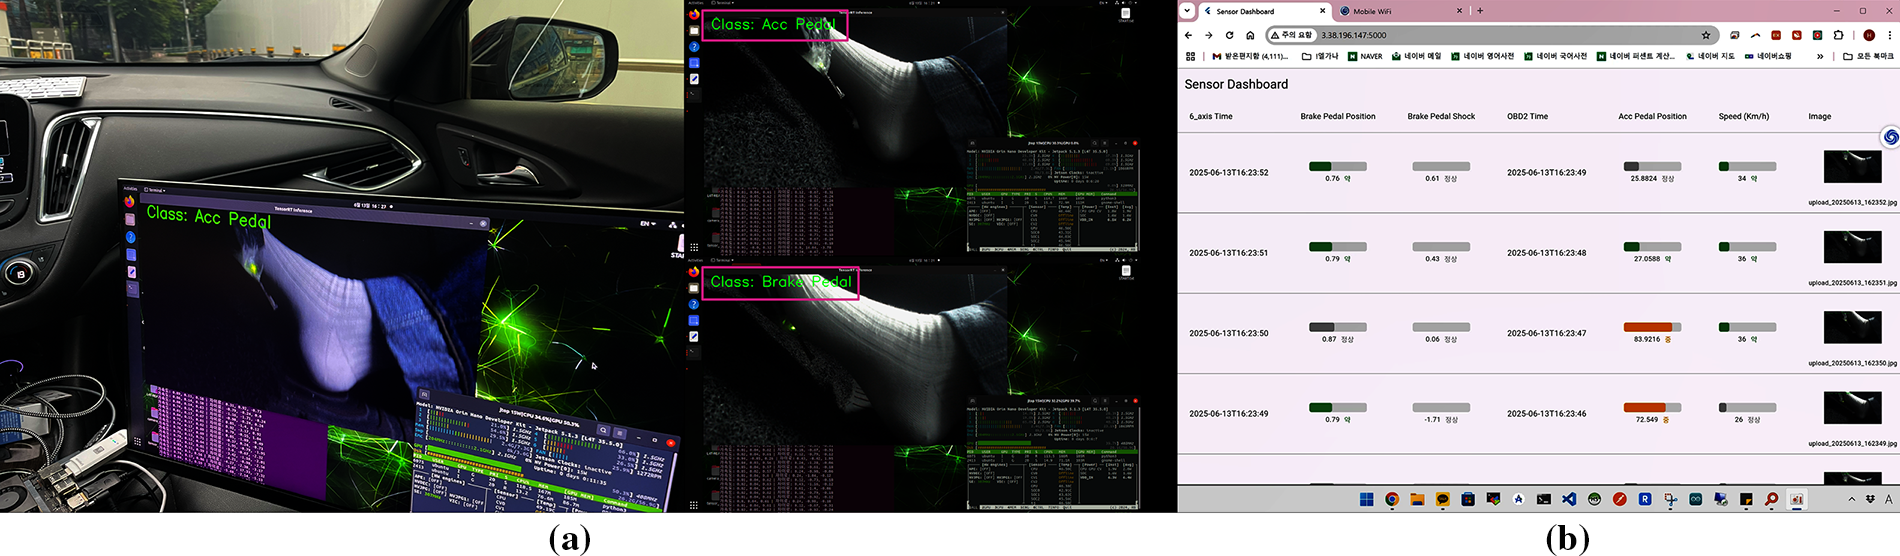
Figure 9: Real-time inference display of the 2-class model and corresponding integrated dashboard view: (a) Real-time CNN inference operation of the SUA verification solution implemented with the 2-class MobileNet configuration; (b) User dashboard interface that lets users monitor the brake pedal displacement on the left, accelerator pedal displacement at the center, and their corresponding foot image on the right. All data are updated every second and can be accessed via the deployed web dashboard.
In this work, we presented a lightweight CNN-based approach for verifying SUA events on embedded edge AI systems. By systematically comparing 2-class and 4-class configurations, the proposed framework demonstrated that the 2-class model achieved superior performance in terms of accuracy, F1-score, and power efficiency while maintaining real-time inference capability. The experimental results confirmed that the optimized model not only reduced latency but also improved the overall energy efficiency of in-vehicle verification systems. These findings highlight the feasibility of implementing real-time AI inference directly on low-power embedded devices such as the NVIDIA Jetson Orin Nano without requiring external computation resources. The proposed system is capable of performing real-time inference with sub-100 ms latency, focusing primarily on image-based pedal classification to determine the driver’s foot position during suspected SUA incidents. This enables transparent and objective verification of driver actions in real-world vehicular environments. By integrating multimodal sensor data including infrared images, brake pedal displacement, and OBD-II readings, the system ensures the reliable detection of brake or accelerator engagement; thus distinguishing between driver misapplication and mechanical malfunction.
As this study presents only preliminary results, the proposed framework cannot be directly applied to commercial systems yet. Further refinement and integration are required to aggregate all experimental outcomes and derive more reliable performance metrics.
Additionally, a probabilistic reasoning model originally introduced in Section 3.5.2 will be further developed and empirically validated in future work. This model is designed to estimate driver intent uncertainty and provide interpretable explanations by modeling confidence distributions across multimodal sensor observations. Once integrated, it is expected to enhance explainability and reliability by complementing the deterministic CNN-based inference results.
For future work, we plan to expand this framework into a Vision-Centric Multimodal (VCM) system that incorporates temporal information and cross-sensor fusion for higher-level scene understanding.
The proposed VCM model will perform multimodal reasoning across image, inertial, and OBD-II data streams unlike the current real-time image-based CNN, generating natural language-based situational interpretations such as describing the cause of acceleration or braking behavior in semantic terms.
The VCM approach enables context-aware and explainable inference despite its longer processing latency of approximately 5 to 10 s, bridging the gap between low-latency edge AI perception and multimodal semantic reasoning for future AI-based automotive safety systems.
Acknowledgement: The authors are thankful for all contributors.
Funding Statement: This research was supported by Basic Science Research Program to Research Institute for Basic Sciences (RIBS) of Jeju National University through the National Research Foundation of Korea (NRF) funded by the Ministry of Education (RS-2019-NR040080). This research was also carried out with the support of the Jeju RISE Center, funded by the Ministry of Education and Jeju Special Self-Governing Province in 2025, as part of the “Regional Innovation System & Education (RISE): Glocal University 30” initiative.
Author Contributions: HeeSeok Choi: Conceptualization, methodology, software, validation, formal analysis, investigation, resources, data curation, writing—original draft preparation, writing; Joon-Min Gil: review and editing, visualization, supervision, project administration, funding acquisition. All authors reviewed and approved the final version of the manuscript.
Availability of Data and Materials: Not applicable.
Ethics Approval: Not applicable.
Conflicts of Interest: The author declares no conflicts of interest.
References
1. Kane S, Liberman E, DiViesti T, Click F. Toyota sudden unintended acceleration. Rehoboth, MA, USA: Safety Research & Strategies, Inc.; 2010. [Google Scholar]
2. Kirsch MT, Regenie VA, Aguilar ML, Gonzalez O, Bay M, Davis ML, et al. Technical support to the National Highway Traffic Safety Administration (NHTSA) on the reported Toyota Motor Corporation (TMC) unintended acceleration (UA) investigation. Hampton, VA, USA: NASA Engineering and Safety Center; 2011. Report No.: NESC-RP-10-00618. [Google Scholar]
3. Scarcella M. Tesla settles wrongful death lawsuit claiming sudden acceleration in ohio crash [Internet]. 2025 [cited 2026 Jan 6]. Available from: https://www.reuters.com/sustainability/tesla-settles-wrongful-death-lawsuit-claiming-sudden-acceleration-ohio-crash-2025-04-21/. [Google Scholar]
4. Cassidy MR, Vainshtein A. What caused a deadly crash in San Francisco—a ‘Madman’ Driver or ‘Malfunctioning’ Tesla [Internet]? 2025 [cited 2026 Jan 6]. Available from: https://www.sfchronicle.com/crime/article/tesla-car-crash-20327719.php. [Google Scholar]
5. Choi HS. Real-time AI inference method for verifying sudden unintended acceleration accidents. J Korea Comput Inf Sci. 2025;30(11):71–8. doi:10.9708/jksci.2025.30.11.071. [Google Scholar] [CrossRef]
6. U.S. Department of Transportation. U.S. Department of Transportation Releases Results from NHTSA-NASA Study of Unintended Acceleration in Toyota Vehicles [Internet]. 2019 [cited 2026 Jan 6]. Available from: https://www.transportation.gov/briefing-room/us-department-transportation-releases-results-nhtsa-nasa-study-unintended-acceleration. [Google Scholar]
7. Park S, Choi Y, Choi W. Experimental study for the reproduction of sudden unintended acceleration incidents. Forensic Sci Int. 2016;267(1):35–41. doi:10.1016/j.forsciint.2016.08.014. [Google Scholar] [PubMed] [CrossRef]
8. Abdi F, Mancuso R, Tabish R, Caccamo M. Restart-based fault-tolerance: system design and schedulability analysis. In: Proceedings of the 2017 IEEE 23rd International Conference on Embedded and Real-Time Computing Systems and Applications (RTCSA); 2017 Aug 16–18; Hsinchu, Taiwan, China. p. 1–10. doi:10.1109/RTCSA.2017.8046320. [Google Scholar] [CrossRef]
9. Liu Q, Li X, Sun K, Li Y, Liu Y. SISSA: real-time monitoring of hardware functional safety and cybersecurity with in-vehicle SOME/IP Ethernet traffic. IEEE Internet Things J. 2024;11(16):27322–39. doi:10.1109/JIOT.2024.3397665. [Google Scholar] [CrossRef]
10. Mamone D, Bosio A, Savino A, Hamdioui S, Rebaudengo M. On the analysis of real-time operating system reliability in embedded systems. In: Proceedings of the 2020 IEEE International Symposium on Defect and Fault Tolerance in VLSI and Nanotechnology Systems (DFT); 2020 Oct 19–21; Frascati, Italy. p. 1–6. doi:10.1109/dft50435.2020.9250861. [Google Scholar] [CrossRef]
11. Li S, Liu Q, Zhang W, Zheng J. A safer paradigm or a new error trap? examining pedal misapplication in one-pedal driving from a cognitive-behavioral perspective [Internet]. 2025. [cited 2026 Jan 6]. doi: 10.31234/osf.io/myz24_v1. [Google Scholar] [CrossRef]
12. Wei C, Gao X, Huang D. Applications of EDR data in traffic accident reconstruction. In: Proceedings of the 2011 International Conference on Electrical and Control Engineering; 2011 Sep 16–18; Yichang, China. p. 5201–4. doi:10.1109/ICECENG.2011.6057827. [Google Scholar] [CrossRef]
13. Cha JH, Kim TH, Jang JW. Design of sudden unintended acceleration check system using distance measurement sensor. In: Park JH, Stojmenovic I, Jeong YS, Yi G, editors. Advances in computer science and ubiquitous computing. Singapore: Springer; 2016. p. 23–8. doi:10.1007/978-981-10-3023-9_4. [Google Scholar] [CrossRef]
14. Ghube AP, Chauhan A, Nidubrolu KK. Detection of unintended vehicle behaviour for driver safety. SAE Tech Pap Ser. 2024;1:2024–26–0106. doi:10.4271/2024-26-0106. [Google Scholar] [CrossRef]
15. Choi JK. Sudden unintended acceleration and product liability: introduction of US precedents and their implications. J Comp Priv Law. 2023;30(4):35–67. [Google Scholar]
16. Kim M, Jang JW. Implement automobile black box system for proving cause of sudden unintended acceleration. J Korea Inst Inf Commun Eng. 2014;18(6):1429–34. doi:10.6109/jkiice.2014.18.6.1429. [Google Scholar] [CrossRef]
17. Watson RA, Bonugli E, Greenston M, Santos E, Martinez J. Event data recorder trigger probability in the crash investigation sampling system database. In: SAE technical paper series. Warrendale, PA, USA: SAE International; 2024. p. 1–9. doi:10.4271/2024-01-5027. [Google Scholar] [CrossRef]
18. Lee SB, Kim DH, Moon BJ. A study on the improved EDR storage data to identify the cause of unintended acceleration of eco-friendly vehicles. J Auto Veh Saf Assoc. 2022;14(3):17–22. doi:10.22680/kasa2022.14.3.017. [Google Scholar] [CrossRef]
19. Rossi D, Borghi G, Vezzani R. TakuNet: an energy-efficient CNN for real-time inference on embedded UAV systems in emergency response scenarios. arXiv:2501.05880. 2025. [Google Scholar]
20. Gu Y, Wu M, Wang Q, Chen S, Yang L. A deep learning-based crowd counting method and system implementation on neural processing unit platform. Comput Mater Continua. 2023;75(1):493–512. doi:10.32604/cmc.2023.035974. [Google Scholar] [CrossRef]
21. National Highway Traffic Safety Administration (NHTSA). Technical assessment of Toyota electronic throttle control (ETC) systems. Washington, DC, USA: U.S. Department of Transportation; 2011. [Google Scholar]
22. Vida G, Török Á. Effects of developing data recording technologies on the reliability of accident reconstruction and liability determination. Eur Transp Res Rev. 2025;17(1):34. doi:10.1186/s12544-025-00727-8. [Google Scholar] [CrossRef]
23. Amazon Web Services (AWS). Amazon SageMaker ground truth: build highly accurate datasets and reduce labeling costs by up to 70% [Internet]. 2023 [cited 2026 Jan 6]. Available from: https://aws.amazon.com/ko/blogs/korea/amazon-sagemaker-ground-truth-build-highly-accurate-datasets-and-reduce-labeling-costs-by-up-to-70/. [Google Scholar]
Cite This Article
 Copyright © 2026 The Author(s). Published by Tech Science Press.
This work is licensed under a Creative Commons Attribution 4.0 International License , which permits unrestricted use, distribution, and reproduction in any medium, provided the original work is properly cited.
 Downloads
 Citation Tools