
 Submit a Paper
 Propose a Special lssue
 Open Access
ARTICLE
From Algorithm to Expert: RLHF-Guided Vision-Language Model for 3D-EEM Fluorescence Spectroscopy Matching
1 College of Computer Science and Artificial Intelligence, Fudan University, Shanghai, China
2 The China Railway 24th Bureau Group Corporation Limited, Shanghai, China
* Corresponding Author: Tonglin Chen. Email:
Computers, Materials & Continua 2026, 87(2), 80 https://doi.org/10.32604/cmc.2026.075400
Received 31 October 2025; Accepted 21 January 2026; Issue published 12 March 2026
 View Full Text
 Download PDF
Abstract
Existing methods for tracing water pollution sources typically integrate three-dimensional excitation-emission matrix (3D-EEM) fluorescence spectroscopy with similarity-based matching algorithms. However, these approaches exhibit high error rates in borderline cases and necessitate expert manual review, which limits scalability and introduces inconsistencies between algorithmic outputs and expert judgment. To address these limitations, we propose a large vision-language model (VLM) designed as an “expert agent” to automatically refine similarity scores, ensuring alignment with expert decisions and overcoming key application bottlenecks. The model consists of two core components: (1) rule-based similarity calculation module generate initial spectral similarity scores, and (2) pre-trained large vision-language model fine-tuned via supervised learning and reinforcement learning with human feedback (RLHF) to emulate expert assessments. To facilitate training and evaluation, we introduce two expert-annotated datasets, Spec1k and SpecReason, which capture both quantitative corrections and qualitative reasoning patterns, allowing the model to emulate expert decision-making processes. Experimental results demonstrate that our method achieves 81.45% source attribution accuracy, 38.24% higher than rule-based and machine learning baselines. Real-world deployment further validates its effectiveness.Keywords
Reliable identification of water pollution sources is fundamental to effective water quality management, as it enables regulators to implement targeted remediation and control pollutant discharges. Among available analytical techniques, 3D-EEM fluorescence spectroscopy [1,2] has emerged as a widely adopted method for characterizing dissolved organic matter and identifying its potential sources. In practice, source tracing typically follows a two-step workflow: initial algorithmic similarity-based matching [3,4] followed by manual expert review [5]. While this process ensures essential validation, it introduces inefficiencies and inconsistencies between algorithmic outputs and expert judgments. To reduce this gap, our goal is to learn a model that can perform the same revision step as human experts, i.e., an expert agent that takes the baseline similarity result together with spectral and contextual evidence and outputs an expert-aligned similarity with an explicit rationale.
Traditional rule-based and machine learning approaches have advanced spectral analysis but still exhibit significant limitations in complex or boundary cases. Deterministic similarity metrics, such as Euclidean or cosine distance [6,7], often misinterpret weak or overlapping spectral peaks and fail to incorporate contextual information, such as sampling conditions or hydrological background [8]. While machine learning models (e.g., random forests, convolutional neural networks, transformers) [9,10] offer improved numerical accuracy, they lack interpretability, hindering expert understanding of similarity score derivation and limiting their ability to guide model correction when errors arise. Consequently, algorithmic predictions frequently deviate from expert assessments, necessitating repeated manual review and impairing operational efficiency.
Fig. 1 illustrates the existing workflow and our proposed model framework. In the traditional workflow, a baseline similarity is first generated based on 3D-EEM spectra and a similarity algorithm. Human experts then review the spectral images, baseline results, and contextual metadata, revising the baseline similarity and providing corrections and reasoning logs. These are two separate processes, and each test ultimately relies on real-time human expert participation, which is costly. We found that these expert reviews not only validate and optimize the algorithm results but also provide valuable supervisory information reflecting the experts’ cognitive logic. Building on this, our work transforms these two independent algorithm–expert processes into an integrated learning framework in which the model is trained to behave as the expert reviewer. Specifically, the learned expert agent receives the same evidence used in manual review (spectral image, baseline score/peaks, and contextual metadata), and outputs a refined similarity estimate together with a human-readable explanation that mirrors expert correction behavior.
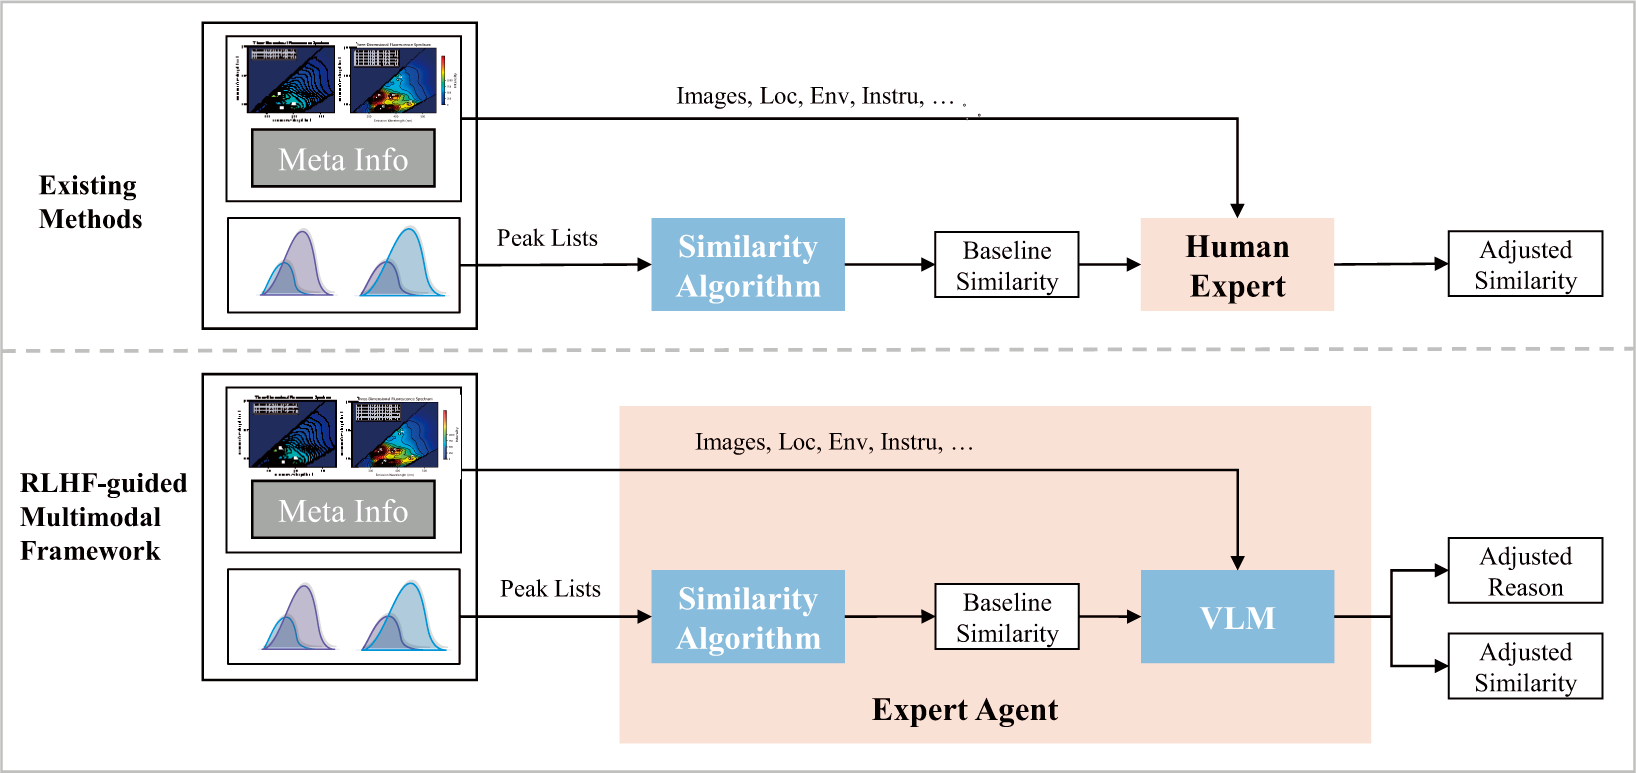
Figure 1: The proposed RLHF-guided multimodal framework. The first part illustrates the similarity assessment in existing methods: a baseline similarity score is first computed from the 3D-EEM spectrum, followed by expert adjustment based on contextual information and domain experience to yield the final similarity—two distinct and sequential steps. The second part presents our framework: a baseline similarity is first generated using the proposed calculation method; then, the spectral image, baseline score, and encoded expert knowledge are fed into a large multimodal model that acts as an expert agent, producing an expert-aligned similarity score accompanied by interpretable reasoning. During inference, the model performs expert-style revision autonomously, without requiring real-time expert input.
Recent studies have demonstrated that RLHF [11–14] enables VLMs to adapt effectively to private or domain-specific applications. For instance, a study [15] applied RLHF to enhance factual grounding and reduce hallucination in image-caption reasoning. Another study [16] optimized VLMs as decision-making agents in constrained interactive environments using reinforcement learning. In autonomous driving scenarios, a study [17] introduced a reasoning-enhanced VLM tailored for closed-domain visual question answering. These examples indicate that RLHF is an effective strategy to customize general-purpose VLMs for specialized fields where standard supervised fine-tuning is insufficient. However, their application to 3D-EEM similarity matching for pollution source tracing remains underexplored, particularly in addressing the workflow-specific challenges outlined above: fusing spectral visuals with contextual metadata, encoding expert reasoning for boundary cases, and maintaining interpretability in decision-making.
To address these challenges, we propose a domain-specific large vision-language model guided by RLHF, explicitly designed and trained for 3D-EEM fluorescence spectroscopy similarity calculation, termed Fluorescence Spectroscopy Similarity via a large Vision-Language Model (FSS-VLM). We use standard VLM backbones and SFT/RLHF-style training, and contribute a workflow-adaptive calibration methodology tailored to this task. In this paper, expert agent specifically refers to this trained VLM component that internalizes the manual expert-review stage: given the spectral image, the baseline similarity output (and associated peak information), and contextual metadata, it produces an expert-aligned refined similarity score together with interpretable reasoning. FSS-VLM comprises two main components: (1) a similarity calculation module, combining rule-based and machine learning methods to compute initial spectral similarity; and (2) a pre-trained large multimodal model, which learns expert correction knowledge via supervised fine-tuning and RLHF to generate similarity assessments consistent with expert judgment. To enhance the model’s acquisition of expert knowledge in pollution source tracing, we construct two datasets, Spec1k and SpecReason, grounded in expert reasoning logic, optimization behaviors, and preferences, for fine-tuning the pre-trained model. Both datasets encode expert-corrected similarity scores and detailed reasoning chains, enabling effective learning across typical boundary cases. In the experimental evaluation, we leverage two expert-annotated datasets, Spec1k and SpecReason, collected from real-world environmental monitoring cases, to rigorously assess the proposed model’s effectiveness in pollution source tracing. The experiments evaluate core capabilities including multimodal feature fusion, accurate identification of diagnostically weak spectral peaks, consistency with expert judgment, and robustness in complex boundary scenarios. We benchmark FSS-VLM against widely used approaches such as rule-based similarity calculation, cosine similarity, random forests, and convolutional neural networks.
Experimental results demonstrate that FSS-VLM consistently outperforms all comparison methods, achieving both superior numerical precision and significantly enhanced expert alignment. Notably, our method attains an Expert Acceptance Rate of 81.45%, representing a 38.24% improvement over the strongest traditional baseline. Furthermore, in real-world deployment, FSS-VLM successfully detected critical weak-peak signatures that conventional algorithms overlooked, effectively reducing misclassification and minimizing manual review requirements. These findings confirm that FSS-VLM narrows the long-standing gap between deterministic similarity metrics and human expertise, providing a scalable and reliable intelligent decision-support solution for practical water environment regulation.
In summary, the contributions of this paper are as follows:
• We construct two expert-curated multimodal datasets, Spec1k and SpecReason, to support fine-tuning of large multimodal models for pollution source tracing.
• We propose the first RLHF-based large multimodal model framework for pollution source tracing, effectively replacing manual expert review, significantly reducing operational costs.
• Experimental results show that the proposed method substantially outperforms existing approaches in consistency, interpretability, and efficiency.
2.1 3D-EEM Spectroscopy for Pollution Source Tracing
3D-EEM fluorescence spectroscopy is a core tool for characterizing dissolved organic matter in aquatic systems, enabling pollution source attribution by matching spectral “fingerprints”of unknown samples to reference sources [1,2]. Early work established that specific peaks indicate pollution types: protein- or tryptophan-like signals link to domestic sewage, while humic- or fulvic-like signals stem from industrial or terrestrial sources [2,3], framing source tracking as a spectral similarity task [3,4].
Traditional methods use rule-based peak extraction and deterministic metrics (e.g., adaptive thresholding, weighted Euclidean/cosine similarity) [6,18]. Though efficient and interpretable, they struggle with weak or overlapping peaks and noise, often underestimating diagnostic features by experts [8,10,18]. Recent ML approaches, such as random forests and CNN, learn similarity directly from data, improving accuracy for complex mixtures [9,19]. Yet they act as “black boxes,” lack interpretability, degrade under low signal-to-noise conditions or novel scenarios, and cannot incorporate contextual metadata crucial for expert judgment [4,10].
2.2 RLHF and LLMs for Domain Knowledge Integration
RLHF and LLMs have shown significant potential in fusing structured data with domain expertise across fields such as natural language processing, computer vision, and healthcare [11–14]. RLHF [13] addresses the limitations of pure supervised learning by iteratively refining models using human preference signals, while LLMs excel at integrating structured data (e.g., images, tabular features) with unstructured domain knowledge. Studies [11,12] showed that RLHF can align model outputs with human cognitive logic, but their work focused on general language tasks rather than multimodal spectral data. In environmental science, preliminary work has explored the use of LLMs for tasks like interpreting water quality reports and summarizing environmental monitoring data. For example, study [14] demonstrated that LLMs can assist in organic chemistry analysis by converting complex spectral data into human-readable insights, highlighting their potential for integrating domain-specific knowledge. However, few studies have applied RLHF to refine 3D-EEM spectral similarity scores for pollution source tracing. To date, applications in environmental science have primarily emphasized LLM-assisted reporting and decision support rather than RLHF-based refinement of spectral similarity scoring for source tracing.
2.3 Multimodal Fusion and Interpretable Model in Environmental Analysis
Interpretability and multimodal data integration are essential for bridging laboratory-based spectral analysis with real-world water quality management [5,10]. Existing studies have explored combining spectral data with auxiliary environmental information to enhance model robustness [19]. For instance, Xu et al. [19] employed an interpretable attention mechanism to integrate 3D-EEM features with hydrological metadata. However, these approaches are typically based on traditional machine learning or shallow neural networks rather than true VLM. Consequently, they are unable to jointly reason over visual spectra and textual metadata in a unified multimodal space. Moreover, none of the existing models are specifically designed for fluorescence spectroscopy: they often fail to recognize diagnostically critical weak or overlapping peaks and cannot capture the expert reasoning process underlying similarity correction. This gap underscores the need for a dedicated framework that (1) fuses 3D-EEM fluorescence images, contextual metadata, and baseline similarity scores; (2) leverages RLHF to align predictions with expert judgment; and (3) produces interpretable reasoning chains to justify similarity adjustments.
The proposed FSS-VLM follows an RLHF-guided multimodal framework to bridge the gap between algorithmic spectral matching and expert judgment in 3D-EEM-based pollution source tracing. In this work, the expert agent refers to the trained vision-language model component that emulates the manual expert-review stage: given a spectral image, the baseline similarity result, and contextual metadata, it revises the baseline toward expert judgment and produces an interpretable rationale. The overview of FSS-VLM is shown in Fig. 2. FSS-VLM consists of three sequential stages: Baseline Matching, Expert-Guided Dataset Construction, and VLM Fine-Tuning.
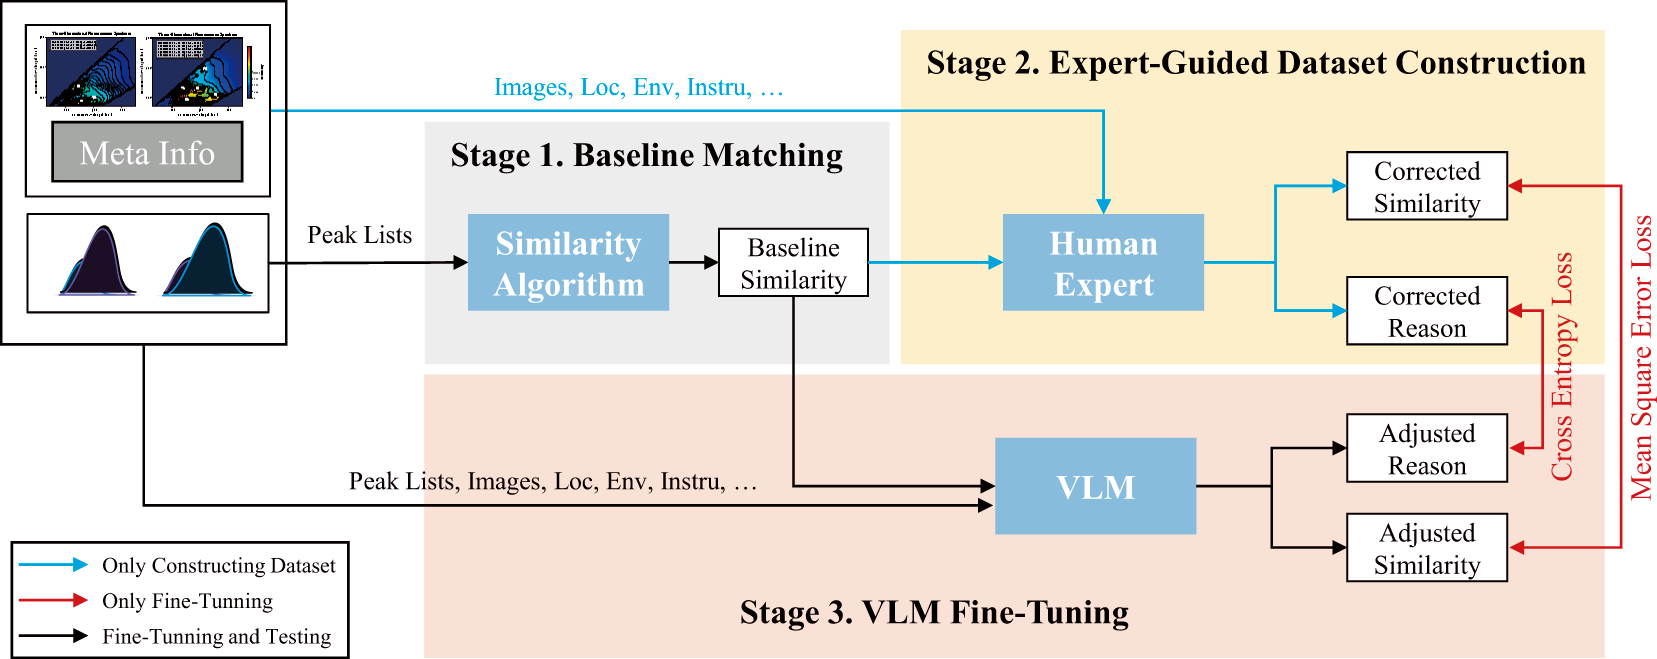
Figure 2: The Overview of FSS-VLM. The training process consists of three stages: 1) Baseline Matching: computing the baseline similarity from the peak list using a similarity algorithm; 2) Expert-Guided Dataset Construction: human experts, leveraging auxiliary sample information and domain experience, revise the baseline similarity to obtain corrected similarity scores and corresponding reason, which are used as ground truth for dataset construction; and 3) VLM Fine-Tuning: the VLM is fine-tuned on the constructed dataset to align its outputs—adjusted similarity scores and associated reasoning—with expert reason. During inference (indicated by the black arrows), the proposed FSS-VLM operates autonomously without human expert involvement, yet achieves performance comparable to that of human experts.
Stage 1. Baseline Matching: This stage provides a reproducible computational foundation and generates the baseline evidence that will later be revised by the expert agent. Before similarity calculation, each spectrum is preprocessed via Intensity Normalization, Scattering Interference Removal, and Gaussian Smoothing. After preprocessing, key fluorescence features are extracted and summarized as a peak list. Each peak is represented as
Given an unknown sample peak set
where
Finally, the aggregated distance is monotonically mapped to a similarity score in
Stage 2. Expert-Guided Dataset Construction: To train the expert agent to perform expert-style revision conditioned on the baseline output, we construct expert-annotated datasets that explicitly capture (i) how experts correct baseline similarities and (ii) why the correction is justified. Two datasets are built: SpecReason and Spec1k. SpecReason teaches the model expert reasoning logic through detailed annotations, while Spec1k supports preference alignment (via RLHF) so that the agent’s revised similarity scores match expert judgment. Domain experts with over five years of experience in 3D-EEM interpretation manually review baseline outputs to identify cases where algorithmic results significantly deviate from expert assessments. For each flawed baseline case, we collect two complementary annotations: (a) a corrected similarity score, cross-validated by a third senior analyst (inter-expert Kappa = 0.92) to ensure objectivity; and (b) an explicit reasoning chain describing the evidence and cognitive logic underlying each correction (e.g., peak presence/absence, weak-peak diagnostics, overlap disambiguation, and the role of contextual metadata).
Stage 3. VLM Fine-Tuning: We fine-tune a pre-trained VLM to become the expert agent using SpecReason and Spec1k, by explicitly structuring its inputs and outputs to mirror the human expert-review workflow. We design a multimodal prompt template that integrates three key inputs: (1) the preprocessed 3D-EEM spectral image, (2) the baseline similarity score and associated peak list, and (3) contextual metadata (e.g., sampling location, environmental conditions, instrument type). This prompt design is crucial: it forces the expert agent to ground its revision on the same information sources used by human experts, and to output both a refined similarity and an explanation. Training instance follows a specific format that guides the VLM through the expert cognitive procedure, jointly considering visual spectral patterns, quantitative baseline evidence, and domain-relevant context.
With the designed prompt, the VLM undergoes a two-phase optimization process inspired by DeepSeek-R1 [20]. First, SFT enables the model to internalize expert reasoning from SpecReason, learning how to connect spectral characteristics and contextual cues to correction logic. Second, RLHF further aligns the agent’s revised similarity predictions with expert preferences using Spec1k, improving numerical consistency with expert judgment while preserving interpretability. Together, SFT+RLHF trains the VLM to act as an expert agent that autonomously revises baseline similarity results and generates transparent reasoning chains, thereby approximating both the outcome and the rationale of manual expert review.
The data preparation pipeline ensures that all spectral, contextual, and expert-derived information is standardized and ready for multimodal model training. The process includes three sequential stages: Raw Data Collection, Data Preprocessing, and Dataset Construction.
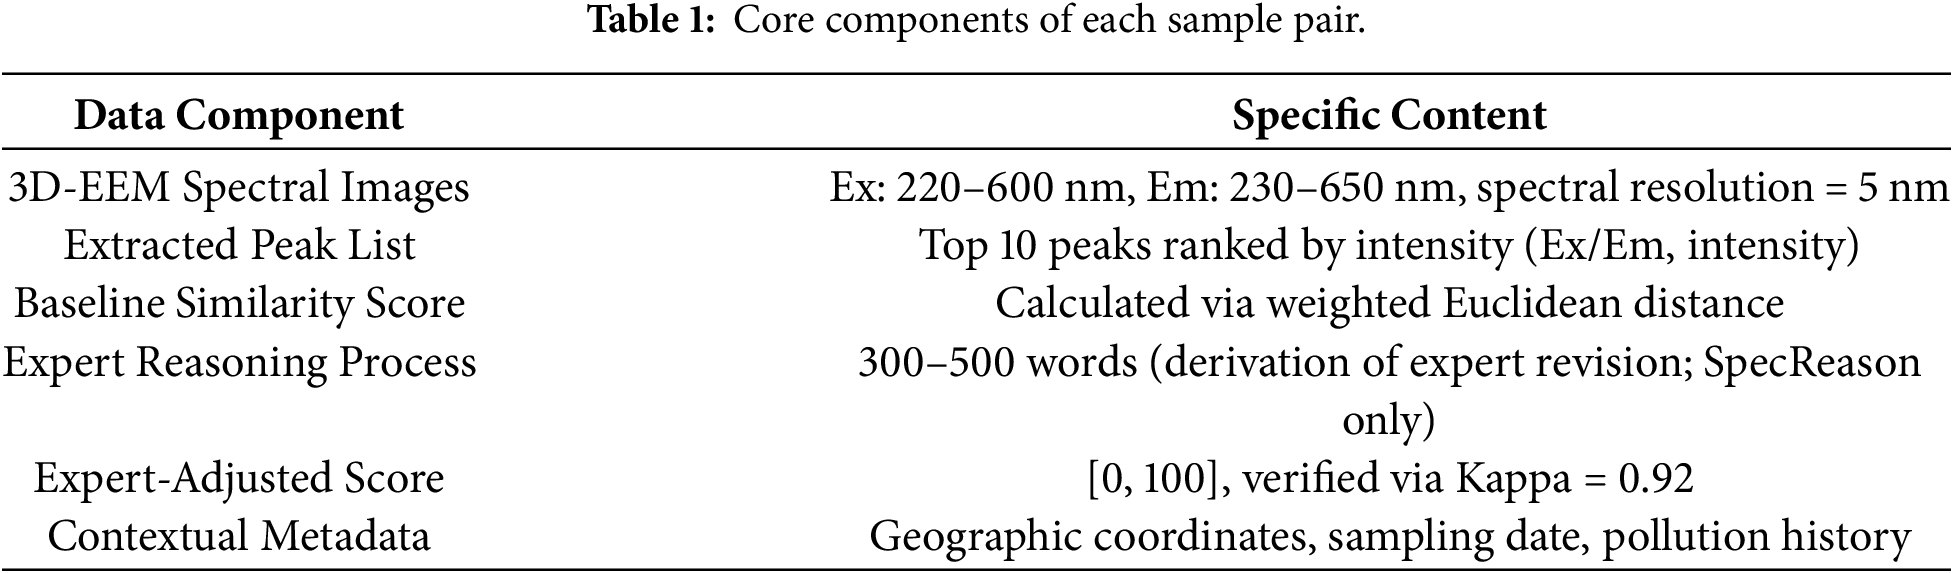
Raw Data Collection: All data used in this paper were derived from real-world environmental monitoring cases to ensure ecological relevance and practical applicability. A total of 2000 water samples were collected from diverse monitoring sites and paired into 1000 sample pairs for subsequent analysis (each pair consists of an unknown sample and a reference sample). Each sample pair contains multimodal evidence required for training, as summarized in Table 1.
Data Preprocessing: Before constructing the datasets, each spectrum is preprocessed through the following steps: (1) Intensity Normalization: raw spectral intensities are normalized to the range [0, 1] to eliminate intensity variations caused by differences in instrument sensitivity, ensuring sample comparability; (2) Scattering Interference Removal: Rayleigh and Raman scattering signals are removed to prevent them from obscuring diagnostically critical weak peaks; (3) Gaussian Smoothing: a Gaussian smoothing filter with a standard deviation of
Dataset Construction: Two complementary datasets, SpecReason and Spec1k, were constructed from the same pool of 1000 sample pairs but differ substantially in scale because they serve different training purposes. SpecReason is designed to demonstrate the expert calculation pattern to the VLM. For each pair in SpecReason, domain experts write a step-by-step derivation describing how they revise the baseline similarity by analyzing peak evidence and contextual metadata. This reasoning annotation is intentionally detailed (approximately 300–500 words per pair) and requires careful expert effort and cross-checking, which makes large-scale collection expensive. Therefore, SpecReason contains 30 carefully selected pairs via stratified sampling to maximize coverage of representative boundary scenarios (weak peaks, noise interference, overlapping peaks, mixed-source pollution, and abnormal peak shapes), providing a compact but high-fidelity curriculum for supervised fine-tuning. SpecReason is intentionally small and is curated as demonstration-style supervision to illustrate expert reasoning patterns; it is not intended to provide statistically sufficient coverage for broad generalization. Our ablation results verify its functional role in the overall workflow.
In contrast, Spec1k is designed for RLHF preference alignment and reward modeling, where training stability and similarity-score calibration benefit from a larger and more diverse set of pairs. Since Spec1k does not require long-form derivation text, it can be collected at a much larger scale. Spec1k therefore includes all 1000 pairs, consisting of 586 expert-revised cases and 414 correctly estimated cases. This composition allows the model to learn both when to adjust the baseline and when to keep it unchanged. For each pair, spectral matrices were cleaned, the top 10 peaks extracted, rule-based similarity computed, and paired spectral images resized to
To support effective fine-tuning of the vision-language model, we design a structured multimodal data format that integrates spectral images, quantitative similarity scores, peak lists, contextual metadata, and expert supervision signals.
As illustrated in Fig. 3, SpecReason provides expert-written step-by-step derivations to guide supervised fine-tuning toward expert-style reasoning and explanation, while Spec1k provides scaled expert-adjusted scores for reward modeling and preference alignment in the RLHF stage. This division enables the model to learn the correction pattern from a small number of high-quality reasoning demonstrations, and to achieve stable numerical alignment with expert judgments from a larger set of diverse pairs.
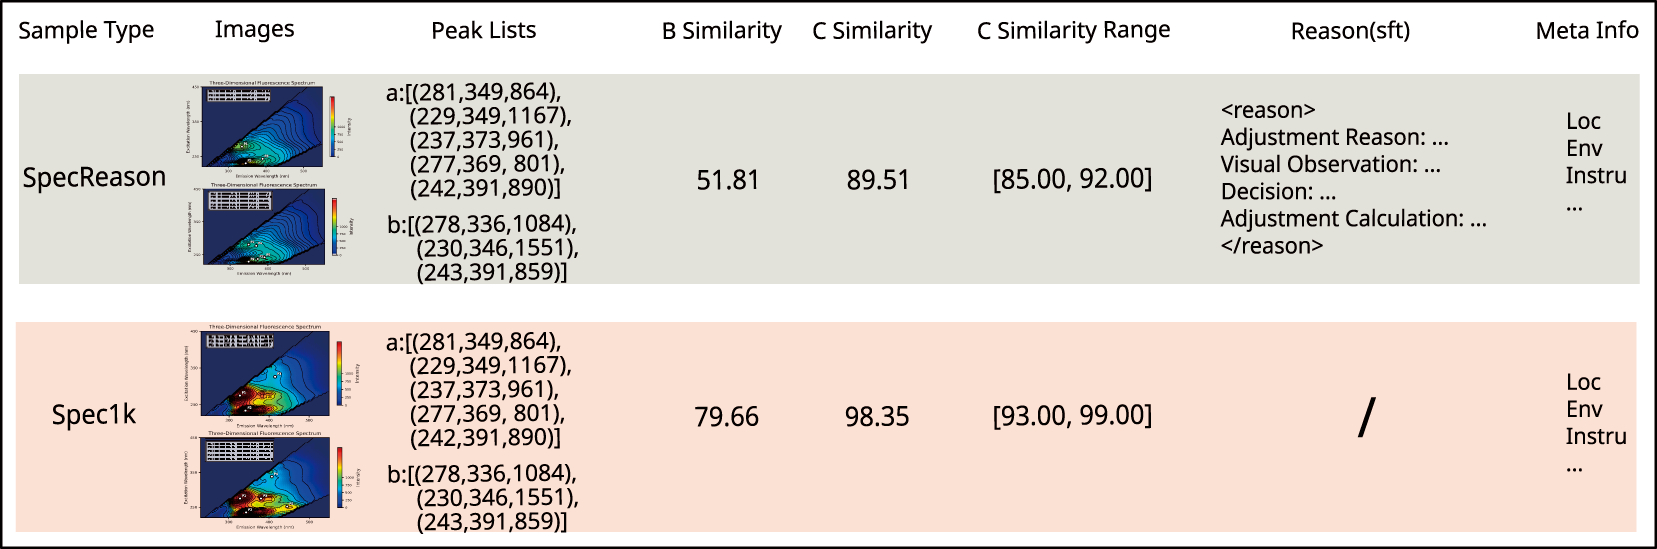
Figure 3: Data structure of the SpecReason and Spec1k datasets. Fields include paired 3D-EEM spectra, peak lists, baseline similarity (B similarity), corrected similarity (C similarity), confidence ranges, metadata, and expert reasoning. Expert reasoning is only present in SpecReason and is marked with “/” for Spec1k.
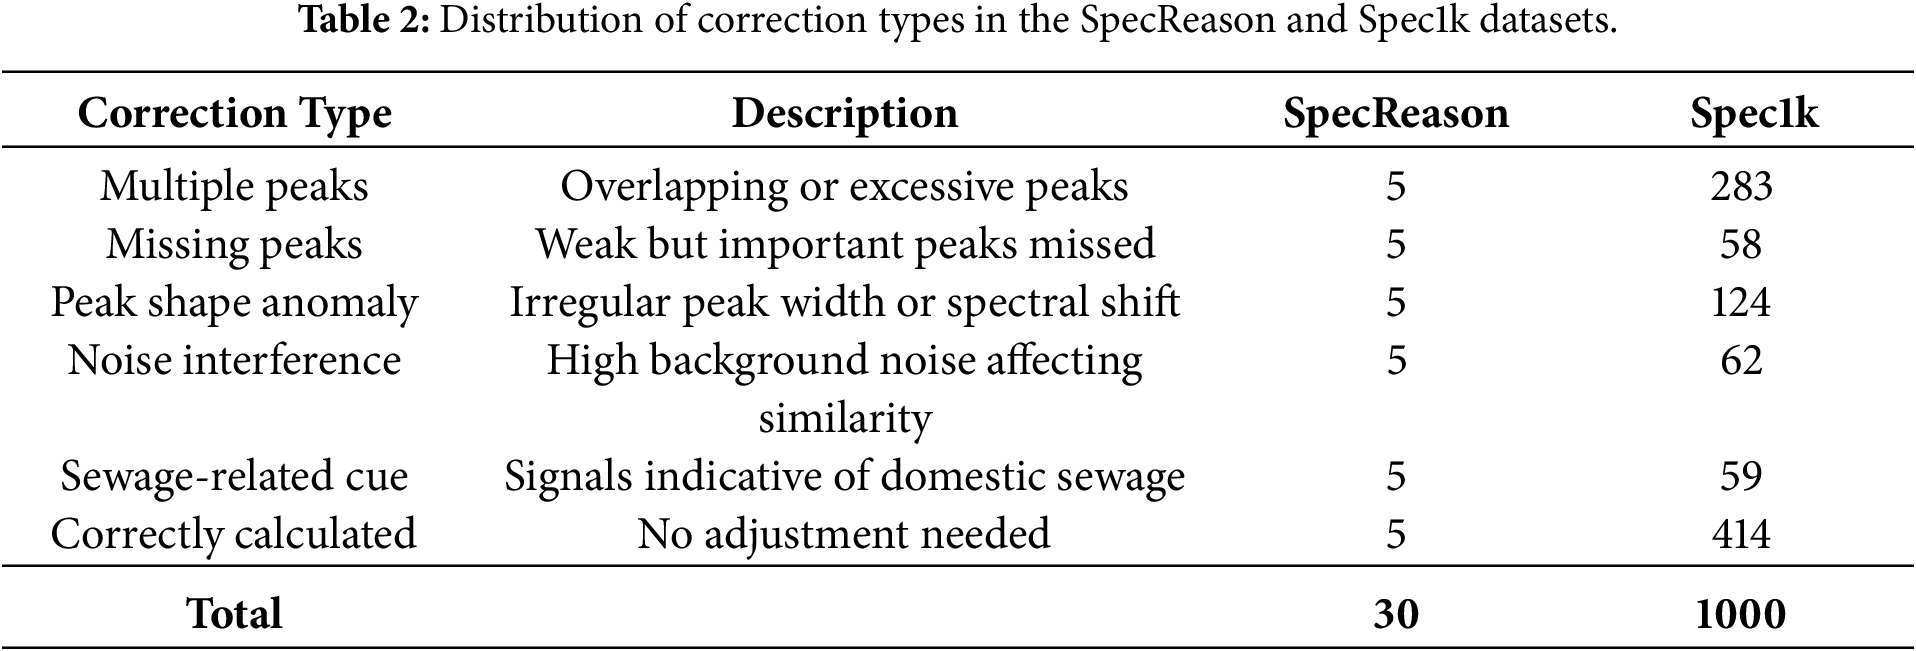
A statistical distribution of correction categories is presented in Table 2. The results show that most expert revisions involve peak overlap and weak-peak diagnostics, underscoring the limitations of purely algorithmic baselines in capturing complex spectral cues and motivating the need for expert-style revision learning. We emphasize that SpecReason and Spec1k are curated datasets and are not intended to be statistically representative of all real-world 3D-EEM pollution scenarios. In particular, SpecReason is intentionally constructed with expert-selected boundary cases to capture correction behavior and elicit expert-style rationales, whereas Spec1k provides broader preference signals but still covers only a limited subset of the full variability encountered in deployment. Such boundary-case curation may introduce a selection bias by over-representing difficult spectra, which can affect calibration and generalization when the test-time distribution differs from the curated set. We therefore view dataset coverage as a limitation and recommend continual data expansion and monitoring in practical use.
3.3 Training Process of FSS-VLM
FSS-VLM is trained to act as an expert agent that replaces the manual expert-review stage in 3D-EEM similarity assessment. Given the same evidence used in expert review, including the spectral image, baseline similarity, and contextual metadata, the expert agent is expected to (i) revise the baseline similarity toward expert judgment and (ii) provide an interpretable explanation. Accordingly, the training procedure consists of three steps: selecting a base VLM, specifying the multimodal input/output format, and optimizing the model in two stages, SFT followed by RLHF.
Base Model Selection. We adopt Qwen2.5-VL [21] as the multimodal backbone due to its strong vision–language capability and fine-grained visual perception, which are important for interpreting weak or overlapping spectral peaks in 3D-EEM images. In addition, our RLHF training framework VERL provides mature and stable support for Qwen2.5-VL, enabling efficient preference alignment and reliable training/inference in our pipeline.
Model Input/Output Format. During FSS-VLM training, each instance consists of two parts: System Instructions and Sample Information. The system instructions define the model as a 3D-EEM spectral similarity expert agent that performs expert-style revision based on multimodal evidence. The sample information integrates (1) paired spectral images (
As shown in Fig. 4, the output format requires the model to generate a <reason> section describing the inference and revision logic, and a <similarity> section providing the refined similarity score. This structured design ensures that the model receives all cues needed for expert-style reasoning and produces both quantitative corrections and qualitative justification.
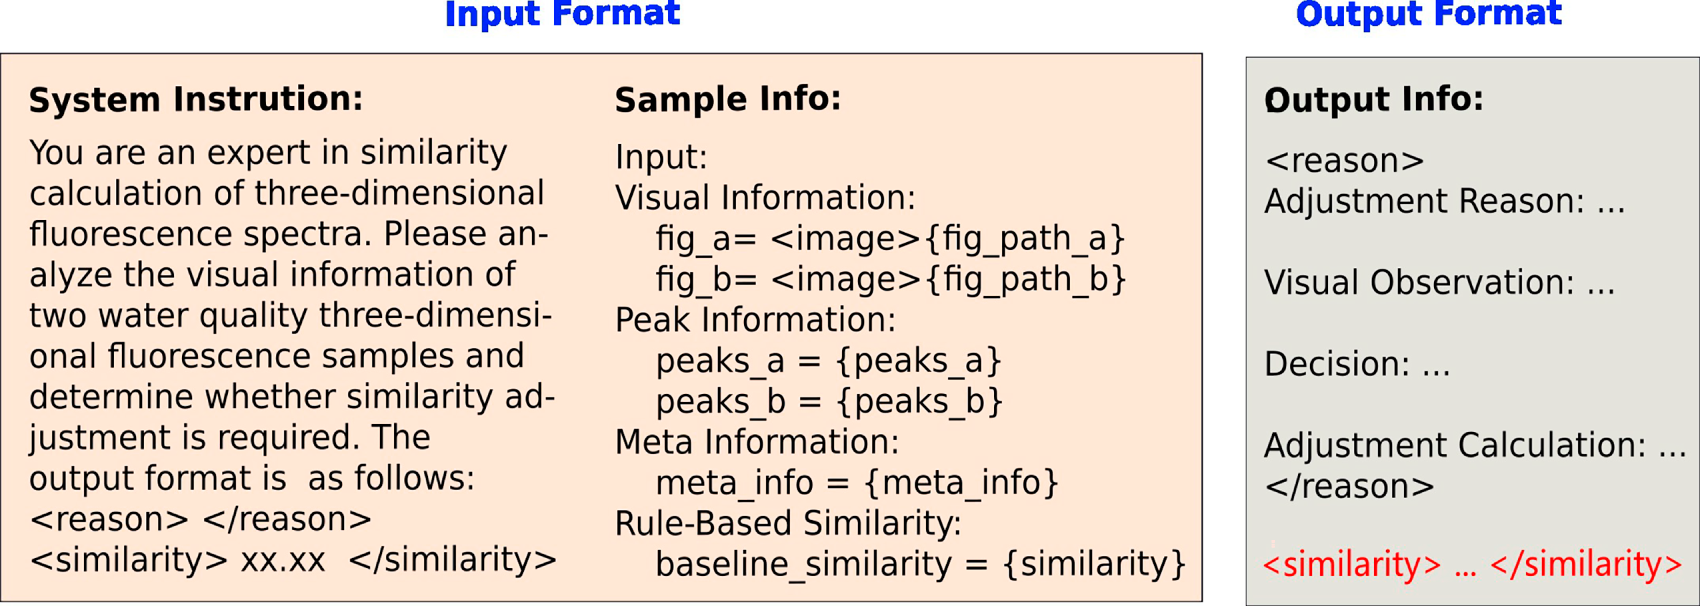
Figure 4: Overview of the structured multimodal prompt used for FSS-VLM training and inference. The prompt consists of two main components: System Instructions, which define the model as a 3D-EEM spectral similarity expert agent, and Sample Information, which integrates spectral images, extracted peak lists, baseline similarity scores, and contextual metadata. The model outputs an expert-style reasoning explanation (<reason>) and a refined similarity score (<similarity>), enabling both quantitative correction and qualitative justification consistent with human experts.
SFT Stage. We first perform supervised fine-tuning as demonstration-based human feedback to teach the model the expert derivation pattern for revising similarity scores. Specifically, we use SpecReason, where each pair contains a step-by-step expert-written derivation that explains how experts combine peak evidence and contextual metadata to justify similarity revision. During SFT, the expert agent is trained to imitate the expert-provided output. We optimize the model with the cross-entropy loss to minimize the divergence between the generated tokens and expert annotations:
where T denotes the length of the target output sequence in tokens (including expert reasoning and the score field), V is the vocabulary size,
RLHF Stage. After SFT, we further align the model’s similarity scores with expert preferences using RLHF with GRPO [22]. Instead of training a separate reward model, we directly quantify human feedback using the expert-accepted similarity scores in Spec1k (1000 pairs). For each pair, the expert-adjusted similarity score on a 0–100 scale is normalized to
We define a single task-specific reward function:
where
where
SFT was implemented using the LLaMAFactory [23] framework for one epoch with a batch size of 16 and an initial learning rate of 4e–5. Training was performed on two NVIDIA A100 GPUs (40 GB each). RLHF was carried out using the VERL [24] framework for 15 epochs, employing the GRPO optimization algorithm. The batch size was 16, the initial learning rate was 2e–5 (decayed to 2e–6 using cosine annealing), and early stopping was applied when validation perplexity failed to improve for three consecutive epochs. RLHF training was executed on eight NVIDIA A800 GPUs (80 GB each), with each epoch requiring approximately 1.2 h. A fixed random seed (42) was used for all experiments to ensure reproducibility. The dataset was split into training, validation, and test sets at a ratio of 8:1:1. To ensure fair comparison, we use the same train/validation/test splits for all methods.
Compared baselines. We compared FSS-VLM with representative non-LLM baselines, including cosine similarity, a distance-based peak-matching method, a random forest regressor (RF), and a CNN-based model. These baselines use two different input modalities: (1) image-based input for CNN, where each sample pair is represented by two rendered 3D-EEM spectral images; and (2) peak-list-based input for cosine, distance, and RF, where each spectrum is represented by its extracted peak list (top-10 peaks ranked by intensity, each peak as
CNN baseline. We adopt an ImageNet-pretrained ResNet50 [25] backbone as the feature extractor, remove the final classification layer, and project the pooled feature into a 128-d embedding via a small MLP. The two embeddings are concatenated and passed to a regression head to output a similarity score, which is scaled to the range
RF baseline. For RF, we use RandomForestRegressor [26] implemented with scikit-learn’s [27] with n_textestimators = 100, max_depth = None, min_samples_split = 2, min_samples_leaf = 1, max_features = ‘sqrt’, random_state = 42. The input is a fixed-length numeric feature vector derived from the two peak lists in a pair (flattened and zero-padded when fewer than 10 peaks are present), and the regressor is trained to predict the expert-adjusted similarity score on the training split. RF uses the default settings from scikit-learn, and no validation tuning was performed.
Cosine and distance baselines. Cosine similarity is computed directly from peak-list-based feature vectors without learning. The distance-based baseline uses bipartite peak matching to align peaks between two spectra, aggregates matched-peak Euclidean distances, adds type-dependent penalties for unmatched peaks (with larger penalties for diagnostically significant peaks), and then maps the aggregated distance to a similarity score in
To comprehensively assess both numerical precision and expert-level consistency, five evaluation metrics were employed: Accuracy@n, Expert Acceptance Rate (EAR), and Mean Absolute Error (MAE). Accuracy@n measures the proportion of samples whose predicted similarity scores (
where
where N is the number of samples, and
MAE quantifies the overall numerical deviation between algorithm predictions and expert labels, defined as:
A smaller MAE indicates closer alignment between algorithmic outputs and expert-adjusted similarity scores. Together, these metrics evaluate both quantitative precision and qualitative alignment between model outputs and expert judgment.
4.3 Compare to Baseline Methods
To evaluate the performance of the proposed FSS-VLM method in calculating Fluorescence Spectroscopy. Similarity, we compared its results with four baseline methods (CNN, RF, cosine similarity, and distance-based similarity) from two perspectives: numerical accuracy and expert agreement. Numerical accuracy was measured using Accuracy@n (Acc@n), and expert consistency was quantified by the EAR metric. Table 3 summarizes the comparative results.
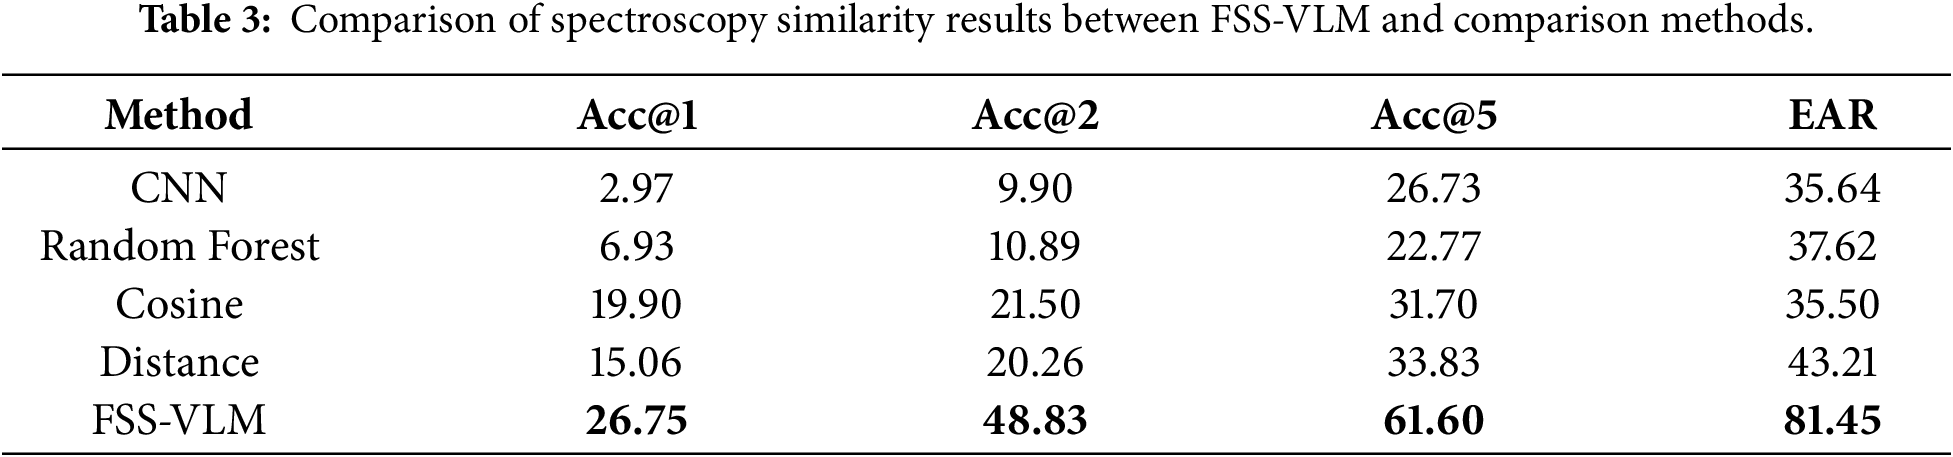
Numerical accuracy. Among traditional approaches, the distance-based similarity algorithm achieved the best performance (Acc@5 = 33.83%) due to its domain-specific weighting of diagnostic fluorescence peaks and adaptive normalization, which enhance weak yet meaningful signals. Nevertheless, as a deterministic method, it cannot incorporate contextual factors such as hydrological background. The FSS-VLM framework further improved accuracy (Acc@1 = 26.75%, Acc@5 = 61.60%) by integrating distance-based similarity with multimodal reasoning. This combination effectively corrected biases and aligned quantitative estimates with expert evaluations.
Expert agreement. The distance-based algorithm also showed the highest agreement among baselines (EAR = 43.21%), suggesting partial reflection of expert logic. In contrast, FSS-VLM achieved an EAR of 81.45%, indicating strong cognitive alignment with human assessment. This improvement stems from its two-stage design, in which the interpretable distance-based prior provides structured numerical cues that the RLHF-optimized vision–language model refines through expert-style reasoning. As a result, FSS-VLM demonstrates enhanced robustness and interpretability, particularly in weak-peak and overlapping-peak scenarios.
Overall, the distance-based similarity offers a physically grounded and interpretable prior that captures diagnostically relevant fluorescence features often overlooked by CNN or RF models. When combined with expert-aligned multimodal learning, FSS-VLM bridges the gap between algorithmic precision and expert cognition, achieving superior accuracy and consistency.
4.4 Evaluation of Different Training Strategies
To assess the effects of supervised reasoning and preference alignment, we compared three training strategies: SFT, RLHF, and their combined SFT+RLHF pipeline. Evaluations were conducted for 3B and 7B model scales.
SFT-only. The SFT strategy employs expert-annotated reasoning chains to guide structured model reasoning. As shown in Table 4, SFT improves interpretability and local precision relative to baseline algorithms, achieving Acc@1 values of 17.85% (3B) and 18.03% (7B), with corresponding EAR values of 48.51% and 53.90%.
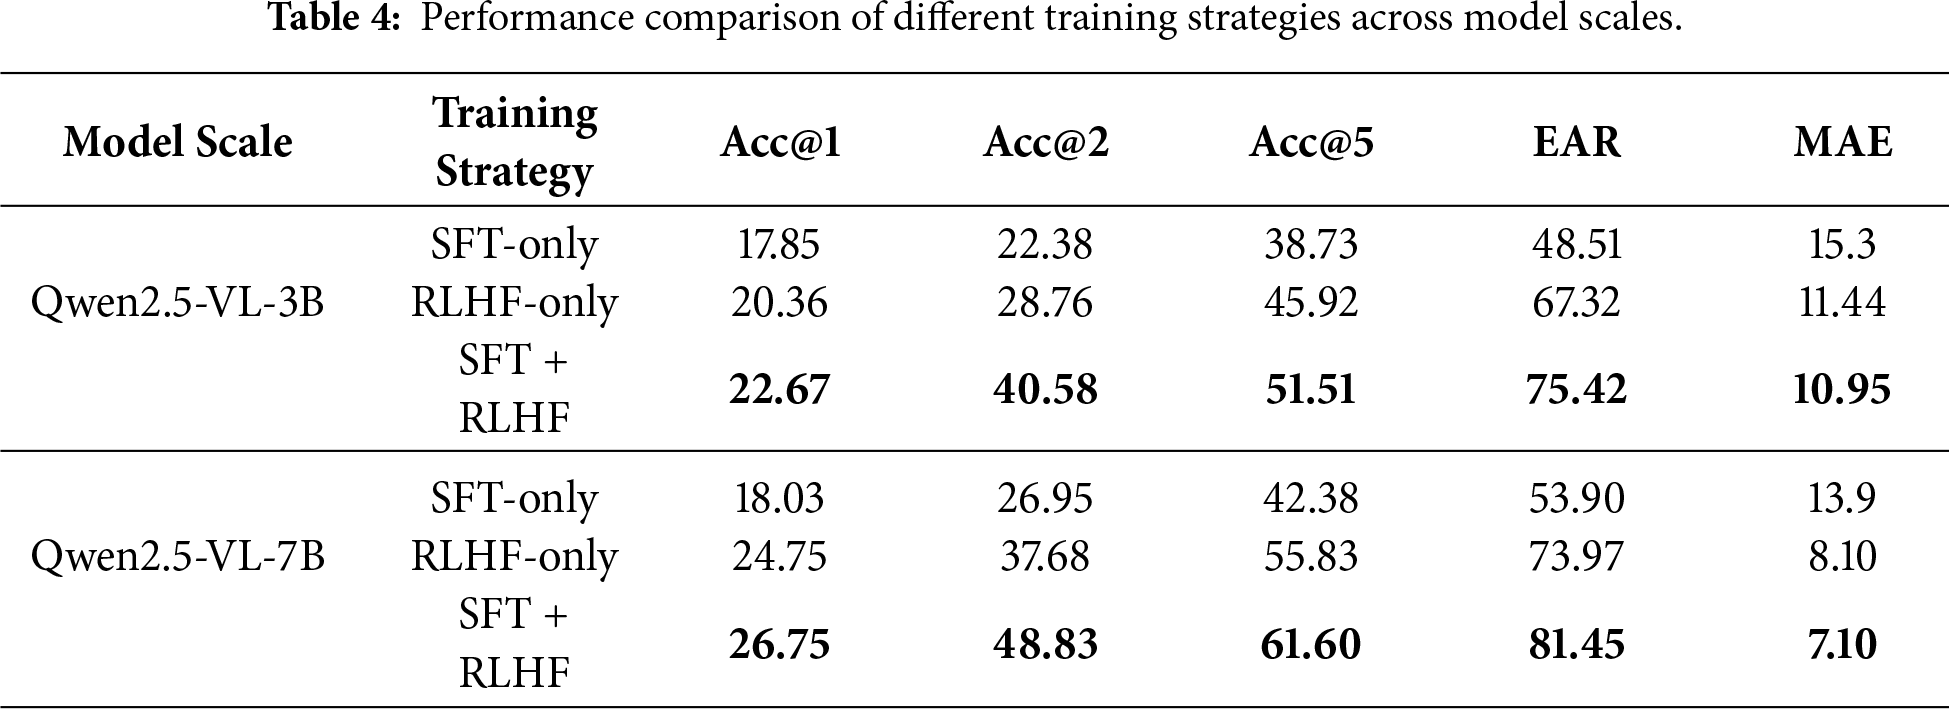
RLHF-only. RLHF optimizes similarity predictions toward expert-corrected similarity scores. The 3B and 7B models achieve Acc@1 values of 20.36% and 24.75%, with EAR values of 72.80% and 79.26%, respectively. Overall, RLHF improves alignment with expert judgments, though the generated reasoning remains less structured than in the SFT-only setting.
SFT + RLHF. Sequentially combining SFT and RLHF yields the best overall performance. For the 3B model, Acc@1 = 22.67% and EAR = 75.42%; for the 7B model, Acc@1 = 26.75% and EAR = 81.45%. These results indicate that SFT helps impart an interpretable reasoning structure, while RLHF aligns the final similarity scores with expert preferences; together, they provide balanced gains in both top-1 accuracy and expert consistency.
An ablation study was conducted to quantify the contribution of different input modalities to the multimodal reasoning process. As shown in Table 5, removing any single modality leads to a noticeable performance drop, indicating that FSS-VLM benefits from complementary cues. In particular, removing the algorithmic similarity causes the most severe degradation for both model sizes, together with a large drop in Acc@1. This suggests that the algorithm-generated similarity provides a strong quantitative prior that anchors the model’s prediction and improves calibration, preventing the model from relying solely on visual patterns.
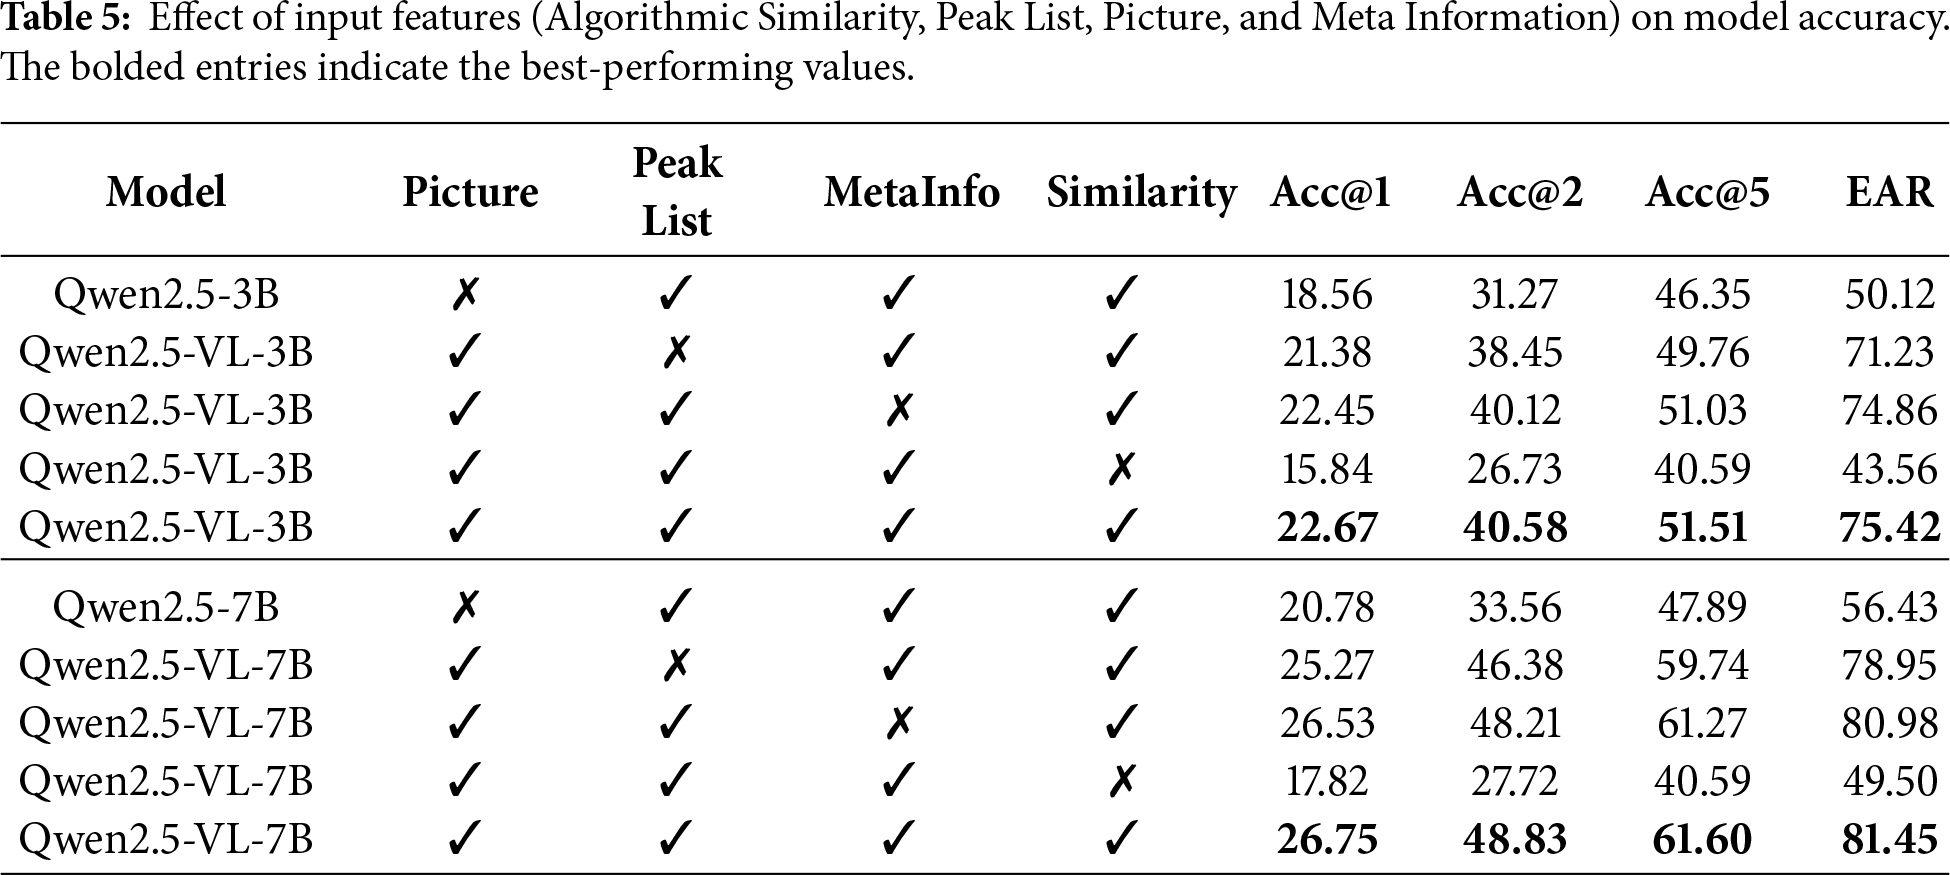
Algorithmic similarity tends to contribute more strongly than meta information because it summarizes coarse global correspondence between spectra in a task-aligned numeric form, serving as a stable anchor when contextual descriptors are incomplete, noisy, or weakly correlated with fluorescence signatures. Meta information becomes more useful when sampling conditions or source context are distinctive and reliably predictive, whereas its marginal benefit is smaller for ambiguous cases where similar metadata can still yield divergent spectral patterns. In contrast, pictures and peak lists become decisive in boundary or mixed-source scenarios, where weak/overlapping peaks and subtle shape differences are diagnostically important and deterministic similarity measures can be misled; fine-grained visual cues and explicit peak evidence help localize which spectral regions drive expert judgments. Moreover, ablating peak lists or meta information also reduces accuracy and EAR, demonstrating that explicit peak evidence and contextual cues contribute additional discriminative information beyond the image alone. Finally, removing the picture modality also harms performance, confirming that fine-grained spectral visual patterns remain essential. Overall, the best results are achieved when all four inputs are provided, validating our design that combines spectral images, peak-based quantitative evidence, contextual metadata, and algorithmic similarity priors for robust expert-aligned similarity assessment.
4.6 Real World Pollution Tracking Example
In September 2025, a municipal sewage treatment plant experienced repeated biochemical system shocks. Emergency sampling was conducted at ten influent points within a 5000 m radius. The two key samples from this incident are shown in Fig. 5. Three dimensional EEM analysis revealed a strong tryptophan like peak at Ex 275/Em 328 nm and a weak shoulder at Ex 275/Em 380 nm, with intensity about 35 percent of the main peak. This shoulder is a key indicator of phenolic industrial effluents. However, the baseline distance based algorithm treated it as background noise and omitted it during peak matching. As a result, the system assigned a similarity score of 79.66 percent and incorrectly attributed the anomaly to domestic sources. Field inspections of residential pipelines found no irregular discharge, highlighting the algorithm’s limitation in detecting low intensity or overlapping peaks.
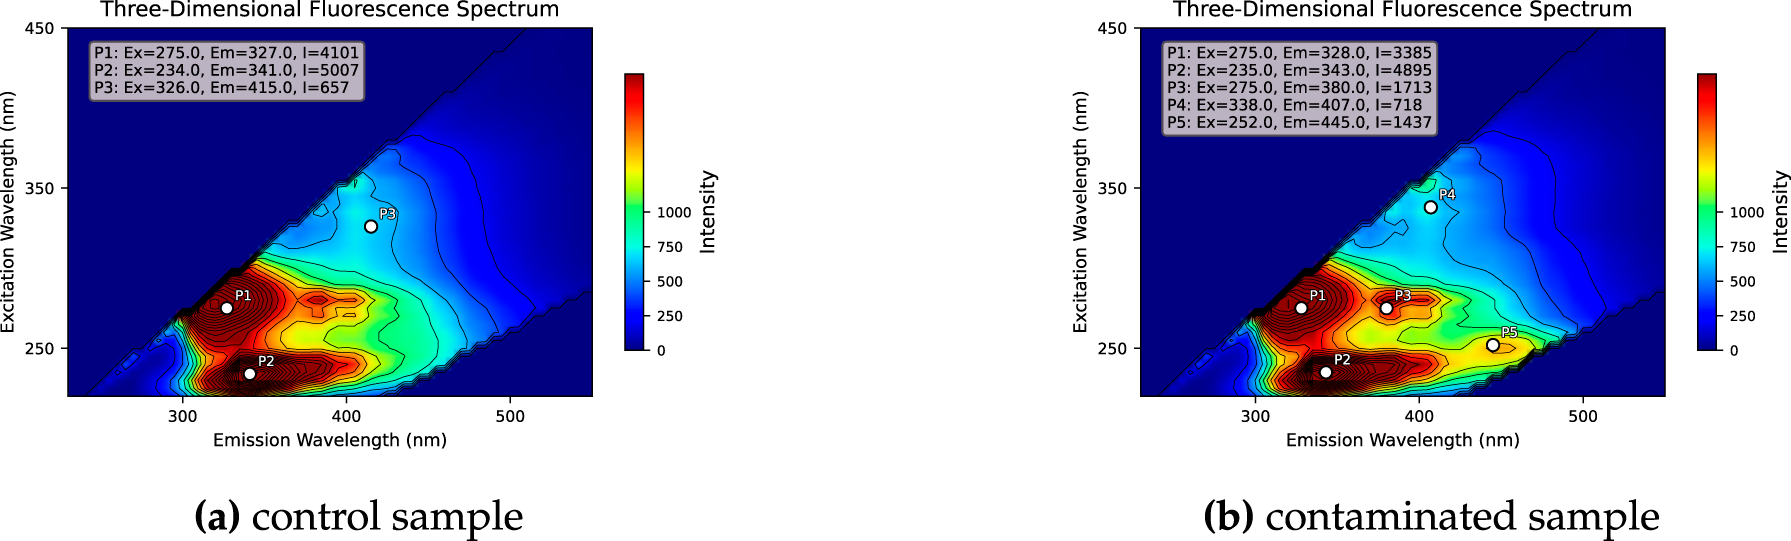
Figure 5: Example of expert-guided similarity correction for a multi-peaked 3D-EEM sample pair. The baseline algorithm assigned a similarity score of 79.66 due to over-weighting minor peak differences, while the FSS-VLM considering positional and intensity consistency of core peaks, corrected the score to 98.35. For quantitative comparison on this case, the expert-corrected similarity is
FSS-VLM evaluated the same sample pair. It identified a previously missed phenolic peak near Ex 252/Em 445 nm. As shown in Fig. 6, the model reconstructed the spectrum with this feature and assigned a corrected similarity of 98.35. Its reasoning emphasized the diagnostic importance of core spectral peaks and contextual metadata, matching patterns in the expert preference dataset. This improvement stemmed from multimodal interpretation rather than numerical adjustment, and the result was later confirmed by on site verification.
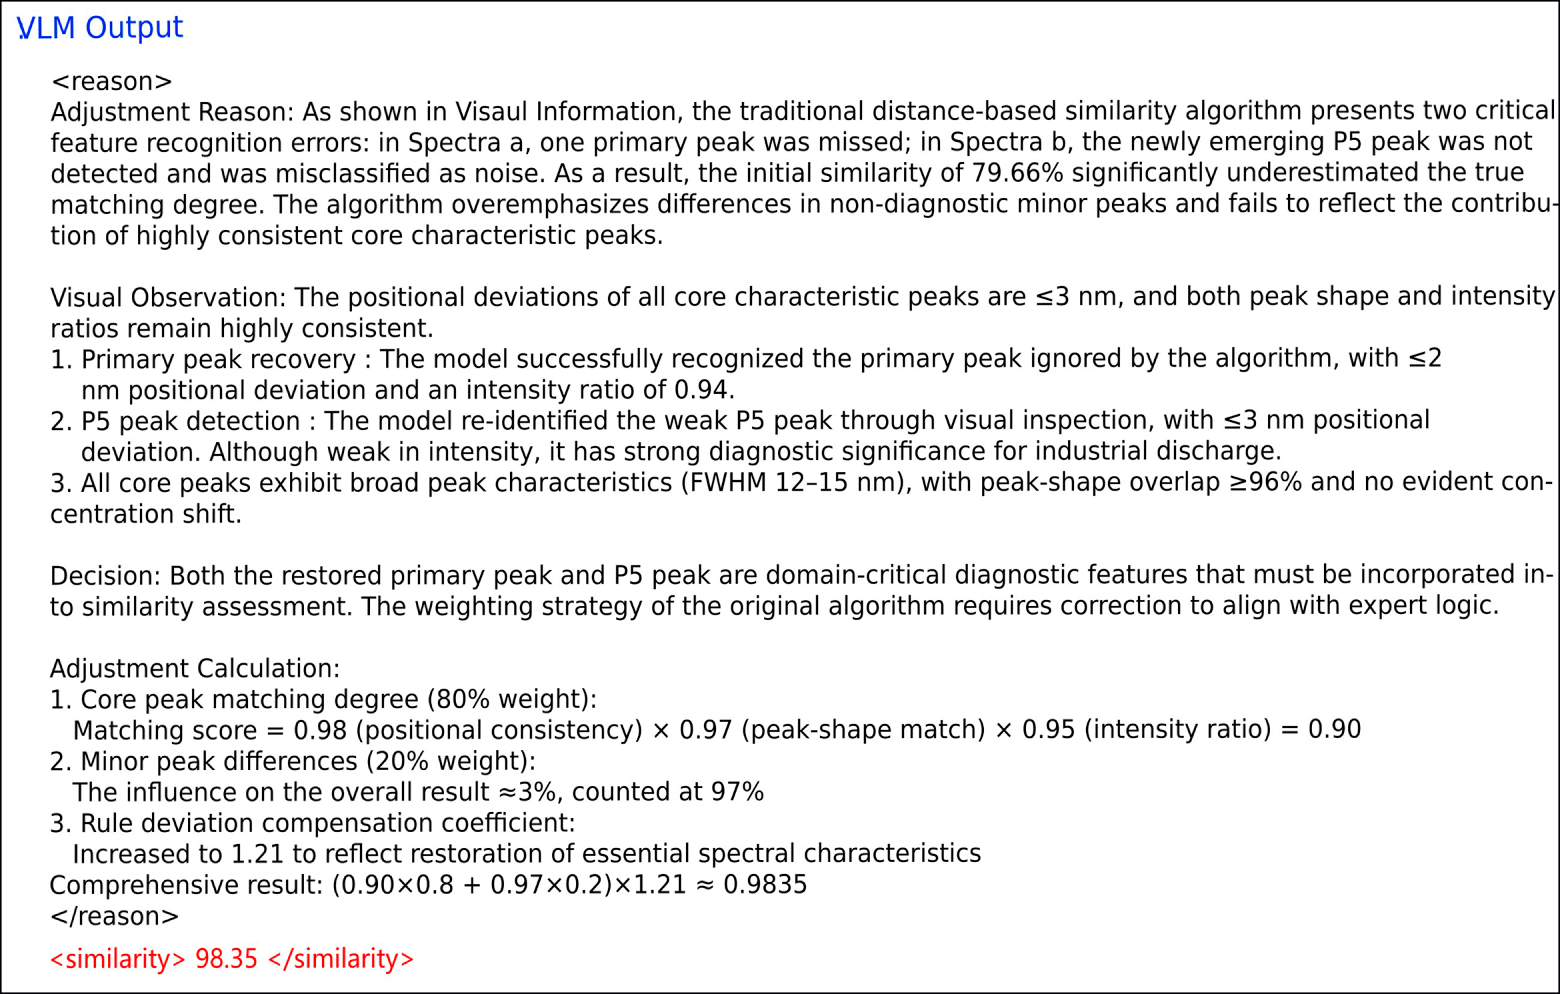
Figure 6: Output of the FSS-VLM for the real world pollution tracking examle.
We presented FSS-VLM, an RLHF-guided multimodal framework for 3D-EEM fluorescence-based pollution source tracing that learns to emulate the manual expert-review stage. By integrating an algorithmic baseline with expert-provided reasoning demonstrations and preference-based alignment, the proposed expert agent produces similarity scores that are both expert-consistent and explainable. Across expert-annotated benchmarks, FSS-VLM substantially improves agreement with human judgment while reducing prediction error compared with widely used non-LLM baselines. Beyond aggregate metrics, the case study highlights the practical value of expert-style reasoning: the model can identify diagnostically weak peaks that are often overlooked by deterministic similarity measures, thereby reducing misclassification risk and mitigating the need for repeated manual review.
Importantly, FSS-VLM is not intended as a fundamentally new learning paradigm, but rather as a workflow-adaptive calibration framework that aligns existing vision–language models with domain-specific expert workflows under few-shot supervision. Its methodological contribution lies in the calibration mechanism that adapts similarity assessment through expert-aligned reasoning and feedback, while its system-level contribution lies in organizing these components into an end-to-end trainable expert agent. Accordingly, this work contributes (i) an expert agent framework that reformulates the traditional human-in-the-loop workflow into a trainable pipeline, (ii) expert-curated datasets capturing both correction behavior and reasoning patterns for supervision and alignment, and (iii) an FSS-VLM that couples similarity outputs with explicit rationales for operational use. While the overall calibration workflow is general, extending FSS-VLM to other spectroscopy modalities or expert-in-the-loop matching tasks is not plug-and-play and would require domain-specific re-design. Future work will explore extending multimodal inputs, such as mass spectrometry, to further strengthen source discrimination in complex and mixed pollution scenarios.
Acknowledgement: The authors would like to thank all individuals who contributed to this study.
Funding Statement: The authors received no specific funding for this study.
Author Contributions: Chenlong Lu, Jiehui Li, Changhua Zhou, Yixin Fan, Xinlin Ren and Ziyi Ju mainly conducted experiments and wrote this manuscript. Tonglin Chen guided the method design and experiments. Wei Wang put forward suggestions for method improvement. All authors reviewed and approved the final version of the manuscript.
Availability of Data and Materials: The data that support the findings of this study are openly available in FSS-VLM at https://github.com/daashuai/FSS-VLM.git.
Ethics Approval: This study did not involve human participants, animals, or any personal or sensitive data. Ethical approval was therefore not required.
Conflicts of Interest: The authors declare no conflicts of interest.
References
1. Murphy KR, Butler KD, Spencer RG, Stedmon CA, Boehme JR, Aiken GR. Measurement of dissolved organic matter fluorescence in aquatic environments: an interlaboratory comparison. Environ Sci Technol. 2010;44(24):9405–12. doi:10.1021/es102362t. [Google Scholar] [PubMed] [CrossRef]
2. Henderson RK, Baker A, Murphy K, Hambly A, Stuetz RM, Khan S. Fluorescence as a potential monitoring tool for recycled water systems: a review. Water Res. 2009;43(4):863–81. doi:10.1016/j.watres.2008.11.027. [Google Scholar] [PubMed] [CrossRef]
3. Shutova Y, Baker A, Bridgeman J, Henderson RK. Spectroscopic characterisation of dissolved organic matter changes in drinking water treatment: from PARAFAC analysis to online monitoring wavelengths. Water Res. 2014;54:159–69. doi:10.1016/j.watres.2014.01.053. [Google Scholar] [PubMed] [CrossRef]
4. Zacharioudaki DE, Fitilis I, Kotti M. Review of fluorescence spectroscopy in environmental quality applications. Molecules. 2022;27(15):4801. doi:10.3390/molecules27154801. [Google Scholar] [PubMed] [CrossRef]
5. Ministry of Ecology and Environment of the People’s Republic of China. Technical guideline for supervision and management of sewage outfalls into environmental water bodies—source tracing of aqueous fluorescence fingerprint methods. Ministry of Ecology and Environment of the People’s Republic of China; 2024. HJ 1407-2024. (In Chinese). [cited 2026 Jan 10]. Available from: https://www.mee.gov.cn/ywgz/fgbz/bz/bzwb/other/qt/202501/W020250122357063635049.pdf. [Google Scholar]
6. Zhang Y, Liang X, Wang Z, Xu L. A novel approach combining self-organizing map and parallel factor analysis for monitoring water quality of watersheds under non-point source pollution. Sci Rep. 2015;5(1):16079. doi:10.1038/srep16079. [Google Scholar] [PubMed] [CrossRef]
7. Tang J, Wu J, Li Z, Cheng C, Liu B, Chai Y, et al. Novel insights into variation of fluorescent dissolved organic matters during antibiotic wastewater treatment by excitation emission matrix coupled with parallel factor analysis and cosine similarity assessment. Chemosphere. 2018;210:843–8. doi:10.1016/j.chemosphere.2018.07.068. [Google Scholar] [PubMed] [CrossRef]
8. Peer S, Vybornova A, Saracevic Z, Krampe J, Zoboli O. Source-tracing of industrial and municipal wastewater effluent in river water via fluorescence fingerprinting. Sci Total Environ. 2025;959:178187. doi:10.1016/j.scitotenv.2024.178187. [Google Scholar] [PubMed] [CrossRef]
9. Liu D, Nie L, Xi B, Gao H, Yang F, Yu H. A novel-approach for identifying sources of fluvial DOM using fluorescence spectroscopy and machine learning model. npj Clean Water. 2024;7(1):79. doi:10.1038/s41545-024-00370-1. [Google Scholar] [CrossRef]
10. Cai W, Ye C, Ao F, Xu Z, Chu W. Emerging applications of fluorescence excitation-emission matrix with machine learning for water quality monitoring: a systematic review. Water Res. 2025;277(4):123281. doi:10.1016/j.watres.2025.123281. [Google Scholar] [PubMed] [CrossRef]
11. Ouyang L, Wu J, Jiang X, Almeida D, Wainwright C, Mishkin P, et al. Training language models to follow instructions with human feedback. Adv Neural Inform Process Syst. 2022;35:27730–44. doi:10.52202/079017-4366. [Google Scholar] [CrossRef]
12. Ziegler DM, Stiennon N, Wu J, Brown TB, Radford A, Amodei D, et al. Fine-tuning language models from human preferences. arXiv:1909.08593. 2019. [Google Scholar]
13. Achiam J, Adler S, Agarwal S, Ahmad L, Akkaya I, Aleman FL, et al. Gpt-4 technical report. arXiv:2303.08774. 2023. [Google Scholar]
14. Hallal K, Hamdan R, Tlais S. Exploring the potential of AI-Chatbots in organic chemistry: an assessment of ChatGPT and Bard. Comput Educat Artif Intell. 2023;5:100170. doi:10.1016/j.caeai.2023.100170. [Google Scholar] [CrossRef]
15. Sun Z, Shen S, Cao S, Liu H, Li C, Shen Y, et al. Aligning large multimodal models with factually augmented RLHF. arXiv:2309.14525. 2023. [Google Scholar]
16. Zhai S, Bai H, Lin Z, Pan J, Tong P, Zhou Y, et al. Fine-tuning large vision-language models as decision-making agents via reinforcement learning. Adv Neural Inform Process Syst. 2024;37:110935–71. doi:10.52202/079017-3522. [Google Scholar] [CrossRef]
17. Chahe A, Zhou L. ReasonDrive: efficient visual question answering for autonomous vehicles with reasoning enhanced small vision language models. arXiv:2504.10757. 2025. [Google Scholar]
18. Wang X, Zhang M, Liu L, Wang Z, Lin K. Using EEM-PARAFAC to identify and trace the pollution sources of surface water with receptor models in Taihu Lake Basin. China J Environ Manag. 2022;321:115925. doi:10.1016/j.jenvman.2022.115925. [Google Scholar] [PubMed] [CrossRef]
19. Xu RZ, Cao JS, Luo JY, Ni BJ, Fang F, Liu W, et al. Attention improvement for data-driven analyzing fluorescence excitation-emission matrix spectra via interpretable attention mechanism. npj Clean Water. 2024;7(1):73. doi:10.1038/s41545-024-00367-w. [Google Scholar] [CrossRef]
20. DeepSeek-AI, Guo D, Yang D, Zhang H, Song J, Zhang R, et al. DeepSeek-R1: incentivizing reasoning capability in LLMs via reinforcement learning. In: Technical report. DeepSeek-AI; 2025. [cited 2025 Jan 20]. Available from: https://github.com/deepseek-ai/DeepSeek-R1/blob/main/DeepSeek_R1.pdf. [Google Scholar]
21. Bai S, Chen K, Liu X, Wang J, Ge W, Song S, et al. Qwen2.5-VL technical report. arXiv:2502.13923. 2025. [Google Scholar]
22. Shao Z, Wang P, Zhu Q, Xu R, Song J, Bi X, et al. DeepSeekMath: pushing the limits of mathematical reasoning in open language models. arXiv:2402.03300. 2024. [Google Scholar]
23. Zheng Y, Zhang R, Zhang J, Ye Y, Luo Z. LlamaFactory: unified efficient fine-tuning of 100+ language models. In: Proceedings of the 62nd Annual Meeting of the Association for Computational Linguistics. Volume 3: System Demonstrations. Bangkok, Thailand: Association for Computational Linguistics; 2024. p. 400–10. doi:10.18653/v1/2024.acl-demos.38. [Google Scholar] [CrossRef]
24. Sheng G, Zhang C, Ye Z, Wu X, Zhang W, Zhang R, et al. HybridFlow: a flexible and efficient RLHF framework. In: Proceedings of the Twentieth European Conference on Computer Systems; 2025 Mar 30–Apr 3; Rotterdam, The Netherlands. p. 1279–97. [Google Scholar]
25. He K, Zhang X, Ren S, Sun J. Deep residual learning for image recognition. In: Proceedings of the IEEE Conference on Computer Vision and Pattern Recognition (CVPR); 2016 Jun 27–30; Las Vegas, NV, USA. p. 770–8. [Google Scholar]
26. Breiman L. Random forests. Mach Learn. 2001;45(1):5–32. doi:10.1023/a:1010933404324. [Google Scholar] [CrossRef]
27. Pedregosa F, Varoquaux G, Gramfort A, Michel V, Thirion B, Grisel O, et al. Scikit-learn: machine learning in python. J Mach Learn Res. 2011;12:2825–30. [Google Scholar]
Cite This Article
 Copyright © 2026 The Author(s). Published by Tech Science Press.
This work is licensed under a Creative Commons Attribution 4.0 International License , which permits unrestricted use, distribution, and reproduction in any medium, provided the original work is properly cited.
 Downloads
 Citation Tools