
 Submit a Paper
 Propose a Special lssue
 Open Access
ARTICLE
Quantum-Inspired Optimization Algorithm for 3D Multi-Objective Base-Station Deployment in Next-Generation 5G/6G Wireless Network
1 Department of Computer Science and Information Engineering, National Chi Nan University, Puli, 54561, Taiwan
2 Department of Information Management, National Yunlin University of Science and Technology, Douliu, 640, Taiwan
* Corresponding Author: Shu-Yu Kuo. Email:
(This article belongs to the Special Issue: Heuristic Algorithms for Optimizing Network Technologies: Innovations and Applications)
Computers, Materials & Continua 2026, 87(2), 41 https://doi.org/10.32604/cmc.2025.075705
Received 06 November 2025; Accepted 15 December 2025; Issue published 12 March 2026
 View Full Text
 Download PDF
Abstract
The rapid growth of mobile and Internet of Things (IoT) applications in dense urban environments places stringent demands on future Beyond 5G (B5G) or Beyond 6G (B6G) networks, which must ensure high Quality of Service (QoS) while maintaining cost-efficiency and sustainable deployment. Traditional strategies struggle with complex 3D propagation, building penetration loss, and the balance between coverage and infrastructure cost. To address this challenge, this study presents the first application of a Global-best Guided Quantum-inspired Tabu Search with Quantum-Not Gate (GQTS-QNG) framework for 3D base-station deployment optimization. The problem is formulated as a multi-objective model that simultaneously maximizes coverage and minimizes deployment cost. A binary-to-decimal encoding mechanism is designed to represent discrete placement coordinates and base station types, leveraging a quantum-inspired method to efficiently search and refine solutions within challenging combinatorial environments. Global-best guidance and tabu memory are integrated to strengthen convergence stability and avoid revisiting previously explored solutions. Simulation results across user densities ranging from 1000 to 10,000 show that GQTS-QNG consistently finds deployment configurations achieving full coverage while reducing deployment cost compared with the state-of-the-art algorithms under equal iteration times. Additionally, our method generates well-distributed and structured Pareto fronts, offering diverse planning options that allow operators to flexibly balance cost and performance requirements. These findings demonstrate that GQTS-QNG is a scalable and efficient algorithm for sustainable 3D cellular network deployment in B5G/6G urban scenarios.Keywords
The accelerated evolution of wireless communications and the Internet of Things (IoT) has led to an exponential surge in data traffic. Addressing this capacity demand typically requires a denser deployment of base stations, which raises critical issues concerning network complexity and expensive construction costs. To meet these demands sustainably, next-generation wireless networks, particularly B5G and 6G, must focus on a critical balance between network performance (e.g., QoS, coverage rate [1], and RSSI) and sustainability (e.g., deployment cost, energy efficiency [2], and carbon footprint reduction). This is particularly challenging in dense urban and complex environments where the use of millimeter waves (mm Wave) in 5G/B5G, while offering high data rates, suffers from limited coverage and high susceptibility to interference from buildings. The complexity of these environments necessitates a 3D cellular deployment strategy [3], integrating macro-cells and various types of small cells in an Ultra-Dense Heterogeneous Network (UDHN) architecture [4]. The deployment problem is therefore inherently a Multi-Objective Optimization (MOO) problem, requiring the simultaneous maximization of performance indicators like RSSI and coverage rate, and the minimization of sustainability indicators such as deployment cost. Moreover, real-world constraints, such as the significant penetration loss caused by different building materials and the requirement for wireless backhaul connectivity between small cells and macro cells, must be explicitly considered in the deployment model. Previous metaheuristic algorithms, such as Particle Swarm Optimization (PSO) [5], Genetic Algorithm (GA) [6], and Non-dominated Sorting Genetic Algorithm II (NSGA-II) [7] have been widely applied to solve complex network deployment problems and achieved notable results. However, these algorithms often face significant limitations, like premature convergence in large-scale and high computational complexity.
Therefore, the multi-objective deployment problem necessitates an advanced optimization framework capable of meeting the stringent requirements of UDHN. This framework must offer superior search capability and robust diversity maintenance. Furthermore, it must be adept at balancing exploitation and exploration among base station locations to effectively map the entire Pareto optimal set. This paper applies the GQTS-QNG to the 3D base-station deployment problem for the first time, incorporating domain-specific encoding and modeling to support realistic B5G/6G urban environments. GQTS-QNG is inspired by the Quantum-inspired Tabu Search (QTS) algorithm, which has demonstrated strong performance in both classical combinatorial optimization problems [8] and real-world applications [9]. By integrating quantum mechanism, such as entanglement and superposition, GQTS-QNG enhances both global exploration and local exploitation, avoids premature convergence, and maintains solution diversity across generations. Consequently, the proposed method effectively addresses the limitations of existing metaheuristic algorithms, offering a more robust and sustainable solution for multi-objective network deployment optimization.
The main contributions of this paper are summarized as follows:
1. To the best of our knowledge, this study is the first to introduce GQTS-QNG to the 3D base-station deployment problem in B5G/6G networks, demonstrating the algorithm’s applicability and potential in complex large-scale telecommunication planning tasks.
2. A problem-specific binary-to-decimal encoding and solution representation scheme is designed to model discrete 3D coordinates and multi-tier base-station types, ensuring GQTS-QNG can effectively operate in the spatial and propagation-constrained environment in B5G/6G deployment.
3. Extensive simulations across multiple user-density scenarios validate that GQTS-QNG consistently achieves full coverage with competitive deployment cost and generates smooth Pareto fronts, confirming its stability, scalability, and practicality for next-generation network planning.
The remainder of this paper is organized as follows. Section 2 reviews the related work, including existing 3D cell deployment algorithms and the development of the GQTS-QNG. Section 3 presents the formulation of the 3D multi-objective network deployment problem, including the network model, objective variables, and mathematical definitions. Section 4 introduces the proposed method in detail, covering the encoding scheme, measurement, construct Pareto front, the quantum-Not gate operation, and the quantum matrix update. Section 5 describes the experimental setup, performance comparisons with benchmark algorithms, and self-analysis of the results. Section 6 concludes the paper.
The optimization of cell (base station) deployment in Heterogeneous Networks (HetNet) has been extensively studied in recent years. For clarity, the related literature is divided into two categories: 3D cell deployment problems solved by metaheuristic algorithms, and application studies of the GQTS-QNG. The first category focuses on the complex 3D cell deployment problem, reviewing prior studies that employ metaheuristic algorithms to address key multi-objective metrics such as the number of base stations, energy efficiency, coverage, and deployment cost [10]. The notable metaheuristic approaches discussed above will be examined in detail in Section 2.1. The second category explores the application fields of the GQTS-QNG, which has demonstrated high efficiency in solving complex optimization problems across various domains. Building on these foundations, our proposed framework for 3D cell deployment strategy is fundamentally based on these studies and will be presented in Section 2.2.
2.1 3D Cell Deployment Problems
Previous metaheuristic optimization algorithms, including PSO [11] and Ant Colony Optimization (ACO) [12], have been widely applied to optimize sensor node placement and enhance network coverage in wireless and heterogeneous systems. These algorithms are grounded in swarm intelligence behavior, enabling collective learning and adaptive search across complex optimization landscapes. PSO models the social interaction and information sharing among particles to efficiently explore continuous search spaces. ACO simulates the pheromone-based communication of ants to construct optimal paths, demonstrating strong capabilities in network routing, clustering, and connectivity optimization. Grey Wolf Optimizer (GWO), inspired by the hierarchical hunting strategy of grey wolves, maintains a balance between exploration and exploitation to achieve competitive results. Collectively, these swarm-intelligence-based algorithms have provided a solid foundation for wireless network optimization.
In recent years, significant advancements in metaheuristic optimization have extended traditional (swarm intelligence based) algorithms through the integration of quantum-inspired mechanisms. These developments have led to the design of quantum-inspired optimization frameworks that enhance convergence efficiency and adaptability in complex deployment environments, such as QTS algorithm and Multi-Objective Quantum Tabu Search (MOQTS) [13]. Moreover, the classical GWO algorithm has been further refined through the incorporation of chaotic maps and adaptive control strategies, which improve the balance between exploration and exploitation, as illustrated by the Improved Chaotic Grey Wolf Optimization (ICGWO) algorithm [10]. The continuous evolution of these metaheuristic techniques provides robust and flexible models for addressing complex multi-objective challenges, particularly in three-dimensional base station deployment and the development of efficient and sustainable 5G/6G network architectures.
2.2 Global-Best Guided Quantum-Inspired Tabu Search with Quantum-Not Gate Algorithm
GQTS-QNG introduced a hybrid optimization framework that integrates the quantum state superposition principle with the tabu search mechanism, effectively combining the global exploration capability of quantum-inspired state encoding with the adaptive memory-based refinement process of tabu search. Through probabilistic solution encoding and dynamic tabu restrictions, QTS enhances population diversity and avoids premature convergence, achieving high-quality results in complex combinatorial problems such as financial portfolio optimization and reversible circuit design. Building upon this foundation, the GQTS-QNG algorithm extends the QTS framework to handle problems with multiple conflicting objectives. By incorporating quantum-inspired state encoding and a multi-objective evaluation process, GQTS-QNG effectively balances convergence precision and solution diversity. Its probabilistic search dynamics allow the algorithm to explore a broader search space while retaining elite solution characteristics through tabu-based memory control. This hybrid structure enables GQTS-QNG to produce well-distributed Pareto-optimal solutions and demonstrates strong potential for complex optimization applications.
In ultra-dense B5G/6G networks, the three-dimensional (3D) cell deployment problem is modeled as an MOO problem, where the goal is to determine the optimal placement of macro and small cells that maximizes network coverage rate, minimizes deployment cost, and maintains stable RSSI, thereby achieving sustainable and efficient network performance. The formulations presented in Eqs. (1)–(27) are derived based on the model proposed in [14,15].
The network topology is modeled in a 3D coordinate space, consisting of a set of base stations, users, and buildings that may obstruct the signal path. The geometric relationship among these entities is illustrated in Fig. 1. Let N be the number of base stations (S), K is the number of users (U), B is the number of buildings,
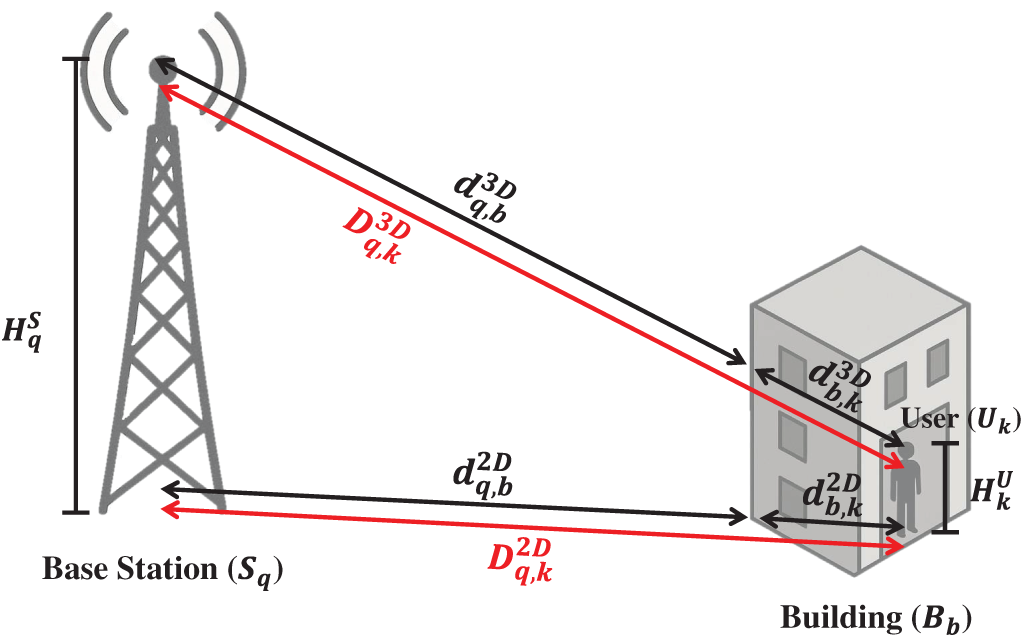
Figure 1: Illustration of the segmented 2D and 3D propagation paths between a base station, a building, and a user
To characterize the 3D propagation distance between a base station and a user, the total path is divided into two segments: (i) the distance from the base station to the outer wall of the building, and (ii) the distance from the inner wall of the building to the user. This decomposition allows the model to describe both outdoor-to-indoor and indoor-to-outdoor transmission scenarios. The total 3D distance can thus be expressed as Eq. (1), where D denotes the total distance,
Similarly, the 2D projection of the total propagation path is defined to represent the horizontal distance between the base station and the user as Eq. (2), where
The complete 3D distance is then derived as the Euclidean distance between the base station and the user, which is expressed as a function of the 2D horizontal distance and the vertical height difference between the base station and the user as Eq. (3), where
The optimal base-station deployment problem seeks to achieve a balanced trade-off solution among multiple conflicting objectives, among normal indicators of network deployment problem, including signal coverage [16,17], energy efficiency, and received signal strength. In this study, two primary objectives are considered: maximizing the average RSSI and maximizing coverage rate, while also minimizing the deployment cost. Let
subject to:
In Eq. (5),
In Eq. (6),
To be closer to reality, we have some constraint such as Eqs. (7) and (8). In Eq. (7),
These objectives collectively aim to improve service quality while maintaining network efficiency and sustainability.
3.2.1 Received Signal Strength Indicator, RSSI
The average RSSI across all users is defined in Eq. (9), where
The total path loss
(a) Macro Cell Model
The macro cell model characterizes large-scale signal propagation between a macro base station and a user under both LOS and NLOS conditions. In wireless communication systems, LOS conditions indicate that a direct propagation path exists between the transmitter and receiver without any physical obstruction, resulting in a more stable signal and lower attenuation. In contrast, NLOS conditions occur when the direct signal path is blocked by obstacles such as buildings or other structures, leading to additional signal degradation caused by reflection, diffraction, and scattering. These two propagation modes are fundamental in determining the appropriate path loss formulation, as they represent distinct environmental propagation behaviors. The path loss of macro cells, denoted as
The breakpoint distance
(b) Small Cell Model
The small cell model characterizes the short-range propagation between a small base station (
In this model,
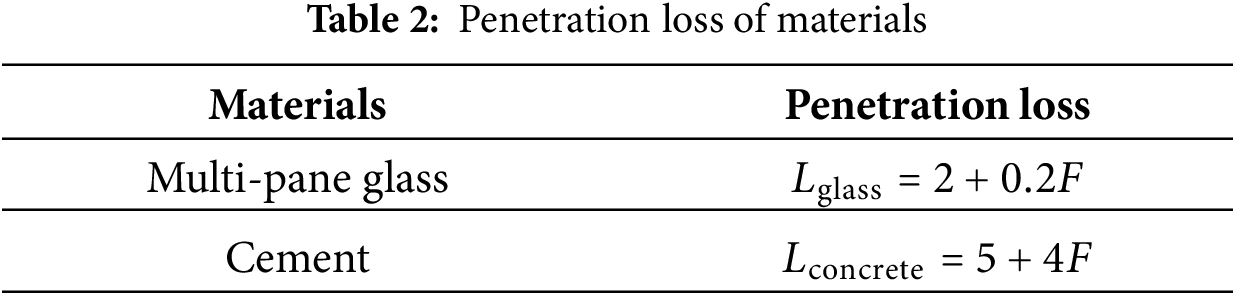
(c) Penetration and Indoor Path Loss
The total path loss
The penetration loss
Furthermore, the indoor path loss component
3.2.2 Signal Coverage Indicator
In cellular network planning, ensuring that users maintain continuous and reliable connectivity is one of the fundamental design goals. Among various performance indicators, the coverage rate plays a crucial role, as shown in Eq. (26). It quantifies the proportion of users that are effectively served by at least one base station.
For each user
3.2.3 Base Station Deployment Cost
The deployment cost is a critical factor from the operator’s perspective, as it directly affects both the economic efficiency and the scalability of network expansion. Even under the same total cost, the coverage and RSSI performance may vary significantly depending on the placement and type of deployed base stations. Therefore, in addition to maximizing coverage and signal quality, cost optimization must also be considered to achieve a balanced and sustainable network design. The total deployment cost of the network is primarily determined by the number and types of base stations installed. Let
In Eq. (27), this formulation captures the cumulative deployment cost of heterogeneous base stations, allowing the optimization model to balance financial expenditure against network performance objectives such as coverage and received signal strength.
The proposed method integrates GQTS-QNG into the 3D base-station deployment problem through four steps. A binary-to-decimal encoding scheme maps network configurations into discrete search states. A multi-objective fitness function evaluates coverage and deployment cost. A Quantum-Not gate operator enhances search diversity and helps escape local optima, while the Q-matrix update mechanism reinforces high-quality solutions using global-best guidance and tabu memory.
In this study, the spatial deployment of base stations is represented through a binary encoding scheme designed to facilitate efficient evolutionary optimization. Each base station (
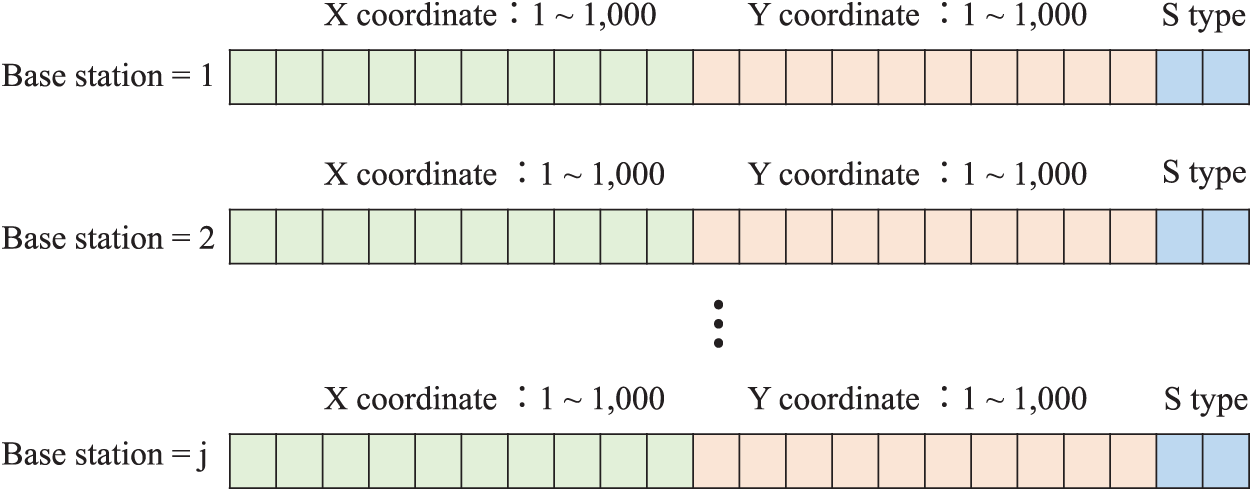
Figure 2: Encode method
The deployment region is defined as a
The final 2 bits encode the base-station type, where the binary patterns 00, 01, 10, and 11 correspond to Macro Cell, Small Cell 1, Small Cell 2, and Small Cell 3, respectively. Base stations may be located on outdoor utility poles, rooftops, or indoor ceilings throughout the environment.
After the encoding stage, each candidate deployment configuration is generated through a measurement procedure based on the Q-matrix,
At initialization, all probability values
Here,
This probabilistic sampling mechanism allows GQTS-QNG to explore diverse solution states in early iterations and gradually concentrate probability mass on promising patterns as the Q-matrix evolves, enabling an effective balance between exploration and exploitation in high-dimensional combinatorial search spaces.
After the measurement stage, each candidate deployment solution
To assess comparative performance among solutions, the dominance relation is employed as defined in Eq. (30). Specifically, a solution
By applying this dominance criterion, GQTS-QNG identifies a set of non-dominated solutions that constitute the Pareto front. Solutions on the Pareto front represent effective trade-offs between maximizing network coverage and minimizing deployment expenditure, offering multiple feasible deployment configurations for 3D base-station planning under varying network design priorities.
4.4 Quantum-Not Gate Operation
To enhance exploration capability and prevent premature convergence, a Quantum-Not gate mechanism is incorporated into GQTS-QNG. The purpose of this operator is to enable the algorithm to escape local optima by reversing selected probability amplitudes in the Q-matrix.
In each iteration, the global-best solution
In each generation, the Quantum-Not gate evaluation is conducted, and when the condition in Eq. (31) is met, the probability inversion is triggered to guide solutions closer to the gbest region and prevent local stagnation. This conditional inversion mechanism increases the probability of selecting promising solution states while suppressing inferior search directions, enabling rapid deviation from local optima and accelerating convergence toward the global best solution.
The core concept of the GQTS-QNG update rule follows a principle, promote promising states while discouraging inferior ones, where the algorithm favors promising solution patterns and suppresses inferior ones. For each bit position, if the two solutions differ, the probability value in the Q-matrix is adjusted by a rate
Compared with previous QTS variants, the proposed GQTS-QNG introduces a global-best guided update rule and a Quantum-Not gate operator. The global-best guidance accelerates convergence toward the Pareto front by steering solutions toward promising regions, while the Quantum-Not gate mechanism allows the algorithm to escape from local optima when a better solution is found. Collectively, these mechanisms enable GQTS-QNG to efficiently find Pareto-optimal solutions while maintaining diversity in the multi-objective setting.
This section evaluates the performance of the GQTS-QNG algorithm in realistic 3D urban deployment scenarios. We first introduce the simulation settings and parameter configurations, followed by performance comparisons with state-of-the-art algorithms under equal evaluation times. Finally, we analyze the obtained Pareto-optimal solutions to illustrate the scalability and decision flexibility of GQTS-QNG across different user densities, where the global-best guidance and Quantum-Not gate mechanisms jointly contribute to maintaining convergence stability and solution diversity.
The experiments are conducted in a
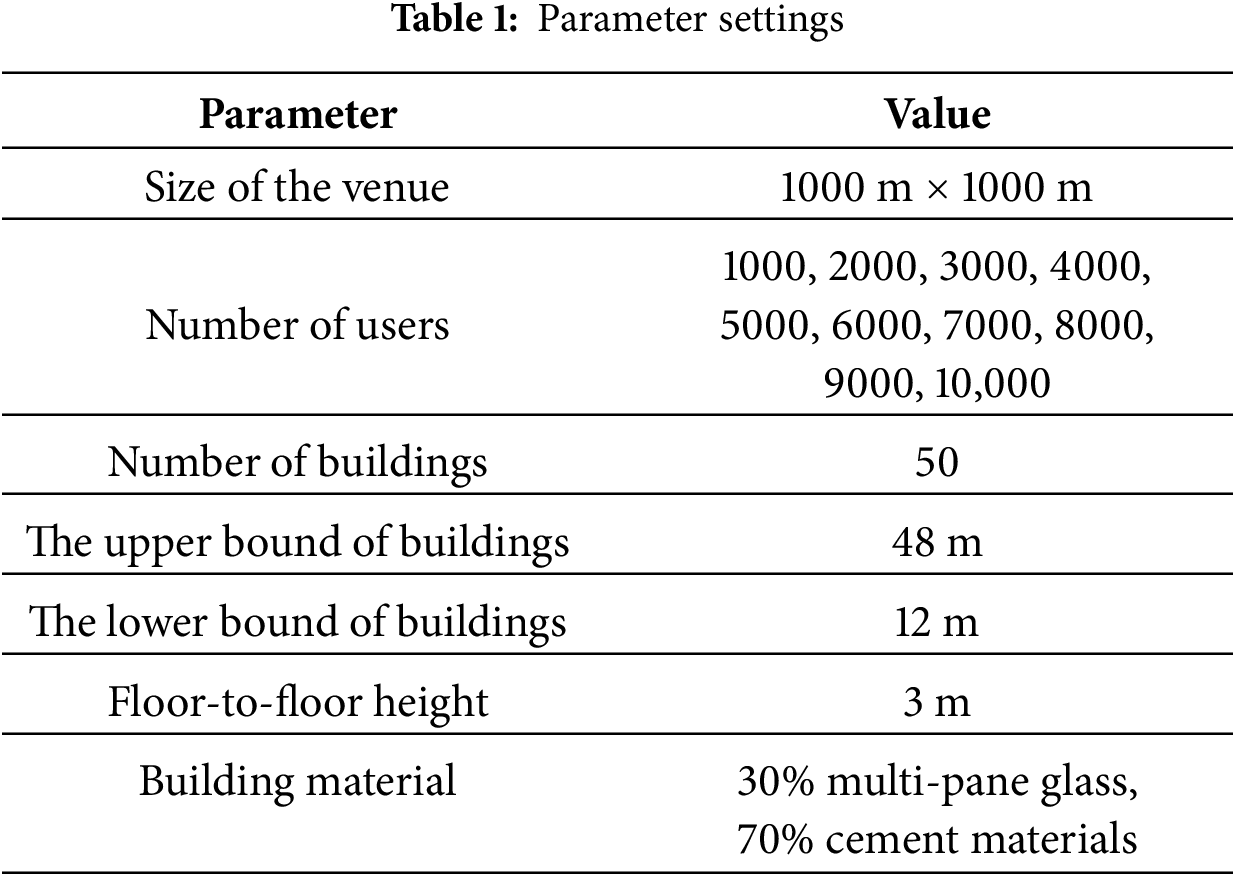
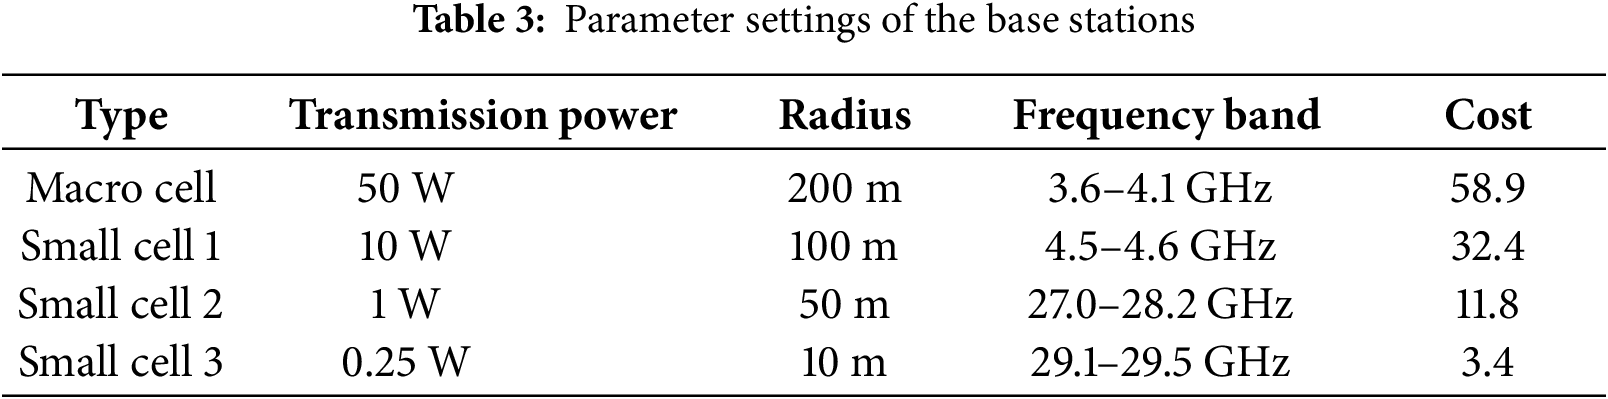
For base station deployment, the placement configuration in this study follows the settings proposed in [14], and the detailed base station parameters are summarized in Table 3. Neighboring base stations of the same type are assigned different carrier frequencies to prevent co-channel interference. Outdoor base stations are installed either on utility poles at a height of 8 m or on rooftop locations proportional to building heights, while indoor base stations are deployed at a height of approximately 3 m relative to each floor level, consistent with indoor floor heights. The proposed deployment strategy adopts a bi-objective optimization formulation, aiming to maximize network coverage while minimizing deployment cost. When two solutions exhibit equivalent values in both objectives, the RSSI is employed as a secondary tie-breaking criterion to distinguish solution quality.
The GQTS-QNG algorithm is configured with 10 particles and executed for 10,000 generations with
5.2 Comparison with State-of-the-Art Multi-Objective Algorithms
To evaluate the effectiveness of the proposed GQTS-QNG approach, we compare its performance with well-known algorithms, including VA-GA [14], VA-NSGA-II [14], GA [6], and NSGA-II [7]. All algorithms are executed with the same evaluation times of 100,000 to ensure a fair comparison. Because the baseline results were originally presented in graphical form, the comparative performance values were approximated from the published plots.
This work focuses on a single representative 3D low-loss environment to enable a controlled and analytically tractable comparison, whereas the baseline study reports averaged results over several deployment scenarios. This setting isolates algorithmic effects from environmental variability, ensuring that performance improvements stem from optimization capability rather than scenario differences.
Figs. 3 and 4 present the coverage rate and deployment cost comparison results, respectively. The results indicate that GQTS-QNG consistently achieves the highest coverage across all user densities, demonstrating superior network reachability and robustness in low-loss 3D propagation environments. In addition, GQTS-QNG exhibits the slowest cost growth trend as the number of users increases, implying that the method is more cost-efficient in selecting base station locations.
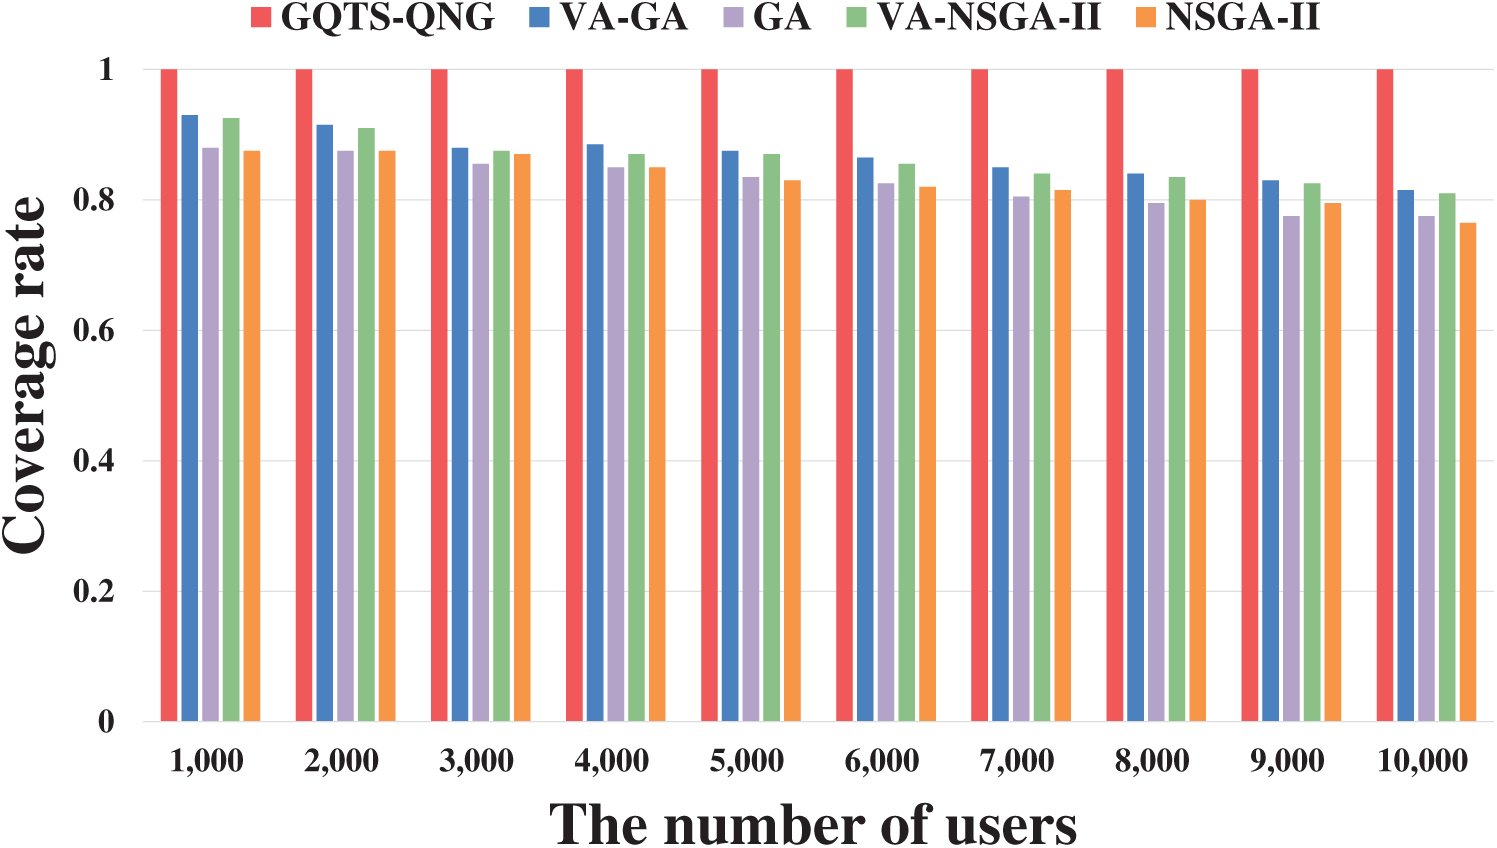
Figure 3: Coverage rates comparison of GQTS-QNG and multi-objective algorithms under different user densities. GQTS-QNG consistently maintains higher coverage across all scenarios, demonstrating strong robustness as the number of users increases
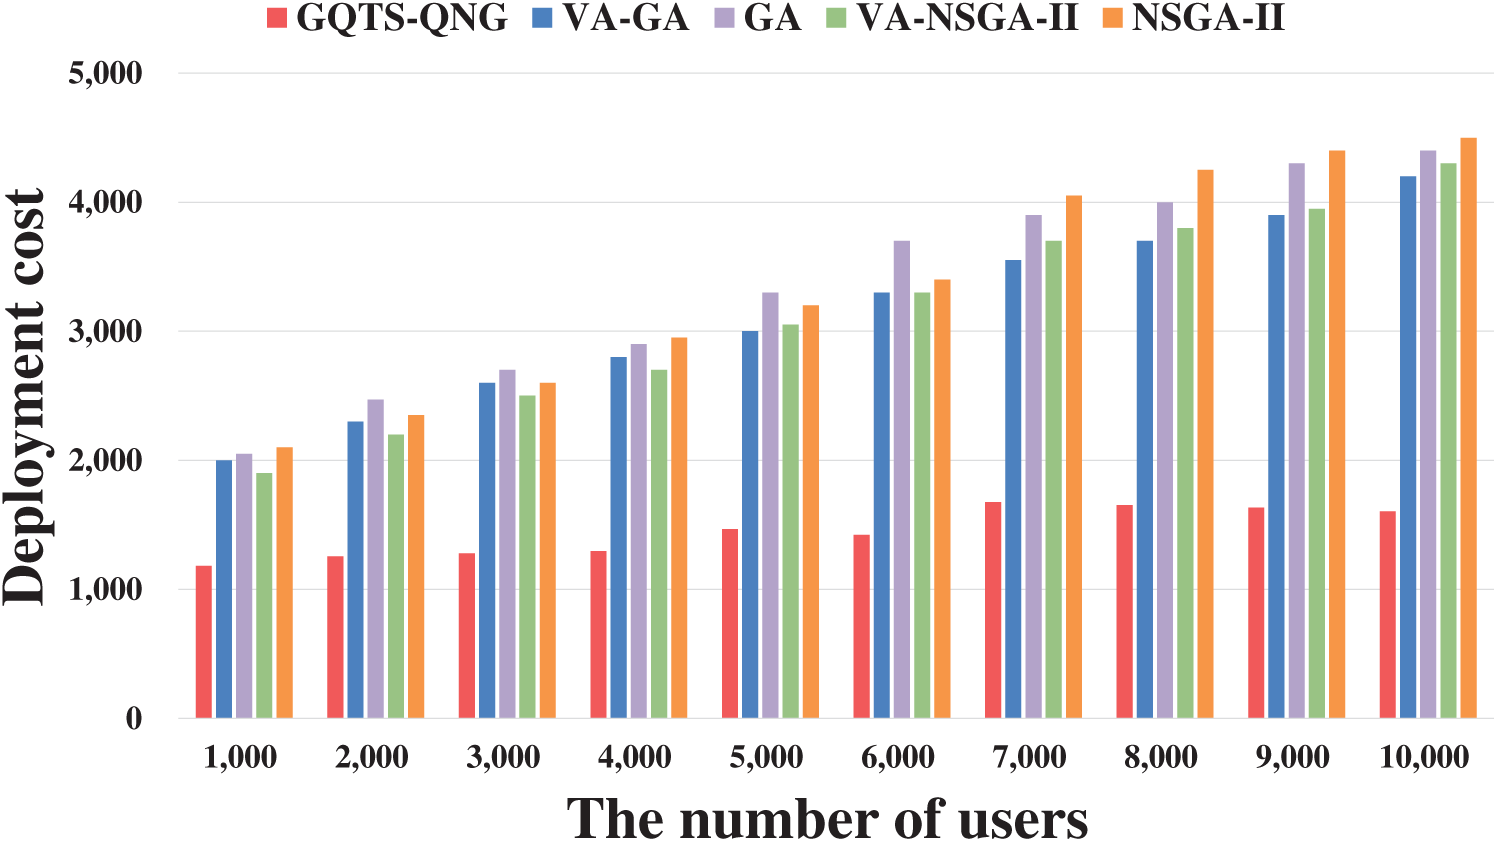
Figure 4: Deployment cost comparison under increasing user densities. GQTS-QNG achieves significantly lower deployment cost than the other methods, and the cost trend increases steadily as the number of users grows
The proposed GQTS-QNG algorithm demonstrates strong capability in identifying deployment configurations that simultaneously achieve a high coverage rate and a low deployment cost. To further assess its robustness and scalability, Pareto fronts obtained under user-demand levels ranging from 2000 to 10,000 users are overlaid for comparison, as shown in Fig. 5. The results indicate that GQTS-QNG consistently identifies solutions that achieve full coverage across all demand levels, highlighting its ability to maintain service quality under increasing network load. In addition, the Pareto frontiers shift outward smoothly as the number of users increases, reflecting the natural growth in deployment cost required to sustain high coverage in denser environments. A slight cost inversion is observed between the 8000- and 10,000-user scenarios because the 8000-user Pareto solutions deploy more macro cells, leading to a higher total cost despite having fewer users.
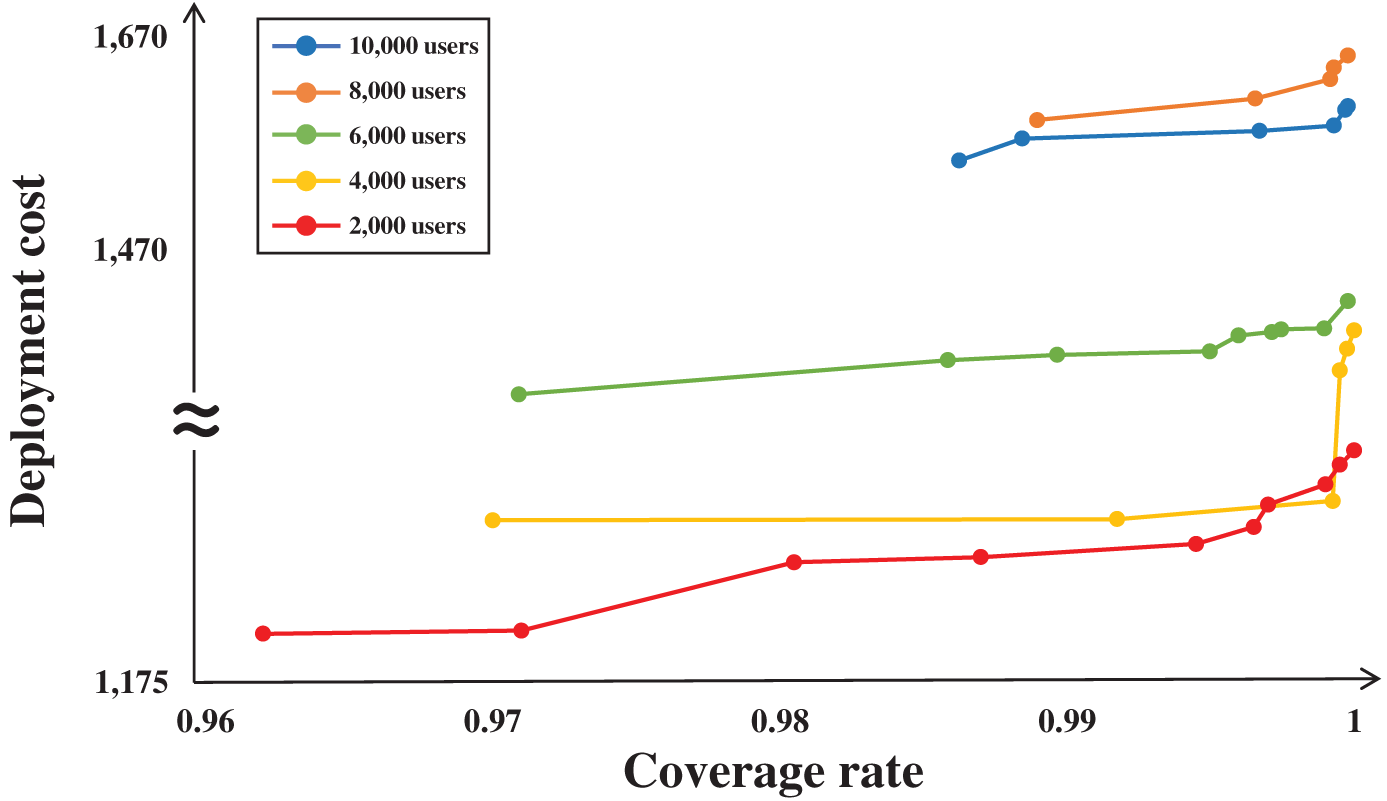
Figure 5: Pareto fronts of GQTS-QNG under different user densities. GQTS-QNG consistently achieves full coverage while maintaining a smooth cost-coverage trade-off as user numbers increase
Across all scenarios, GQTS-QNG generates a continuous spectrum of Pareto-optimal solutions rather than converging to a single point, demonstrating stable convergence behavior and strong multi-objective optimization capability. This solution diversity is particularly valuable for practical network planning, as it enables operators to flexibly select deployment strategies that balance cost and performance according to budget constraints and service requirements.
In this work, we demonstrate the first application of the GQTS-QNG framework to a 3D base-station deployment problem. The proposed method demonstrates strong search dynamics by effectively balancing global exploration and solution refinement through global-best guidance and the quantum-Not gate operator. Experimental results show stable convergence behavior and consistent discovery of diverse non-dominated deployment configurations, highlighting GQTS-QNG’s ability to maintain solution diversity and avoid premature concentration in limited regions of the search space. Across a wide range of user densities, our method successfully identifies full-coverage deployment solutions while maintaining favorable cost characteristics and generating smooth and well-distributed Pareto fronts, demonstrating scalability and robustness in high-dimensional discrete environments. These outcomes validate GQTS-QNG as a promising and effective quantum-inspired optimization framework for complex 3D planning tasks. Future work will extend GQTS-QNG to a wider range of 3D city models, including dense metropolitan regions, mixed urban–suburban layouts, and indoor-dominant environments, to further assess its adaptability across heterogeneous spatial and architectural conditions.
Acknowledgement: The authors acknowledge the support from the National Center for Theoretical Sciences, Taiwan.
Funding Statement: This work was supported by the National Science and Technology Council, Taiwan, under Grants 113-2221-E-260-014-MY2 and 114-2119-M-033-001.
Author Contributions: The authors confirm contributions to the paper as follows: Yao-Hsin Chou proposed the model architecture and supervised the project; Cheng-Yen Hua performed the system implementation and analyzed the experimental results; Ru-Wei Tseng wrote the draft manuscript; Shu-Yu Kuo assisted in model construction and critically reviewed the manuscript. All authors participated in the model discussion. All authors reviewed the results and approved the final version of the manuscript.
Availability of Data and Materials: All data generated or analyzed during this study are included in this published article.
Ethics Approval: Not applicable.
Conflicts of Interest: The authors declare no conflicts of interest to report regarding the present study.
References
1. Yoon Y, Kim YH. An efficient genetic algorithm for maximum coverage deployment in wireless sensor networks. IEEE Trans Cybern. 2013;43(5):1473–83. doi:10.1109/tcyb.2013.2250955. [Google Scholar] [PubMed] [CrossRef]
2. Ge X, Tu S, Mao G, Lau VK, Pan L. Cost efficiency optimization of 5G wireless backhaul networks. IEEE Trans Mob Comput. 2018;18(12):2796–810. doi:10.1109/tmc.2018.2886897. [Google Scholar] [CrossRef]
3. Ge X, Tu S, Mao G, Wang CX, Han T. 5G ultra-dense cellular networks. IEEE Wirel Commun. 2016;23(1):72–9. doi:10.1109/mwc.2016.7422408. [Google Scholar] [CrossRef]
4. An J, Yang K, Wu J, Ye N, Guo S, Liao Z. Achieving sustainable ultra-dense heterogeneous networks for 5G. IEEE Commun Magaz. 2017;55(12):84–90. doi:10.1109/mcom.2017.1700410. [Google Scholar] [CrossRef]
5. Ni Q, Du H, Pan Q, Cao C, Zhai Y. An improved dynamic deployment method for wireless sensor network based on multi-swarm particle swarm optimization. Nat Comput. 2017;16(1):5–13. doi:10.1007/s11047-015-9519-0. [Google Scholar] [CrossRef]
6. ZainEldin H, Badawy M, Elhosseini M, Arafat H, Abraham A. An improved dynamic deployment technique based-on genetic algorithm (IDDT-GA) for maximizing coverage in wireless sensor networks. J Ambient Intell Human Comput. 2020;11(10):4177–94. doi:10.1007/s12652-020-01698-5. [Google Scholar] [CrossRef]
7. Deb K, Pratap A, Agarwal S, Meyarivan T. A fast and elitist multiobjective genetic algorithm: NSGA-II. IEEE Trans Evol Comput. 2002;6(2):182–97. doi:10.1109/4235.996017. [Google Scholar] [CrossRef]
8. Chiang HP, Chou YH, Chiu CH, Kuo SY, Huang YM. A quantum-inspired tabu search algorithm for solving combinatorial optimization problems. Soft Comput. 2014;18(9):1771–81. doi:10.1007/s00500-013-1203-7. [Google Scholar] [CrossRef]
9. Kuo SY, Chou YH, Chen CY. Quantum-inspired algorithm for cyber-physical visual surveillance deployment systems. Comput Netw. 2017;117(1):5–18. doi:10.1016/j.comnet.2016.11.013. [Google Scholar] [CrossRef]
10. Shaikh MS, Wang C, Xie S, Zheng G, Dong X, Qiu S, et al. Coverage and connectivity maximization for wireless sensor networks using improved chaotic grey wolf optimization. Sci Rep. 2025;15(1):15706. doi:10.1038/s41598-025-00184-2. [Google Scholar] [PubMed] [CrossRef]
11. Ghazzai H, Yaacoub E, Alouini MS, Dawy Z, Abu-Dayya A. Optimized LTE cell planning with varying spatial and temporal user densities. IEEE Trans Veh Technol. 2015;65(3):1575–89. doi:10.1109/tvt.2015.2411579. [Google Scholar] [CrossRef]
12. Liu X, He D. Ant colony optimization with greedy migration mechanism for node deployment in wireless sensor networks. J Netw Comput Appl. 2014;39(1):310–8. doi:10.1016/j.jnca.2013.07.010. [Google Scholar] [CrossRef]
13. Chou YH, Hua CY, Chen HP, Hsu ET, Jiang YC, Kuo SY. Adapting developing quantum circuit synthesis with a multi-objective quantum-inspired optimization. In: Proceedings of the 2024 IEEE International Conference on Quantum Computing and Engineering; 2024 Sep 15–20; Montreal, QC, Canada. p. 559–60. [Google Scholar]
14. Chien WC, Jeon G, Cho HH. Multi-objective optimization of 3D cell deployment in sustainable B5G/6G networks: balancing performance and sustainability. IEEE Trans Netw Serv Manag. 2025;22(4):3077–91. doi:10.1109/tnsm.2025.3545622. [Google Scholar] [CrossRef]
15. 3GPP. Study on channel model for frequencies from 0.5 to 100 GHz (3GPP TR 38.901 version 14.3.0 release 14). 3rd Generation Partnership Project (3GPP). TR 38.901 [Online]; 2021 [cited 2025 Oct 20]. Available from: https://www.etsi.org/deliver/etsi_tr/138900_138999/138901/14.03.00_60/tr_138901v140300p.pdf. [Google Scholar]
16. Nguyen TG, So-In C, Nguyen NG. Barrier coverage deployment algorithms for mobile sensor networks. J Internet Technol. 2017;18(7):1689–99. [Google Scholar]
17. Ding F, Zhang D, Song A, Li J. A coverage and repair optimization algorithm for hybrid sensor networks. J Internet Technol. 2018;19(3):909–17. [Google Scholar]
Cite This Article
 Copyright © 2026 The Author(s). Published by Tech Science Press.
This work is licensed under a Creative Commons Attribution 4.0 International License , which permits unrestricted use, distribution, and reproduction in any medium, provided the original work is properly cited.
 Downloads
 Citation Tools