
 Submit a Paper
 Propose a Special lssue
 Open Access
ARTICLE
Multi-Scale Modelling and Simulation of Graphene–PDMS and CNT–PDMS Flexible Capacitive Pressure Sensors for Enhanced Sensitivity
1 Department of Electronics and Communication, University Institute of Engineering and Technology, Kurukshetra University, Kurukshetra, India
2 CSIR-Central Scientific Instruments Organization, Sector 30-C, Chandigarh, India
* Corresponding Author: Rama Gautam. Email:
(This article belongs to the Special Issue: Advanced Computational Modeling and Simulations for Engineering Structures and Multifunctional Materials: Bridging Theory and Practice)
Computers, Materials & Continua 2026, 87(2), 11 https://doi.org/10.32604/cmc.2026.076136
Received 14 November 2025; Accepted 08 January 2026; Issue published 12 March 2026
 View Full Text
 Download PDF
Abstract
In this study, the multi-scale (meso and macro) modelling was used to predict the electric response of the material. Porosity was introduced through a sugar-templating process to enhance compressibility and sensitivity. Mean-field homogenization was employed to predict the electrical conductivity of the nanocomposites, which was validated experimentally through I–V characterisation, confirming stable Ohmic behavior. The homogenised material parameters were incorporated into COMSOL Multiphysics to simulate diaphragm deflection and capacitance variation under applied pressure. Experimental results showed a linear and stable capacitance response at the force magnitude of 0–7 N. The Graphene nanoplatelets (GnP)–Polydimethylsiloxane (PDMS) sensor demonstrated superior sensitivity (0.0032 pF/N) compared to the CNT–PDMS sensor (0.0019 pF/N), attributed to improved filler dispersion and higher effective surface area of GnP. Finite element simulations were further conducted to evaluate stress distribution in a GnP–PDMS-based capacitive sensor integrated into a shoe insole for gait analysis. The results correlated well with experimental capacitance changes, validating the sensor’s mechanical reliability and pressure sensitivity. This comparative study establishes the GnP–PDMS composite as a more effective candidate for low-cost, biocompatible, and high-performance flexible pressure sensors in wearable biomedical and gait monitoring applications.Keywords
The development of pro-elastic composite pressure sensors is gaining significant attention in the research community due to their relatively simple working mechanisms, ease of signal acquisition, and potential applications in wearable electronics, healthcare monitoring, and soft robotics [1,2]. For wearable applications, flexible sensors must conform to curved and dynamic surfaces, making elastic polymer-based materials an ideal choice for their fabrication. In numerous studies, polymer-based sensors have been used for piezo-resistive, capacitive, piezoelectric, and turboelectric sensing technologies [3–5]. The authors studied the geometrical parameters of sensors, including thickness and shape, to enhance sensitivity under compressive load for applications requiring accurate pressure measurements. Currently, the fabrication of capacitive pressure sensors involves incorporating conductive fillers into a soft polymer matrix, where the applied force induces changes in capacitance due to deformation of the dielectric structure. To utilize sensors with better performance nowadays, nanomaterials are used to make the sensor better, such as GnP, CNT, MXene, nanofibers, etc. [6]. With the addition of fillers, the single-phased material transformed into a multi-phased material. The material properties of single-phase materials can be determined easily using the first principle of measurement, whereas in the case of multi-phase materials, predicting properties is a challenge due to the complex shape and size of nanoparticles. Therefore, the homogenization technique may be used to calculate the resistivity and conductivity tensor. 2D carbon-based foams, such as GnP based foam and 1D CNT based foam, are drawing attention because of their low density, large specific surface area, high conductivity, piezoresistive properties, and recyclable absorption of organic solvents [7–9]. There are several processes for producing GnP foam or CNT foam, including template-directed chemical vapor deposition (CVD) [10] and chemical modification. The CVD is the most widely used and industrially accepted method to create high-quality GnP and CNT-based foam structures with better and excellent electrical conductivity [11]. The CVD technique’s limitation in fabricating foam is the growth of a brittle layer after sugar template removal. Another fabrication route, i.e., chemically fabricated GnP and CNT foam, has better mechanical stability. However, it comes with certain limitations, such as poor electrical conductivity and the random stacking of nanomaterial layers during the self-assembly process. To overcome this limitation, the PDMS can be used as a matrix material due to its low elastic modulus and thermal stability [12]. PDMS also helps in better contact with human skin or body due to its biocompatibility. From the literature study, it is concluded that there is very little work reported on the fabrication and multi-scale simulations of PDMS-CNT and PDMS-GNP composite foam. In this comparative evaluation of two carbon-based nanocomposite foams, GnP-PDMS and CNT-PDMS, focusing on their pressure-sensing sensitivity, electrical response, and mechanical resilience. The integration of homogenization theory, sugar-template fabrication, and finite-element simulation offers a multi-scale predictive framework that correlates nanomaterial morphology with macroscopic sensitivity. Furthermore, the use of sugar as a sacrificial template enables the formation of highly porous, tunable foam structures, making this fabrication route low-cost, scalable, and environmentally benign. This work presents a unique integration of mean-field homogenization modeling, sugar-templated fabrication, and COMSOL-based simulation to develop and validate flexible capacitive pressure sensors using PDMS foams reinforced with GnP and CNTs. Unlike prior studies, this research provides a multi-scale predictive framework for electrical conductivity, experimentally validated I–V behaviour, and enhanced sensitivity in a low-cost, biocompatible, and highly compressible sensor structure. The use of sugar as a sacrificial template for producing tunable porosity in nanocomposite foams, combined with numerical and experimental correlation, is reported here for the first time in the context of capacitive pressure sensors.
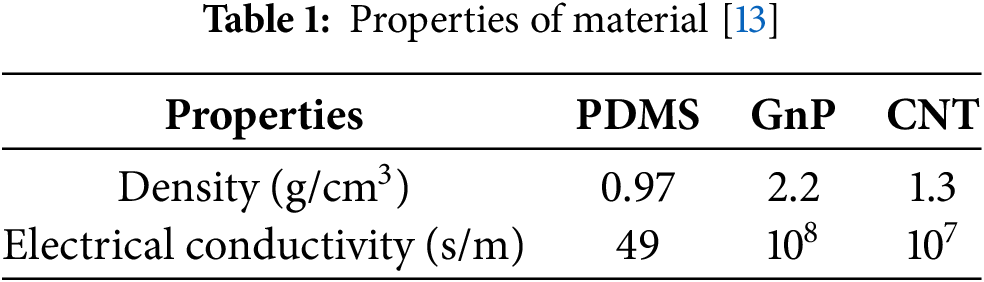
The PDMS (Make: (Sylgard 184, Dow Chemical Co.) was taken as matrix material due to its excellent piezoelectric response. The CNT and GnP were taken as reinforcement. The properties of the material are presented in Table 1.
2.2 Homogenization of PDMS-CNT and PDMS-GnP Composite
The homogenisation was done to predict the electrical conductivity of the PDMS-CNT [14] and PDMS-GnP [15] composite. The representative volume element (RVE) of PDMS-CNT and PDMS-GnP is shown in Fig. 1a–d. The matrix and inclusions were considered in a single domain function for the calculation of the equivalent electrical conductivity of the composite. Fig. 1e,f demonstrates the fundamental principle of Ohm’s law, where current (I) is directly proportional to voltage (V). This figure is included to validate the electrical conductivity behaviour of the composite foams used in this study. By demonstrating a linear I–V relationship, we confirm that the sensor materials behave in an Ohmic manner, meaning they maintain consistent conductivity under applied voltage. This is critical for ensuring reliable signal transmission in sensing applications. The ellipsoid shape of inclusions was considered for the homogenization. The inputs, such as the density and electrical conductivity of the PDMS, CNT, and GnP, are presented in Table 1. After defining the above inputs, the conductivity model was implemented to model the composite. A RVE containing randomly distributed CNT and GnP in two separate cases was considered for investigation. In RVE, the orientation of the inclusions was defined by Euler’s angles θ and φ w.r.t the global coordinate system. The model was developed using governing equations for steady-state electric diffusion as shown in Eq. (1). J is the current density distribution vector,
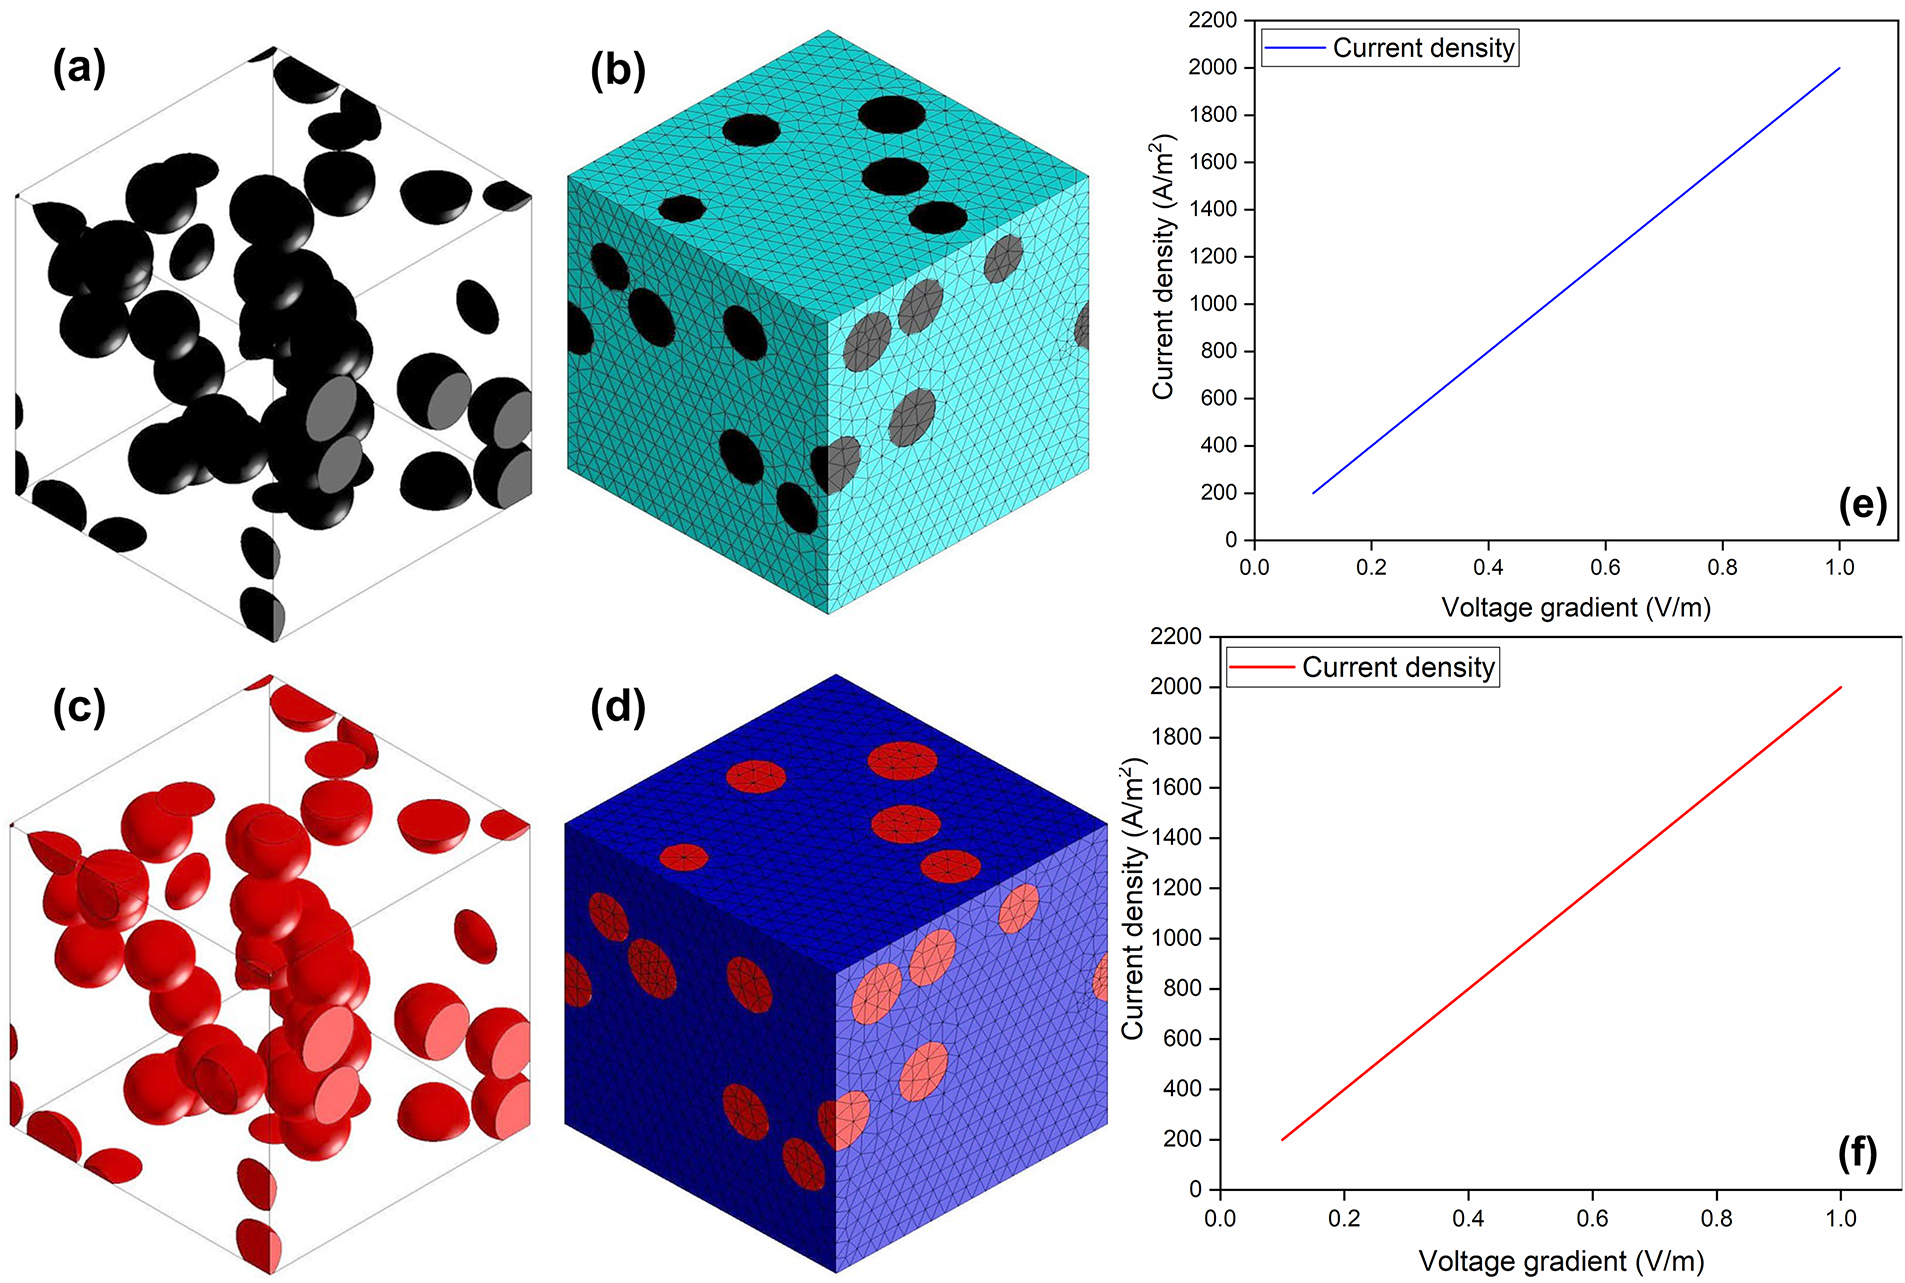
Figure 1: RVE of (a,b) PDMS/CNT; (c,d) PDMS/GnP. Electrical response of (e) PDMS/CNT; (f) PDMS/ GnP
J can be calculated from the gradient of the potential, current density distribution of the matrix phase in the inhomogeneous system present in Eq. (2)
The conductivity and the resistivity tensor are present in the Eqs. (3) and (4)
where
where Ex, Ey, and Ez be the electric field vector components along X, Y, and Z directions, respectively.
The resultant conductivity and resistivity tensor for PDMS/CNT and PDMS/GnP composite is presented in Eqs. (5)–(8)
From the above analysis, it can be seen that although GnP and CNTs exhibit different intrinsic conductivities, both are several orders of magnitude more conductive than PDMS. In mean-field homogenization, this extremely high conductivity contrast leads to a saturation of the localization tensor, making the effective composite conductivity weakly sensitive to further increases in filler conductivity. Consequently, when all other parameters are identical, PDMS-CNT and PDMS-GnP composites exhibit nearly identical homogenized conductivity tensors.
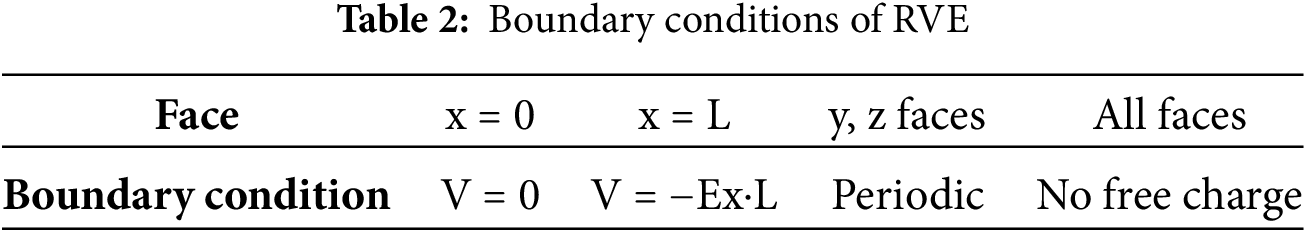
The MEMS capacitive pressure sensor is simulated using COMSOL Multiphysics software to enhance performance, shorten manufacturing time, and optimize design [17,18]. The primary goal of the investigation is to confirm that the diaphragm’s deflection is caused by the pressure that is placed between it and the substrate. Secondly, to confirm the diaphragm’s and the substrate’s capacitance and deflection. The primary goal of utilising this software is to optimize the structure’s dimensions to obtain the desired result and reduce fabrication-related time [19]. The detailed methodology steps are shown in Fig. 2. The capacitance shift caused by diaphragm deformation is used by capacitive pressure sensors [20,21]. The features of a touch-mode pressure sensor include wide over-range protection, near-linear output, and a robust build that allows the sensor to tolerate hostile environments. Certain stray capacitance effects can be ignored in this situation because the touch mode operates in a wider pressure range and with more sensitivity than the standard mode’s nearly linear operation.
Figure 2: Schematic diagram illustrating the procedural workflow followed during the simulation process
The capacitance shift caused by diaphragm deformation is used by capacitive pressure sensors [20,21]. The PDMS phase in the present simulations was modelled as a linear elastic, isotropic material with near-incompressibility (ν = 0.49), using Young’s modulus of 750 kPa. Since the analysis focuses on small deformations associated with electrical homogenization rather than large-strain mechanical response, a linear elastic model was considered sufficient. In these applied loading conditions, the resulting diaphragm deflections remain within the small-strain regime, for which a linear elastic model provides reliable predictions of stress distribution and deformation. These mechanical responses directly govern the effective dielectric thickness and electric-field distribution, which in turn determine the capacitance change. The features of a touch-mode pressure sensor include wide over-range protection, near-linear output, and a robust build that allows the sensor to tolerate hostile environments. Certain stray capacitance effects can be ignored in this situation because the touch mode operates in a wider pressure range and with more sensitivity than the standard mode’s nearly linear operation. The diaphragm will deflect inside when external pressure is applied, starting to touch the bottom electrode (substrate) with an insulator space between, increasing the capacitance of the model [22]. Touch-mode sensing reported in previous studies is mentioned here for general context; the sensor presented in this work operates in deformation mode. Touch-mode capacitive pressure sensors have been widely reported in the literature for achieving extended sensing ranges; however, the porous PDMS foam sensor developed in the present work operates in a non-contact compression mode, where capacitance variation arises from dielectric deformation and porosity-induced permittivity modulation rather than electrode contact. On the other hand, the capacitive pressure sensor is more sensitive and better suited for monitoring intraocular pressure because of its slotted diaphragm. The sensitivity of the slotted pressure sensor has been increased by incorporating slots into the clamped pressure sensor [22]. Simulation in COMSOL is done in 3D design, where we first have defined the parameters of the sugar cube in the block structure, i.e., its geometry. It has two electrodes of copper (Fig. 3a), one at the top of the block and the other at the bottom of the block, and their thickness is equal. In the next step, the material section is done where the electrode material is selected as copper, the diaphragm is a mixture of PDMS and GnP (Fig. 3b) and the properties of the material and the capacitive pressure sensor are defined, where the bottom electrode is grounded, and on top electrode pressure is applied and it will be connecting to the electric current. After defining the properties, meshing using a tetrahedral element was done. The convergence was observed above 423,251 nodes. The mesh sensitivity test has been included Fig. 3g. The concluded results of the simulation are observed in Fig. 3d–f.
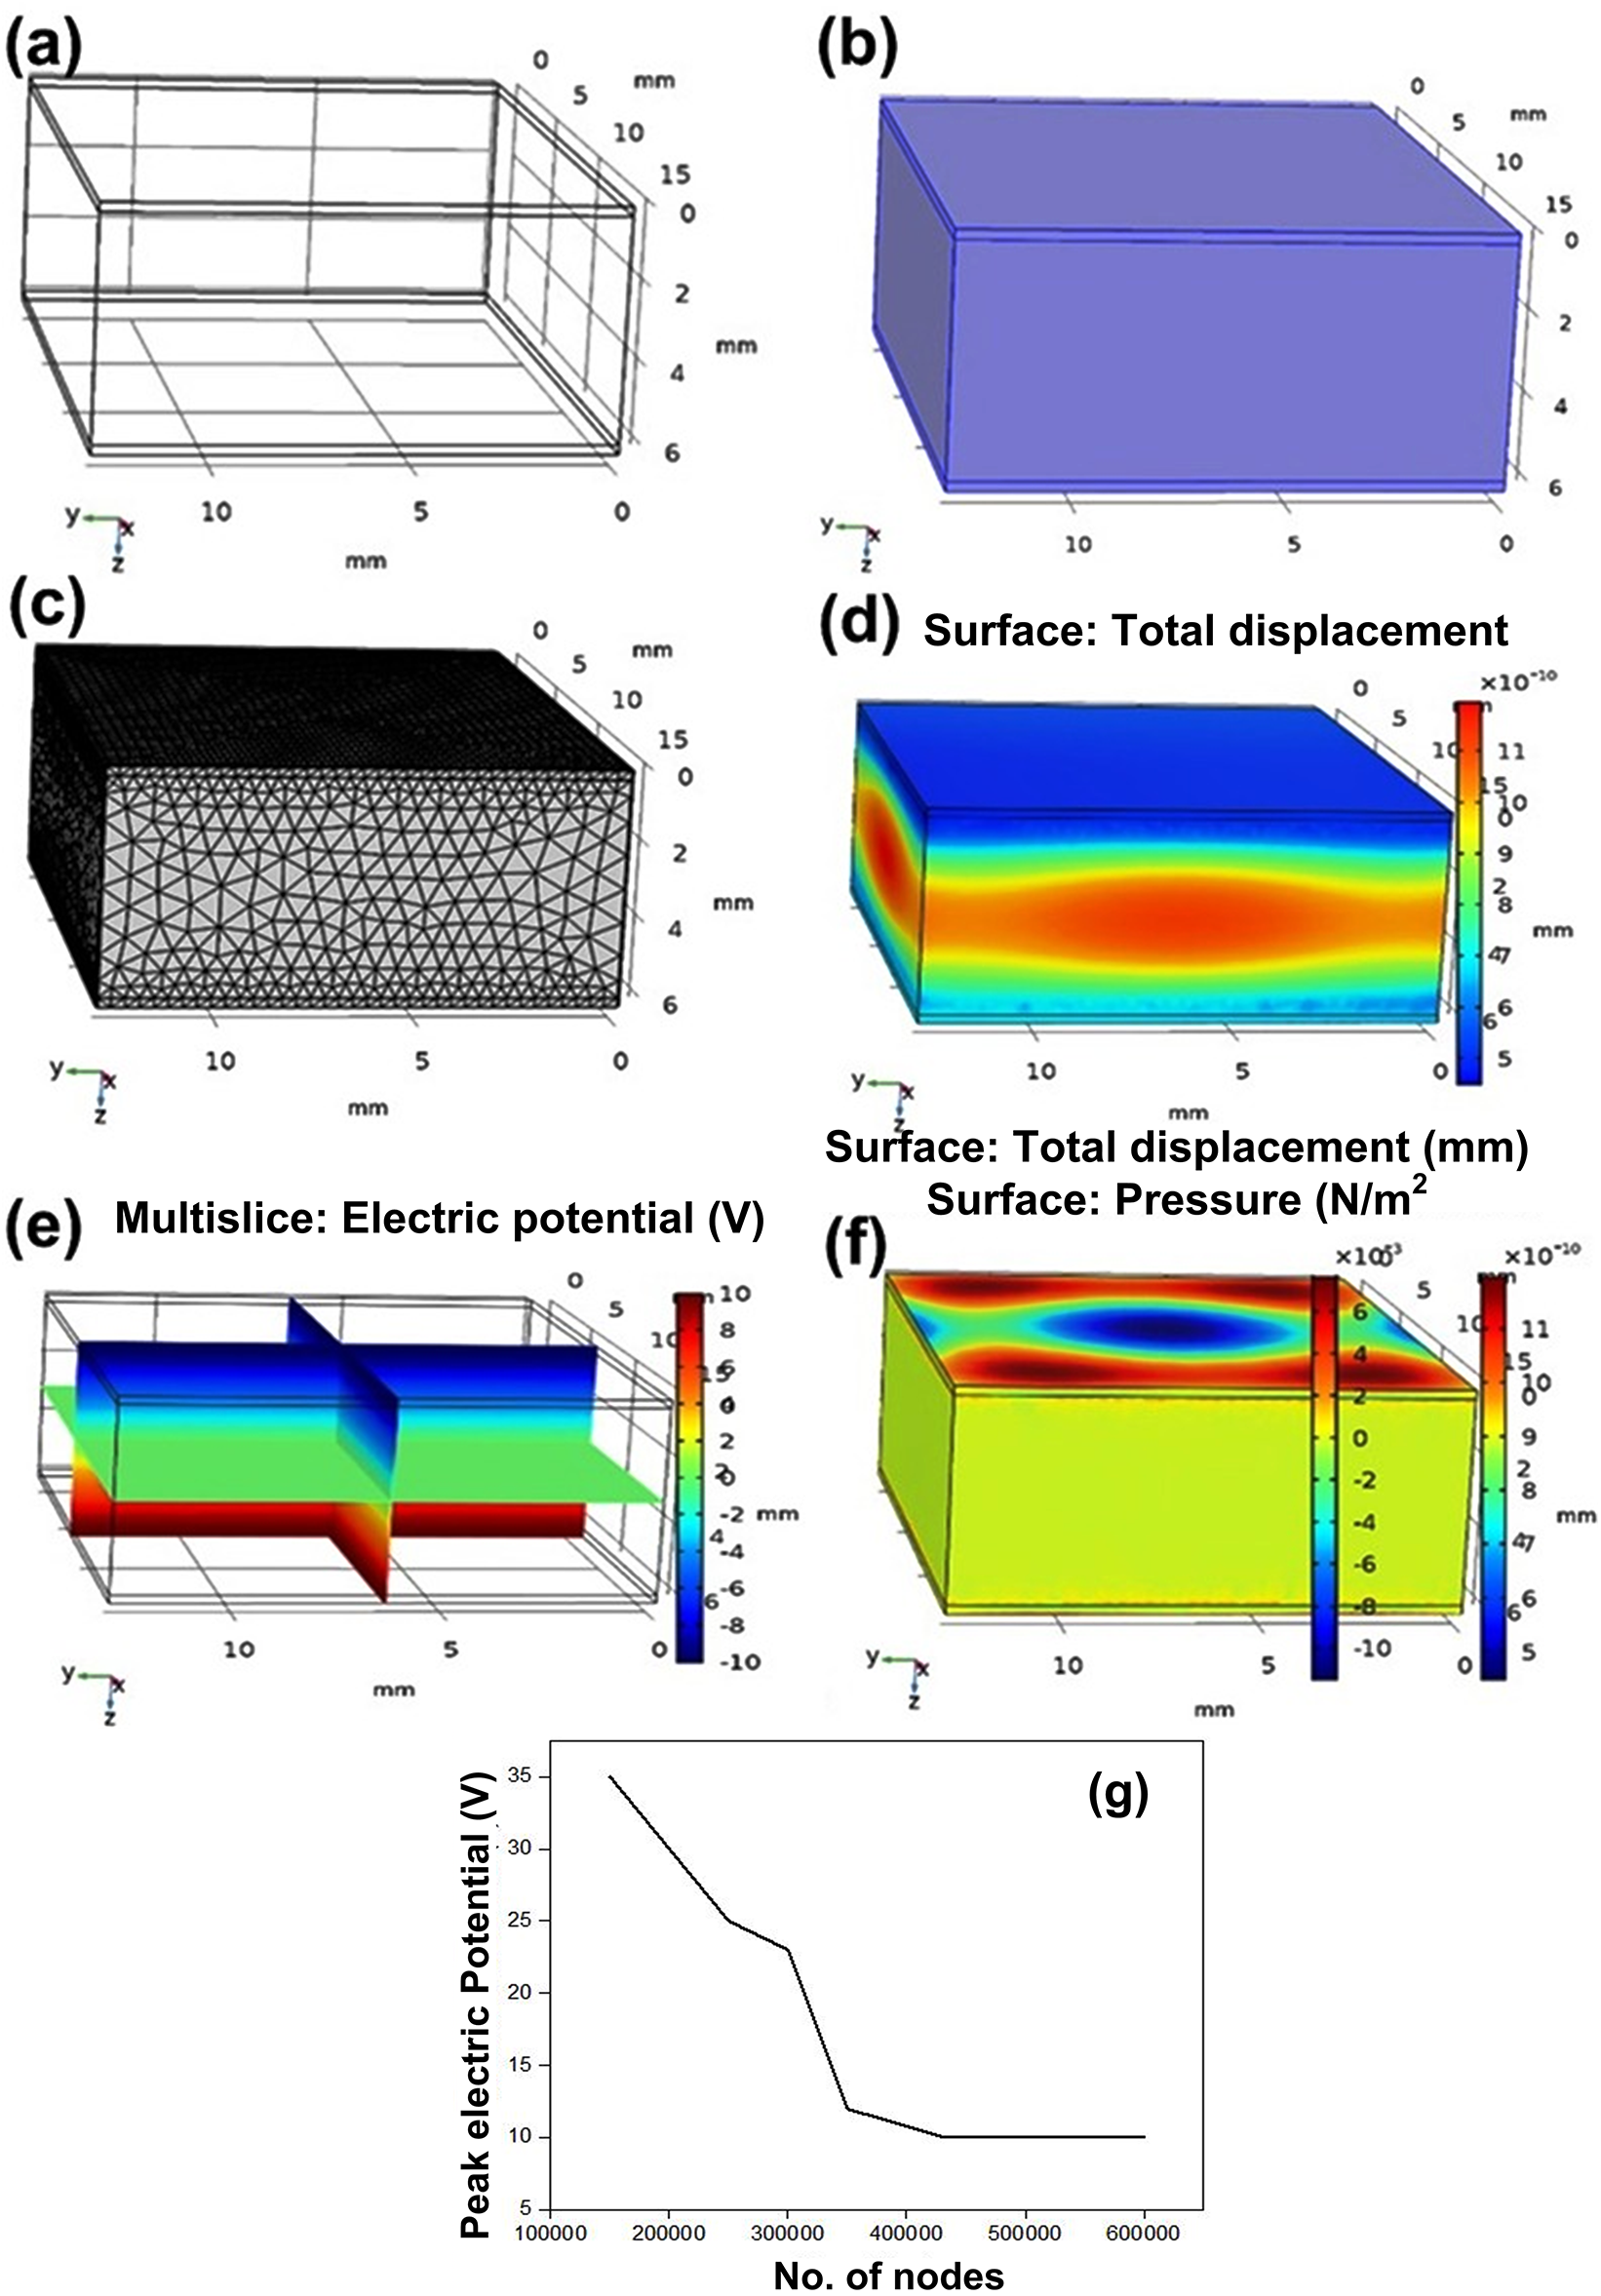
Figure 3: Systematic diagram of simulation of the pressure sensor in COMSOL software (a) defining parameter with defined geometry of a block; (b) defining the material to the block and defined the properties of systematic pressure sensor; (c) meshing of the block; (d) applying boundary condition to the block; (e) applying electric potential to the block; (f) representation of surface integration on block: (g) Mesh sensitivity test
The experimental validation was conducted by testing the fabricated specimen. The fabrication process involved several steps, as shown in Fig. 4. Fig. 4 illustrates the procedure for developing a foam from a sugar template using PDMS and nanoparticles. PDMS was used first, combined with a curing agent and reinforced materials. PDMS served as the continuous phase, mixed with the curing agent in a 10:1 weight ratio. Samples were prepared with 0.3 g of nanomaterials (GnP and CNT). Both samples were mixed in a small container, like a bottle cap. Then, a sugar template (Commercial grade Size: 16 mm × 16 mm × 11 mm; Average pore size: 250 µm) was dipped inside the container, ensuring it was fully immersed in the solution. Porosity was controlled by selecting sugar particles with different pore sizes and by adjusting the sugar content relative to PDMS. Since the pore structure directly replicates the geometry of the sugar template after dissolution, varying the particle size and packing density of the sugar allows controlled tuning of both pore size and overall porosity. The container was then placed in a desiccator (an airtight enclosure used to remove moisture and prevent dampness that could affect moisture-sensitive samples, such as electronics and chemicals). The desiccator also maintains a controlled moisture level to protect biological and carbon-dating samples. The samples were placed inside the desiccator. When the vacuum is applied, the mixture begins to boil. By reducing the atmospheric pressure in the desiccator, a controlled environment was created. The process takes approximately 120 min in the desiccator. After desiccating the material, place the container in a microwave oven for approximately 2 h at 75°C to harden the composition of the material on the sugar template. After the heating process, remove the container from the oven and observe that the sugar cube is embedded in the mixture, which has now hardened. To extract the sugar cube from the container, it must be cut and separated from the mixture. The sugar template should be sliced, and the PDMS must be removed from the sugar template. Next, take 50 mL of distilled water in a beaker and immerse the sugar template in it. Then, place the beaker on a hot plate for 20–25 min (or longer, if necessary) until the sugar is completely removed from the template. During this process, the sugar template, which initially feels hard, will transform into a soft foam as all the sugar is dissolved. In this way, a sample of CNT and GnP foam is collected. The various weight fraction of CNT/GnP was taken 0.1%, 0.2%, and 0.5%. Below 0.5% GNP/CNT, the PDMS network is under-constrained, so uncured or lightly crosslinked chains migrate to the surface and increase the tackiness of the surface.
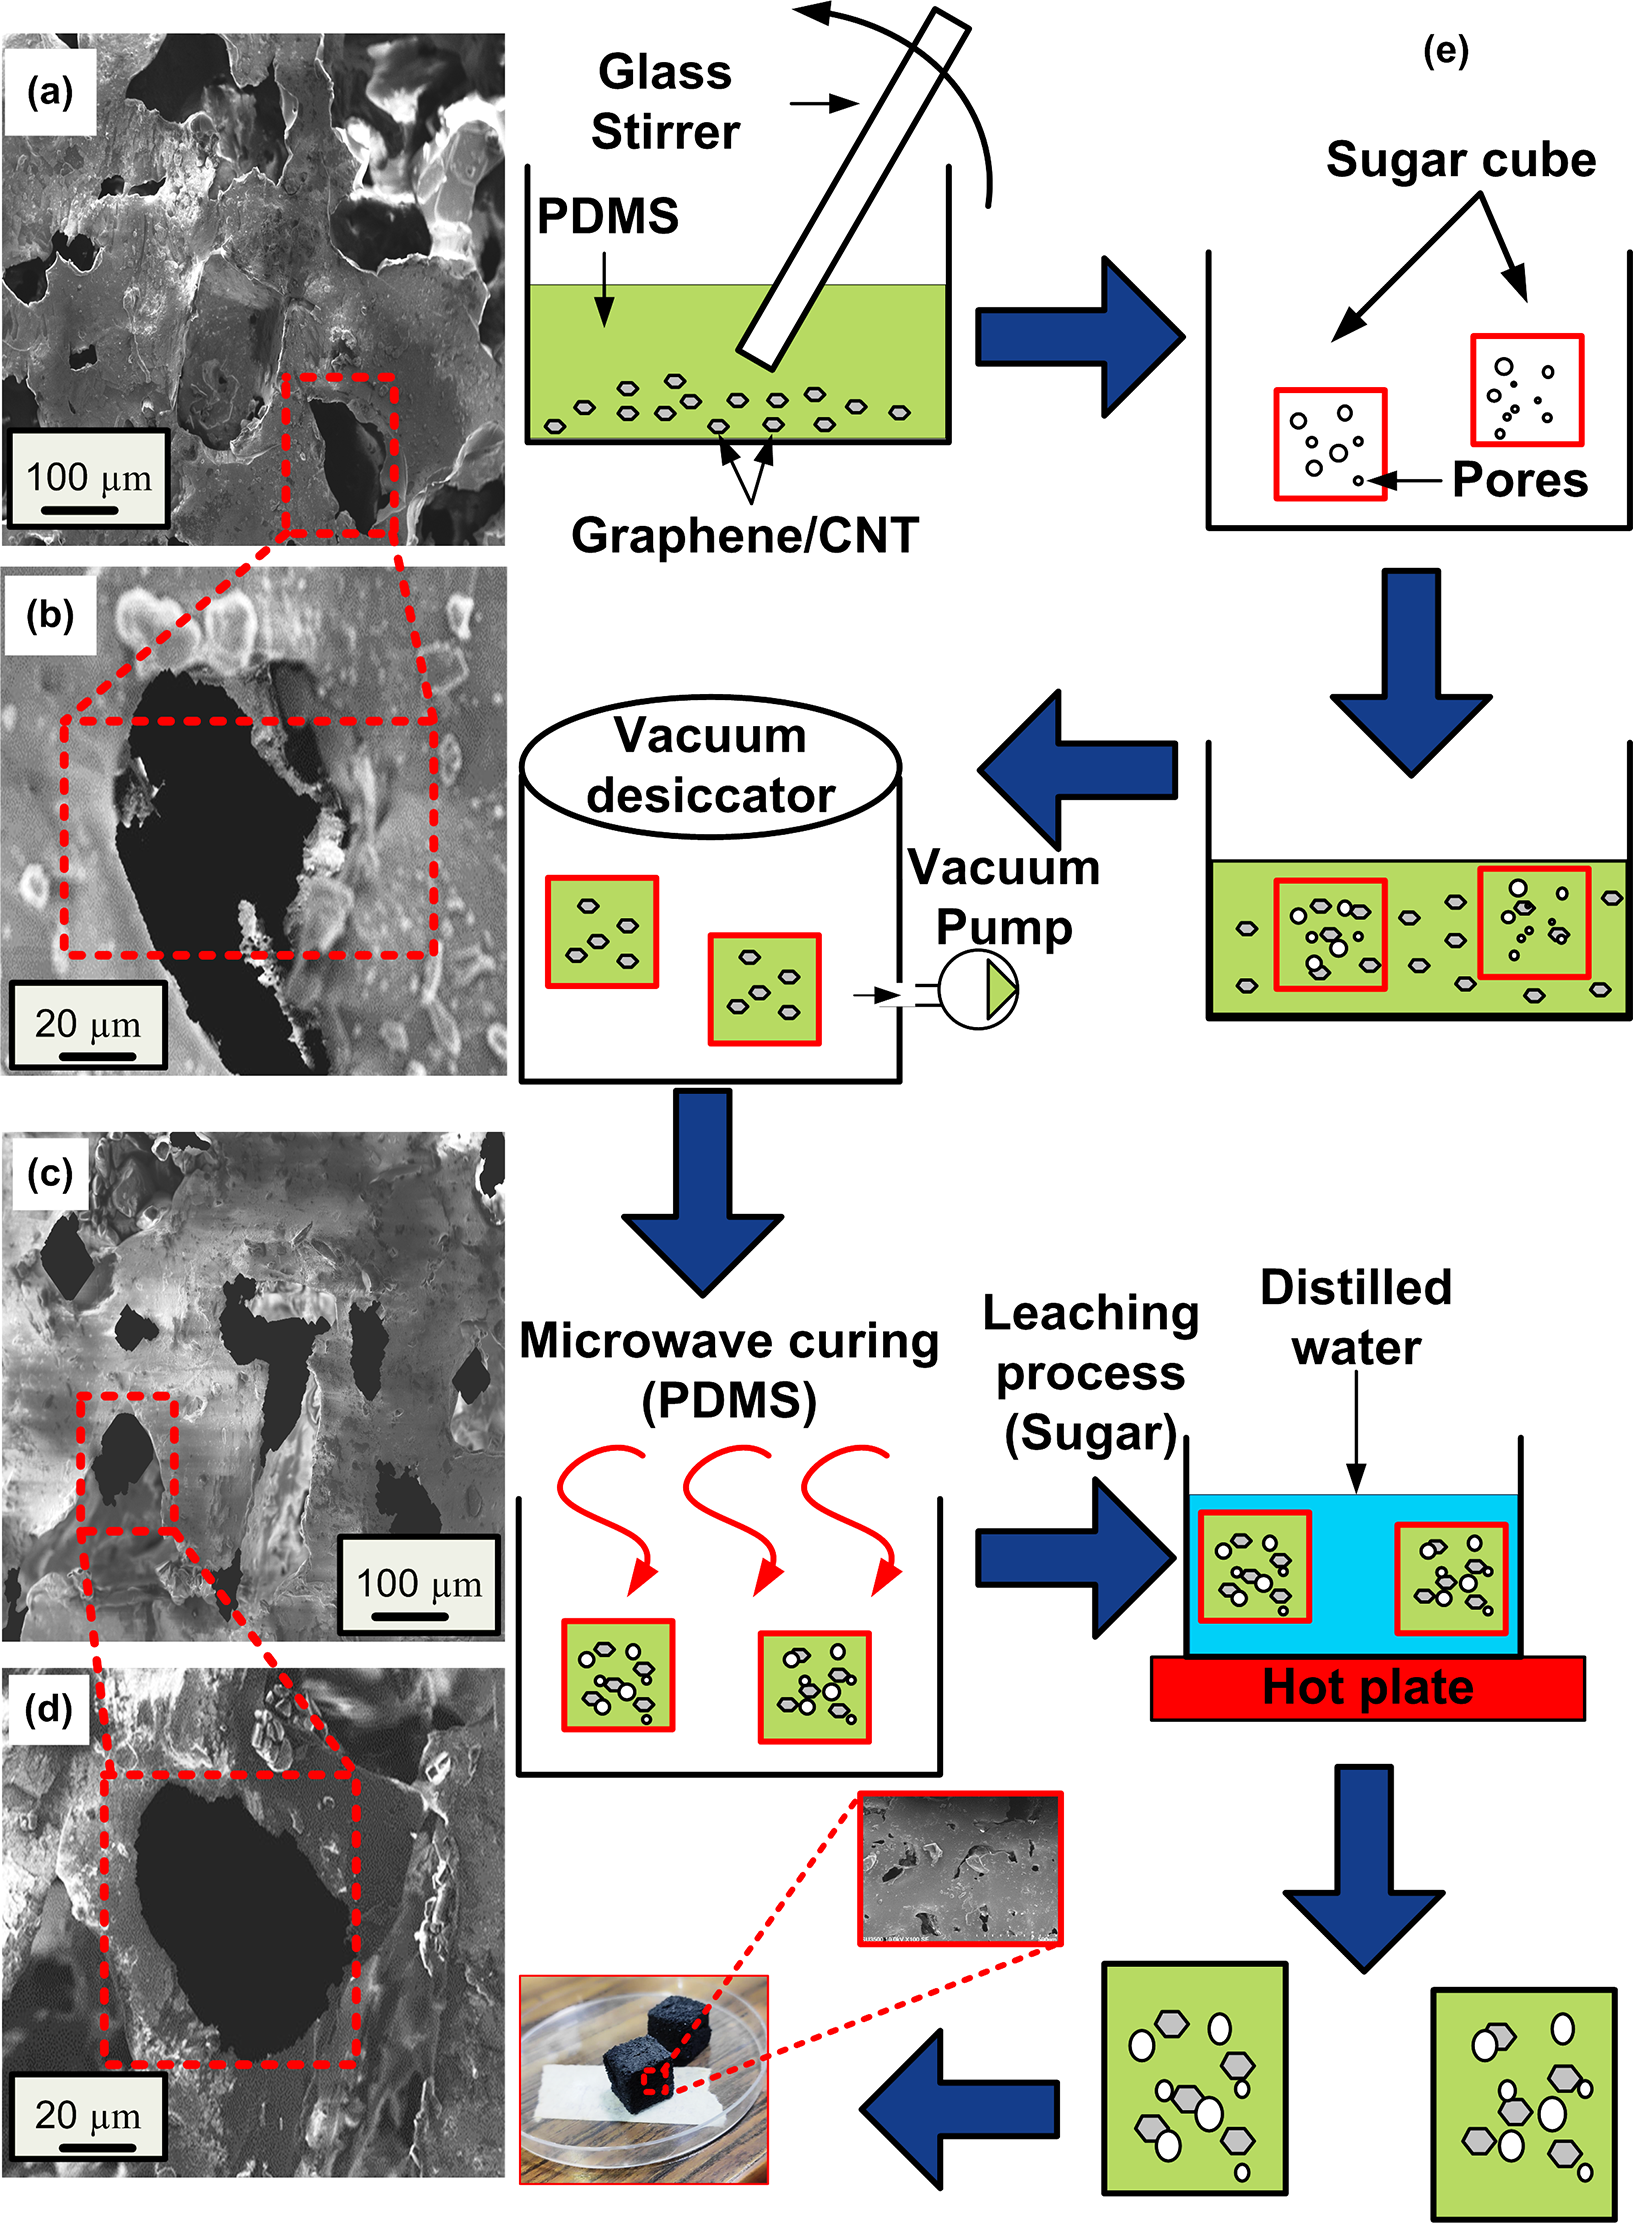
Figure 4: (a) SEM micrographs of PDMS/CNT foam, (b) inset of PDMS/CNT foam, (c) PDMS/GnP foam, (d) inset of PDMS/GnP foam (e) schematic of fabrication
Testing a capacitive pressure sensor involves applying force to the sensor and measuring the resulting change in capacitance. The measurement setup is shown in Fig. 5. The sensor, typically made of two parallel conductive plates separated by a dielectric material, detects pressure by the variation in the distance between the plates when force is applied. As pressure increases, the gap between the plates decreases, leading to an increase in capacitance. To test the sensor, a controlled force is gradually applied to the surface of the sensor, and the change in capacitance is monitored using an appropriate measurement device, such as an LCR meter [23] or a capacitance-to-digital converter. The sensor’s response to varying pressure is recorded, and the data is used to establish a calibration curve that relates the applied force to the change in capacitance. This testing helps evaluate the sensor’s sensitivity, accuracy, and overall performance under different pressure conditions, ensuring its reliability for practical applications. Capacitive pressure sensors measure force changes by detecting variations in capacitance. The basic idea is that the capacitance between two parallel plates is inversely proportional to their separation distance.
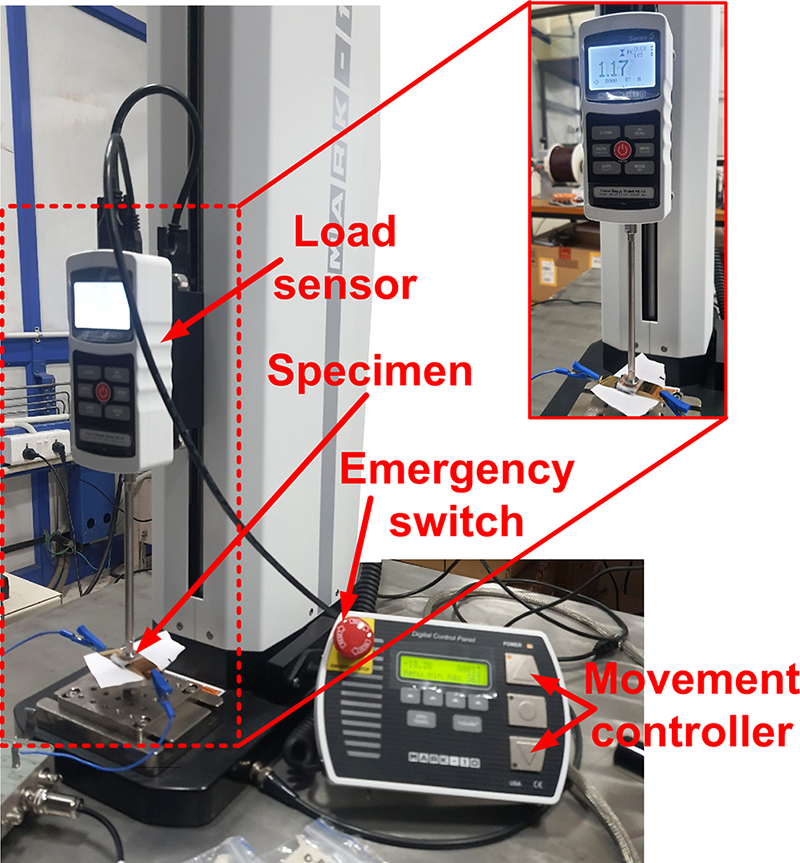
Figure 5: Characterization of the pressure-sensing performance of the flexible GnP-based foam with 0.032 pF/N
When force is applied to a foam-based sensor, it causes the foam to deflect. Consequently, the capacitance value changes due to this deflection. Capacitive force sensors are highly sensitive and versatile devices used for precise force and pressure measurements across various industries. The flexibility of the sensor allows it to conform readily to a curved surface. The flexible capacitive sensor was attached to a linear surface with a 15 mm radius to investigate the influence of bending on the pressure measurement of the sensor. In Fig. 5, when the external pressure is applied to the sensor, the capacitance of the sensor increases rapidly. The sensing sensitivity is 0.032 pF/N for GnP-based foam and 0.019 pF/N for CNT-based foam, but the sensing range decreases to 7 N. The higher sensitivity can be observed in GnP-based foam. This may be due to the fact that GnP has a higher surface-to-volume ratio than the one-dimensional tubular structure of CNTs. This extensive surface area facilitates better interaction with the polymer matrix and promotes the formation of conductive networks at lower filler concentrations. Consequently, GnP based composites often achieve electrical percolation thresholds at lower filler loadings, enhancing sensitivity. The formula for calculating the sensitivity of both GnP and CNT-based capacitive pressure sensors is:
A graph was designed using this formula, as shown in Fig. 6 below. This graph shows the relation between the change in capacitance when force is applied to GnP-based foam.
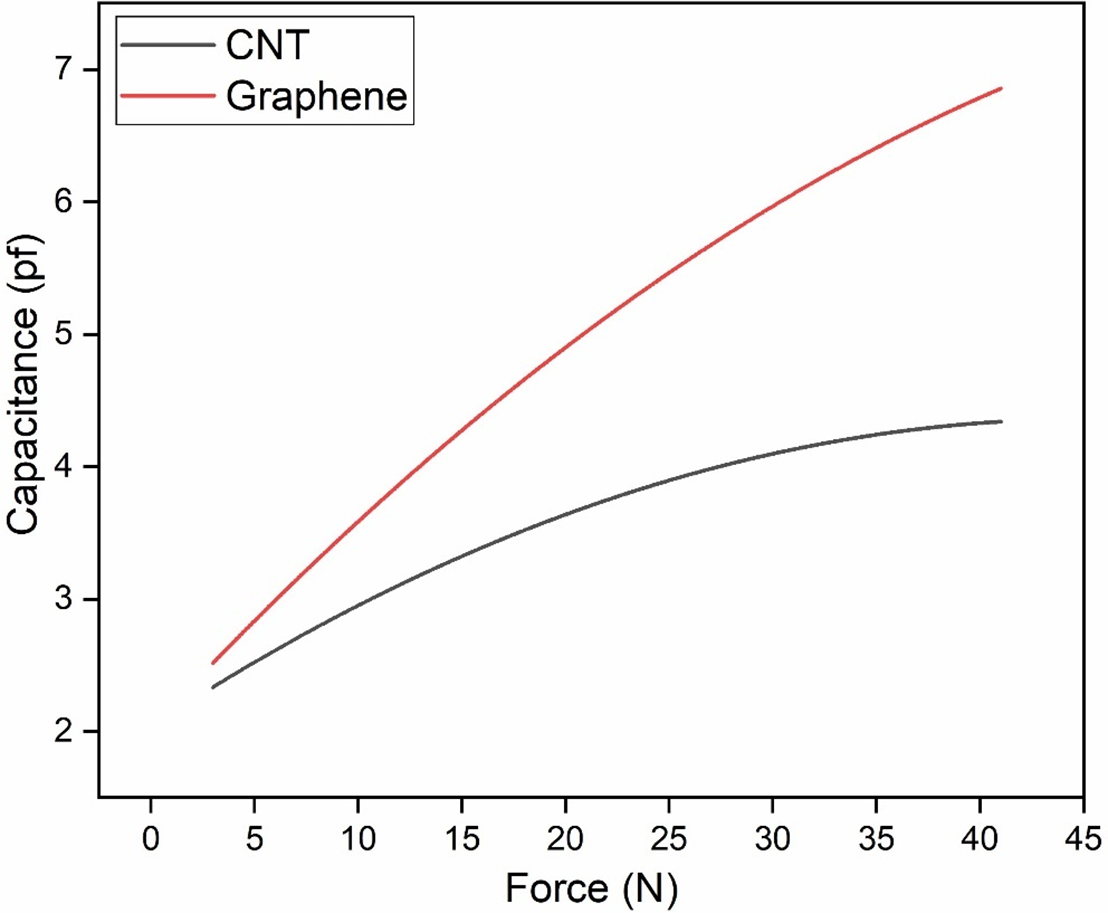
Figure 6: Systematics graph showing the sensitivity of GnP and CNT capacitive pressure sensor
Fig. 6 illustrates the relationship between the applied force and the measured capacitance for the GnP-based and CNT-based PDMS composite foam sensors. The graph displays a monotonically increasing trend, indicating that as the external force increases, the capacitance of the sensor rises proportionally.
In Fig. 7, the baseline (no-load) capacitance of the sensor was measured to be approximately 0.85 pF. Upon applying pressure, the capacitance increased incrementally, reaching up to 2.35 pF at a maximum load of 7 N. This results in a net change of ~1.5 pF, which is significantly above the standard background noise of the measurement setup (typically in the range of ±0.01 pF when using precision LCR meters. The change in capacitance (~1.5 pF) represents a clear signal-to-noise ratio (SNR) greater than 150:1, ensuring that the measurements are robust and not influenced by background noise. This confirms the sensor’s effectiveness and validates its capability to detect small pressure changes with good resolution. Fig. 7a,b represents the dynamic response of the GnP-based and CNT-based capacitive pressure sensors, respectively, over a period of 120 s under cyclic loading and unloading.
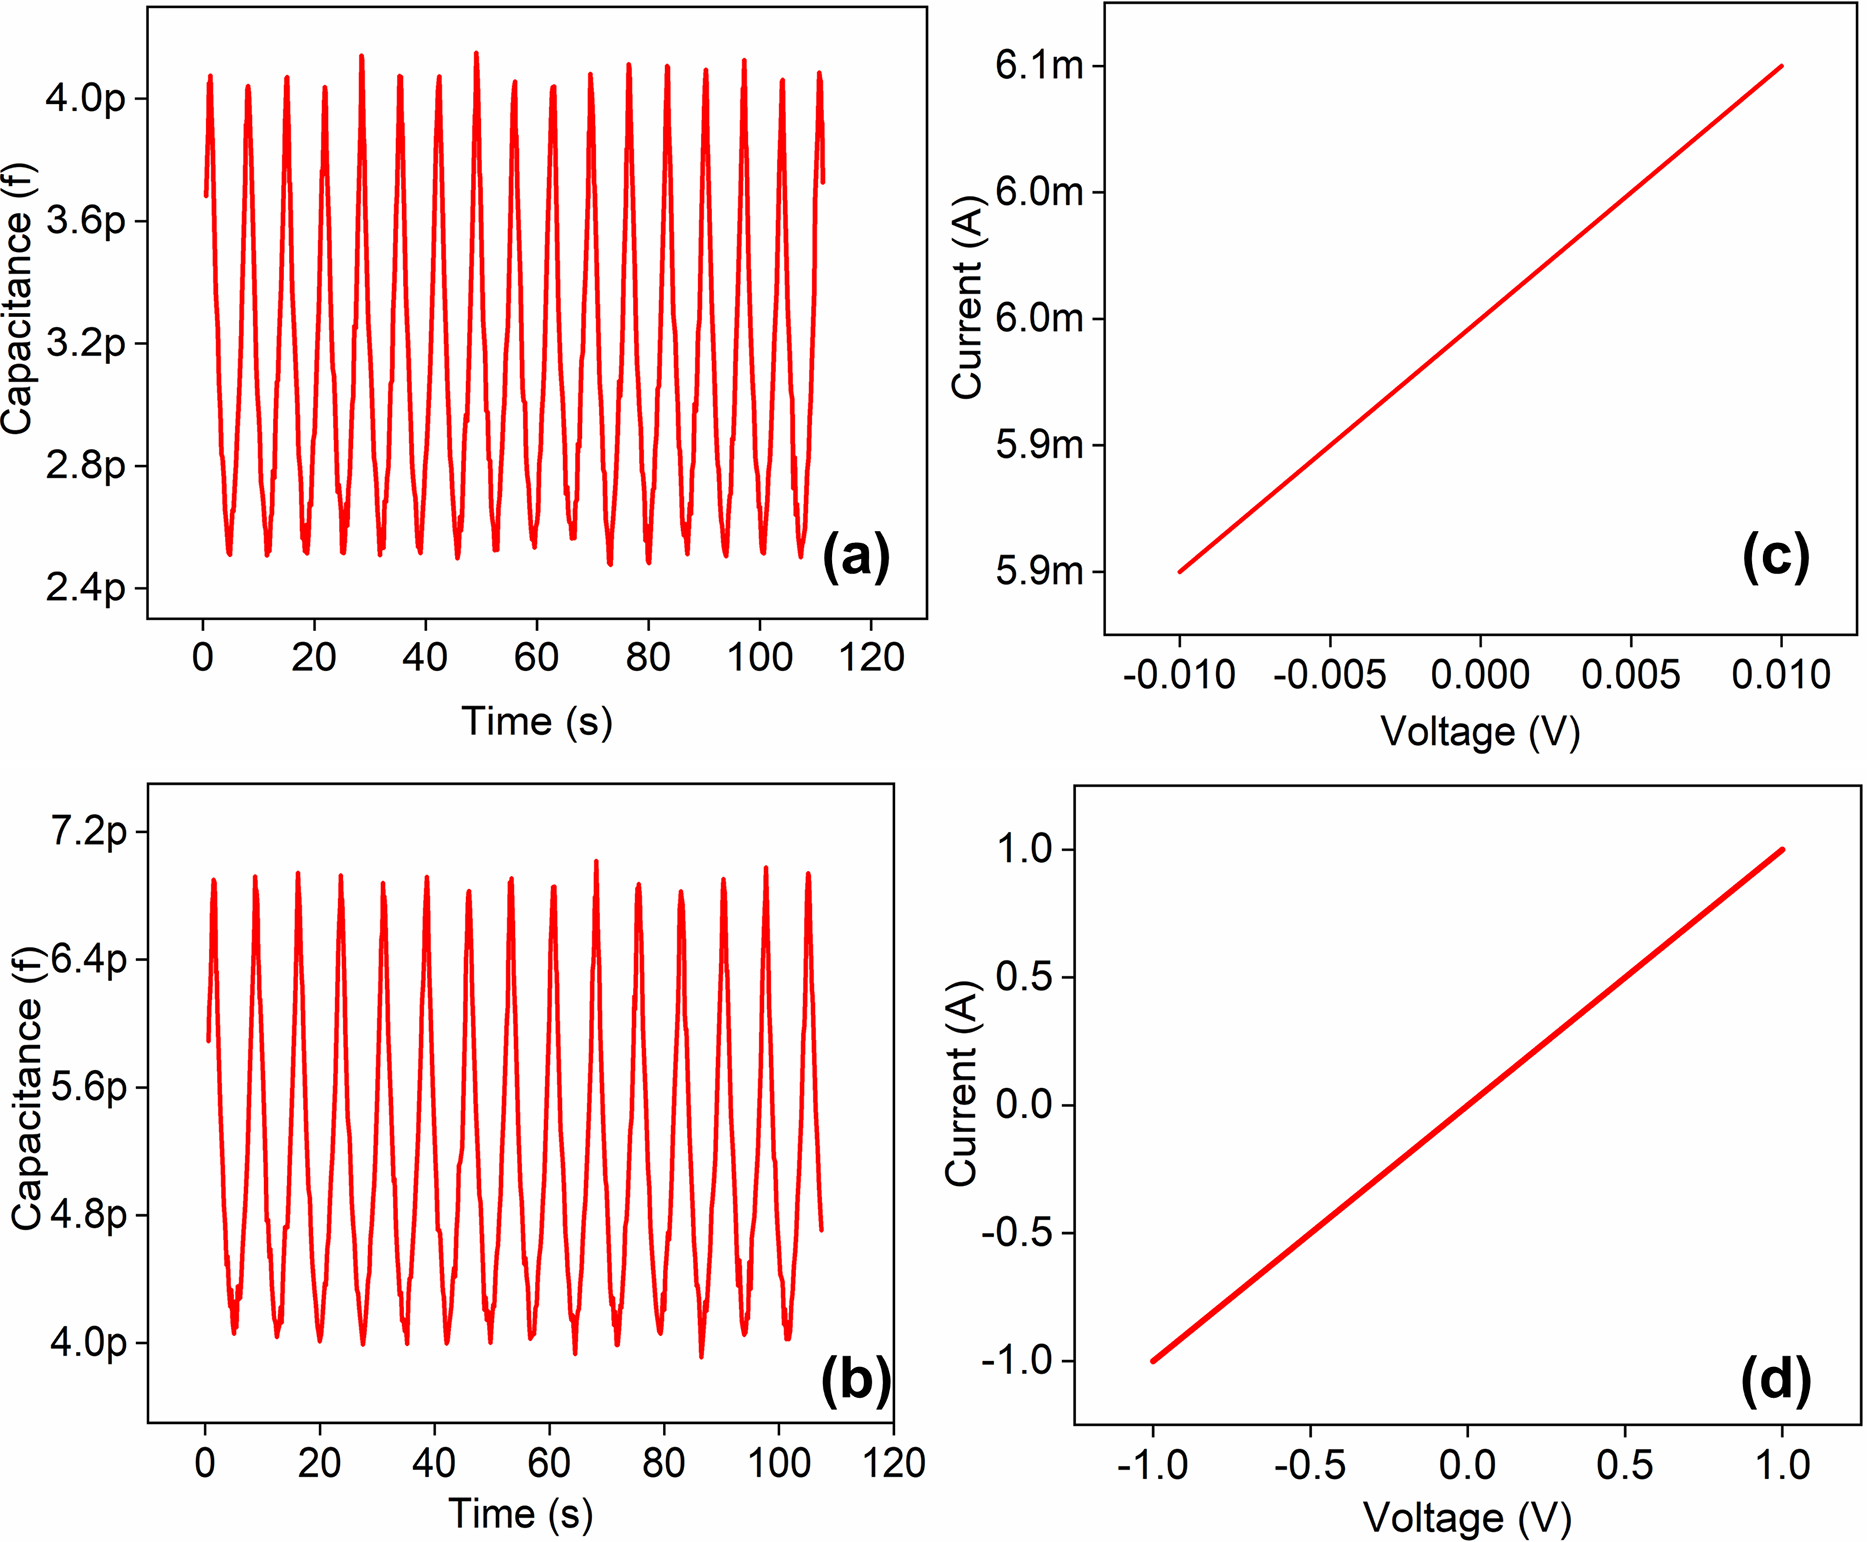
Figure 7: Representation of (a) CNT-based capacitor sensor and (b) GnP-based capacitor sensor when force is applied to the foam, I–V characterisation of (c) CNT-PDMS foam and (d) GnP-PDMS foam
In both cases, the sensors exhibit stable, repeatable peaks and troughs, indicating good repeatability and mechanical resilience under dynamic conditions. However, the GnP based sensor shows a sharper and more defined change in capacitance. The higher capacitance ranges and more consistent peak pattern in the GnP based foam demonstrate superior sensitivity and faster recovery. This suggests that the GnP sensor responds more efficiently to periodic forces, making it more suitable for real-time biomedical monitoring, where responsiveness and repeatability are crucial.
The hysteresis behavior of the fabricated capacitive pressure sensors was evaluated using cyclic loading–unloading measurements. Hysteresis was quantified as the maximum difference between the loading and unloading responses normalized by the full-scale output. The GnP–PDMS foam exhibited a hysteresis of approximately 12.5%, whereas the CNT–PDMS foam showed a higher hysteresis of approximately 18%. The lower hysteresis observed in the GnP-based composite indicates improved elastic recovery and reduced viscoelastic energy dissipation under repeated loading–unloading cycles.
I–V (current-voltage) characterization of GnP/PDMS and CNT/PDMS-based sugar foam capacitive pressure sensors is crucial for understanding their electrical behaviour under varying pressure conditions. In the case of the GnP-PDMS sensor, the GnP flakes embedded in the PDMS matrix improve conductivity and enhance sensitivity by providing a flexible and conductive path that responds to applied pressure. The porous sugar foam structure contributes to the overall flexibility and increases the sensor’s compressibility, allowing it to detect small pressure changes by altering capacitance. Similarly, the CNT-PDMS-based sensor benefits from the high aspect ratio and excellent conductivity of CNT, which form conductive networks within the PDMS. These networks, combined with the sugar foam’s mechanical properties, result in a sensor that exhibits excellent sensitivity and durability. Initially, the graph may show a nearly linear relationship at low voltages, but as voltage or pressure increases, the graph often exhibits non-linear behavior due to the compressible and piezo-resistive nature of the PDMS and sugar foam structure. Under applied pressure, the sugar foam deforms, reducing contact resistance and increasing current for a given voltage, shifting the I–V curve and revealing the sensor’s sensitivity to pressure. The conductivity comparison between the two composites is based on the I–V characteristics shown in Fig. 7c,d. Fig. 7c shows a linear I–V relationship over a wide voltage range (±1 V), with a current magnitude reaching ±1 A, indicating Ohmic behavior and low resistance. In contrast, Fig. 7d shows a much smaller current (in the μA range) over a narrower voltage window (±10 mV), implying higher resistance and thus lower conductivity. According to Ohm’s Law (I = V/R) and the conductivity equation (σ = L/(R·A)), the slope of the I–V curve (ΔI/ΔV) is inversely proportional to the resistance.
3.4 Real-Time Application Validation
The model of the sole was created in SolidWorks and exported to Abaqus CAE in STEP format. The model was discretized using a node, second-order (quadratic) tetrahedral (C3D10) solid element. The solution for von Mises stress converged above 301,000 elements. The mesh sensitivity test is shown in Fig. 8d. Fig. 8 depicts three stages of walking, highlighting the stress distribution on the sensor in the insole under the foot. The left panels show photographs of the foot on the insole with the sensor, marked by red dashed boxes indicating the sensor location. The right panels present finite element analysis (FEA) simulation results of the von-Mises stress distribution on the insole surface during walking. These stress maps reveal the localised pressure points corresponding to foot-ground contact. The top panels show initial foot stress distribution with significant pressure near the heel region. The middle panels illustrate the mid-stance phase, where pressure spreads across the foot, with reduced maximum stress. The bottom panels depict the toe-off phase, where pressure is concentrated near the toe area. The stress values, indicated by the colour scales, show the sensor response sensitivity and the ability of the GnP PDMS sensor to capture detailed pressure changes through the gait cycle. In an insole system, the load is distributed across multiple contact zones—heel, arch, metatarsal, and toe. Each sensor pad only bears a fraction of that total load, typically in the range of 5–50 N, depending on its area (often ~1–2 cm2).
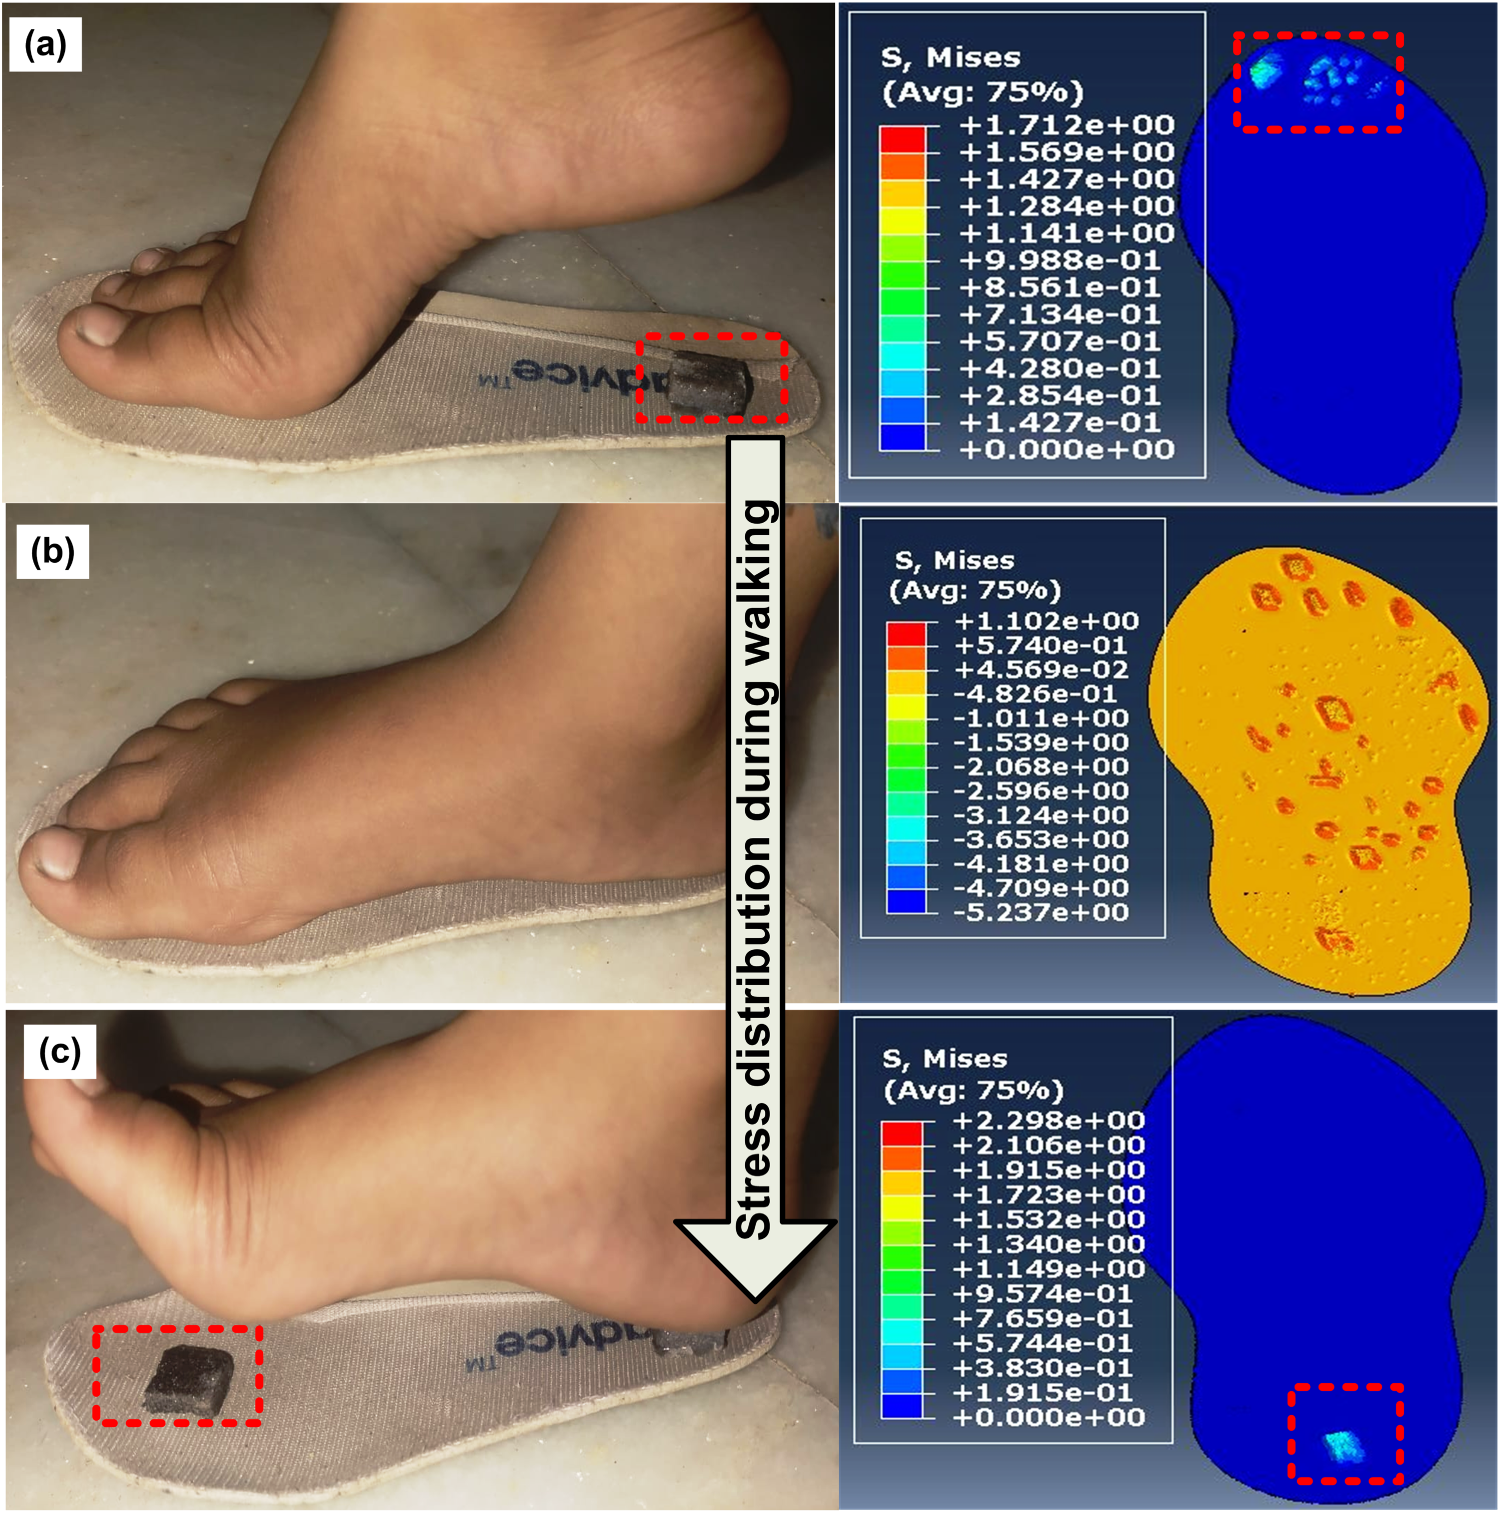
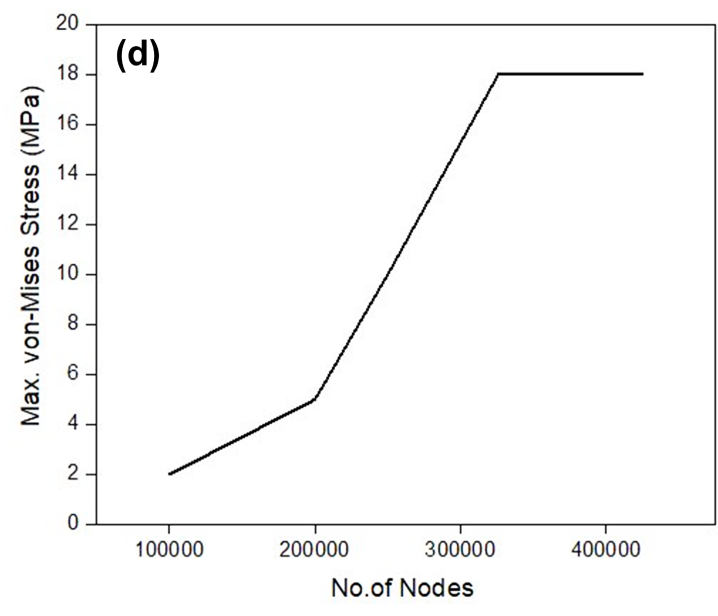
Figure 8: Stress distribution during walking in the case of (a) toe; (b) mid; (c) heel; (d) Mesh sensitivity test
For example,
If the total foot contact area is 100 cm2 and the total load is 500 N, then the average local pressure ≈ is 5 N/cm2. Hence, each small pressure sensor (~1 cm2) experiences about 5–40 N, which matches the range used in the test. The same load range is considered for the sensitivity analysis. This approach highlights the suitability of GnP based flexible capacitive sensors for biomechanical applications. The use of a sugar template enables the fabrication of lightweight, conformable sensors, while the GnP component provides high electrical conductivity and sensitivity. The combined experimental and FEA analysis validates the sensor’s performance in capturing dynamic pressure distributions during gait, essential for applications like gait monitoring, rehabilitation, and wearable health devices. This study demonstrates that the fabricated sensor accurately detects localised stress changes during different walking phases, making it a promising candidate for advanced gait analysis systems. The sensor exhibits a high sensitivity of approximately 0.20 pF/N at lower forces (around 5–10 N), indicating strong responsiveness to subtle pressure changes during the initial heel-strike phase of walking. As the applied load increases beyond 25 N, the sensitivity gradually decreases to about 0.06 pF/N, corresponding to the toe-off stage where PDMS deformation becomes less pronounced.
3.5 Comparative Analysis of CNT–PDMS and GnP–PDMS Composites
Fig. 9 presents a comparative electro-mechanical analysis of CNT–PDMS and GnP–PDMS capacitive pressure sensors. The 3D sensitivity profile (Fig. 9a) shows superior normalized sensitivity of the GnP–PDMS sensor across the full pressure range due to its enhanced percolation network. The performance heat map (Fig. 9b) highlights consistent improvements in sensitivity, hysteresis, repeatability, and stability for the GnP based composite. The contour plot (Fig. 9c) depicts a non-uniform, four-lobed angular pressure distribution under radial loading, with peak deformation in the central region. Such pressure variation reflects the inherent anisotropy and boundary effects of flexible polymer sensors. The electric field streamline plot (Fig. 9d) confirms stable field distribution and effective dielectric coupling, ensuring a linear capacitance–pressure response. GnP-reinforced PDMS sensors demonstrate enhanced electrical conductivity and mechanical properties, leading to improved pressure sensing performance. The increased sensitivity enables accurate pressure mapping, which is critical for gait analysis applications. Such precision is valuable for diagnosing and monitoring foot-related disorders. These sensors are particularly beneficial for early detection of diabetic foot ulcers. GnP integration also improves responsiveness and reliability in wearable health-monitoring devices. In this study, flexible capacitive pressure sensors were fabricated using PDMS with GnP and CNT fillers. The GnP composite sensor exhibited higher sensitivity (0.032 pF/N) than the CNT-based sensor (0.019 pF/N). Lower resistance and higher conductivity were confirmed through I–V characterization and COMSOL-based simulations.
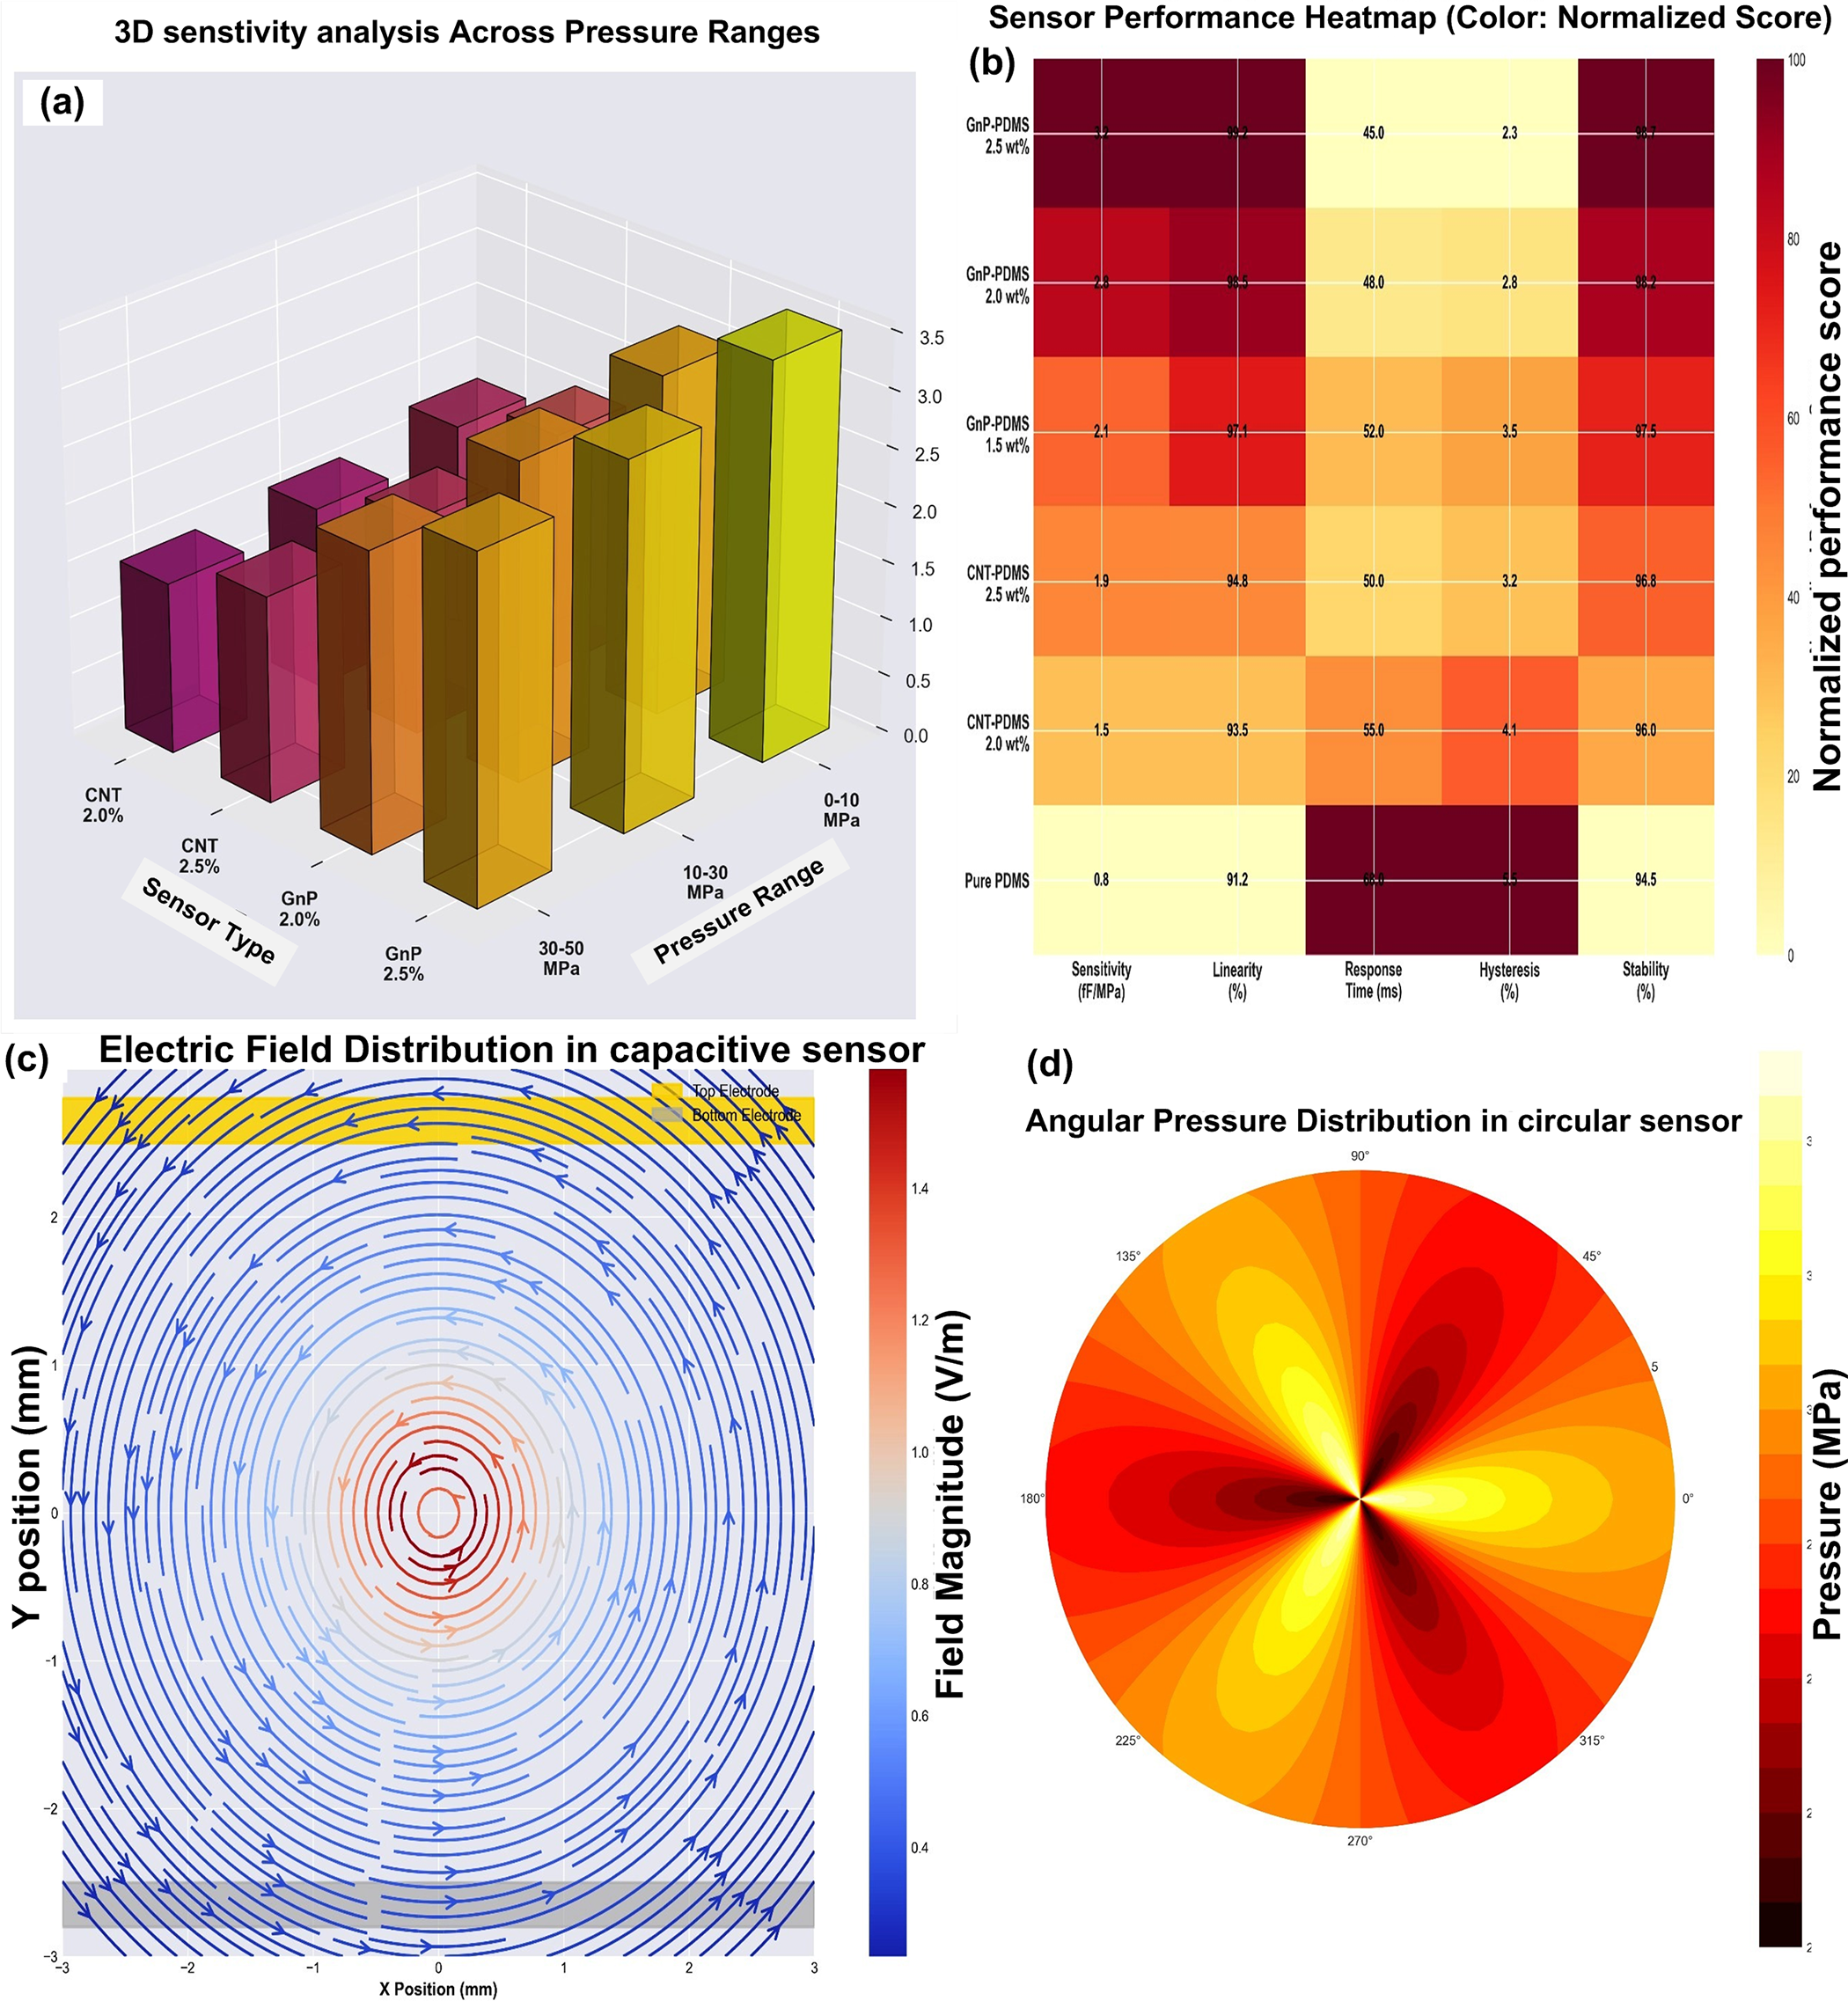
Figure 9: Comprehensive performance evaluation of CNT–PDMS and GnP–PDMS composite capacitive pressure sensors (a) 3D Sensitivity analysis across pressure ranges; (b) Sensor performance heatmap (Scaled normalized scores); (c) Angular pressure distribution on circular sensor and (d) Electric field distribution in capacitive sensor
The fabrication of capacitive pressure sensors using PDMS combined with GnP and CNTs is successfully achieved. The following conclusions have been drawn:
• GnP’s high electrical conductivity and mechanical strength significantly enhance pressure sensor performance and measurement precision
• Sensitivity and accurate pressure mapping make the sensor well-suited for gait analysis and foot health monitoring.
• GnP–PDMS sensors enable more responsive, reliable, and comfortable wearable devices, particularly for early detection of diabetic foot ulcer.
• Flexible capacitive pressure sensors were fabricated using PDMS with GnP and CNT fillers.
• The GnP composite showed higher sensitivity (0.032 vs. 0.019 pF/N for CNT) and lower resistance, consistent with COMSOL and mean-field homogenization results.
Acknowledgement: The authors gratefully acknowledge the institutional support and facilities provided for carrying out this research work.
Funding Statement: The authors received no specific funding for this study.
Author Contributions: Rama Gautam: Contributed to conceptualisation, experimental investigation, data analysis, and manuscript preparation. Dhariya Singh Arya: Assisted in research idea development and experimental work. Nikhil Marriwala: Supported experiments and data acquisition. Supervised the research and provided overall guidance. Reeta Devi: Supervised the research and provided overall guidance. All authors reviewed and approved the final version of the manuscript.
Availability of Data and Materials: The datasets generated and/or analysed during the current study are available from the corresponding author upon reasonable request.
Ethics Approval: This research does not involve human participants or animal experiments; therefore, ethical approval was not required.
Conflicts of Interest: The authors declare no conflicts of interest.
References
1. Chaudhury P, Samantaray S. Modelling and optimization of machining of SiC-CNT conductive ceramic composite used for micro and nano sensor by electrical discharge machining. J Inst Eng Ind Ser D. 2021;102(1):437–52. doi:10.1007/s40033-021-00256-3. [Google Scholar] [CrossRef]
2. Dau VT, Yamada T, Viet Dao D, Thanh Tung B, Hata K, Sugiyama S. Integrated CNTs thin film for MEMS mechanical sensors. Microelectron J. 2010;41(12):860–4. doi:10.1016/j.mejo.2010.07.012. [Google Scholar] [CrossRef]
3. Pan L, Chortos A, Yu G, Wang Y, Isaacson S, Allen R, et al. An ultra-sensitive resistive pressure sensor based on hollow-sphere microstructure induced elasticity in conducting polymer film. Nat Commun. 2014;5:3002. doi:10.1038/ncomms4002. [Google Scholar] [PubMed] [CrossRef]
4. Kim K, Zhu W, Qu X, Aaronson C, McCall WR, Chen S, et al. 3D optical printing of piezoelectric nanoparticle-polymer composite materials. ACS Nano. 2014;8(10):9799–806. doi:10.1021/nn503268f. [Google Scholar] [PubMed] [CrossRef]
5. Bijender, Kumar A. Flexible and wearable capacitive pressure sensor for blood pressure monitoring. Sens Bio Sens Res. 2021;33:100434. doi:10.1016/j.sbsr.2021.100434. [Google Scholar] [CrossRef]
6. Borah CA, Kirtania S, Banerjee S, Kashyap S. Through thickness stress analysis of GNP/epoxy nanocomposites with low graphene content. J Inst Eng Ind Ser D. 2024;105(2):1201–8. doi:10.1007/s40033-023-00552-0. [Google Scholar] [CrossRef]
7. Zhang S, Chen C, Bin W, Zheng X, San H, Hofmann W. Dual-axis thermal convective inclinometer based on CNT/PDMS composite. J Mater Sci Mater Electron. 2018;29(22):18997–9004. doi:10.1007/s10854-018-0025-x. [Google Scholar] [CrossRef]
8. Zazoum B, Batoo KM, Ali Khan MA. Recent advances in flexible sensors and their applications. Sensors. 2022;22(12):4653. doi:10.3390/s22124653. [Google Scholar] [PubMed] [CrossRef]
9. Ren CE, Zhao MQ, Makaryan T, Halim J, Boota M, Kota S, et al. Porous two-dimensional transition metal carbide (MXene) flakes for high-performance Li-ion storage. ChemElectroChem. 2016;3(5):689–93. doi:10.1002/celc.201600059. [Google Scholar] [CrossRef]
10. Jeong C, Joung C, Lee S, Feng MQ, Park YB. Carbon nanocomposite based mechanical sensing and energy harvesting. Int J Precis Eng and Manuf-Green Tech. 2020;7(1):247–67. doi:10.1007/s40684-019-00154-w. [Google Scholar] [CrossRef]
11. Li J, Li W, Huang W, Zhang G, Sun R, Wong CP. Fabrication of highly reinforced and compressible graphene/carbon nanotube hybrid foams via a facile self-assembly process for application. J Mater Chem C. 2017;5(10):2723–30. doi:10.1039/C7TC00219J. [Google Scholar] [CrossRef]
12. Basu M, Parihar V, Lincon A, Joshi VP, Das S, DasGupta S. Development of graphene oxide-PDMS composite dielectric for rapid droplet movement in digital microfluidic applications. Chem Eng Sci. 2021;230:116175. doi:10.1016/j.ces.2020.116175. [Google Scholar] [CrossRef]
13. Meguid SA, Weng GJ. Micromechanics and nanomechanics of composite solids. In: Micromech and nanomech of composite solids. Cham, Switzerland: Springer International Publishing; 2017. p. 1–506. doi:10.1007/978-3-319-52794-9. [Google Scholar] [CrossRef]
14. Jia H, Kong QQ, Liu Z, Wei XX, Li XM, Chen JP, et al. 3D graphene/carbon nanotubes/polydimethylsiloxane composites as high-performance electromagnetic shielding material in X-band. Compos Part A Appl Sci Manuf. 2020;129:105712. doi:10.1016/j.compositesa.2019.105712. [Google Scholar] [CrossRef]
15. Gautam R, Marriwala N, Devi R. A review: study of Mxene and graphene together. Meas Sens. 2023;25:100592. doi:10.1016/j.measen.2022.100592. [Google Scholar] [CrossRef]
16. Ghazzawi SM, Tallman TN. Deformation-dependent electrical resistivity of fiber-reinforced nanocomposites: a concentric cylindrical model approach. Compos Sci Technol. 2023;243:110251. doi:10.1016/j.compscitech.2023.110251. [Google Scholar] [CrossRef]
17. Kumar K, Kumar J, Singh VK, Verma RK. An integrated module for machinability evaluation and correlated response optimization during milling of carbon nanotube/glass fiber modified polymer composites. Multiscale Multidiscip Model Exp Des. 2021;4(4):303–18. doi:10.1007/s41939-021-00099-1. [Google Scholar] [CrossRef]
18. Anadkat N, Rangachar DMJS, Univeristy H. Simulation based analysis of capacitive pressure sensor with COMSOL multiphysics. Int J Eng Res. 2015;4(4):848–52. doi:10.17577/ijertv4is041064. [Google Scholar] [CrossRef]
19. Dileena L, Baby Sreeja SD, Sreekala CO. A comparative study on piezoelectric and piezoresistive pressure sensor using COMSOL simulation. Mater Today Proc. 2021;46:3121–6. doi:10.1016/j.matpr.2021.02.688. [Google Scholar] [CrossRef]
20. Keshyagol K. Numerical simulation analysis of a capacitive pressure sensor for wearable medical devices. Eng Proc. 2024;82(1):14. doi:10.3390/ecsa-11-20348. [Google Scholar] [CrossRef]
21. Shahiri-Tabarestani M, Ganji BA, Sabbaghi-Nadooshan R. Design and simulation of high sensitive capacitive pressure sensor with slotted diaphragm. In: Proceedings of the 2012 International Conference on Biomedical Engineering (ICoBE); 2012 Feb 27–28. Penang, Malaysia. p. 484–9. doi:10.1109/icobe.2012.6179064. [Google Scholar] [CrossRef]
22. Haghgoo M, Ansari R, Hassanzadeh-Aghdam MK, Jang SH, Nankali M. Simulation of the role of agglomerations in the tunneling conductivity of polymer/carbon nanotube piezoresistive strain sensors. Compos Sci Technol. 2023;243:110242. doi:10.1016/j.compscitech.2023.110242. [Google Scholar] [CrossRef]
23. Otsuka H, Ninoseki T, Oka C, Hata S, Sakurai J. The fabrication and evaluation of a capacitive pressure sensor using Ru-based thin film metallic glass with structural relaxation by heat treatment. Sensors. 2023;23(23):9557. doi:10.3390/s23239557. [Google Scholar] [PubMed] [CrossRef]
Cite This Article
 Copyright © 2026 The Author(s). Published by Tech Science Press.
This work is licensed under a Creative Commons Attribution 4.0 International License , which permits unrestricted use, distribution, and reproduction in any medium, provided the original work is properly cited.
 Downloads
 Citation Tools