
 Submit a Paper
 Propose a Special lssue
 Open Access
ARTICLE

Machine Learning-Based Analysis of Contributing Factors Affecting Autonomous Driving Behavior in Urban Mixed Traffic
1 Department of Transportation and Logistics Engineering, Hanyang University ERICA, Ansan-si, Gyeonggi, Republic of Korea
2 Department of Smart City Engineering, Hanyang University ERICA, Ansan-si, Gyeonggi, Republic of Korea
* Corresponding Author: Cheol Oh. Email:
(This article belongs to the Special Issue: AI-Driven Big Data Analytics for Sustainable Mixed Traffic and Mobility Systems)
Computers, Materials & Continua 2026, 87(2), 60 https://doi.org/10.32604/cmc.2026.076980
Received 30 November 2025; Accepted 06 January 2026; Issue published 12 March 2026
 View Full Text
 Download PDF
Abstract
Analyzing the driving behavior of autonomous vehicles (AV) in mixed traffic conditions at urban intersections has become increasingly important for improving intersection design, providing infrastructure-based guidance information, and developing capability-enhanced AV perception systems. This study investigated the contributing factors affecting AV driving behavior using the Waymo Open Dataset. Binarized autonomous driving stability metrics, derived via a kernel density estimation, served as the target variables for a random forest classification model. The model’s input variables included 15 factors divided into four types: intersection-related, surrounding object-related, road infrastructure-related, and time-of-day-related types. The random forest classification model was employed to identify the key factors affecting autonomous driving behavior. In addition, the identified factors were further ranked based on feature importance. SHAP analysis was utilized to enhance model interpretability by quantifying the contribution of each factor and identifying their directional impacts. The type of intersection factor was found to have an importance of 0.243 and was the most influential factor on autonomous driving behavior. On average, intersection-related factors had an importance of 0.196, which is approximately a 31.1% margin over the average importance of surrounding object-related factors. Additionally, the surrounding object-related factors that were collected through sensors on the autonomous vehicle had a high degree of feature importance, especially with the number of pedestrians having the highest importance (0.107) of the types of objects. The correlation between these findings can contribute to the development of various treatments to improve more harmonized AVs’ maneuvering with other road users and facilities in urban mixed traffic environments.Keywords
As the market penetration rate (MPR) of autonomous vehicles (AVs) has been increasing due to advances in autonomous driving technology, the impact of AVs on traffic safety under mixed traffic conditions needs to be considered. The adoption of autonomous driving technology is generally expected to alleviate traffic accidents. However, the behavioral differences between AVs and manually driven vehicles (MVs) would deteriorate mixed traffic safety, and traffic accidents involving AVs continue to be reported [1–3]. According to reports by the California Department of Motor Vehicles (CA DMV), 735 accidents involving AVs were reported as of August 2024, and the frequency of such incidents is increasing [4]. Moreover, most AV-related accidents involve rear-end collisions by MVs due to the unfamiliarity of conventional human drivers with the distinct driving behavior of AVs. Therefore, understanding the differences in driving behavior between AVs and MVs is a backbone for devising countermeasures for improving traffic safety in mixed traffic conditions.
Urban interrupted flow facilities are critical determinants in road operations, and these facilities are also considered hazardous. Intersections are representative facilities that cause frequent traffic conflicts because of the complex structure where roads intersect. Wei et al. [5] reported that 25% of fatal traffic accidents in the United States are related to intersections. Lin et al. [6] identified hazardous road segments based on the number of accidents in Taiwan and reported that approximately 50% of traffic accidents occurred at 3-way intersections from 2018 to 2019. On the one hand, traffic accident statistics from South Korea over five years (2018–2022) show that 52.1% (519,524 cases) of total accidents occurred at intersections [7]. In terms of severity, 20.7% of those injured in intersection-related accidents are seriously injured, which indicates that the intersections are hazardous areas contributing to a large portion of severe accidents [7]. Intersections are also challenging road sections for AVs because of the complex traffic conditions. AVs often encounter situations where it is challenging to predict the movements of surrounding objects and decide on their next action at intersections because of entwined interactions between various road users. An analysis of AV-related accidents reported to the CA DMV through 2019 revealed that 73% of the accidents occurred at intersections [8]. Therefore, efforts to improve traffic safety at intersections are required by evaluating the driving behavior of AVs passing through intersections and by analyzing the road and traffic environments that affect AVs’ driving behavior. The road and traffic environments in this study are defined as factors that encompass both the physical features of the road (e.g., road alignment, the number of lanes, and surrounding infrastructure) and traffic/environmental conditions (e.g., traffic volume and weather conditions). The objective of this study is to identify the factors affecting the driving behavior of AVs in urban interrupted flow. The Waymo Open Dataset was utilized to ensure the realism of the results. Additionally, the driving footage of AVs was analyzed to identify surrounding factors potentially impacting the autonomous driving.
This paper is organized as follows: Section 2 comprehensively reviews the literature. Section 3 presents the methodology for analyzing the driving behavior of AVs at intersections based on real-world empirical data and assessing the factors influencing autonomous driving behavior. Section 4 includes a description of the data employed in this study and the steps for processing data to conduct machine learning. The random forest technique was adopted to analyze the factors affecting autonomous driving behavior. The results of the analysis and a discussion of the results are presented in Section 5. Finally, Section 6 concludes by summarizing this study and the results.
This section reviews existing studies that analyzed the driving behavior of AVs in mixed traffic conditions via real-world data. Second, the driving safety indicators for individual vehicles adopted in existing studies were investigated to quantify the behavioral change in AVs. Finally, studies that investigated the challenges of AVs driving through intersections were reviewed.
2.1 Analysis of Real-World Autonomous Driving Data
Recently, the release of AVs’ real-world driving datasets, such as the Waymo Open Dataset, nuScenes, and Lyft5, has suggested that researchers utilize empirical data in their studies that analyze the impact of AVs on traffic. Hu et al. [9] compared the driving behavior of AVs and MVs in the following situation via the Waymo Open Dataset. They reported that AVs adopted relatively safe and conservative driving behavior during car-following compared with MVs [9]. Wang et al. [10] analyzed the behavioral differences between AVs and MVs at signalized intersections with the Waymo open dataset and reported that there was a significant difference in the reaction time to signal changes between AVs and MVs. Jang et al. [11] evaluated the driving behavior of AVs and MVs via an AV-following dataset to calibrate the parameters of the car-following (CF) model, which is called the intelligent driver model (IDM) parameters, in a simulation environment. The results revealed that the speed change of MVs was sharper than that of AVs, suggesting that AV driving was more stable than MV driving [11]. Wen et al. [12] analyzed the CF patterns of AVs and MVs from real-world CF datasets. They reported that the variance of speed and acceleration decreased when MVs followed AVs, indicating that traffic safety improved as the MPR of AVs increased [12]. The above studies, based on analyzing real-world data, focused on CF situations, which led to limited data from the CF situations used for analysis. In addition, studies that analyze the impact of road and traffic environments on the driving behavior of AVs via real-world data are insufficient. This study identified contributing factors related to road traffic characteristics that affect the driving stability of AVs.
2.2 Driving Volatility Measures for Individual Vehicles
Autonomous driving Stability metrics (ADSMs), in this study, are defined as metrics that quantify the behavioral changes of AVs derived from interactions with other road users and the surrounding road environment in terms of traffic safety. This study adopted driving volatility measures for individual vehicles mentioned in existing studies to derive the ADSM.
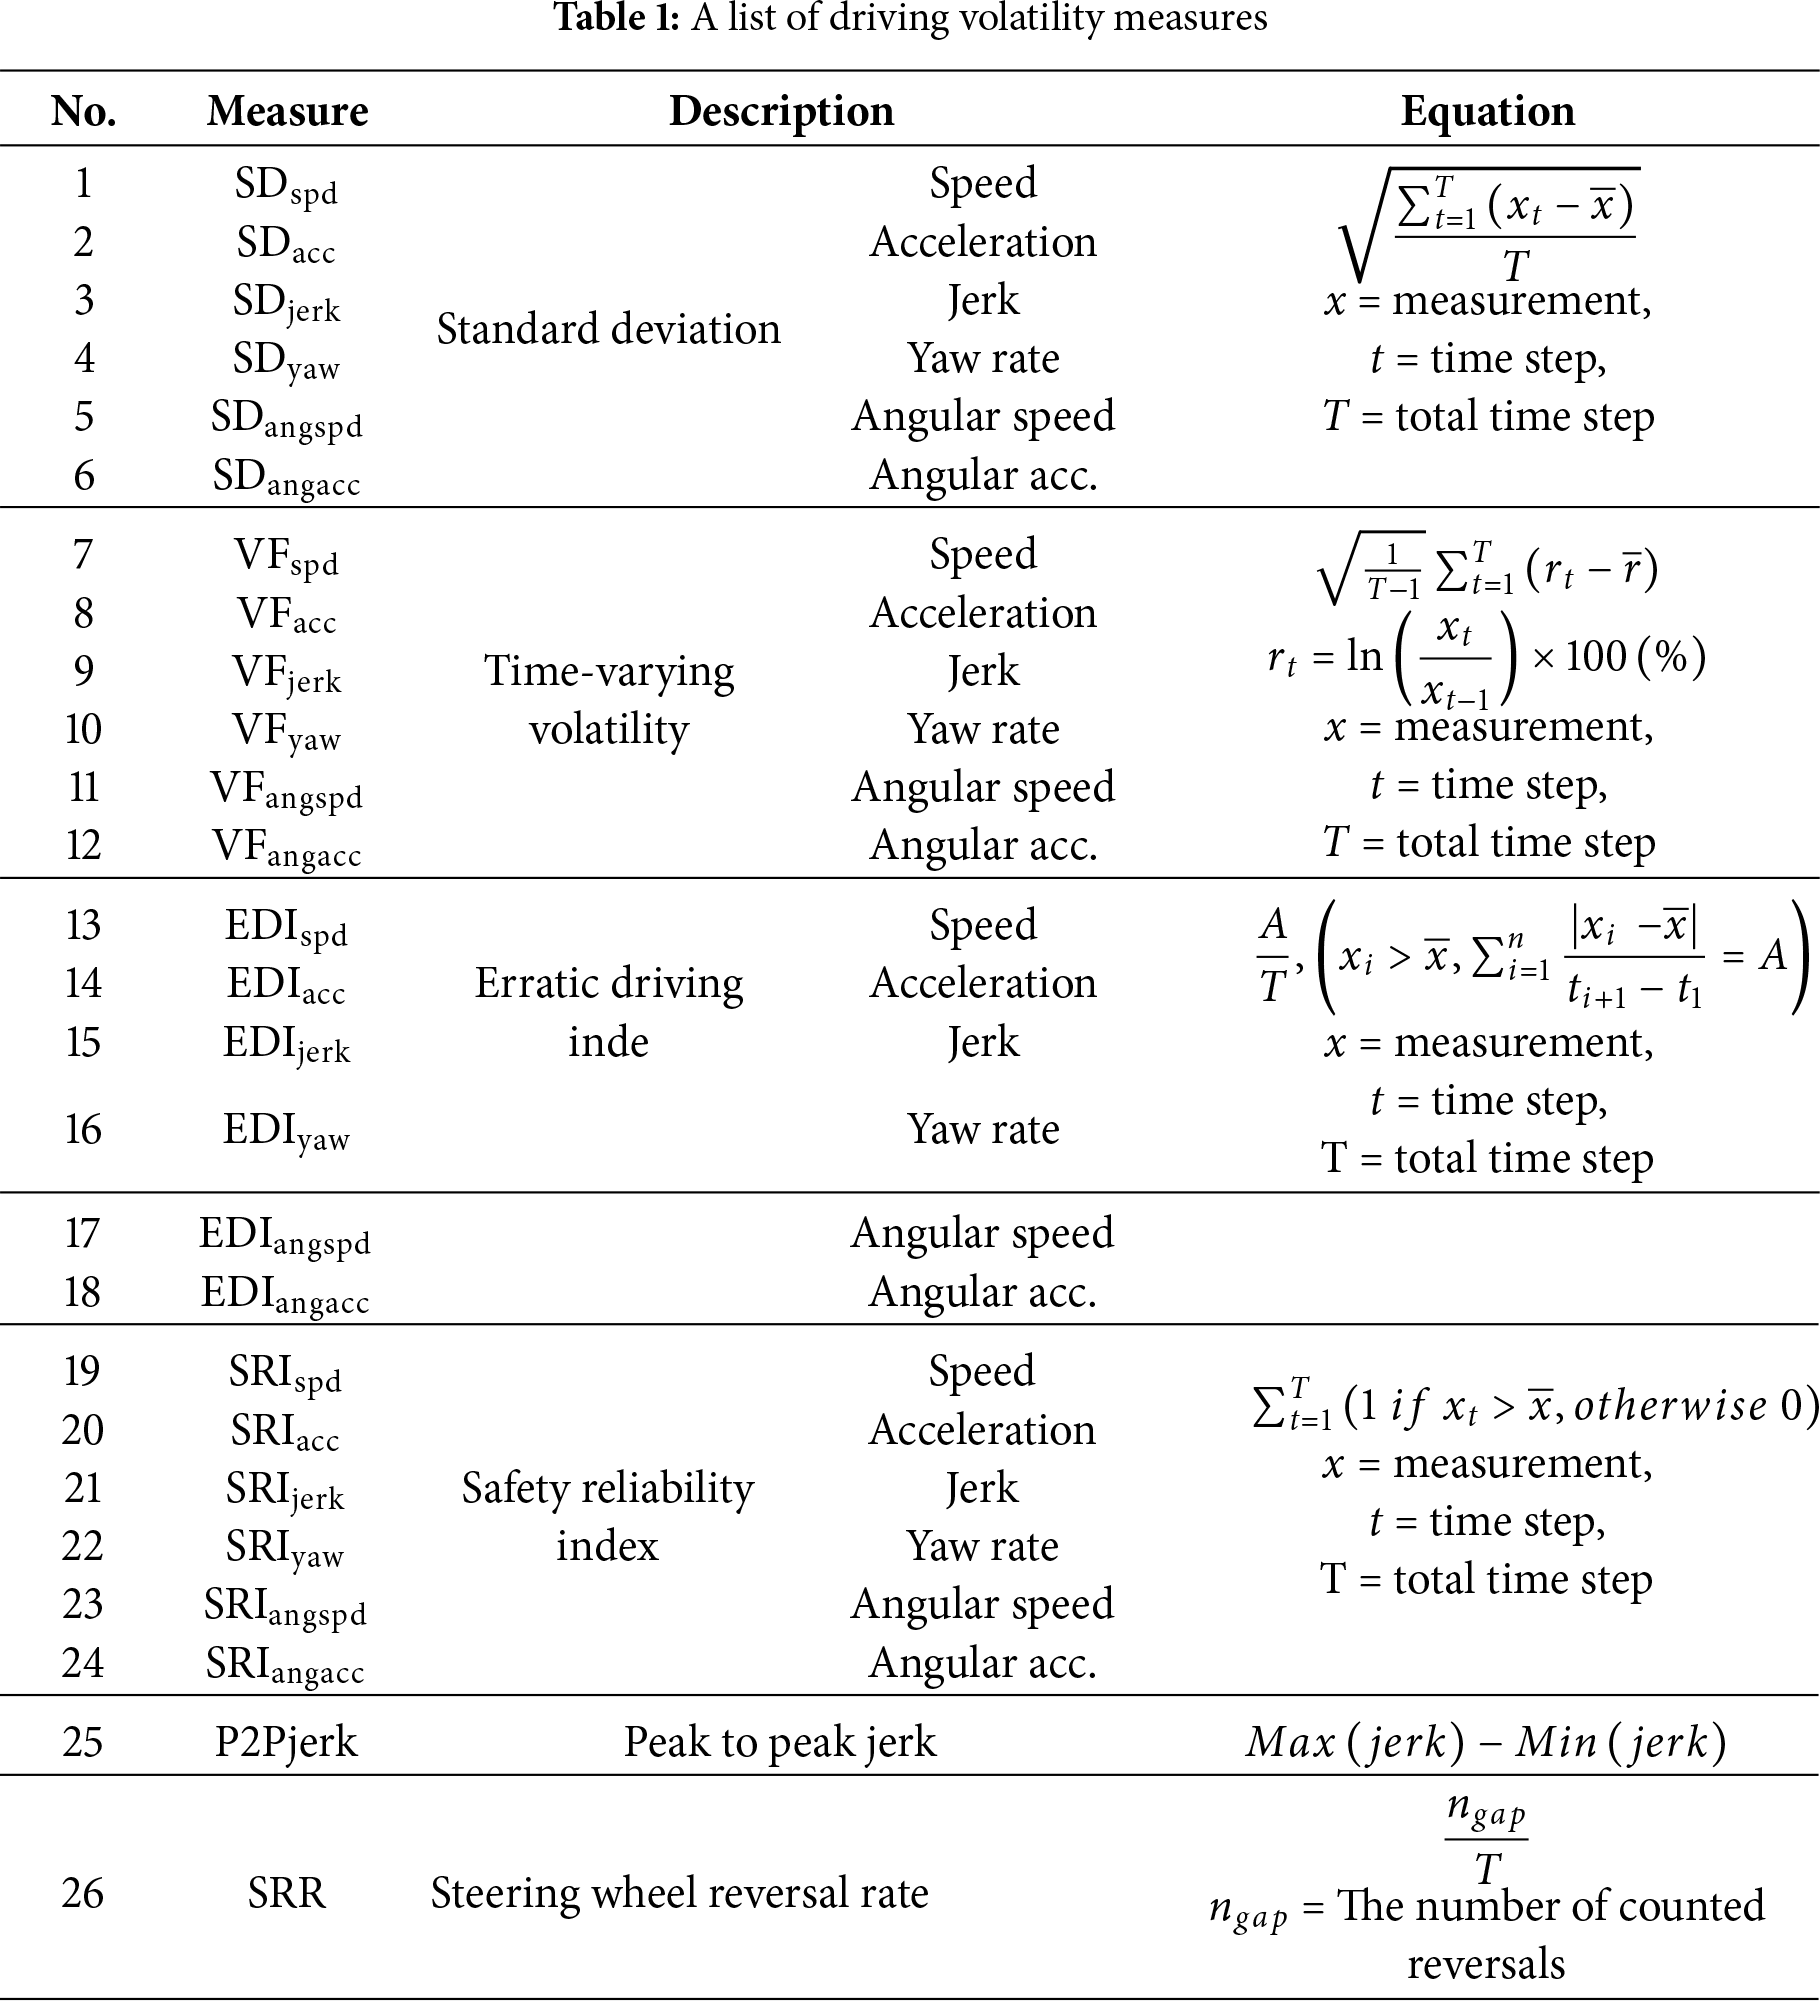
Various studies have been conducted to develop measures for the assessment of driving volatility, in which the standard deviations of both speed and acceleration, along with peak-to-peak jerk, have been used to quantify longitudinal driving volatility [13,14]. Mahdinia et al. [2] proposed time-varying stochastic volatility (VF) as a metric to quantify the change in driving behavior over time. VF is a measure that computes the deviation from the average of the relative change in a variable over time [15]. The erratic driving index (EDI) is computed as the sum of the range where individual variables exceed the threshold during the total time step, and the safety reliability index (SRI) is derived as the ratio of the values of individual variables exceeding the threshold [16]. The steering wheel reversal rate (SRR) is a measure of the lateral driving volatility of individual vehicles and is the ratio of the number of times the steering wheel angle reverses to the driving time [17]. On the one hand, Mohammadnazar et al. [18] analyzed the driving behavior of vehicles at signalized intersections using driving volatility measures such as the standard deviation, coefficient of variation, mean absolute deviation, quartile of variation, and VF. Wali et al. [19] quantified driving volatility based on longitudinal deceleration, lateral deceleration, and jerk to analyze the behavioral changes of vehicles before a crash. Driving volatility measures are commonly used in existing studies to quantify the driving behavior of individual vehicles. These measures capture abrupt behavioral changes of vehicles, such as hard braking or steering maneuvers, often in response to risk events [19]. Therefore, driving volatility can serve as a precursor of crash risk.
2.3 Risky Driving Behavior of AVs at Intersections
Intersections are among the most complex scenarios in which AVs on a road can encounter mixed traffic conditions. Tengilimoglu et al. [20] suggested that 89% of accidents involving AVs occurred at intersections due to the complexity of road environments, which indicates that AVs have more elements to recognize through sensors at intersections than they do at other road sections. Intersections have a high frequency of interaction between road users, such as vehicles and pedestrians, which needs to be considered in real time during the decision-making process for the vehicle to determine appropriate maneuvers [21]. However, AVs sometimes show overly conservative or aggressive behaviors due to their lack of flexibility in dealing with irregular and uncertain situations compared with MVs [8]. AVs are likely to fail to predict the movements of other road users, leading to deadlocks or hazardous situations, especially in intersections where there is a chance of multiple conflicts between road users. Jee et al. [22] compared the driving behavior of AVs and MVs by intersection type via real-world data and reported that AVs were more likely to drive conservatively than were MVs at 4-way unsignalized intersections. This result suggests that the absence of traffic signals, which visually indicate priority, and the more complex structure of intersections increase the potential risk for AVs. Intricate interactions within intersections may lead autonomous vehicles to adopt an overly conservative driving style, which could undermine the overall traffic flow. Lee et al. [23] analyzed the driving behavior of AVs across different types of road segments via the Waymo Open Dataset. Their findings indicated that AVs tend to drive more unstably at unsignalized intersections than at tangent and curved road segments. This suggests that the structural complexity of intersections reduces the driving stability of AVs. The above studies revealed that AVs face challenges when passing through intersections. However, few studies have analyzed the factors impeding the stable driving of AVs with real-world data.
Existing research on AV safety has predominantly focused on vehicle-to-vehicle interactions. However, this approach is limited in capturing variations in driving behavior caused by diverse road users and road environmental conditions. This study evaluated driving instability from the perspective of the ego vehicle’s maneuver to bridge this gap. A novel integrated measure for quantifying the change in driving behavior was developed based on various driving volatility metrics. Furthermore, the contributing factors that compromise the driving stability of AVs at urban intersections were identified by integrating Random Forest with SHAP (SHapley Additive exPlanations).
This study utilized real-world data and derived factors influencing the driving behavior of AVs through machine learning classification methods. The overall framework of this study is shown in Fig. 1. First, the autonomous driving data was processed in step 1, including the computation of additional driving information such as acceleration, jerk, and yaw rate from the raw trajectory data. The driving footage of the AVs was used to extract data collected at intersections. Step 2 focused on quantifying the change in autonomous driving behavior at intersections. The ADSM was derived through principal component analysis (PCA) based on candidate measures from existing studies. Next, machine learning methods were adopted to identify the main factors that affect autonomous driving behavior in step 3. A random forest classification model was utilized, with autonomous driving behavior as the target variable and road traffic characteristics as input variables. Feature importance was then measured to evaluate the contribution of each factor to autonomous driving behavior. In addition, SHAP values were employed for further model interpretation.
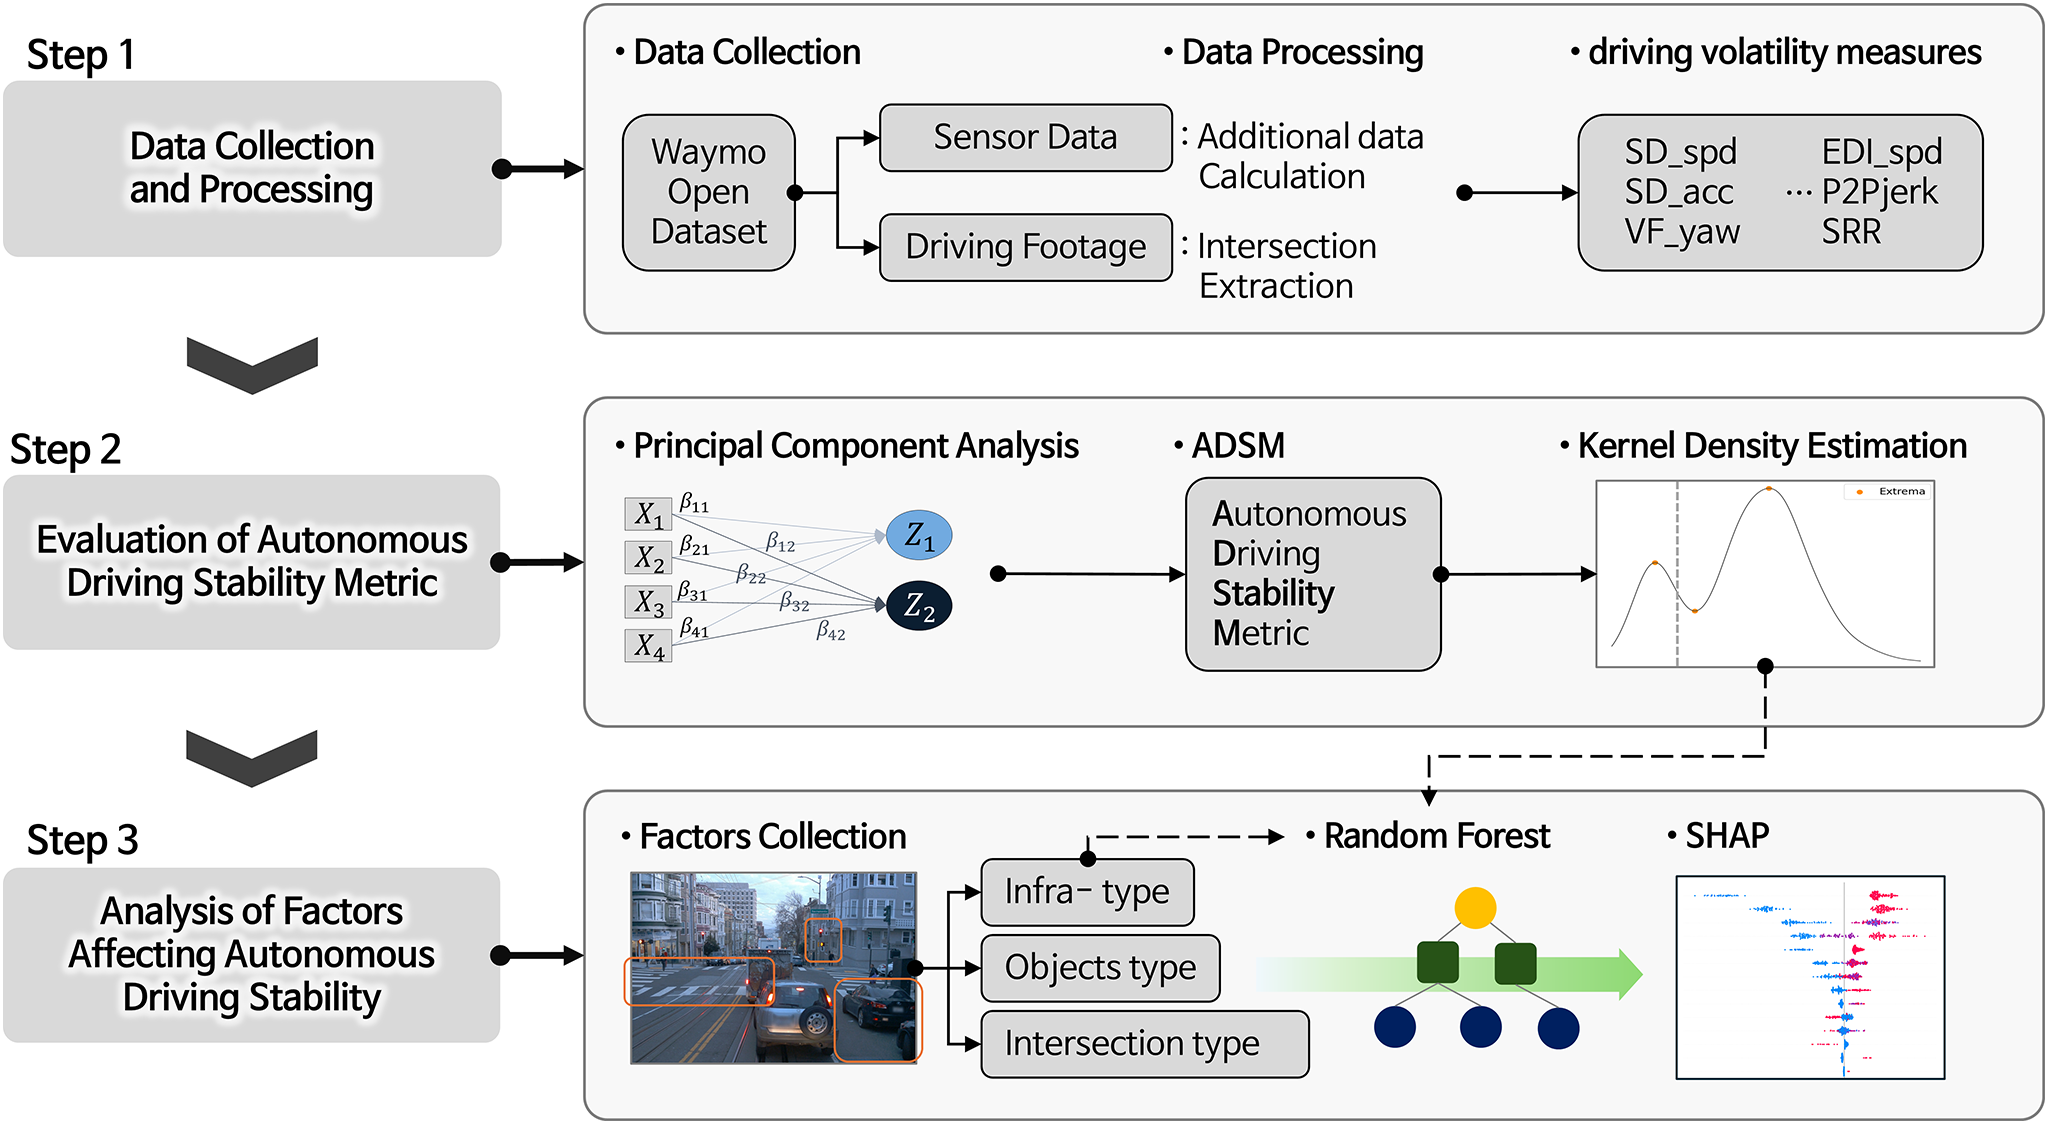
Figure 1: Overall framework
3.1 Autonomous Driving Stability Metrics (ADSM)
Autonomous driving behavior in this study refers to the degree to which AVs maintain safe and stable driving, with a focus on changes in the driving behavior of autonomous vehicles from the perspective of individual vehicles. The ADSM proposed in this study integrates individual driving volatility measures to quantify the stability of autonomous driving. Specifically, this metric defines stability as an AV to maintain consistent behavior with minimal fluctuations when interacting with the surrounding traffic environment.
This study analyzed the factors influencing autonomous driving behavior via a random forest classification model. Random forest is an ensemble method that involves multiple decision trees and selects the best result among them [24,25]. This method is applicable to nonlinear data and generally shows reasonable performance compared with other models [26]. The random forest method was adopted in this study because the relative importance of each variable in identifying the crucial factors affecting driving behavior can be computed during the prediction process. Several studies on traffic safety have utilized random forest model-based variable importance to identify crucial factors [27,28]. The random forest method adopts the idea of Bagging, which generates multiple bootstrap samples from the original dataset that allow for overlap between data. Next, the corresponding decision tree is generated for bootstrap samples and trained in parallel. Finally, the results of each tree are voted on, and the best one is selected [24]. The process of random forest classification is as follows:
• Extract N observations from the original data by allowing duplicates.
• Generate k samples from the extracted observations.
• Train each decision tree for each sample.
• Evaluate the prediction performance of the results of k decision trees.
• Vote on the final classification model according to the majority rule.
The Gini index was selected as the classification criterion for each node. The Gini index represents the impurity of data and was used as an indicator to evaluate the relative importance of individual variables in data classification. The Gini index is expressed in Eq. (1).
where
where
The hyperparameters need to be selected to optimize the model. Bayesian optimization was adopted to tune the hyperparameters of the model through training. Bayesian optimization is an algorithm that estimates the optimal value by collecting posterior information of a function [30]. The optimal hyperparameters are derived by conducting iterations to the maximum number of iterations preset or until the current hyperparameters are close enough to the optimal ones.
SHAP (Shapley Additive exPlanations), originally proposed by [31], is a widely used technique for interpreting model predictions. SHAP enhances the explainability of machine learning models by quantifying the contribution of each feature, thereby improving model transparency and interpretability. The SHAP algorithm is grounded in the concept of Shapley value from cooperative game theory. In SHAP, the contribution of each feature to the model’s prediction is allocated based on its marginal contribution [32]. Shapley values are derived from a set of axioms that uniquely define a fair distribution of feature contributions, as expressed in Eq. (3).
where,
4 Establishment of the Analysis Dataset
This study established an analysis dataset based on real-world data of AVs driving under mixed traffic conditions to evaluate the road and traffic environment factors at intersections that affect autonomous driving behavior. The dataset consisted of the binarized autonomous driving stability metrics as the target variable and factors influencing driving behavior as the input variable of the random forest classification model. Autonomous driving behavior was computed based on the AV trajectory data collected through the sensors embedded in the AVs. In addition, this study adopted PCA to identify crucial measures among multiple candidates. Normalization was conducted to unify measures that have different units of measurement and ranges. The factors influencing autonomous driving behavior were identified in the surrounding object data and driving footage collected through lidar sensors and cameras of AVs. The process of establishing a dataset for analysis is shown in Fig. 2.
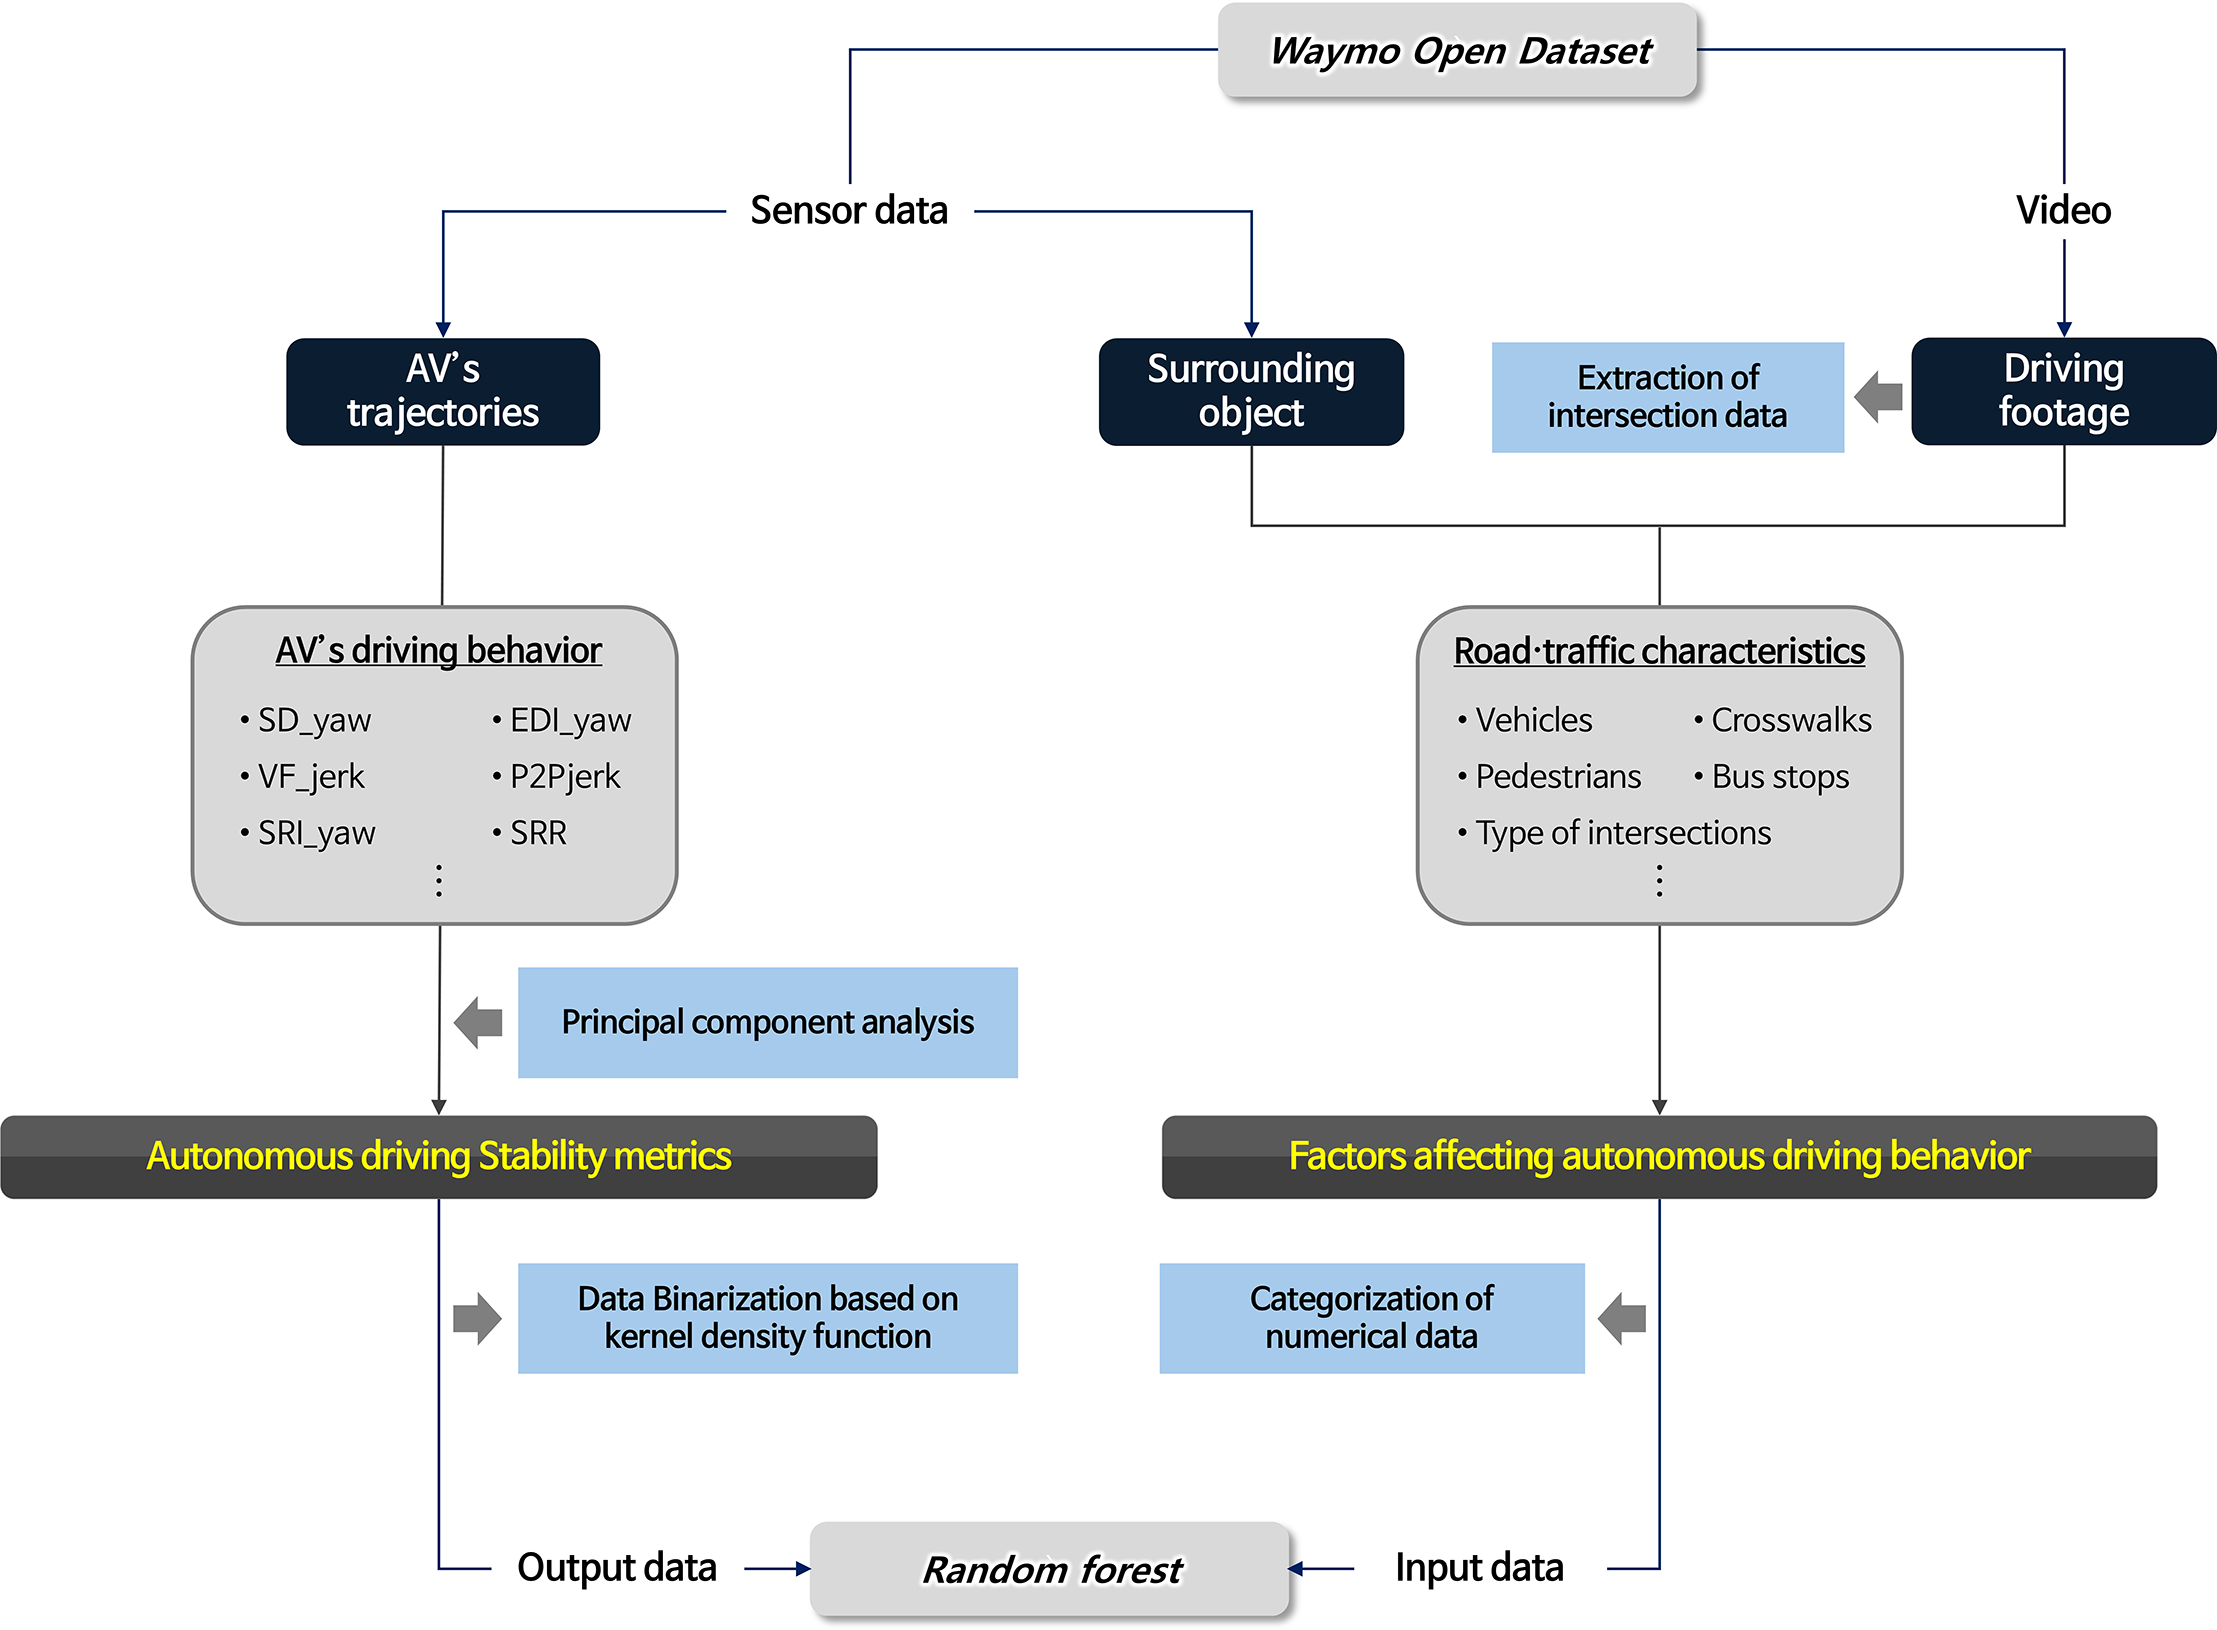
Figure 2: Data processing for RF analysis
The Waymo open dataset released by Waymo LLC in 2019 was employed in this study. The dataset consists of data collected by Waymo AVs in cities in the U.S. (e.g., San Francisco, Mountain View, CA, and Phoenix, AZ). Waymo AVs are equipped with Level 4 autonomous driving systems defined by the Society of Automotive Engineers International (SAE). These vehicles collect the trajectories of AVs and surrounding road users through sensors while driving. The dataset contains 1000 scenarios and was collected for 20 s with a 10 Hz cycle per scenario. More information about the Waymo open dataset can be found at https://waymo.com/open/data.
This study utilized the tabular dataset processed by Hu et al., in which outliers were removed [33]. This dataset consists of the driving trajectories of AVs and nearby road users detected (e.g., position, speed, and heading of vehicles) and environmental information (e.g., weather and time of day) in a tabular format. The AVs’ trajectories were further processed to produce driving information that contains longitudinal driving data (acceleration and jerk) and lateral driving data (angular acceleration and yaw rate). The driving footage of Waymo AVs was used to extract intersection data, in which the road segments were considered intersections if an AV passed through an intersection or changed the driving behavior (AV slowed down or stopped) due to traffic signals and queues at the intersection by observing the video. Only the data of trajectories at intersections were used in this study. In addition, data from segments where no AV movement was observed were excluded since they were unsuitable for analyzing AV driving behavior. Data on rainy weather (0.7% of the total) was also excluded because of the lack of samples. In the end, 597 intersections from 1000 segments were employed in the analysis.
4.2 Target Variable: Autonomous Driving Stability Metrics
This subsection describes the method for deriving ADSMs. Twenty-six driving volatility measures were selected as candidates for deriving autonomous driving behavior through a literature review. Then, several measures that effectively reflect the driving behavior of AVs were selected through PCA. PCA is a statistical multivariate methodology used to reduce a multidimensional dataset into a smaller dimension. This method simplifies the dataset with linear combinations of variables that are called principal components (PCs). The selected crucial measures were normalized and integrated to quantify the ADSMs for each intersection.
A variety of longitudinal and lateral driving volatility measures were used as candidates to derive the ADSM. Standard deviation, VF, EDI, and SRI were adopted as aggregation methods. Longitudinal driving volatility measures are based on speed, acceleration, and jerk. Additionally, lateral measures based on angular velocity, angular acceleration, and yaw rate were selected. In addition, peak-to-peak jerk and SRR were selected as candidate driving stability metrics, resulting in a total of 26 driving volatility measures for analysis. The driving volatility measures have differences in the computation methods and evaluation criteria used. VF is the deviation from the relative rate of change of a variable over time [15]. It differs from the standard deviation of the simple mean of the variables in that VF represents the relative volatility in the variables over time. The EDI and SRI are indicators that assess how often a variable exceeds a threshold over the total time step. The EDI is computed as the sum of the area where the variable exceeds the threshold, whereas the SRI indicates the proportion of data points in the total data where the variable exceeds the threshold [16]. These indicators differ from other measures that calculate driving volatility based on superficial differences in that the EDI and SRI evaluate the volatility of the data relative to a specific threshold. In this study, the threshold set to define hazardous situations was the average of the absolute values of the variables. The peak-to-peak jerk is the difference between the maximum jerk and the minimum jerk during each time step [34]. The peak-to-peak jerk was derived via the moving average method, which computes the average over a certain time interval in time series data. SRR is a traffic safety indicator that evaluates lateral driving safety by expressing the number of times the steering wheel angle reverses above a certain standard as a ratio with respect to the driving time. The values of each indicator for 597 intersections were computed at 10 Hz, the same frequency as the data collection period, and presented as the average of each indicator by segment. A list of the driving safety indicators utilized in this study is shown in Table 1.
The selection of measures that effectively represent change in the driving behavior of AVs from candidates is required to quantify autonomous driving behavior, and PCA was adopted in this process. PCA is a statistical analysis method that aims to reduce and simplify a large dataset into a simpler dimension through the linear combination of highly correlated variables [35]. The importance of each component is evaluated based on its explanatory power for the variability of the dataset. Explanatory power indicates the proportion of the total variance in the data that a component accounts for, where components with high explanatory power are referred to as PCs that effectively reflect the characteristics of the data. PCs were defined as those with eigenvalues greater than 1.0. The first PC that has the highest eigenvalue explains the maximum variance of the dataset. The results of PCA were presented through the component matrix, where specific volatility measures were assigned to components where the absolute value of the loading exceeded 0.6 [36]. Therefore, this study selected the volatility measures corresponding to this first PC as the crucial measures that best reflect the characteristics of the data. The selected measures on the first PC were integrated into ADSMs. Kaiser–Meyer–Olkin (KMO) and Bartlett sphericity tests were conducted to evaluate the suitability of the dataset for analysis prior to PCA. A dataset is considered suitable for analysis if the KMO value is greater than or equal to 0.5 and if the p value of Bartlett’s test for sphericity is less than or equal to 0.05 [37].
ADSMs were derived by integrating the selected measures through PCA. Because computed measures have various units, this study conducted min–max normalization on the selected measures to scale the data within the same range. Normalization enables the comparison of different indicators by scaling them within the same range and prevents certain variables from overrepresentation. Min–max normalization is expressed in Eq. (4).
where
This study investigated the road and traffic environments that affect the autonomous driving behavior at intersections through a classification model. A classification model was adopted to distinguish unstable driving events from stable ones. The differentiation of groups based on stability levels relied on an empirical examination of data distribution. Kernel density estimation (KDE) was applied to the 597 intersection scenarios to analyze their distributional characteristics. KDE is a non-parametric method that uses a kernel function to estimate the distribution of data from a limited sample. The general form of the kernel density function is shown in Eq. (6). Consequently, the target variable was nominalized into distinct groups corresponding to high and low driving stability.
where
Bandwidth is a factor that affects the performance of KDE, where estimation of the optimal bandwidth can improve the reliability of the results. Silverman’s rule of thumb was employed to set the bandwidth of the kernel function, which can be computed as follows in Eq. (8) [40].
where σ is the standard deviation of the samples, which is estimated under the assumption that the kernel function follows a normal Gaussian distribution [41]. Finally, the data were dichotomized based on the distributional properties estimated by the kernel function.
4.3 Input Variable: Factors Affecting Autonomous Driving Stability
This subsection explains the selection of factors affecting autonomous driving behavior and the evaluation of the level of influence of each factor. The factors affecting driving behavior were identified for each intersection based on the surrounding object data collected through sensors and driving footage.
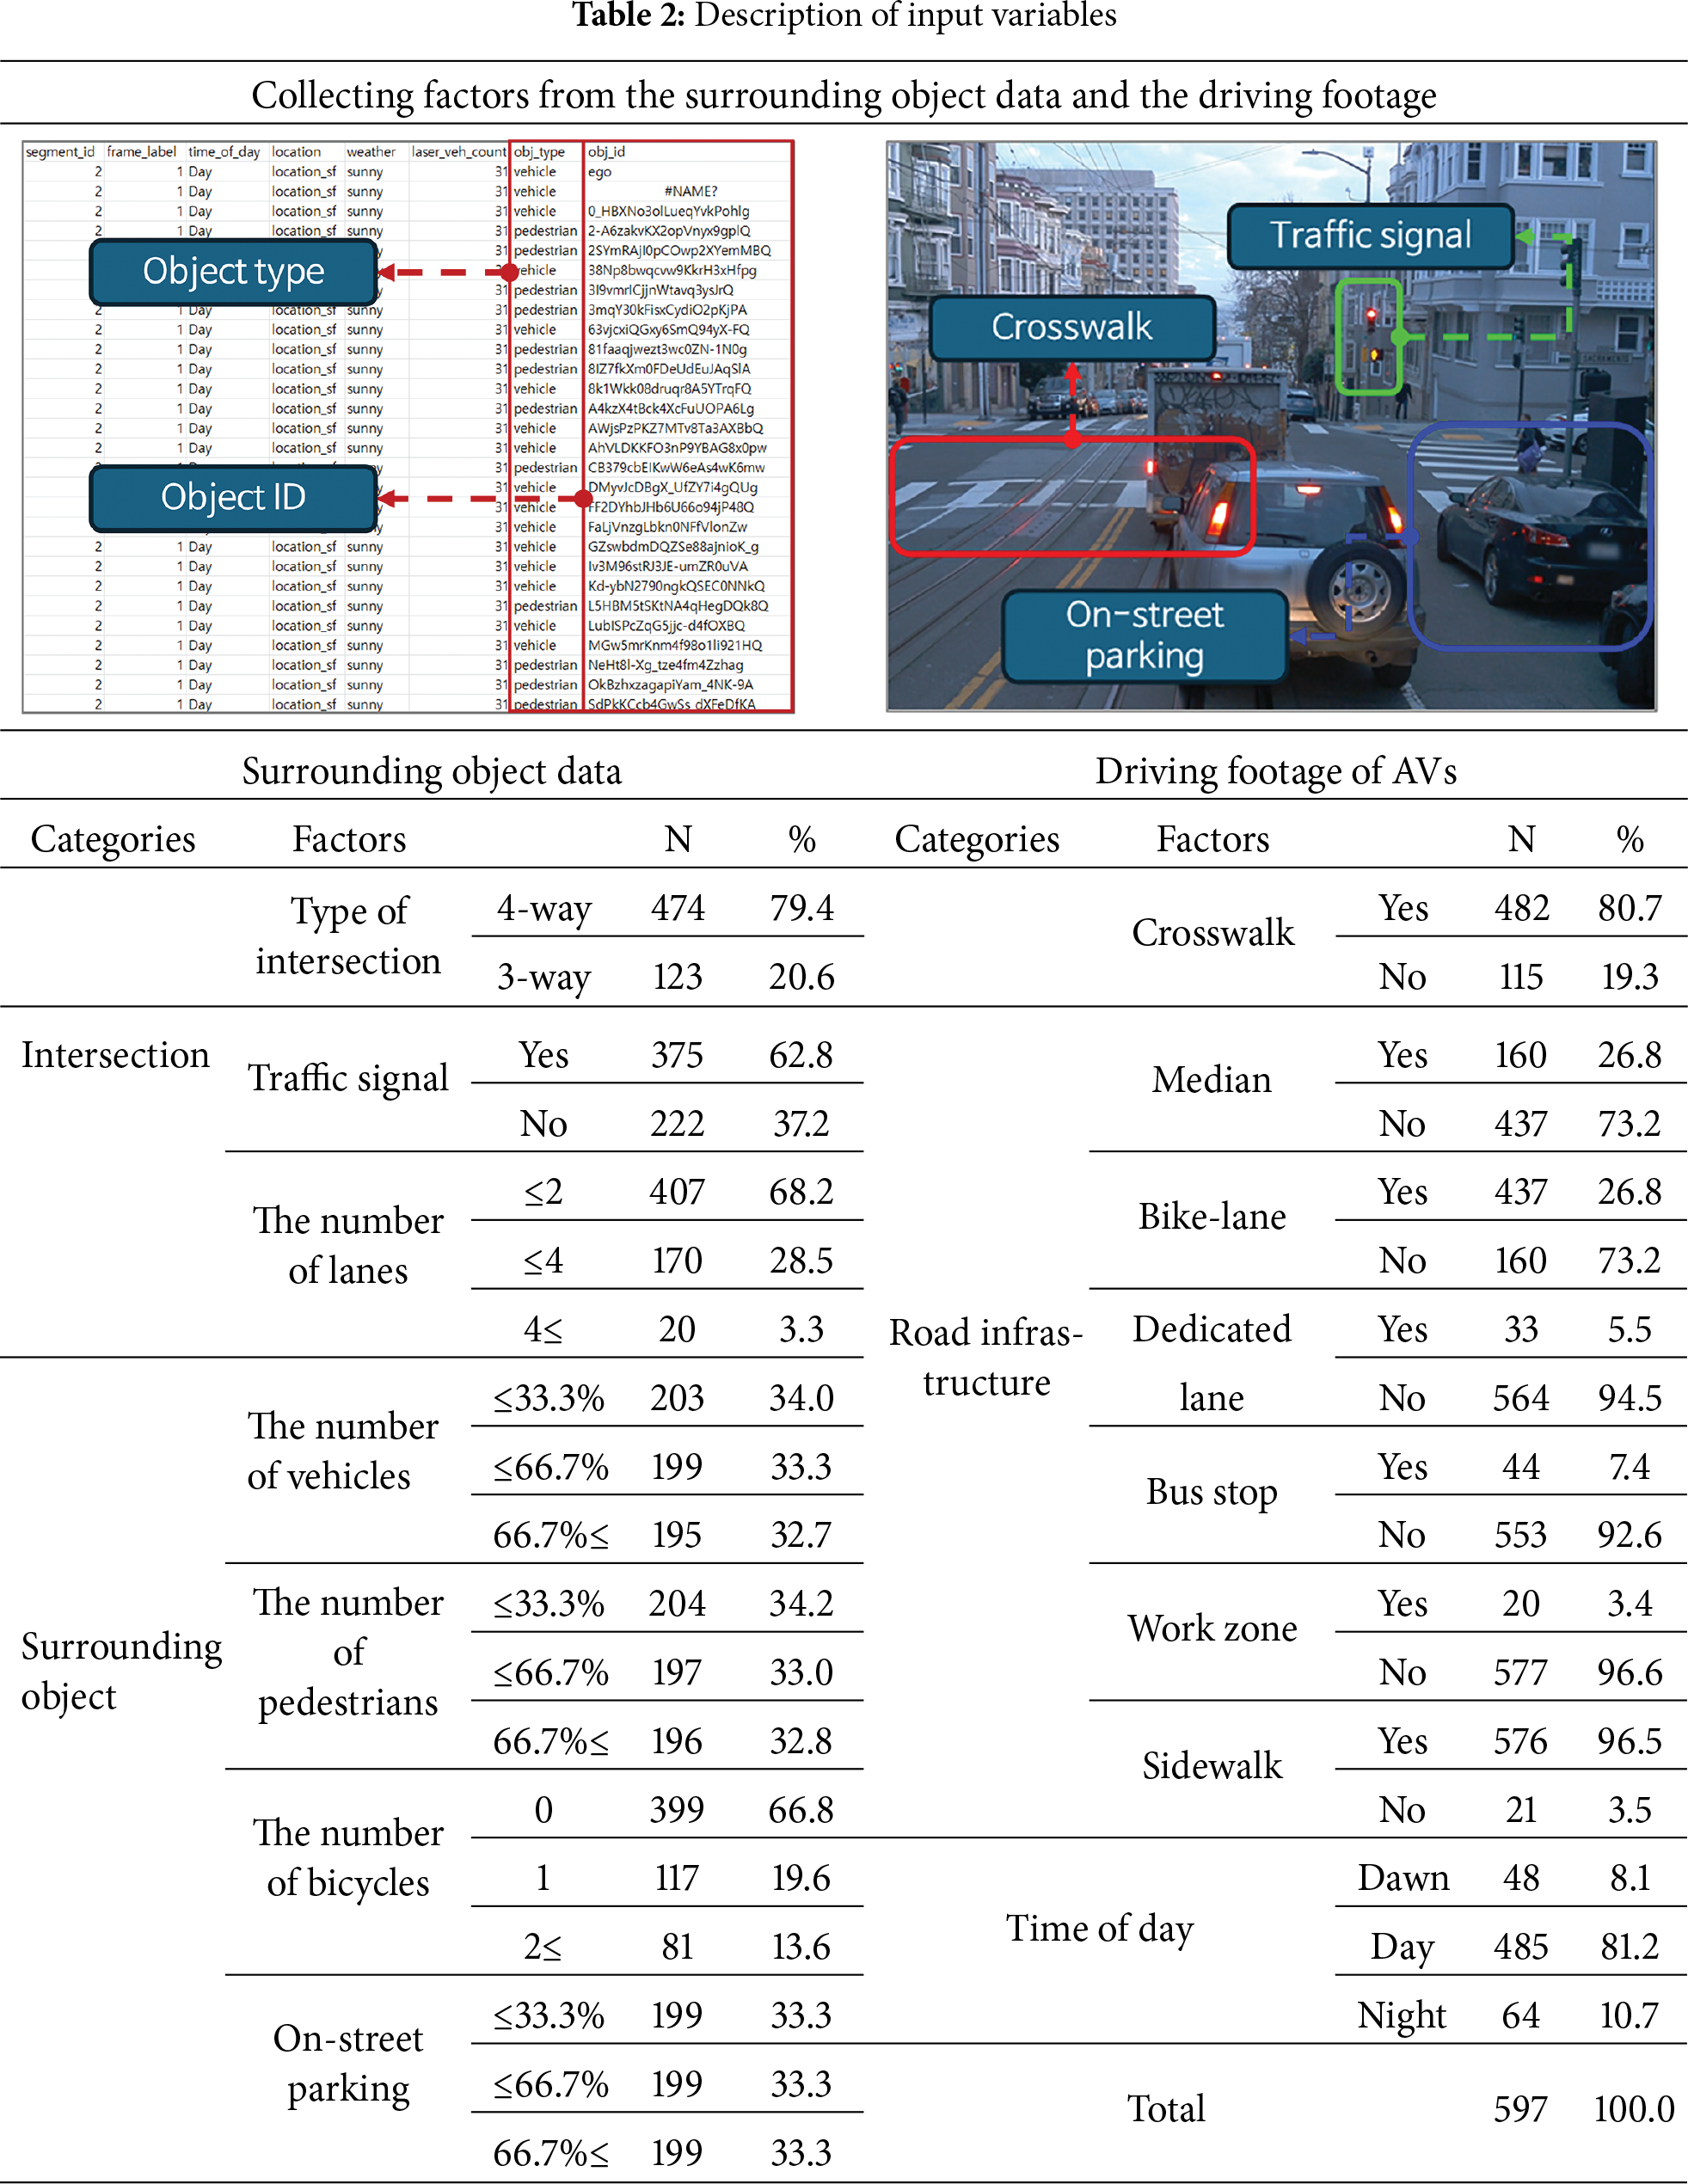
First, nine factors were identified through the surrounding object data from the dataset. Multiple studies that have analyzed factors affecting traffic safety have adopted the volume of vehicles and pedestrians as variables related to the number of accidents [21,42]. Ren et al. [43] suggested that on-street parking is a factor that affects both the frequency and severity of traffic accidents. This study collected factors that are related to road users and on-street parking based on the existing studies, which were collectable from the dataset. Three types of road users were collected by sensors: vehicles, pedestrians, and bicycles. The number of surrounding vehicles, pedestrians, and bicycles was counted through the number of road users that the sensor detected in each scenario. The number of on-street parking spaces was derived from the number of vehicles that were not moving during the scenario. The time of day while driving was also collected from the dataset, which is divided into day, night, and dawn.
Next, the driving footage of AVs from the Waymo open dataset was utilized to identify Road and environmental characteristics. Road and environmental characteristics that are likely to influence AVs' driving stability were examined based on existing studies. Sayed and Rodriguez [44] developed an accident prediction model for urban unsignalized intersections in Vancouver, Canada, and categorized the model according to intersection type (4-approach or 3-approach). Lu et al. [45] investigated the driving difficulty of AVs in various scenarios based on road design through expert interviews. They concluded that unsignalized intersections pose significant risks for AVs and that the presence of bicycle lanes increases driving difficulty, especially in detecting pedestrians and cyclists [45]. Furthermore, Gomes [42] suggested that road design factors, such as the number of lanes and the presence of medians, have been used as variables in accident prediction models in some studies. In addition to the road and traffic environments commonly adopted in existing studies, variables identifiable through driving footage were incorporated as factors influencing autonomous driving behavior.
A total of 15 factors affecting autonomous driving behavior were adopted as input variables, which were grouped into intersections, surrounding objects, and road infrastructure-related factors according to their characteristics. A description of the factors collected is presented in Table 2.
5.1 Analysis of Autonomous Driving Behavior at Intersections
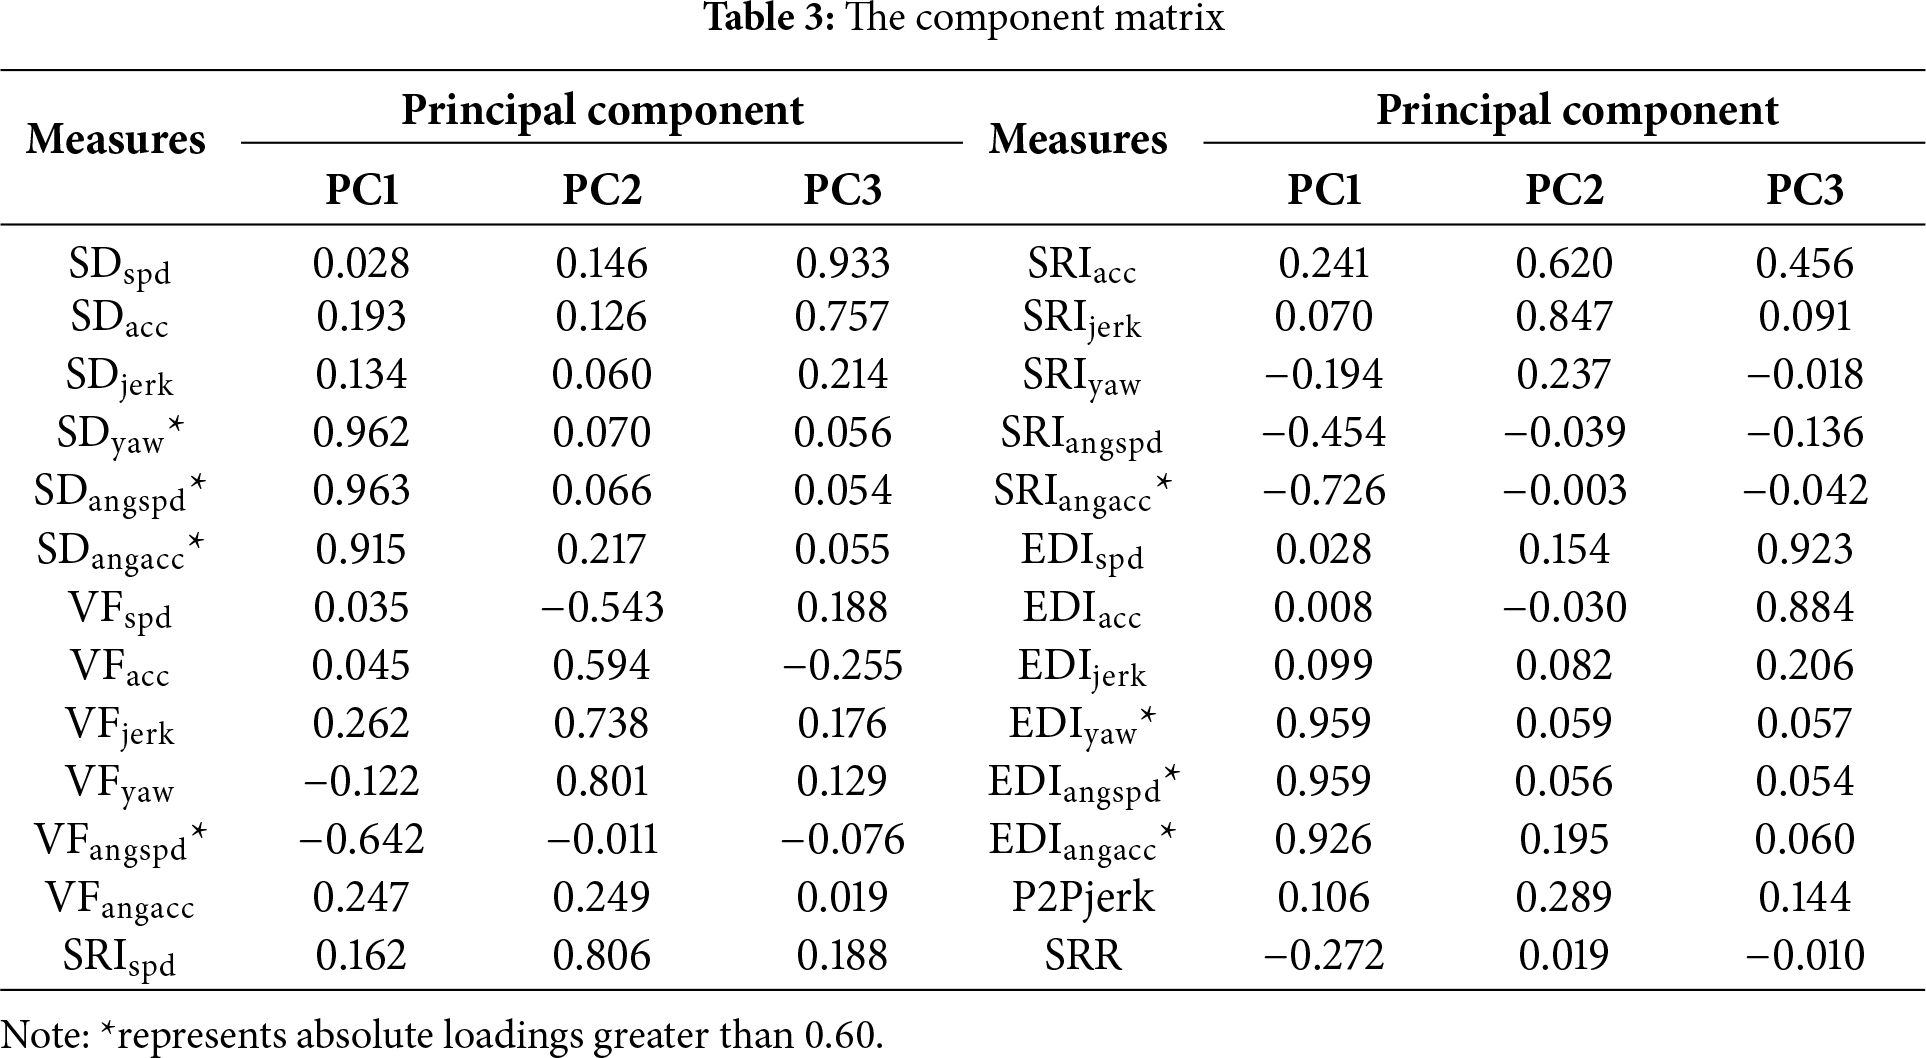
The results of PCA are presented in Table 3 in the form of a component matrix. The component matrix contains the factor loadings of each measure for the first three PCs. Driving volatility measures exhibiting factor loadings greater than 0.6 on PC1 were identified as the crucial measures. Consequently, eight of the 26 candidates
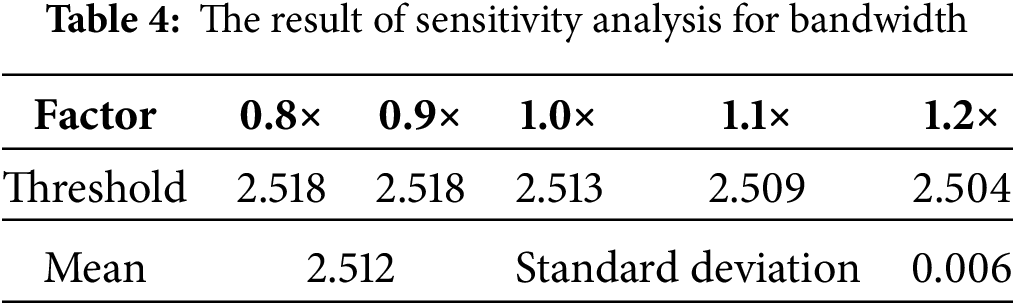
The distribution of the ADSMs for intersections followed a distinctively bimodal pattern as shown in Fig. 3. This meaningful observation based on empirical density estimation indicates that the driving behavior of AVs can be naturally categorized into two groups with different characteristics. Accordingly, this study dichotomized the samples into low ADSM and high ADSM groups based on the local minimum of the kernel density function. A sensitivity analysis was conducted, varying the bandwidth determined by Silverman’s rule of thumb with factors of 0.8, 0.9, 1.1, and 1.2 to ensure the reliability of the decision boundary distinguishing the groups. The result of the sensitivity analysis was presented in Table 4. The location of this cut-off value remained highly stable with a standard deviation of 0.006. The dataset was divided into 146 samples in the low ADSM group and 451 samples in the high ADSM group, which were used as the target variables for the random forest classification model.
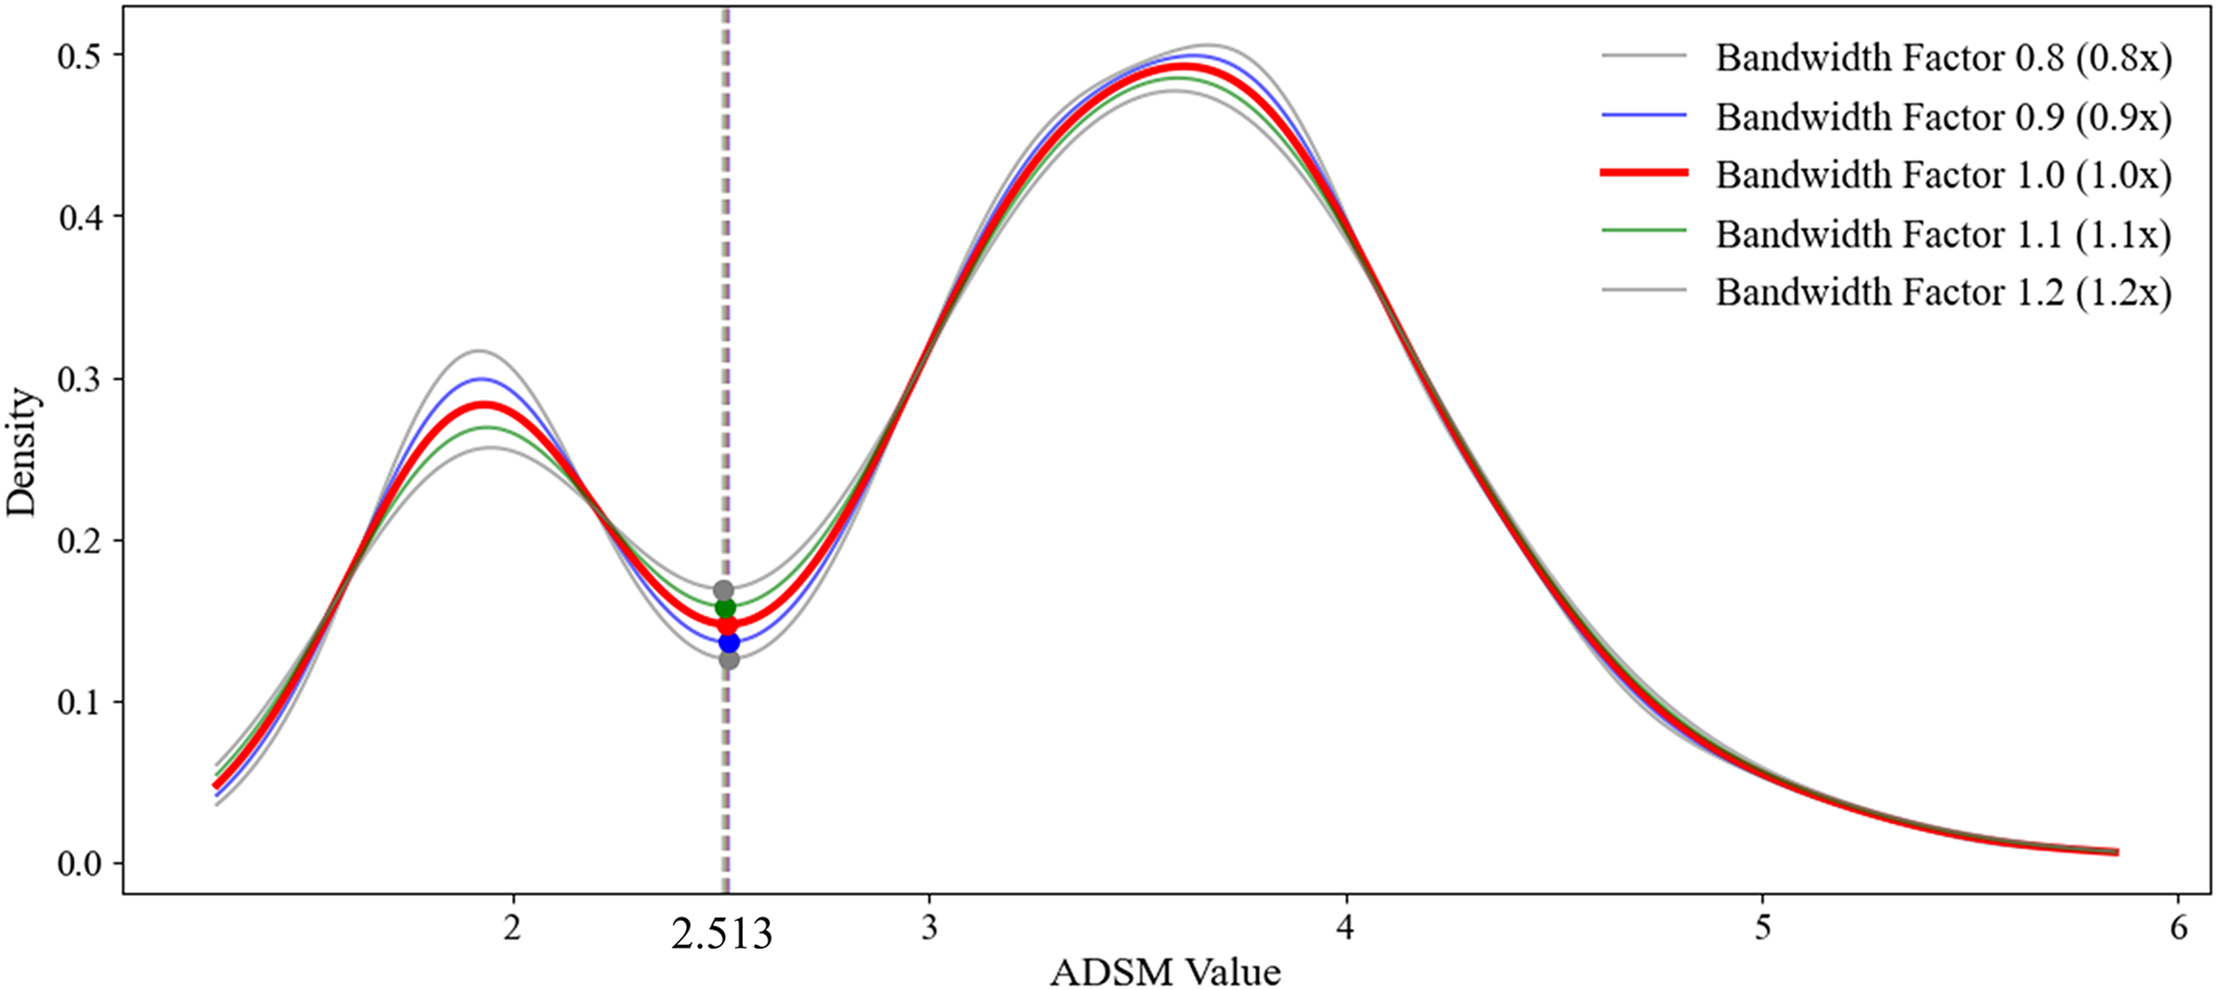
Figure 3: Estimated density of ADSMs
5.2 Random Forest Classification Model
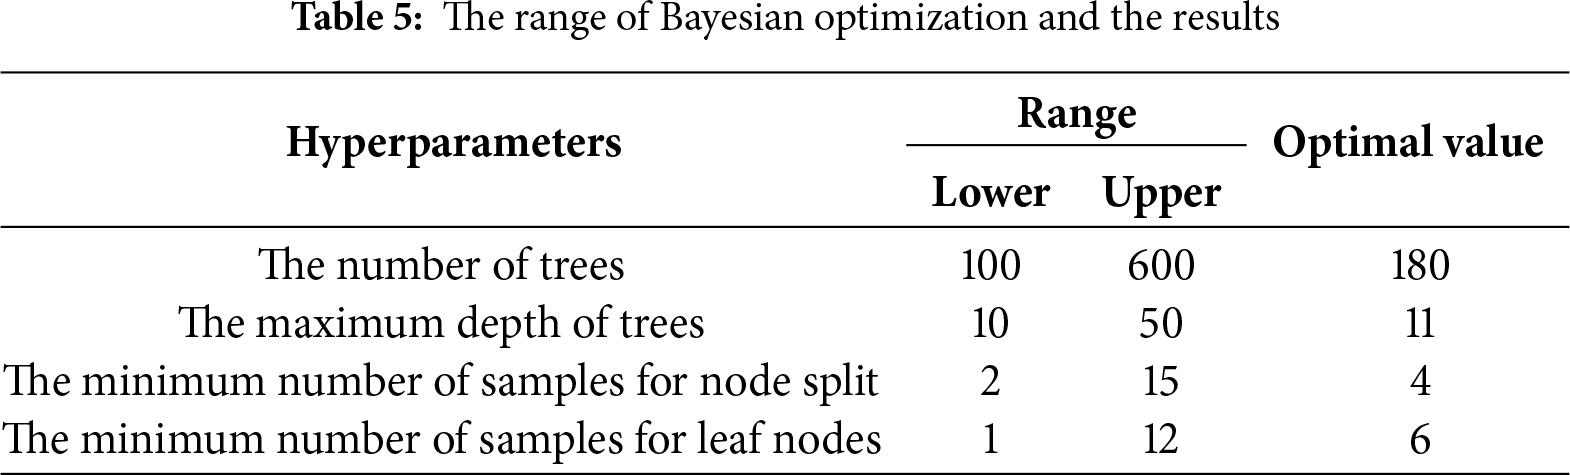
Bayesian optimization was adopted to improve the model’s performance by tuning the hyperparameters. The four hyperparameters tuned were the number of trees, the maximum depth of trees, the minimum number of samples for node splitting, and the minimum number of samples for leaf nodes. The exploration range for the optimization preset in this study and the optimal values are shown in Table 5.
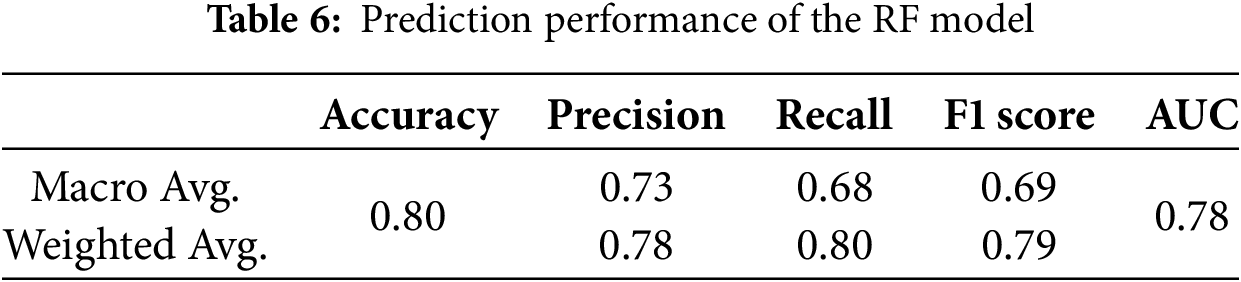
The random forest classification model selected above was trained and used for prediction. The samples were split into 70% training data and 30% test data. The prediction accuracy of the model on the test data was 80%. In addition, a 5-fold cross-validation process was adopted on the training data to ensure the reliability of the model’s performance. Table 6 presents the performance of the classification models used in the analysis. The macro average indicates simple accuracy, whereas the weighted average represents an average that considers the balance between classes based on the number of samples. The precision represents the percentage of samples that are positive among the samples predicted by the model as positive. Recall is the percentage of samples that the model predicted as positive among the positive samples. The F1 score indicates the harmonic mean of precision and recall. On the one hand, the receiver operating characteristic (ROC) curve is a commonly used measure of model performance. The ROC curve is the plot explaining the trade-off between sensitivity and specificity, computed by the area under the ROC curve (AUC). All the performance measures for the model indicate that a large value indicates better performance of the model.
The feature importance measured by the Gini index was used to evaluate the influence of factors on autonomous driving behavior. The relative importance of the features is shown in Table 7. Seven factors had an importance of 0.05 or higher based on the top 50%, which included the type of intersection, traffic signal, number of lanes, number of pedestrians, number of crosswalks, number of vehicles, and number of vehicles parked on the street. The intersection type (4-approach or 3-approach) had the most dominant impact on autonomous driving behavior, with an importance of 0.243. The presence of traffic signals was considered the factor with the second greatest importance (0.196) and was far from the third most important factor, the number of approach lanes (0.148). The variables with an importance of less than 0.01 include the presence of bus stops, dedicated lanes, work zones, and sidewalks.
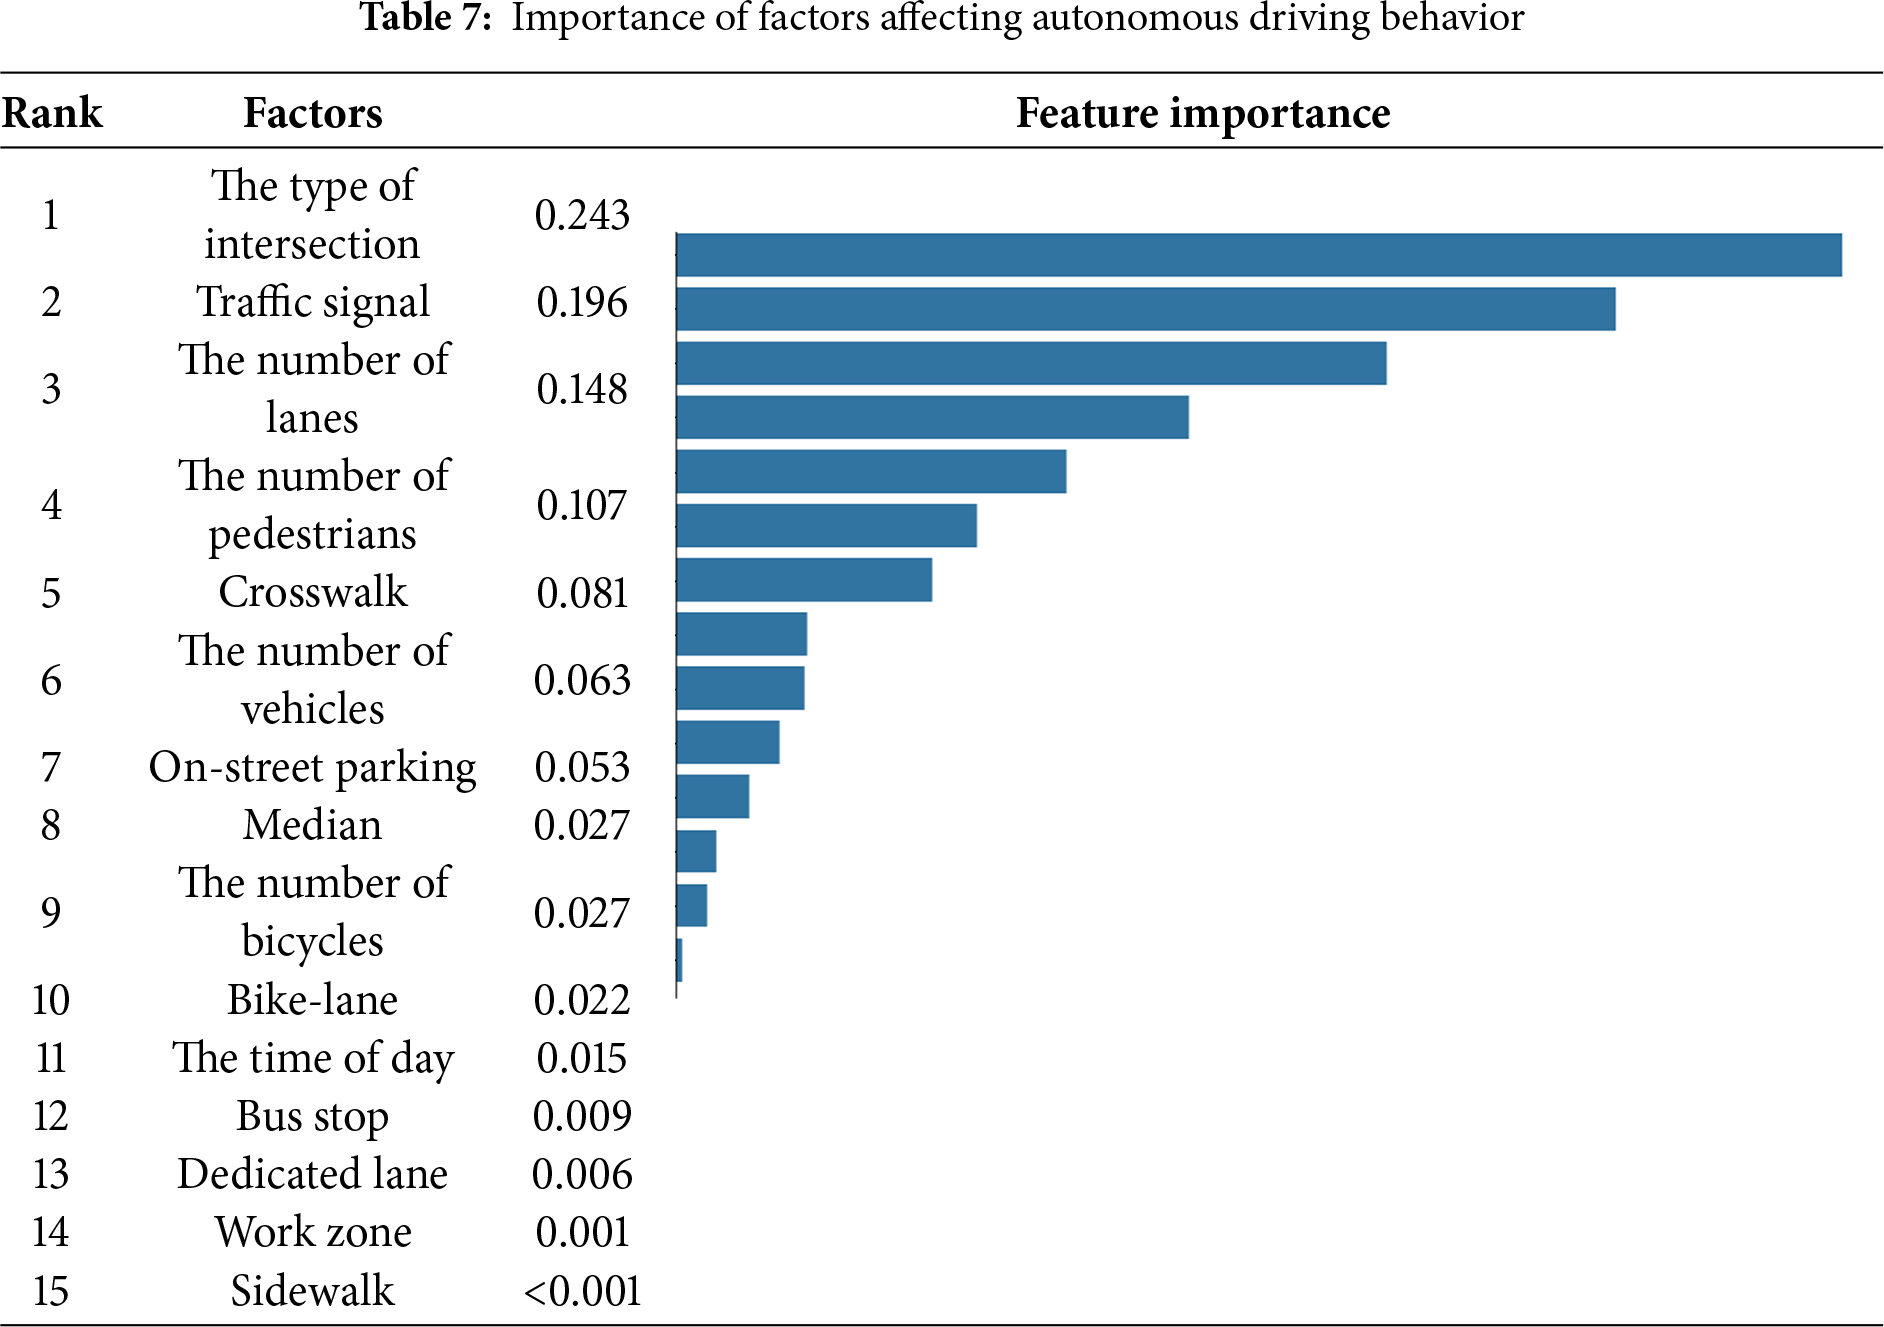
The factors can be categorized into three types according to their characteristics. The average rank of each type was then compared. The types of factors included intersection-related factors (the type of intersection, presence of a traffic signal, and number of lanes), surrounding object-related factors (the number of vehicles, pedestrians, bicycles, and on-street parking), and road infrastructure-related factors (the presence of crosswalks, medians, bike-lanes, bus stops, dedicated lanes, work zones, and sidewalks). The average ranking and importance of each type are presented in Table 8.
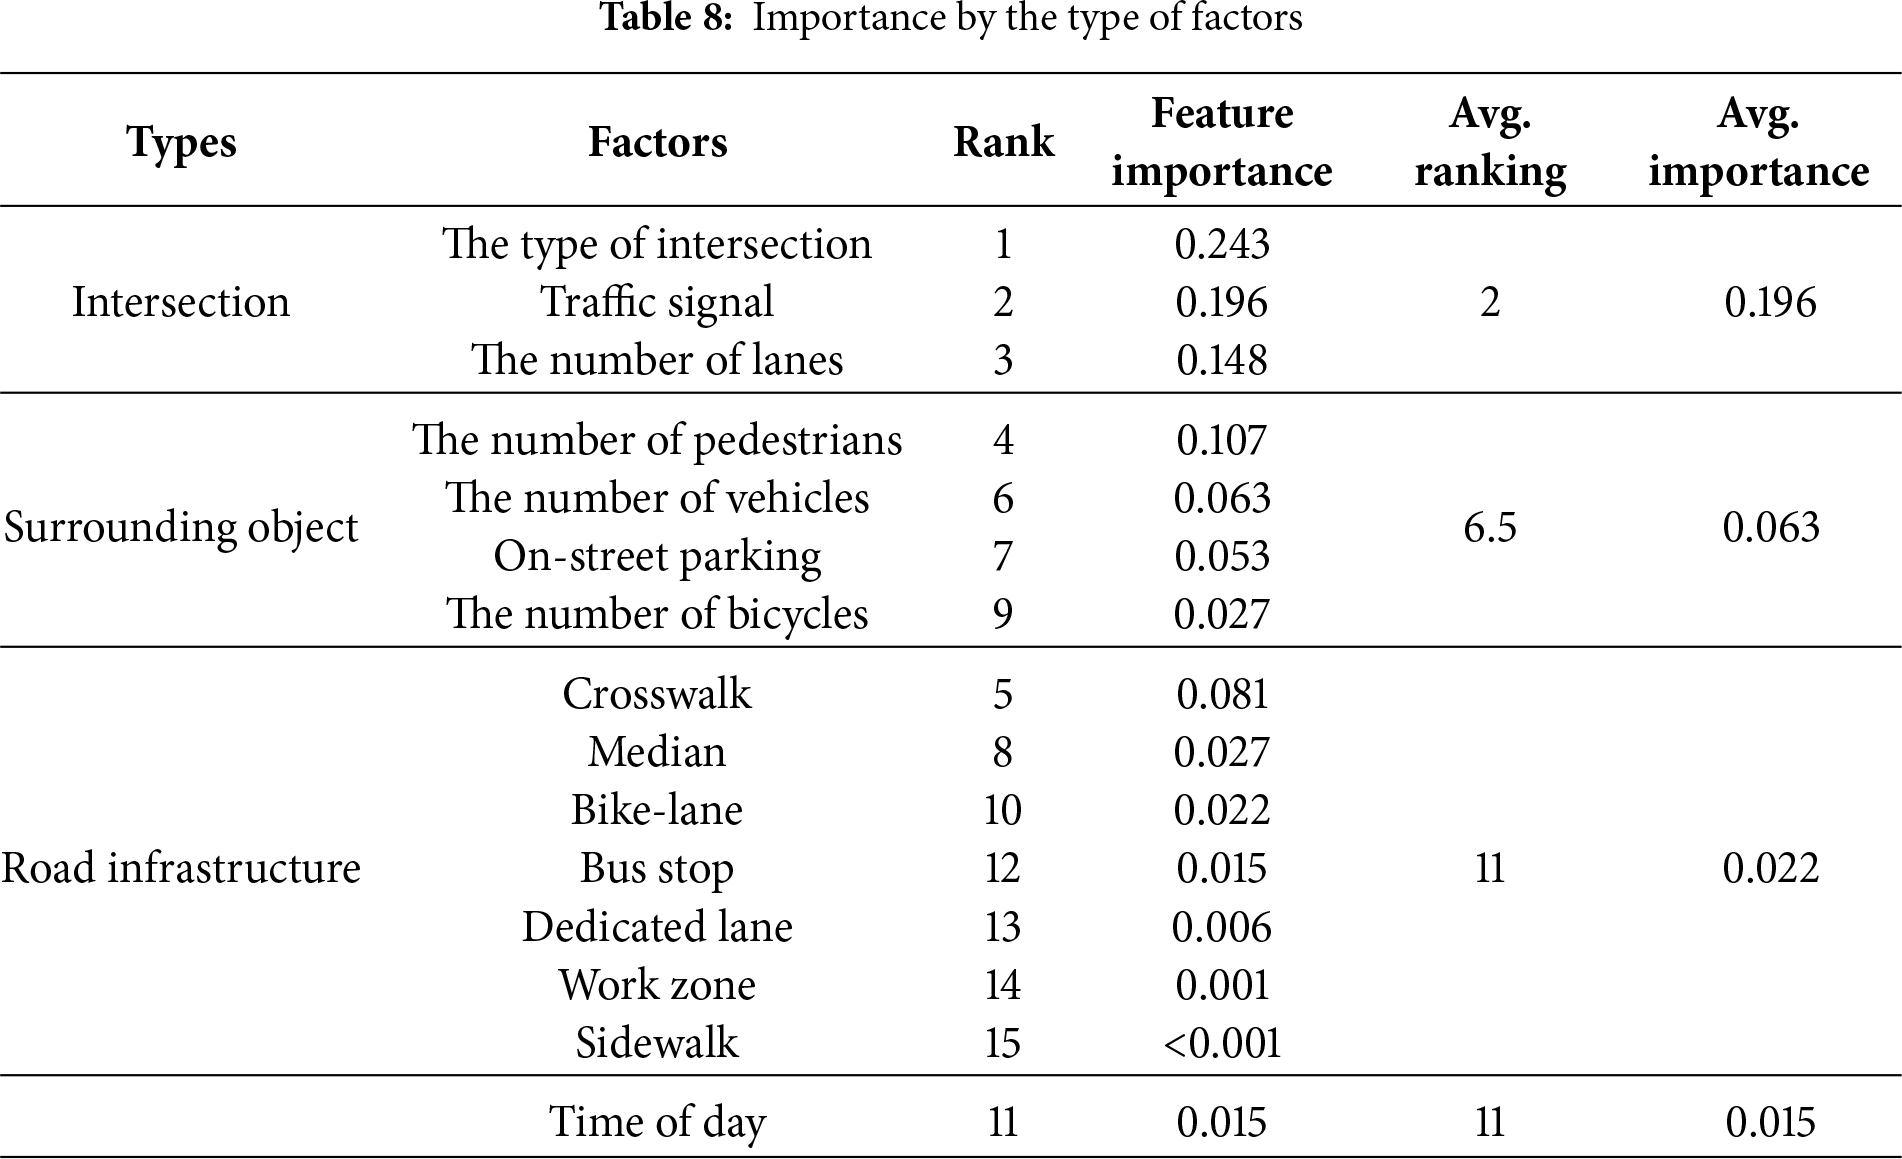
The intersection-related type had the greatest impact on autonomous driving behavior, with an average importance of 0.196 and an average ranking of 2. This importance is approximately a 31.3% margin over the average importance of the surrounding object-related type (0.063). The prominence of feature importance suggests that the intersection configuration and scale act as critical determinants for AV decision-making. Additionally, the right-of-way priorities based on intersection configuration and signalization play a significant role in ensuring autonomous driving stability. Designing appropriate intersections for autonomous driving plays a crucial role in maintaining stable autonomous driving, thereby contributing to road safety in mixed traffic conditions.
The surrounding object-related type had an average ranking of 6.5 and was the second most influential type after the intersection-related type. The number of pedestrians was the most important factor among the object-related types. Vulnerable road users, such as pedestrians and cyclists, exhibit a high degree of freedom and stochastic movement pattern unlike vehicles that follow structured lanes. The high feature importance suggests that the autonomous driving system prioritizes the detection of pedestrians to proactively decide the next maneuver. The presence of these road users introduces dynamic complexity to the driving stability, compelling the decision-making of AVs to assign high priority to object detection and prediction. Technological advancements in autonomous driving systems and sensors are needed to improve the accuracy of prediction and conduct evasive maneuvers against unexpected situations. Grembek et al. [46] suggested that intelligent intersections can improve traffic safety at intersections by providing traffic information and road users’ position information to AVs through I2V communication, in addition to enhancing the capability of AVs’ sensors. Improving the perception performance of AVs can facilitate safer and more stable interactions between autonomous vehicles and human-driven vehicles at complex intersections, which can lead to enhanced traffic safety in mixed traffic environments.
The road infrastructure-related type and the time-of-day factors were analyzed as having lower relative importance than the other two types, with average importance values of 0.022 and 0.015, respectively. The presence of crosswalks was a factor that had a relatively great impact on AVs in the road infrastructure-related type. Urban interrupted flow facilities, such as crosswalks, can be used as indicators to provide AVs with information about the paths of pedestrians, which impacts AVs’ driving stability. The feature importance of road infrastructure-related factors can be used to identify the factors that are likely to decrease the driving stability of AVs and to prioritize the management of facilities to improve the operational efficiency of AVs. Most road alignment schemes and infrastructure are currently designed for MVs [20]. The results of this study are applicable for evaluating priorities in improving traffic facilities as a basis for the operational management of road infrastructure for AVs. Infrastructure-based guidance information can support AV decision-making, especially in complex road segments such as intersections. The level of influence of each variable presented as a result of this study can serve as a guideline for deriving the types of information and the priorities for their provision.
The SHAP summary plot provides the visualization of the impact of each factor on the model’s outputs as shown in Fig. 4. The SHAP summary plot provides the visualization of the impact of each factor on the model’s outputs as shown in Fig. 4. The SHAP values for 4-way intersections were higher compared to those for 3-way intersections, reflecting the increased complexity of intersection design. 4-way intersections are predominantly designed as signalized, providing relatively clear right-of-way for AVs. Conversely, 3-way intersections more frequently lack traffic signals, which challenges the decision-making of AVs. This finding is consistent with the result that the absence of traffic signals has a negative impact on autonomous driving stability. Traffic signals serve as explicit visual cues enabling AVs to comprehend the traffic situation and decide their next action at intersections. However, AVs are forced to decide their next maneuver by perceiving the surrounding road and traffic environment without any assistance from traffic signals at unsignalized intersections. AVs are required to comprehend interactions with other road users in situations where traffic priorities are not visually presented by the signal, potentially leading to deadlocks [47]. A larger number of approach lanes showed an increase in autonomous driving stability. Intersections with a higher number of lanes generally separate turning lanes from through lanes. Consequently, vehicles are more likely to perform preemptive lane changes, potentially reducing weaving. Meanwhile, an increase in the number of pedestrians within the intersection was found to enhance autonomous driving stability. Increased pedestrian traffic generally has a negative impact on the decision-making of AVs. However, AVs tend to adopt conservative driving behaviors, thereby driving at lower speeds due to the high traffic density in intersections with high pedestrian volumes. Moreover, intersections with high pedestrian volumes are typically equipped with signalized crosswalks. These facilities guarantee the right-of-way for pedestrians, thereby reducing uncertainty and facilitating smoother maneuvering for AVs. Crosswalks were shown to have a positive effect on autonomous driving stability as these facilities provide visual information regarding pedestrian paths. On the other hand, bicycle lanes and bus stops were identified as factors that challenged autonomous driving. Bicycle lanes were installed adjacent to roads, which can increase the potential for conflict between AVs and cyclists. Bus stops induce evasive maneuvers, such as lane changes, due to interactions between AVs and other road users.
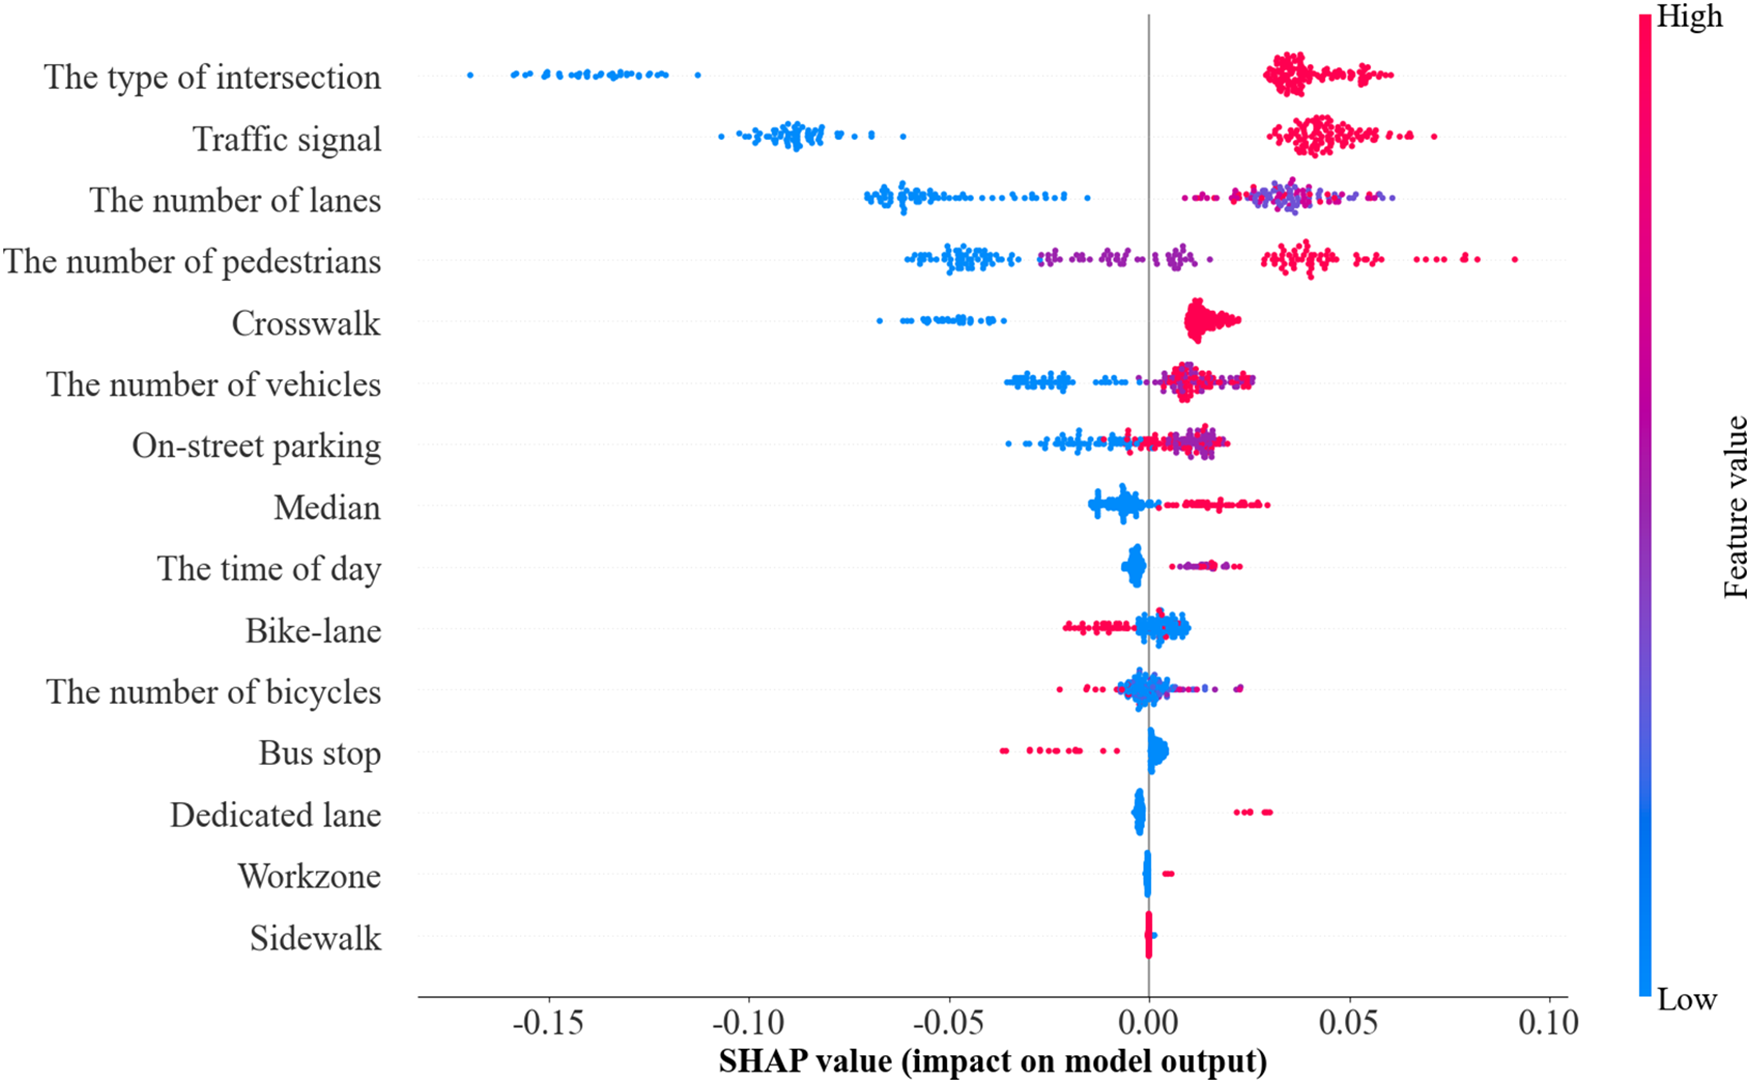
Figure 4: The SHAP summary plot
This study analyzed the contributing factors affecting the driving behavior of AVs at intersections. A random forest classification model was used to evaluate the behavioral changes of AVs at urban intersections and identify the influencing factors. The Waymo open dataset with driving footage was employed for analysis. The ADSMs at each intersection were derived from the AV trajectory data and used as the target variable. The proposed methodology could classify intersections into two classes: low-level and high-level autonomous driving stability. The input variables, factors affecting autonomous driving behavior, were identified through the driving footage of the AV and surrounding object data. The level of influence of each factor on autonomous driving behavior was evaluated by the feature importance that is a byproduct of the classification model.
The feature importance of 15 factors was measured to identify the level of influence of these factors on AVs. The type of intersection, including 4-approach and 3-approach intersections, was identified as the most dominant factor affecting autonomous driving behavior. Next, the presence of a traffic signal and the number of lanes had a significant effect on autonomous driving behavior. The three factors above correspond to intersection-related factors, which had the most significant impact on autonomous driving behavior. Intersection-related factors, such as the shape of the intersection and the presence of signal controls, determine the priority rules and the way of interaction with other road users. The surrounding object-related factors perceived by the AV through its sensors are also important factors for the driving stability of the AV, with high importance. The AV determines its next action based on the prediction of the future motion of nearby road users in real time. The increase in the number of surrounding objects, therefore, can lead to an increase in the driving difficulty of the AV. Compared with other road and traffic environmental factors, road infrastructure-related factors had relatively less of an impact on autonomous driving behavior. Regarding the infrastructure-related factors such as the presence of dedicated lanes, work zones, and bike lanes, they were found to be less important than other factors. This result might be due to the smaller sample size compared to other factors. Thus, more data collection is required to evaluate various factors in the future.
The results suggest that improving intersection design and the way of operating intersections would enhance the driving performance of AV in urban areas. Analyzing the driving behavior of AVs is expected to assist in designing intersections suited for autonomous driving, which could enhance traffic safety in mixed traffic conditions. Identifying road and traffic factors that challenge AV can be utilized to decide both the types of information to provide and their prioritization in infrastructure-based guidance. The autonomous driving stability and influencing factors analyzed in this study constitute a new type of road and traffic information for AVs. The results of this study will assist in suggesting an optimal route for autonomous driving.
This study has limitations that should be addressed in further research. The integrated metric in this study was established based on volatility measures that have been validated in prior literature as indicators for instability. Future research will further enhance credibility through sensitivity analyses and direct validation against safety metrics. Each scenario for Waymo Open Dataset spans 20 s of data, which may not capture the temporal continuity of AV passing intersections. Driving events occurring before and after the 20 s of data may have influenced the driving behavior in the dataset. Future research is required to overcome the limitations through incorporating continuous trajectories from different scenarios or utilizing additional autonomous driving datasets. In addition, the driving footage recorded from the front-facing camera was used in the analysis. Some objects might not have been observed in the footage. Further research requires to collect road and traffic information from various angles by sensors and cameras. Finally, this study collected data on 15 road and traffic characteristics. There could be other factors affecting autonomous driving behavior, which were not considered in this study. In the future, computer vision technology, including object detection, can be employed to extract more information from images. Stratifying data based on the more detailed attributes would enhance the model’s practical applicability. Lastly, this study relied solely on the Random Forest technique. Future research can conduct comparative analysis across various models, such as XGBoost and LightGBM, to mitigate potential bias inherent in a single model.
Acknowledgement: The authors would like to thank the Waymo team for making the data publicly available.
Funding Statement: This work was supported by Korea Institute of Police Technology (KIPoT) grant funded by the Korea government (KNPA) (Project Name: Development of Lv.4 Driving Ability Evaluation Technology for Autonomous Vehicles Based on Real Roads/Project Number: RS-2023-00238253).
Author Contributions: The authors confirm contribution to the paper as follows: Conceptualization, Hoyoon Lee and Cheol Oh; methodology, Hoyoon Lee, Hoseon Kim and Cheol Oh; data curation, Hoyoon Lee and Jeonghoon Jee; analysis, Hoyoon Lee; writing—original draft preparation, Hoyoon Lee; writing—review and editing, Cheol Oh. All authors reviewed the results and approved the final version of the manuscript.
Availability of Data and Materials: The data that supports the findings of this study are available from the corresponding author upon reasonable request.
Ethics Approval: Not Applicable.
Conflicts of Interest: The authors declare no conflicts of interest to report regarding the present study.
References
1. Jo Y, Jung A, Oh C, Park J. Characterizing the driving behavior of manual vehicles following autonomous vehicles and its impact on mixed traffic performance. Transp Res Part F Traffic Psychol Behav. 2024;107:69–83. doi:10.1016/j.trf.2024.08.028. [Google Scholar] [CrossRef]
2. Mahdinia I, Mohammadnazar A, Arvin R, Khattak AJ. Integration of automated vehicles in mixed traffic: evaluating changes in performance of following human-driven vehicles. Accid Anal Prev. 2021;152:106006. doi:10.1016/j.aap.2021.106006. [Google Scholar] [PubMed] [CrossRef]
3. Al Mansoori S, Al-Emran M, Shaalan K. Factors affecting autonomous vehicles adoption: a systematic review, proposed framework, and future roadmap. Int J Hum. 2024;40(24):8397–418. doi:10.1080/10447318.2023.2286089. [Google Scholar] [CrossRef]
4. California Department of Motor Vehicles (CA DMV). Autonomous vehicles collision reports; 2024. [cited 2025 Nov 15]. Available from: https://www.dmv.ca.gov/portal/vehicle-industry-services/autonomous-vehicles/autonomous-vehicle-collision-reports/. [Google Scholar]
5. Wei L, Li Z, Gong J, Gong C, Li J. Autonomous driving strategies at intersections: scenarios, state-of-the-art, and future outlooks. In: Proceedings of the 2021 IEEE International Intelligent Transportation Systems Conference (ITSC); 2021 Sep 19–22; Indianapolis, IN, USA. p. 44–51. doi:10.1109/itsc48978.2021.9564518. [Google Scholar] [CrossRef]
6. Lin DJ, Yang JR, Liu HH, Chiang HS, Wang LY. Analysis of environmental factors on intersection accidents. Sustainability. 2022;14(3):1764. doi:10.3390/su14031764. [Google Scholar] [CrossRef]
7. Yang J, Park J, Rim H, Kim K, Song TJ. Identifying factors affecting the severity of rear-end crashes at signalized intersection approaches using machine learning technologies. J Korean Soc Transp. 2024;42(2):212–30. doi:10.7470/jkst.2024.42.2.212. [Google Scholar] [CrossRef]
8. Song Y, Chitturi MV, Noyce DA. Automated vehicle crash sequences: patterns and potential uses in safety testing. Accid Anal Prev. 2021;153:106017. doi:10.1016/j.aap.2021.106017. [Google Scholar] [PubMed] [CrossRef]
9. Hu X, Zheng Z, Chen D, Sun J. Autonomous vehicle’s impact on traffic: empirical evidence from waymo open dataset and implications from modelling. IEEE Trans Intell Transp Syst. 2023;24(6):6711–24. doi:10.1109/TITS.2023.3258145. [Google Scholar] [CrossRef]
10. Wang Y, Farah H, Yu R, Qiu S, van Arem B. Characterizing behavioral differences of autonomous vehicles and human-driven vehicles at signalized intersections based on waymo open dataset. Transp Res Rec. 2023;2677(11):324–37. doi:10.1177/03611981231165783. [Google Scholar] [CrossRef]
11. Jang H, Kim I, Park SH, Jang K. Analyzing the impact of autonomous vehicles on urban traffic flow at the large scale network using real-world data. In: Proceedings of the 2023 IEEE 26th International Conference on Intelligent Transportation Systems (ITSC); 2023 Sep 24–28; Bilbao, Spain. p. 5530–5. doi:10.1109/ITSC57777.2023.10421991. [Google Scholar] [CrossRef]
12. Wen X, Cui Z, Jian S. Characterizing car-following behaviors of human drivers when following automated vehicles using the real-world dataset. Accid Anal Prev. 2022;172:106689. doi:10.1016/j.aap.2022.106689. [Google Scholar] [PubMed] [CrossRef]
13. Bagdadi O, Várhelyi A. Development of a method for detecting jerks in safety critical events. Accid Anal Prev. 2013;50:83–91. doi:10.1016/j.aap.2012.03.032. [Google Scholar] [PubMed] [CrossRef]
14. Zheng H, Qin Y, Guo F, Xiong J, Xu B, Chen Y. Speed and reaction behavior in different highway landscapes: a driving simulator study. Traffic Inj Prev. 2018;19(8):880–4. doi:10.1080/15389588.2018.1511897. [Google Scholar] [PubMed] [CrossRef]
15. Jee J, Gu Y, Jo Y, Oh C. Identification of crash-prone road segments based on an ensemble machine learning strategy: use of driving behavior data. J Korean Soc Transp. 2023;41(6):739–52. doi:10.7470/jkst.2023.41.6.739. [Google Scholar] [CrossRef]
16. Kim Y, Kang K, Park J, Oh C. A methodology for prioritizing safety indicators using individual vehicle trajectory data. J Transp Saf Secur. 2024;16(1):18–42. doi:10.1080/19439962.2023.2178567. [Google Scholar] [CrossRef]
17. Kim Y, Lee S, Choi S, Oh C. Development of a workload assessment index based on analyzing driving patterns. J Korean Soc Transp. 2017;35(6):545–56. doi:10.7470/jkst.2017.35.6.545. [Google Scholar] [CrossRef]
18. Mohammadnazar A, Patwary AL, Moradloo N, Arvin R, Khattak AJ. Incorporating driving volatility measures in safety performance functions: improving safety at signalized intersections. Accid Anal Prev. 2022;178(1):106872. doi:10.1016/j.aap.2022.106872. [Google Scholar] [PubMed] [CrossRef]
19. Wali B, Khattak AJ, Karnowski T. Exploring microscopic driving volatility in naturalistic driving environment prior to involvement in safety critical events-concept of event-based driving volatility. Accid Anal Prev. 2019;132(1):105277. doi:10.1016/j.aap.2019.105277. [Google Scholar] [PubMed] [CrossRef]
20. Tengilimoglu O, Carsten O, Wadud Z. Implications of automated vehicles for physical road environment: a comprehensive review. Transp Res Part E Logist Transp Rev. 2023;169:102989. doi:10.1016/j.tre.2022.102989. [Google Scholar] [CrossRef]
21. Liu Q, Wang X, Liu S, Yu C, Glaser Y. Analysis of pre-crash scenarios and contributing factors for autonomous vehicle crashes at intersections. Accid Anal Prev. 2024;195:107383. doi:10.1016/j.aap.2023.107383. [Google Scholar] [PubMed] [CrossRef]
22. Jee J, Kang KP, Lee H, Oh C. Evaluation of autonomous driving conservativeness by urban intersections with real-world data. J Korea Inst Intell Transp Syst. 2024;23(5):293–307. doi:10.12815/kits.2024.23.5.293. [Google Scholar] [CrossRef]
23. Lee H, Jee J, Oh C, Kim H. Derivation of driving stability indicators for autonomous vehicles based on analyzing waymo open dataset. J Korea Inst Intell Transp Syst. 2024;23(4):94–109. doi:10.12815/kits.2024.23.4.94. [Google Scholar] [CrossRef]
24. Yang J, Han S, Chen Y. Prediction of traffic accident severity based on random forest. J Adv Transp. 2023;2023:7641472. doi:10.1155/2023/7641472. [Google Scholar] [CrossRef]
25. Harb R, Yan X, Radwan E, Su X. Exploring precrash maneuvers using classification trees and random forests. Accid Anal Prev. 2009;41(1):98–107. doi:10.1016/j.aap.2008.09.009. [Google Scholar] [PubMed] [CrossRef]
26. Alvarez-Coello D, Klotz B, Wilms D, Fejji S, Gómez JM, Troncy R. Modeling dangerous driving events based on in-vehicle data using random forest and recurrent neural network. In: Proceedings of the 2019 IEEE Intelligent Vehicles Symposium (IV); 2019 Jun 9–12; Paris, France. p. 165–70. doi:10.1109/IVS.2019.8814069. [Google Scholar] [CrossRef]
27. Monselise M, Liang OS, Yang CC. Identifying important risk factors associated with vehicle injuries using driving behavior data and predictive analytics. In: Proceedings of the 2019 IEEE International Conference on Healthcare Informatics (ICHI); 2019 Jun 10–13; Xi’an, China. p. 1–10. doi:10.1109/ICHI.2019.8904860. [Google Scholar] [CrossRef]
28. Gu Y, Liu D, Arvin R, Khattak AJ, Han LD. Predicting intersection crash frequency using connected vehicle data: a framework for geographical random forest. Accid Anal Prev. 2023;179(1):106880. doi:10.1016/j.aap.2022.106880. [Google Scholar] [PubMed] [CrossRef]
29. López G, Abellán J, Montella A, de Oña J. Patterns of single-vehicle crashes on two-lane rural highways in Granada Province, Spain: in-depth analysis through decision rules. Transp Res Rec J Transp Res Board. 2014;2432(1):133–41. doi:10.3141/2432-16. [Google Scholar] [CrossRef]
30. Wu J, Chen X, Zhang H, Xiong LD, Lei H, Deng S. Hyperparameter optimization for machine learning models based on Bayesian optimization. J Electron Sci Technol. 2019;17:26–40. doi:10.11989/JEST.1674-862X.80904120. [Google Scholar] [CrossRef]
31. Lundberg SM, Lee SI. A unified approach to interpreting model predictions. In: Proceedings of the 31st International Conference on Neural Information Processing Systems; 2017 Dec 4–9; Long Beach, CA, USA. [Google Scholar]
32. Shapley LS. 17. A value for n-person games. In: Contributions to the theory of games (AM-28). Vol. II. Princeton, NJ, USA: Princeton University Press; 1953. p. 307–18. doi:10.1515/9781400881970-018. [Google Scholar] [CrossRef]
33. Hu X, Zheng Z, Chen D, Zhang X, Sun J. Processing, assessing, and enhancing the Waymo autonomous vehicle open dataset for driving behavior research. Transp Res Part C Emerg Technol. 2022;134:103490. doi:10.1016/j.trc.2021.103490. [Google Scholar] [CrossRef]
34. Jang J, Ko J, Park J, Oh C, Kim S. Identification of safety benefits by inter-vehicle crash risk analysis using connected vehicle systems data on Korean freeways. Accid Anal Prev. 2020;144:105675. doi:10.1016/j.aap.2020.105675. [Google Scholar] [PubMed] [CrossRef]
35. Yarlagadda J, Jain P, Pawar DS. Assessing safety critical driving patterns of heavy passenger vehicle drivers using instrumented vehicle data—an unsupervised approach. Accid Anal Prev. 2021;163:106464. doi:10.1016/j.aap.2021.106464. [Google Scholar] [PubMed] [CrossRef]
36. Waqar A, Alshehri AH, Alanazi F, Alotaibi S, Almujibah HR. Evaluation of challenges to the adoption of intelligent transportation system for urban smart mobility. Res Transp Bus Manag. 2023;51:101060. doi:10.1016/j.rtbm.2023.101060. [Google Scholar] [CrossRef]
37. Hair JF, Black WC, Babin BJ, Anderson RE, Tatham RL. Multivariate data analysis. Vol. 6. Upper Saddle River, NJ, USA: Pearson Prentice Hall; 2006. p. 139–52. [Google Scholar]
38. Hashimoto S, Yoshiki S, Saeki R, Mimura Y, Ando R, Nanba S. Development and application of traffic accident density estimation models using kernel density estimation. J Traffic Transp Eng Engl Ed. 2016;3(3):262–70. doi:10.1016/j.jtte.2016.01.005. [Google Scholar] [CrossRef]
39. Loo BPY, Yao S, Wu J. Spatial point analysis of road crashes in Shanghai: a GIS-based network kernel density method. In: Proceedings of the 2011 19th International Conference on Geoinformatics; 2011 Jun 24–26; Shanghai, China. doi:10.1109/GeoInformatics.2011.5980938. [Google Scholar] [CrossRef]
40. Silverman BW. Density estimation for statistics and data analysis. In: Monographs on statistics and applied probability. London, UK: Chapman and Hall; 1986. [Google Scholar]
41. Abdulhafedh A. Identifying vehicular crash high risk locations along highways via spatial autocorrelation indices and kernel density estimation. World J Eng Technol. 2017;5(2):198–215. doi:10.4236/wjet.2017.52016. [Google Scholar] [CrossRef]
42. Vieira Gomes S. The influence of the infrastructure characteristics in urban road accidents occurrence. Accid Anal Prev. 2013;60:289–97. doi:10.1016/j.aap.2013.02.042. [Google Scholar] [PubMed] [CrossRef]
43. Ren W, Yu B, Chen Y, Gao K, Bao S. Divergent effects of factors on crashes under autonomous and conventional driving modes using a hierarchical Bayesian approach. arXiv:2108.02422. 2021. [Google Scholar]
44. Sayed T, Rodriguez F. Accident prediction models for urban unsignalized intersections in British Columbia. Transp Res Rec J Transp Res Board. 1999;1665(1):93–9. doi:10.3141/1665-13. [Google Scholar] [CrossRef]
45. Lu X, Madadi B, Farah H, Snelder M, Annema JA, van Arem B. Scenario-based infrastructure requirements for automated driving. In: Proceedings of the 19th COTA International Conference of Transportation Professionals; 2019 Jul 6–8; Nanjing, China. p. 5684–95. doi:10.1061/9780784482292.489. [Google Scholar] [CrossRef]
46. Grembek O, Kurzhanskiy A, Medury A, Varaiya P, Yu M. Making intersections safer with I2V communication. Transp Res Part C Emerg Technol. 2019;102:396–410. doi:10.1016/j.trc.2019.02.017. [Google Scholar] [CrossRef]
47. Li N, Kolmanovsky I, Girard A, Yildiz Y. Game theoretic modeling of vehicle interactions at unsignalized intersections and application to autonomous vehicle control. In: Proceedings of the 2018 Annual American Control Conference (ACC); 2018 Jun 27–29; Milwaukee, WI, USA. p. 3215–20. [Google Scholar]
Cite This Article
 Copyright © 2026 The Author(s). Published by Tech Science Press.
This work is licensed under a Creative Commons Attribution 4.0 International License , which permits unrestricted use, distribution, and reproduction in any medium, provided the original work is properly cited.
 Downloads
 Citation Tools