
 Submit a Paper
 Propose a Special lssue
 Open Access
ARTICLE

Time-Domain Feature Data Generation and Analysis Based on Grouping-Aggregation for Industrial System
1 College of Intelligent Systems Science and Engineering, Harbin Engineering University, No. 145, Nantong Street, Nangang District, Harbin, China
2 Department of Intelligent Operation and Maintenance, Harbin Research Institute of Large Electric Machinery Company Limited, No. 51, Sandadongli Road, Xiangfang District, Harbin, China
3 School of Artificial Intelligence, Guangzhou University, 230 Wai Huan Xi Road, Guangzhou Higher Education Mega Center, Guangzhou, China
* Corresponding Authors: Xuliang Yao. Email: ; Zhili Zhou. Email:
(This article belongs to the Special Issue: Industrial Big Data and Artificial Intelligence-Driven Intelligent Perception, Maintenance, and Decision Optimization in Industrial Systems-2nd Edition)
Computers, Materials & Continua 2026, 87(3), 96 https://doi.org/10.32604/cmc.2026.076846
Received 27 November 2025; Accepted 11 March 2026; Issue published 09 April 2026
 View Full Text
 Download PDF
Abstract
In a real-world industrial system, it is challenging to reduce interference from operating conditions and extract high-quality feature data. To address these issues, this paper proposes a time-domain feature generation and analysis (FGA) scheme, which designs a grouping-aggregation (GA) scheme and an index decomposition (ID) method to extract and analyze high-quality feature data for industrial systems. The FGA represents a designed GA-based hybrid algorithm collaborative architecture, which overcomes the limitations of single algorithms and enables joint feature extraction from multi-condition, multi-scale industrial data. Simultaneously, FGA incorporates a feedback-driven threshold self-calibration mechanism, integrating LSTM-VAE to dynamically adjust detection thresholds based on reconstruction error distributions, significantly enhancing the system’s robustness against data distribution drift based on the FGA scheme. The software model distributes complex computations across scheduled program execution cycles to achieve optimal utilization of system resources. Specifically, the ID decouples complex operating conditions and employs stationarity analysis for valid feature data generation, whereas the GA effectively supplies a substantial set of data samples for data prediction. This approach is suitable for complex nonlinear systems characterized by limited data samples. The experiments conducted on the industrial feature data of a hydropower plant in Hubei, China, demonstrate that the proposed FGA scheme could reduce the data acquisition costs and effectively enhance the industrial system data analysis performance.Keywords
In the actual operation of industrial systems, due to equipment wear and tear and external factors, sometimes breakdowns or even accidents caused by malfunctions of industrial machinery occur. From the perspective of economic benefits and safety, delaying the maintenance of industrial systems often leads to unfortunate consequences. Therefore, it is very crucial to monitor the operating status of industrial system units, then find abnormal conditions and assist in timely maintenance to ensure the normal operation of the generator in industrial systems [1,2]. Engineers generally describe the abnormal state of industrial systems by assessing the feature data of the industrial units [3].
As one of the typical industrial systems, the hydropower plant’s healthy state is very crucial to social security. Core algorithms from many specialized fields are suitable for processing industrial data. The mathematical model established by the simulation software was dedicated to describing the performance status of hydropower units [4]. The approach requires a huge cost. Data augmentation methods can also be extended to healthy samples. Lin et al. [5] propose a minority class imbalance rate (MiCIR) and an MiCIR-based data augmentation scheme that can determine the class and the number of samples to be augmented. Ma et al. [6] developed a sparse constraint-based GAN (SC-GAN) method for data augmentation and proposed a methodology for analyzing the network weight matrix to explain the signal generation mechanism. Liang et al. [7] proposed a deep capsule neural network with data augmentation-generative adversarial networks. Existing data augmentation methods, such as minority class imbalance rate strategies and sparse constraint-based GANs, generate synthetic feature samples. Since it is difficult to extract feature data from hydropower units, data augmentation methods are being studied. Inspired by GANs, the GA simplifies the network model and has become a simple and efficient method for extracting feature data of hydropower units.
Industrial data are susceptible to interference from varying operating conditions. Artificial intelligence algorithms are employed for the classification of nonlinear data. To make training sets suitable for machine learning training, a large number of relational models need to be established [8,9]. Li et al. built the mapping between milling force and spindle vibration in a data-driven manner using a long and short-term memory network (LSTM) and a deep neural network (DNN). Zhang et al. [10] proposed a data-model-interactive enhancement-based FTU health condition assessment via the graph-driven health benchmark model (HBM).
In terms of feature extraction, Li et al. [11] utilized relief and correlation analysis to select key running features, reduce data dimensionality, and improve supervision efficiency. To lessen the interference degree of operating condition factors on the data, several investigators have utilized classifiers to classify feature factors [12–15].
Despite the widespread application of large-scale model technology in hydropower units [16], its stability and reliability in processing multiple time series still requires further verification [17]. In general, industrial data exhibit the following characteristics:
• Inconsistent data distribution.
• Data quality deficiencies; it indicates that the data contain substantial noise.
• Mismatch between data scale and complexity. Small-sample data could not support parameter learning in complex models.
• Unclear data features and poor interpretability.
Operational condition variations caused by human factors are unpredictable. Given the inherent uncertainties in industrial data, a single approach is often insufficient to address specific practical problems. Hybrid algorithm strategies can effectively balance multiple conflicting objectives. Meanwhile, distributed systems can enhance the execution efficiency and scalability of hybrid algorithms to address challenges posed by industrial big data.
Feature generation and analysis (FGA) is utilized for feature extraction and data analysis in industrial big data, making it well-suited for anomaly detection. Industrial intelligent systems require a lightweight framework that provides an end-to-end solution for operating condition classification, feature enhancement, model training, and online calibration. Based on the characteristics of hydropower data, the Influence coefficient is a metric used to quantify the degree of impact that a segment of operating condition data has on a segment of signal data. By evaluating the influence coefficient, it focuses on data with weak impacts to achieve the goal of extracting features from massive datasets. The core concept of the grouping-aggregation (GA) scheme lies in summarizing the intrinsic relationships between multiple time series based on their changing patterns, ensuring the uniqueness of these relationships within the time window, and subsequently retaining data with similar features to form labeled feature samples. The software model for data extraction offers strong-practical utility [18,19], enabling widespread application across multiple fields and noticeably enhancing the efficiency of data collection. The main contributions of this article can be summarized as follows:
• The index decomposition (ID) method implements a linear hybrid strategy, while the grouping and aggregation scheme employs a hierarchical hybrid strategy. Grouping-aggregation scheme overcomes the limitations of single algorithms and addresses the challenge of extracting global features from industrial data.
• The system integrates an LSTM-VAE-based passive threshold adjustment algorithm, which dynamically corrects detection thresholds by analyzing reconstruction error distributions, significantly enhancing the system’s robustness against data distribution drift.
• Lightweight feature generator employs adaptive thresholds to enhance local features of data samples, thereby improving the generalization performance and accuracy of predictive models.
The remainder of the paper is organized as follows. Section 2 introduces related data features and the hybrid algorithm strategy. Section 3 describes the methodology of FGA. Section 4 introduces Deployment and Implementation. Section 5 displays experimental verification. Finally, the conclusion is given in Section 6.
Data generated by industrial equipment under stable operating conditions is considered health data; however, due to varying operating conditions, it can easily be confused with anomalous data. A design philosophy for a hybrid algorithm is introduced, which enables a lightweight feature data generator.
There are two types of signals in hydropower units: slow-variable and fast-variable signals. Slow-variable signals are characterized by their low sensitivity to operating condition changes, whereas fast-variable signals exhibit relatively high sensitivity to such variations.
Fig. 1 demonstrates three groups of operating condition data, including active power, rotation speed, guide vane opening, and two groups of temperature data, including thrust bearing and upper guide bearing. It can be seen from the figure that a large amount of data is interference data.
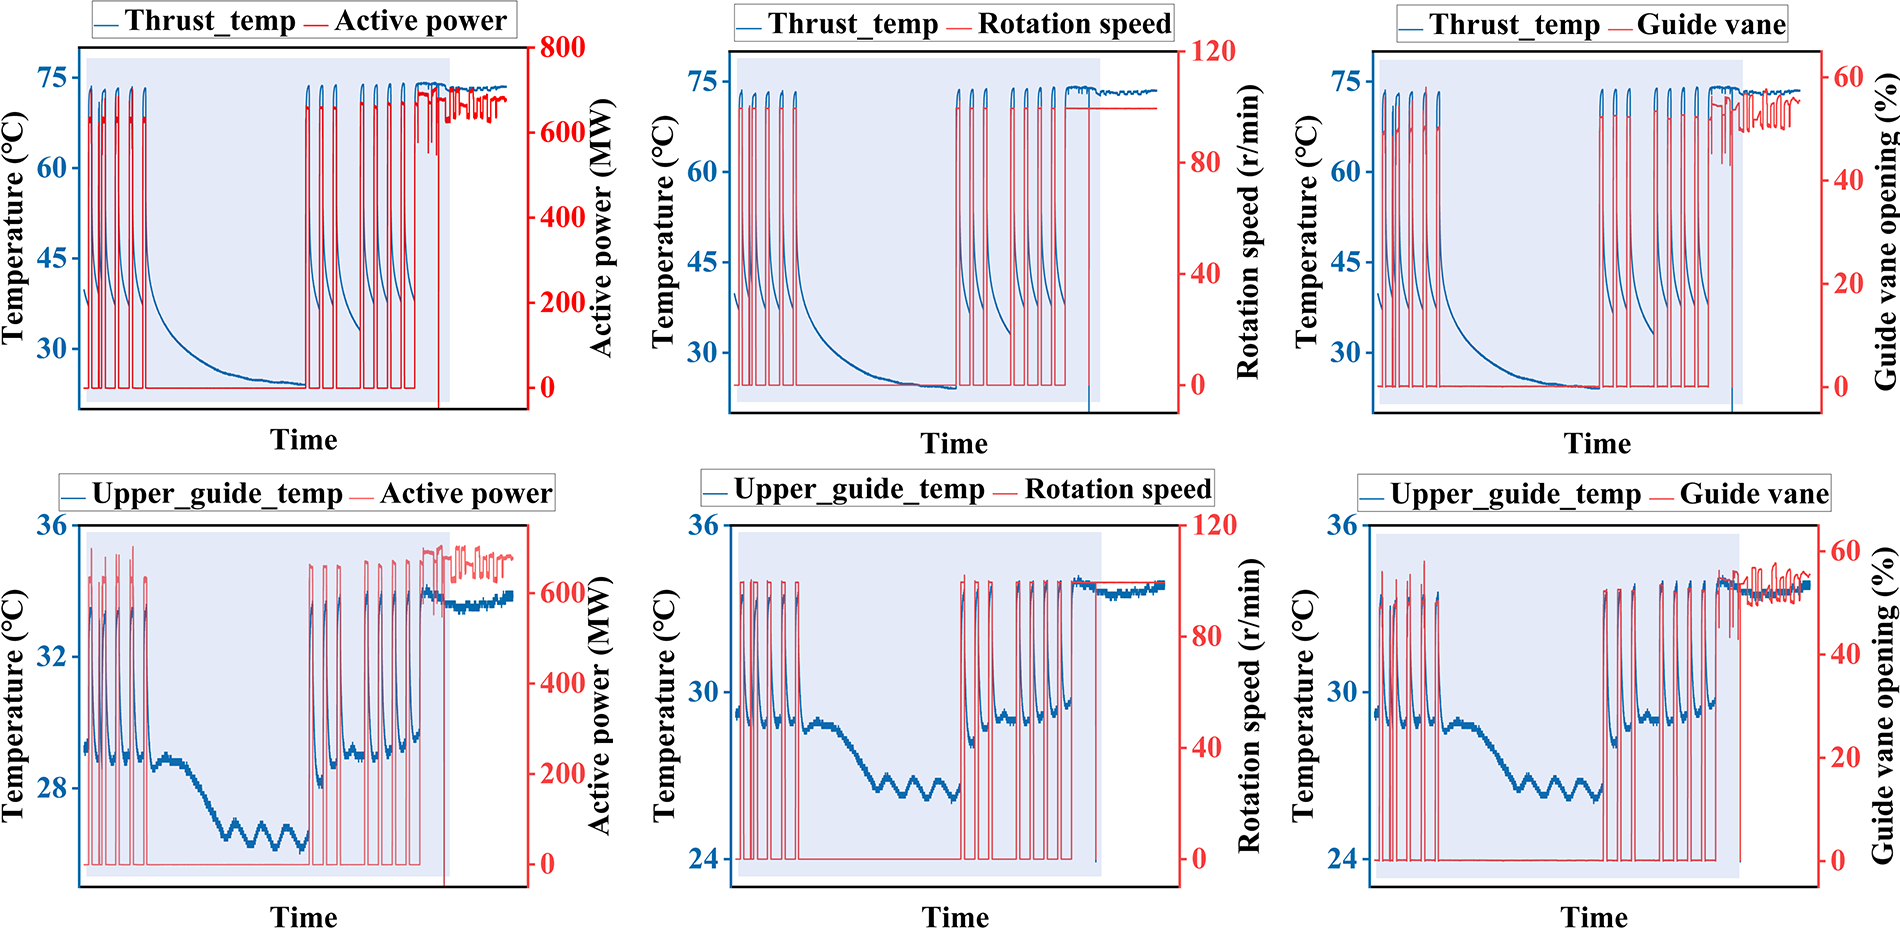
Figure 1: Long-term temperature field plotted data of the understudied hydropower unit that has not been fully studied. Note: The actual data contains a large amount of invalid data, which is represented by shaded areas caused by start-stop and variable load operating conditions.
During healthy operating phases, the temperature signals show negligible long-term trend changes with stable statistical distributions. Furthermore, the interference caused by active power fluctuations is minimized when its variations remain within specific operating limits, as evidenced by the local stability of temperature deviations under limited power modulation. This observation confirms the feasibility of conditional decoupling between intrinsic health-related characteristics and variations in operating parameters.
The operational variability of hydropower units under various operating conditions poses significant challenges in identifying long-term data trends. When the active power fluctuates within constrained ranges, the short-term operational data demonstrate improved stationary characteristics.
As illustrated in Fig. 2 of the vibration time series, the vibration signals show greater sensitivity to changes in operating conditions and exhibit significant amplitude deviations due to wide fluctuations of active power, which obscures the detection of long-term trends. The implementation of adaptive time windowing enables the efficient extraction of stationary vibration subsequences from these transient states. Subsequent feature extraction processes facilitate the systematic computation of comprehensive trend patterns from denoised data representations, achieving decoupling of operating conditions while preserving intrinsicabnormal trend signatures.
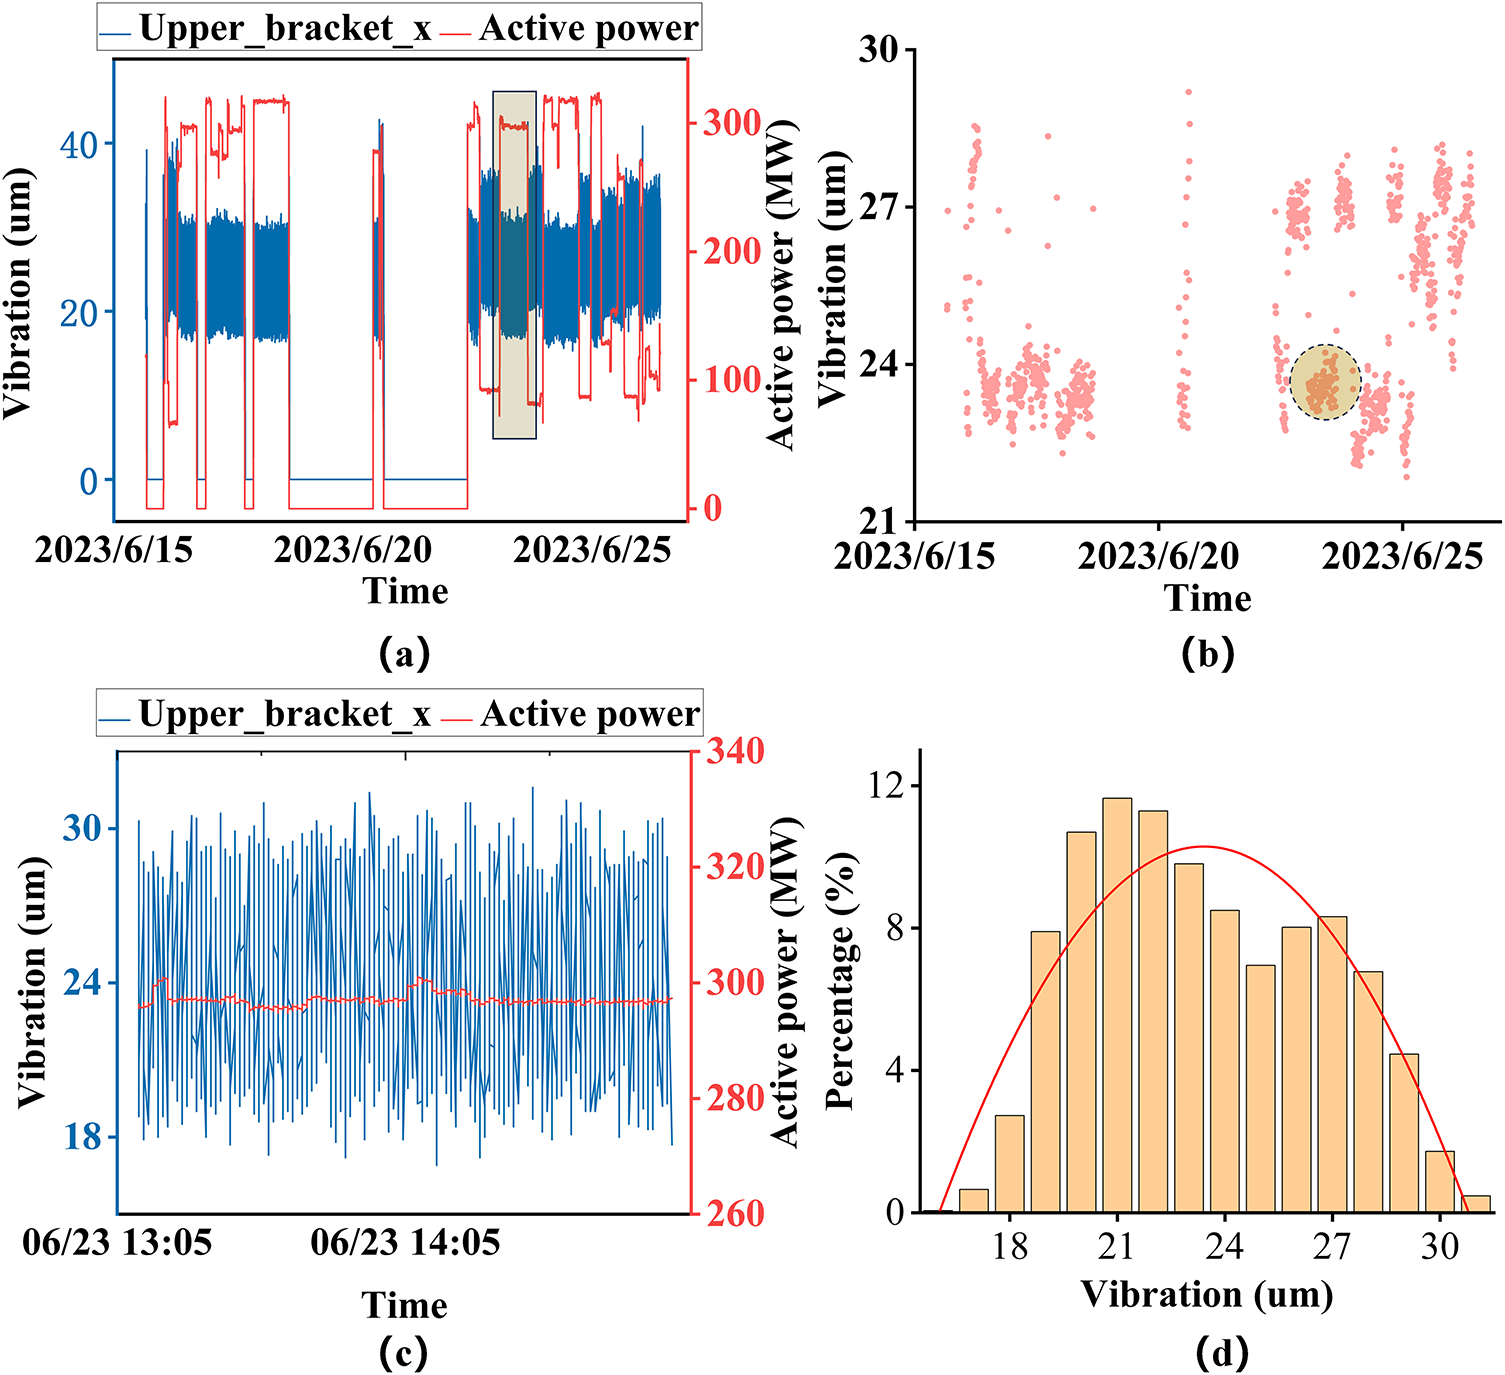
Figure 2: Long-term vibration plotted data of the not fully explored hydropower unit: (a) Long-time series of vibration signal in hydropower unit, (b) Features of short-time series clustering, (c) Uncompressed actual data in the yellow area, (d) Probability distribution of the plotted results in subfigure (c). Note: The variation data is highly affected by active power variation.
The basic criterion for determining the health status of a hydropower unit requires that the monitored parameters remain consistently below predefined threshold levels or within standard operating ranges [20]. Feature data extraction requires reference to stationary operational data segments, which are identified through two critical criteria:
• Operational stability when the unit factors fluctuate within bounded ranges under steady operating conditions, demonstrating little sensitivity to transient condition changes.
• Controlled trend deviations during periods such that the cumulative data changes remain within acceptable tolerance thresholds.
These criteria generally describe feature data (health data) that exhibit minimal short-term sensitivity to fluctuations in operating conditions and the absence of detectable long-term trend deviations, and establish the basic patterns necessary for effective extraction.
The hybrid algorithm strategy leverages the complementary principles of different algorithms to extract features from industrial data based on their respective strengths. The main formulations of both the linear hybrid strategy and the hierarchical hybrid strategy are provided in Eqs. (1) and (2), where
The index decomposition (ID) method employs a linear hybrid strategy, while the aggregation method adopts a hierarchical hybrid strategy. Meanwhile, the output of the aggregation method can also serve as input to deep learning approaches, thereby enhancing the system’s flexibility.
The FGA is a well-suited approach for narrowing the scope of massive datasets, enhancing data quality, and extracting anomalous datasets. The FGA essentially relies on a grouping-aggregation (GA) scheme. The GA represents an algorithmic scheduling framework primarily used for data slicing and data integration in intelligent systems. The index decomposition and stability analysis are the core of the GA scheme.
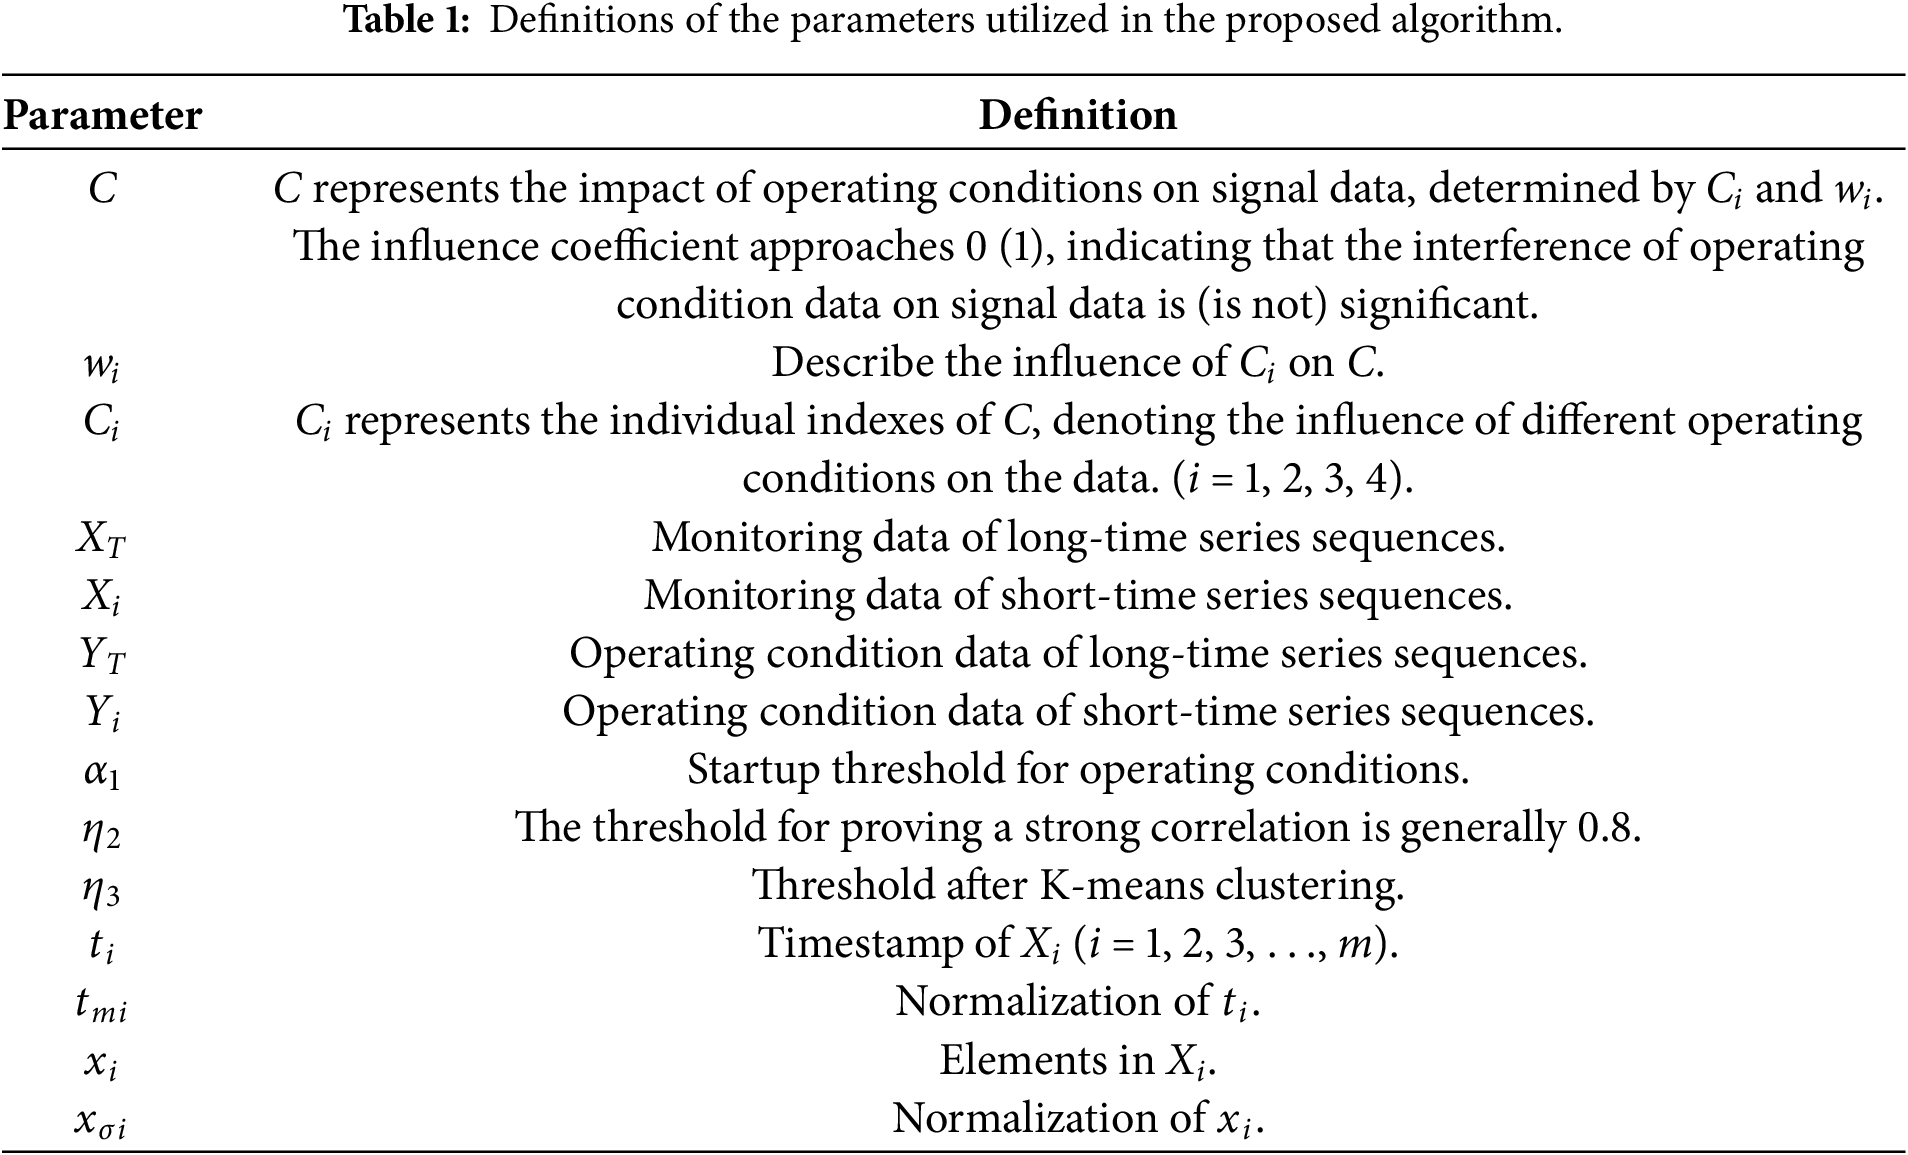
The ID development constructs the condition-specific-based models through two complementary approaches—start-stop condition modeling and variable load operational modeling. The aggregation scheme integrates the outlier analysis and anomaly trend detection, effectively decoupling operational variability from intrinsic anomalous data patterns. This structured approach enables systematic extraction of health features while maintaining physical interpretability in heterogeneous operating regimes. The parameters used in the GA scheme are given in Table 1.
3.1 Industrial Algorithm Integration Framework
Industrial systems require the online training processes of deep learning, yet deep learning imposes high demands on data quality and interpretability. The FGA is a feature extraction framework enhancing the accuracy of deep learning models, with experimental results presented in Section 5.
Deep learning models possess significant theoretical depth and place high demands on data quality. Insufficient training samples or unpredictable trend variations in industrial data can both adversely affect the generalization performance of deep learning models. To enhance the research value of industrial data, FGA is designed to improve the quality of such data. Common feature engineering methods often struggle to handle specific types of industrial data. FGA employs an advanced algorithmic scheduling strategy that leverages combinations of fundamental methods to enhance data interpretability. FGA is closely related to deep learning and can even reduce the complexity of deep learning models in Fig. 3.
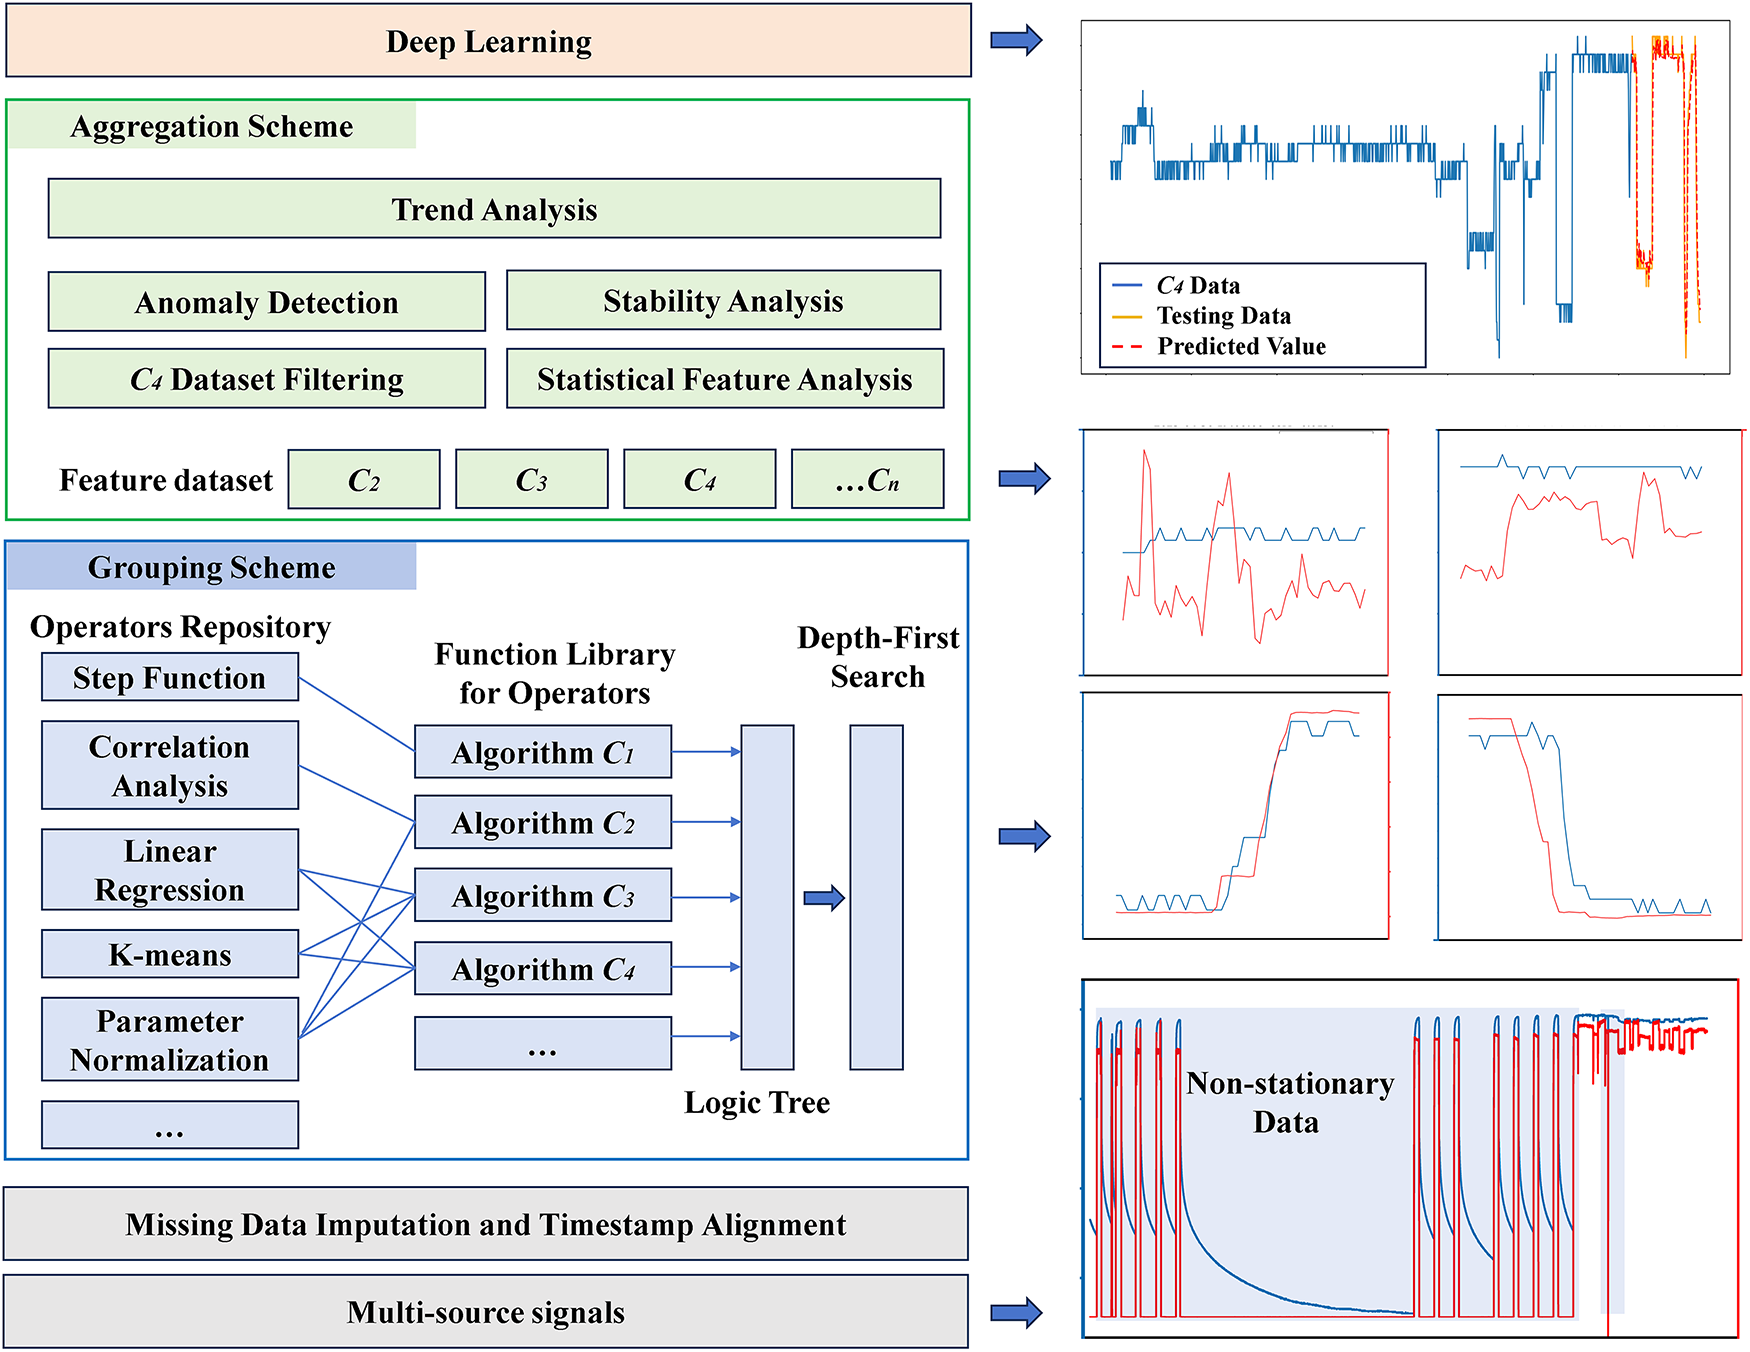
Figure 3: FGA can enhance the predictive performance of deep learning models on data. Note: Data with stable trends can accelerate model training and enhance the model’s generalization capability.
The prerequisite for selecting a deep learning model is to understand the inherent patterns of the data. However, unlike humans, intelligent systems do not plot waveforms of industrial data, analyze autocorrelation and trends, and adjust appropriate deep learning models. To enhance data stability, reduce model complexity, and enable automatic collection of health samples, a storage-for-performance trade-off approach is widely adopted in industrial systems.
Considering the complexity of analyzing the variable operating conditions of hydropower units, the present research work utilizes exploratory factor analysis (EFA) to obtain the factors of the operating conditions that mainly affect the signal data. The EFA is mainly applied to identify the hidden factors between a set of variables. The method proposed by Liu et al. [21] employs correlation analysis to identify critical measurement points in the operation of hydropower units and enables the construction of multi-parameter indices for comprehensive condition assessment. In general, the operating conditions of the unit are basically divided into starting and stopping states, standstill state, no-load state, variable load, load rejection, stable operation, and other states. Table 2 shows the correlation coefficient between the operating condition data and the signal data of Fig. 1. The correlation coefficient between active power and other signals is the highest, which can characterize the influence of operating conditions on the signal.
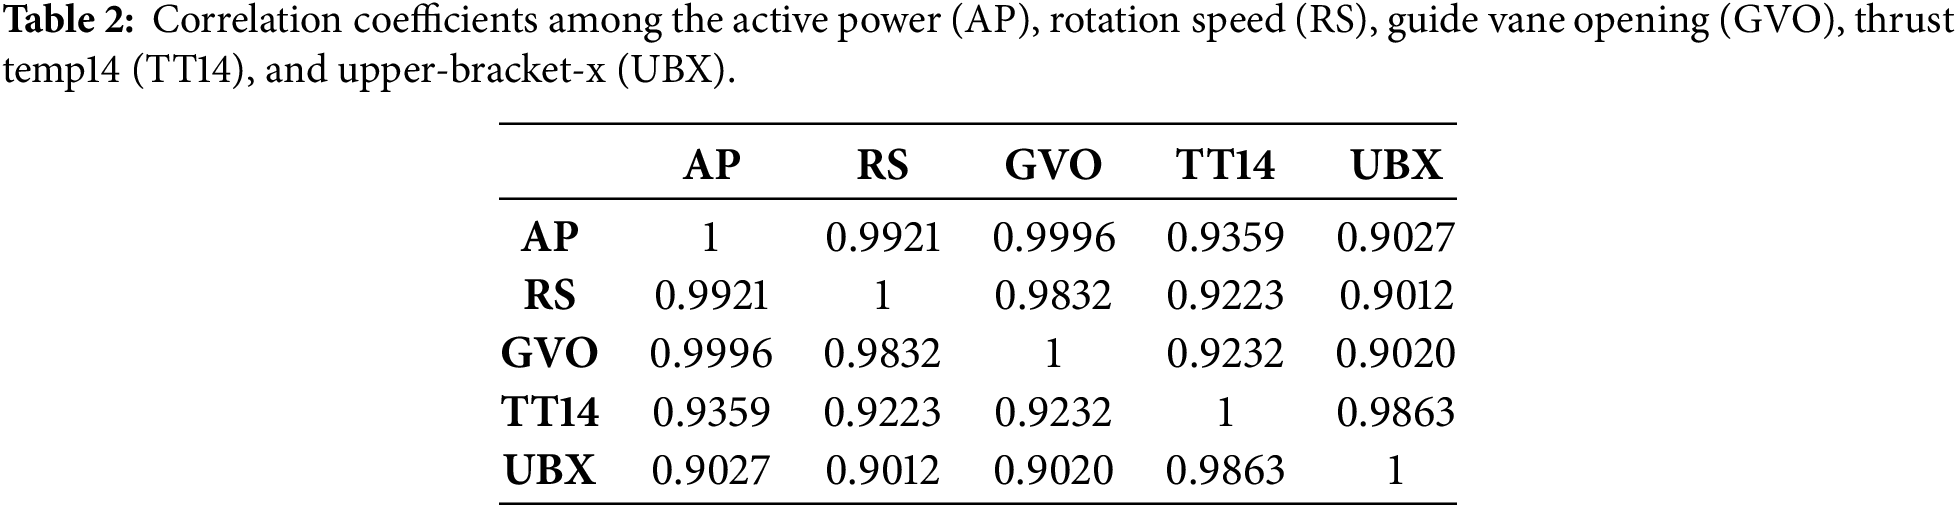
In terms of data, changes in active power, speed, and guide vane opening lead to changes in the signal data. For instance, considering a single unit, as EFA analysis is performed on the operating condition data and signal data, it is found that the signal change is essentially influenced by the active power.
When using a sliding time window to segment data, it is essential to ensure that the data within each time window maintains a consistent state Ci. This is a prerequisite for the successful implementation of the ID method. In the present investigation, the item-by-item decomposition method is adopted to simplify the problem as illustrated in Fig. 4. The multilevel-hierarchical (M-H) decomposition analysis model can be formulated by Eqs. (3)–(5):
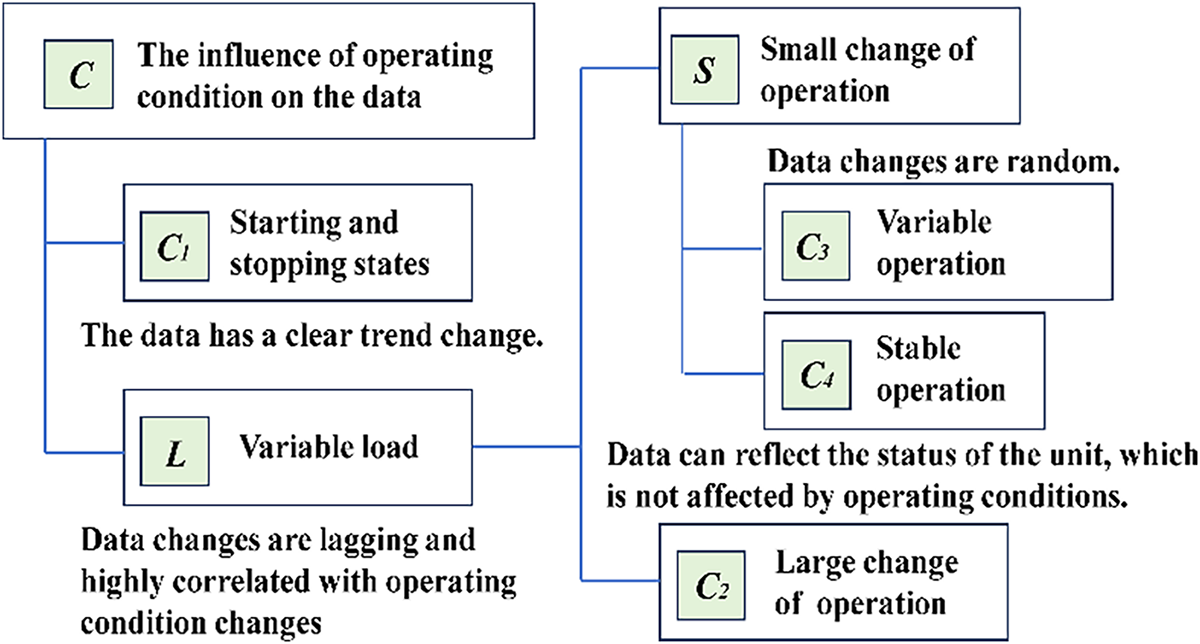
Figure 4: The structure of the ID model based on the M-H decomposition analysis model. Note: Each index contains obvious data change characteristics of short-time series under varying conditions.
To solve the problem of complex changes in the operating conditions of the hydropower unit, the conditions can be decomposed into three levels. Since the operating condition changes have a time sequence, wi is utilized to ensure that only one operating condition plays a decisive role in each period. The influence coefficients of operating condition data on the signal can be decomposed into the following indices:
• In the startup process, the equipment changes from the initial startup state to the startup state, or in the shutdown process, the changes from the shutdown state to the complete stop state. The influence of operating condition data on the signal data is denoted by the index C1.
• In the startup process, the equipment changes from the initial starting state to the operating state, or in the shutdown process, the changes from the operating state to the shutdown state. The influence of operating condition data on the signal data is represented by the index C2.
• In the working state, when the equipment is in a variable operating condition, the signal data exhibits an obvious variation trend, and the influence of operating condition data on the signal data is mainly denoted by the index C3.
• In the working state, when the equipment is subjected to variable operating conditions, there is no obvious trend change in the signal data, and the influence of the operating condition data on the signal data, the so-called index C4, is significant.
The ID method is a classification model whose advantage lies in not requiring training data but only a small amount of observational data. ID primarily addresses feature analysis of data within time windows, where wi indicates whether a data slice meets condition Ci. However, condition Ci is not absolute; its variability is controlled through thresholds. To better characterize this variability, k-means clustering is employed to manage the thresholds, thereby enabling an adaptive process. In general, the GA has two stages, as presented in Fig. 5. In the grouping scheme, Influence coefficients are used to classify short-time series. In the aggregation scheme, analysis of data with minimal process interference facilitates the observation of unit degradation trends.
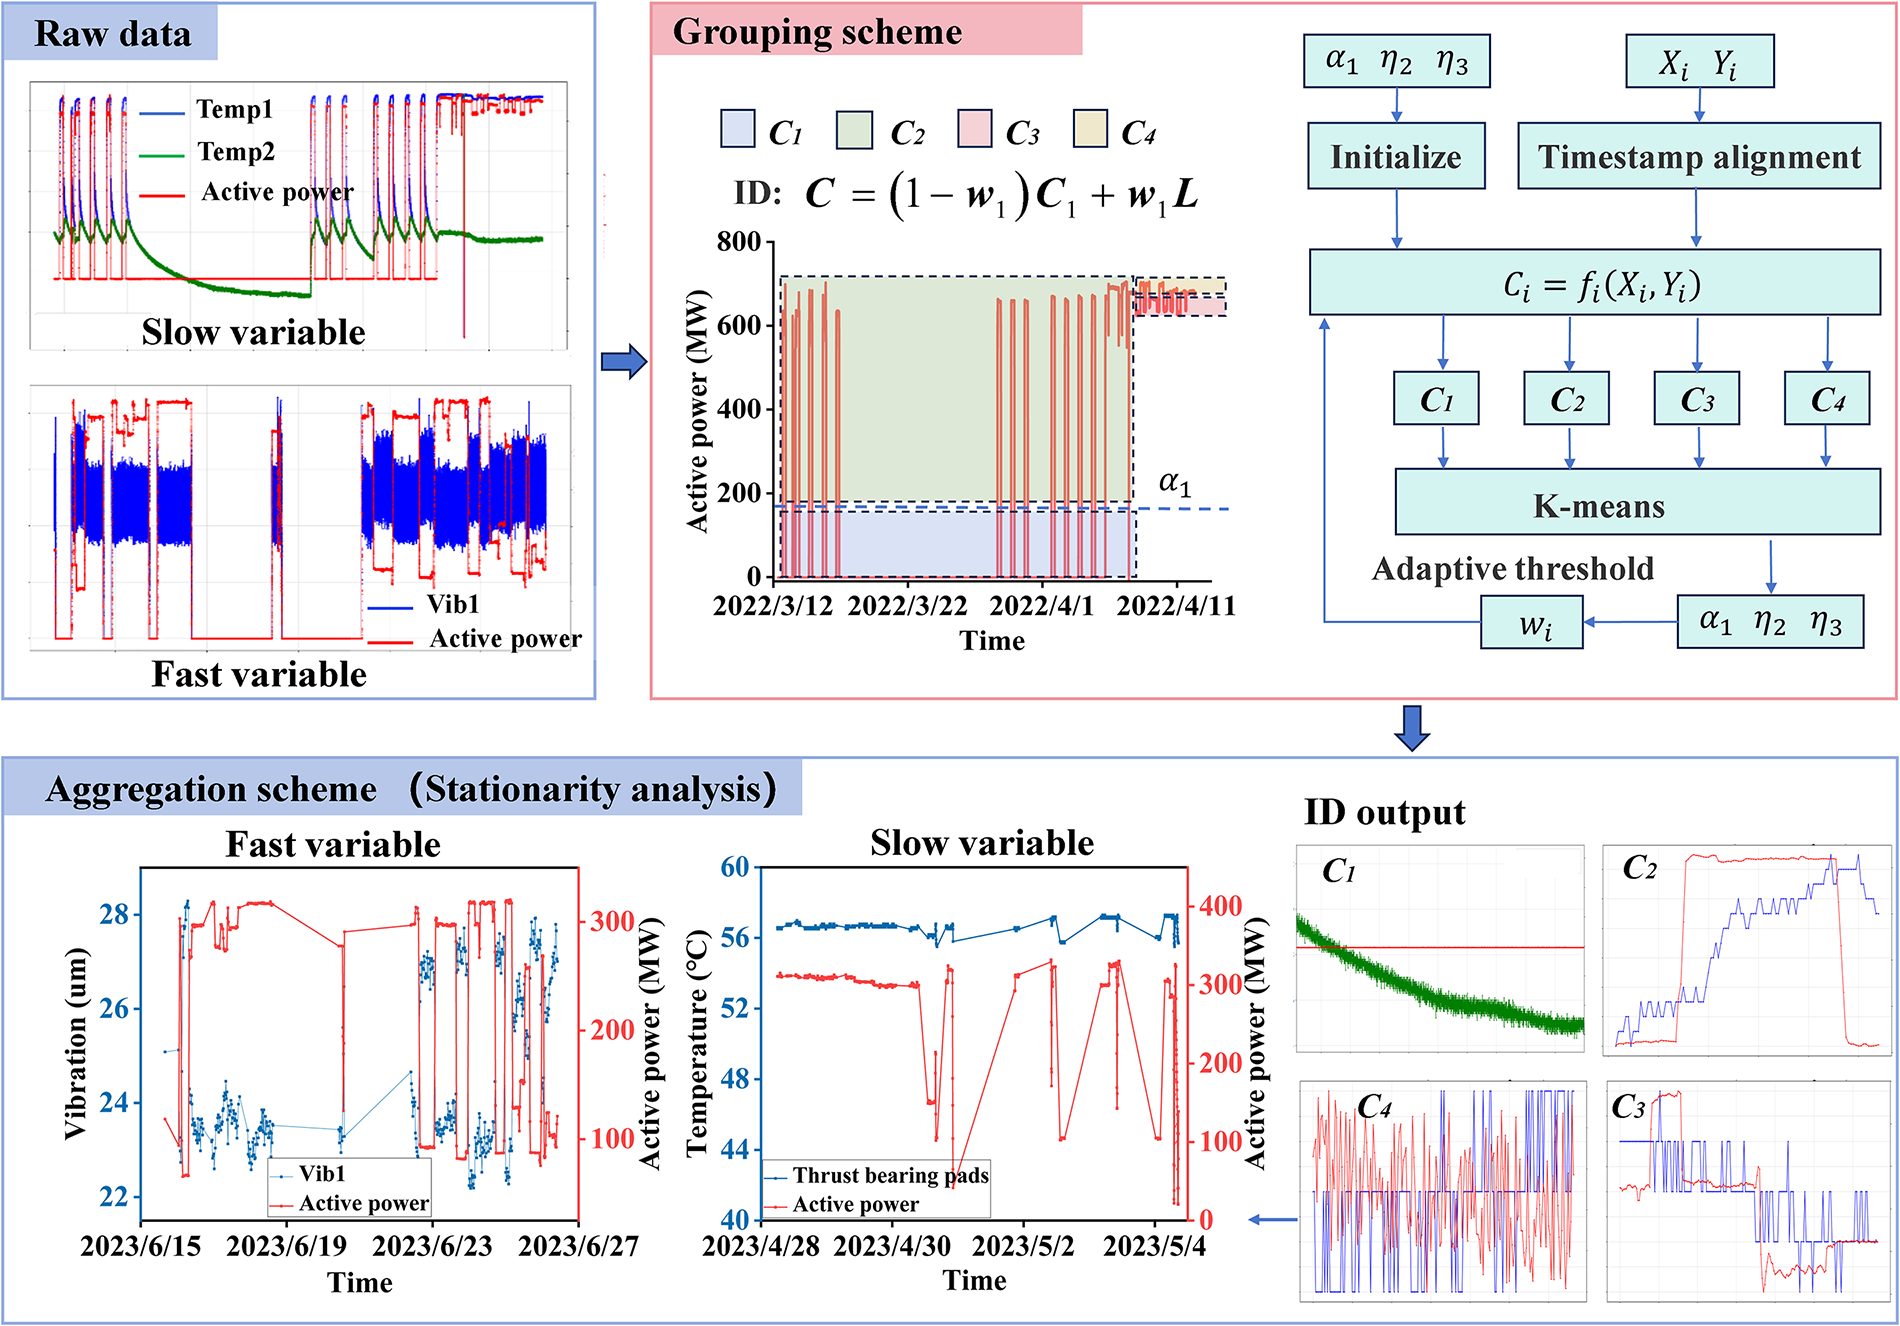
Figure 5: Workflow of the GA-based FGA approach. Note: The scheme illustrates data segmentation, index decomposition, trend analysis of feature extraction.
The equation variable referenced in Table 1 and the timestamp alignment are suitably guaranteed as Eqs. (6)–(8):
In addition, the influence coefficient of the operating condition data on the signal data is expressed by the following relation as Eq. (9):
The step function is used to describe C1. In the start-up phase of a hydropower unit, the C1 index is mainly employed to distinguish the operation state from the shutdown state without requiring the threshold to be accurate. In the start-up phase, the starting (start-up) state value of the active power is assumed as 0 (
The correlation coefficient is highly suitable for describing the impact of active power on the data. Whether during start-stop or variable load phases, interference from operational condition data within the time window on signal data can adversely affect the training performance of deep learning models.
The factor C2 describes the characteristics of the data change. The operating parameter is formulated to characterize the non-stationary nature of the active power and explicitly addresses its inherent time trend changes as Eq. (11):
The indices C3 and C4 illustrate a common behavioral pattern characterized by significant trend deviations in the signal data during the variable load operating regimes, reflecting their inherent sensitivity to the dynamics of transient power modulation. C3 indicates that while active power remains relatively stable, the signal data exhibits noticeable trend variations. Such changes do not specify the underlying cause and require further analysis. C4 indicates that the signal data shows no significant trend changes, suggesting that the data within the time window is healthy.
The slope of the short-time series is solved by the linear regression algorithm, and the slope k(Xi) of Xi is solved by the maximum likelihood estimation and the least squares method. In doing so, the main steps are as follows:
• The timestamp
• Through adopting the min-max normalization to Xi, where
• Considering that the time series Xi has m samples, and the linear model can be parametrically formulated in the following form:
When in time
Since
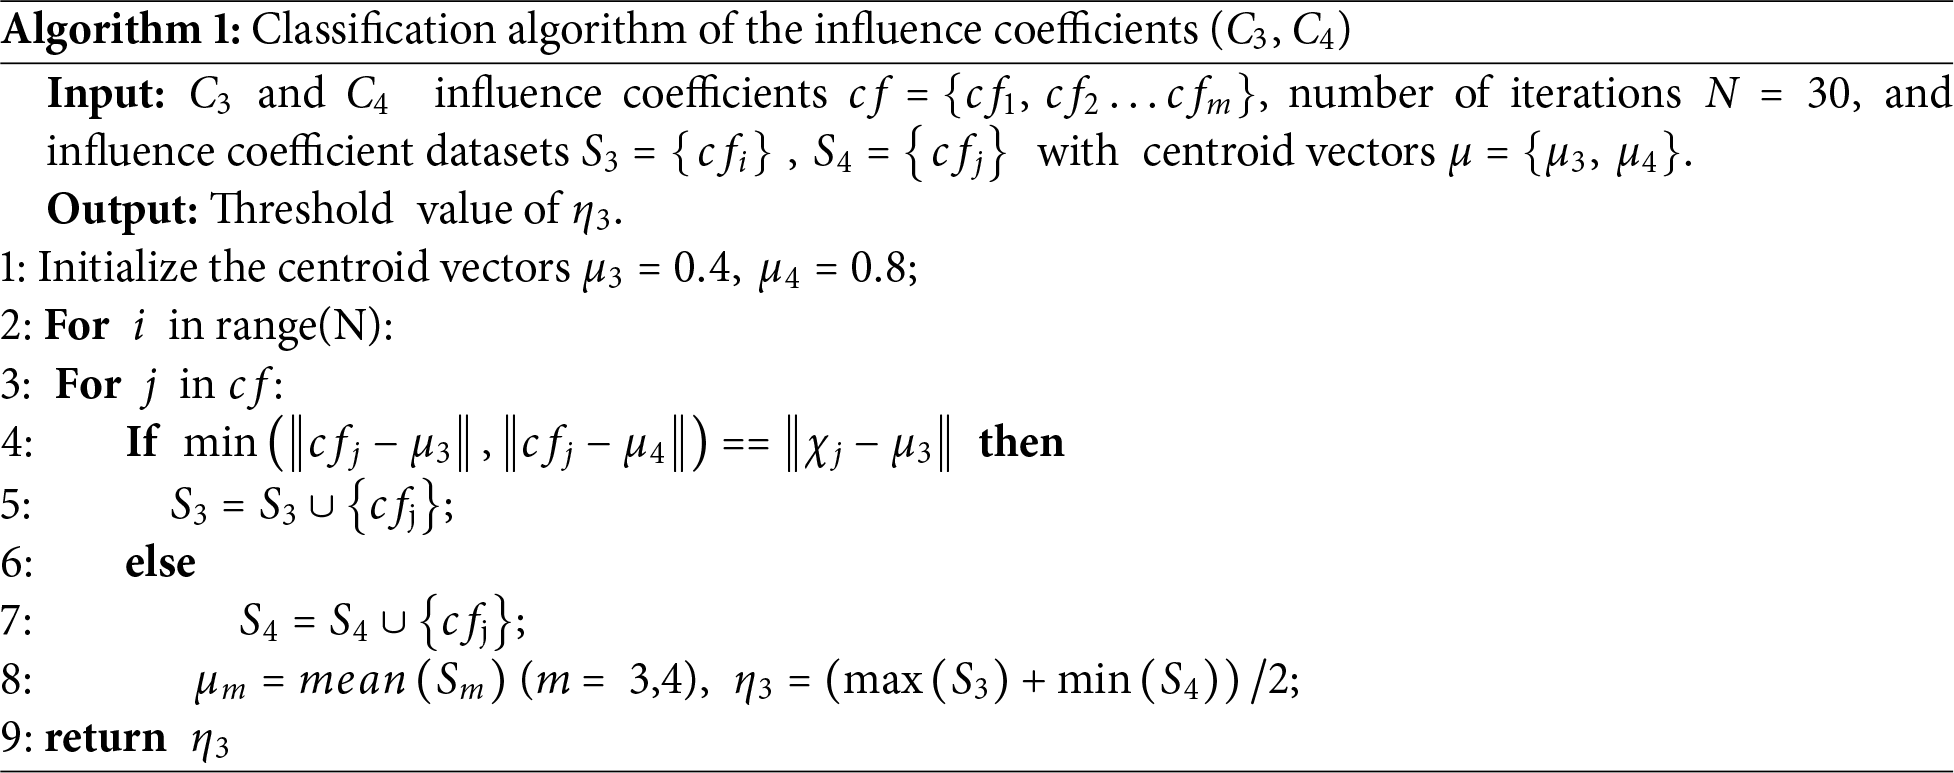
Because C3 and C4 have the same influence coefficient algorithm, a classification algorithm should be employed to effectively cluster C3 and C4 together. The K-Means algorithm clusters short-time series based on the influence coefficients (C3, C4), isolating data with minimal operational interference in Algorithm 1.
The robustness and generalization performance of threshold systems have garnered widespread attention. Subsequent sections will analyze how to enhance the system’s robustness.
3.3 System Robustness and Generalization Capability
Threshold systems may exhibit underfitting, specifically manifested as C4 data containing C3 data. To enhance system stability, we have derived a feedback concept from generative steganography [22,23]. A feedback mechanism is designed to enhance the system’s robustness and generalization performance in Fig. 6.
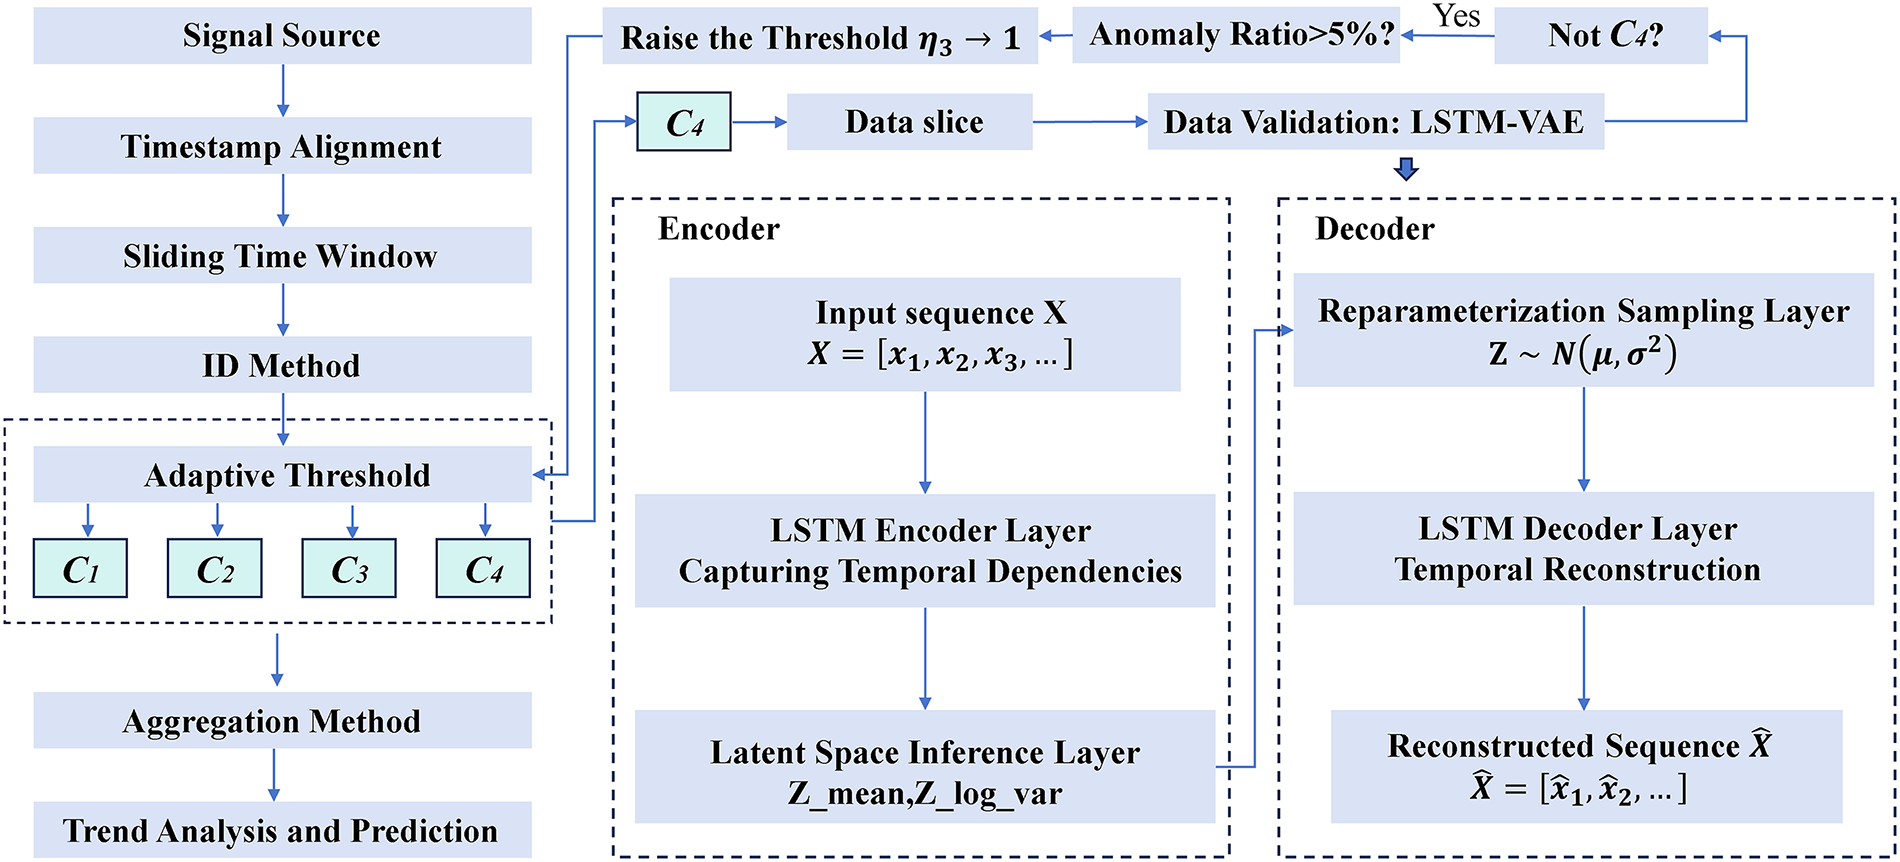
Figure 6: Passive threshold adjustment strategy (LSTM-VAE-based feedback mechanism).
If C3 is mistakenly identified as C4, the error between this dataset and the LSTM-VAE reconstructed dataset will be greater than that between normal C4 datasets. Total loss = reconstruction loss (
The advantages of LSTM-VAE lie in its minimal requirement for large sample datasets, operational stability, and a certain capacity for sample generation. Algorithm 2 periodically monitors the anomaly probability of C4 and adjusts the threshold k accordingly.
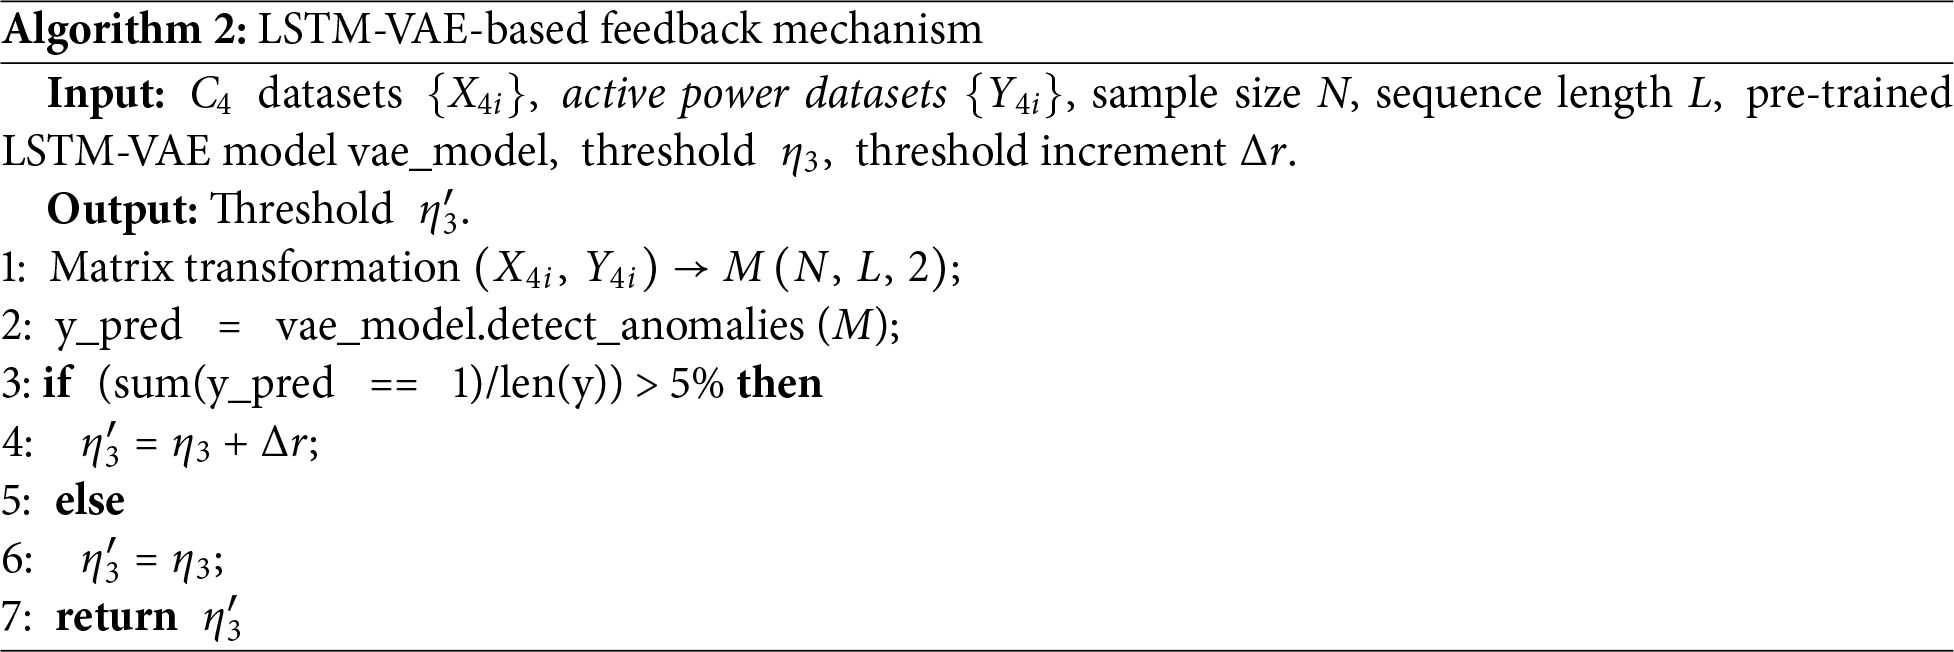
Anomaly detection function is encapsulated within the LSTM-VAE class, using the MSE metric to evaluate the distance between real data and reconstructed data. The anomaly detection threshold is set as a quantile of the MSE metric from the training signals.
If the recognition accuracy of the LSTM-VAE falls below 95%,
Following the grouping scheme’s classification of short-time series into C1–C4 indices, the aggregation scheme recombines stable C4 data for trend analysis. The selection of C4 is related to both the time window and the threshold
Regardless of how the time window is set, it is possible that data from multiple operating conditions within the same time window is filtered. To reduce data loss, ensure that the data within the time window forms a stable sequence. The threshold
The core idea of the aggregation scheme is to describe short-time series with feature vectors. Statistical analysis is suitable for such data processing in Fig. 7. For data with a large standard deviation, it is necessary to remove outliers. Assuming that the C4 data is stationary, the ADF test is used for verification. Statistical characteristics of the Gaussian distribution for stable data can reduce the amount of data in C4.
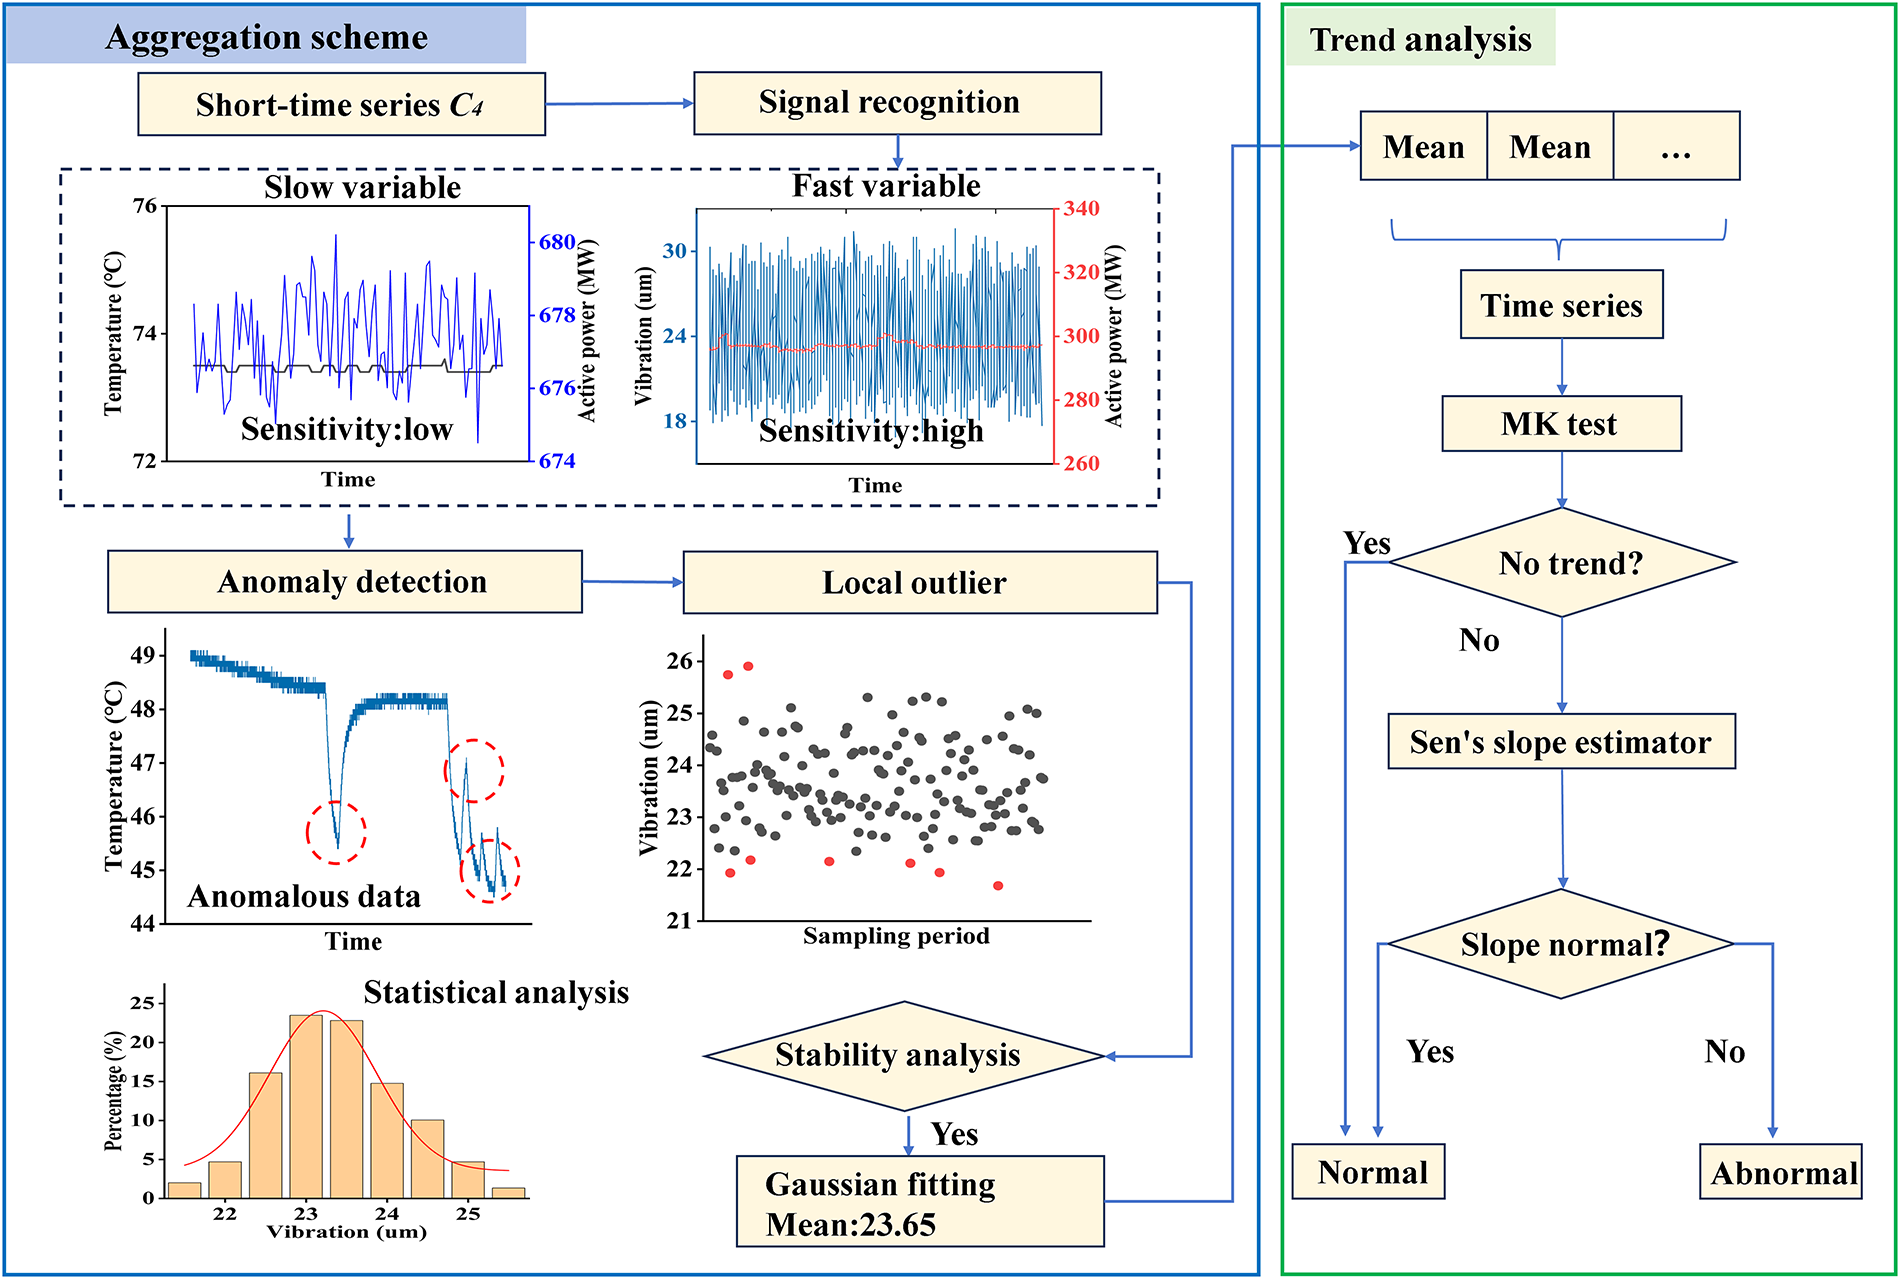
Figure 7: Algorithm model of the aggregation scheme. Note: This model is mainly utilized for long-term sequence abnormal trend analysis.
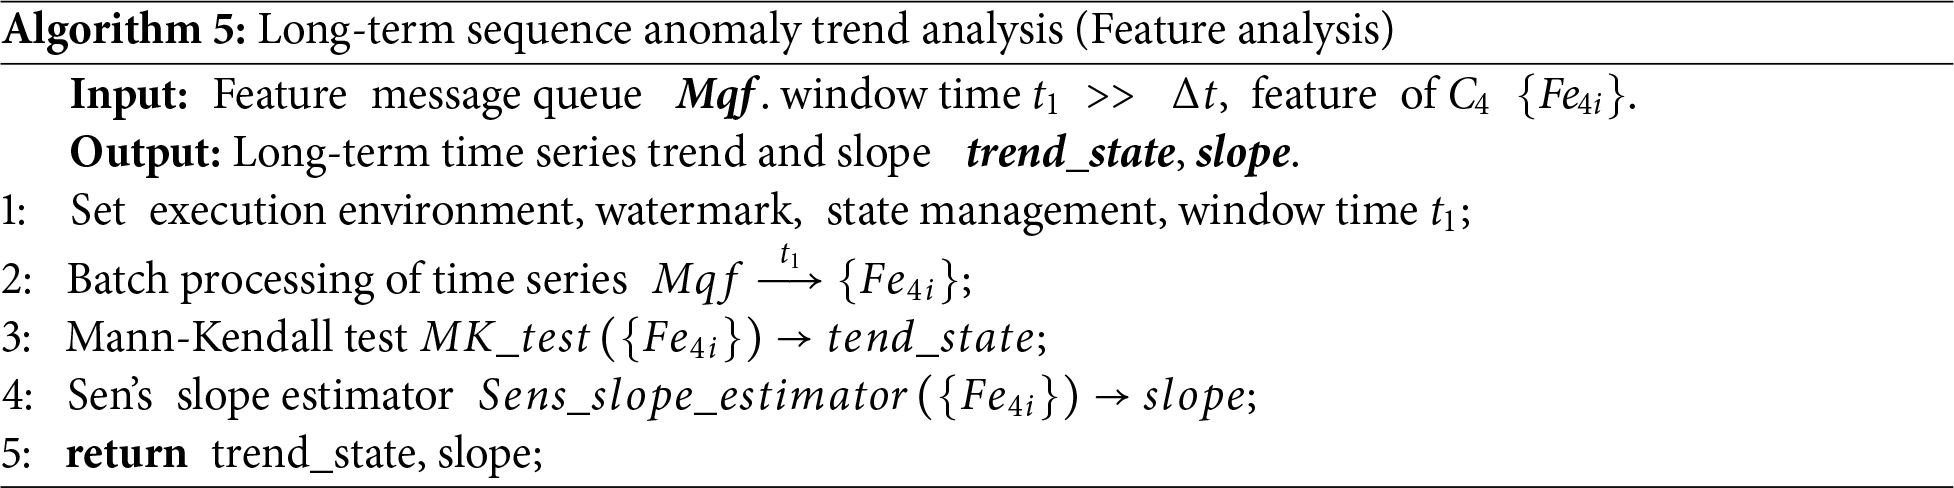
In actual engineering applications, the Mann-Kendall test is more suitable for analyzing trends in stationary data [24]. ID can enhance the characterization of the data and aggregation scheme by using the mean to filter out a large amount of data. As the above processed data is put into the MK algorithm, the MK test can achieve the analysis of long-time series. If the trend of the MK test is rising, Sen’s slope estimator will further analyze the results to ensure trend change within the allowable range.
3.5 Discussions on the Scalability
Time window and K-Means threshold are important parameters of the FGA. Ideally, the operating condition data within the time window is constant. Clearly, this is not realistic; a loose constraint is that the influence of operating conditions on the data is low within the time window. The slow variables, such as temperature and pressure, which are not sensitive to the operating condition data, within the time window of 100 min or longer, could compress the data to the maximum extent. The time window for vibration data is 10 min because the vibration data is more susceptible to the influence of operating condition factors. It is impossible to avoid different operating conditions in the same time window, but there are not many such data blocks. The K-Means threshold mainly separates stable data from non-stable data; in fact, this threshold is equivalent to an empirical value obtained through big data analysis.
The FGA is not only applicable to hydropower but also to wind power and thermal power, but it is more suitable for analyzing long-term data. The default will not fail in the short term. The ID has a high degree of scalability. Perhaps the span of the operating condition is very large, and the frequent switching causes the MK detection results to be inaccurate. The precise control of the calculation results can be achieved by modifying Ci or adding Ci. Of course, enhancing the aggregation effect by adjusting the outlier detection method and denoising method is also an optimization direction.
This chapter presents the basic theory of the FGA, which provides a fairly solid foundation for the engineering application explained in Section 4.
4 Deployment and Implementation of FGA
FGA is deployed in the edge intelligent equipment of hydropower stations in Fig. 8. The FGA-based approach has the characteristics of strong adaptability, fast algorithm response speed, and a large amount of data processing.
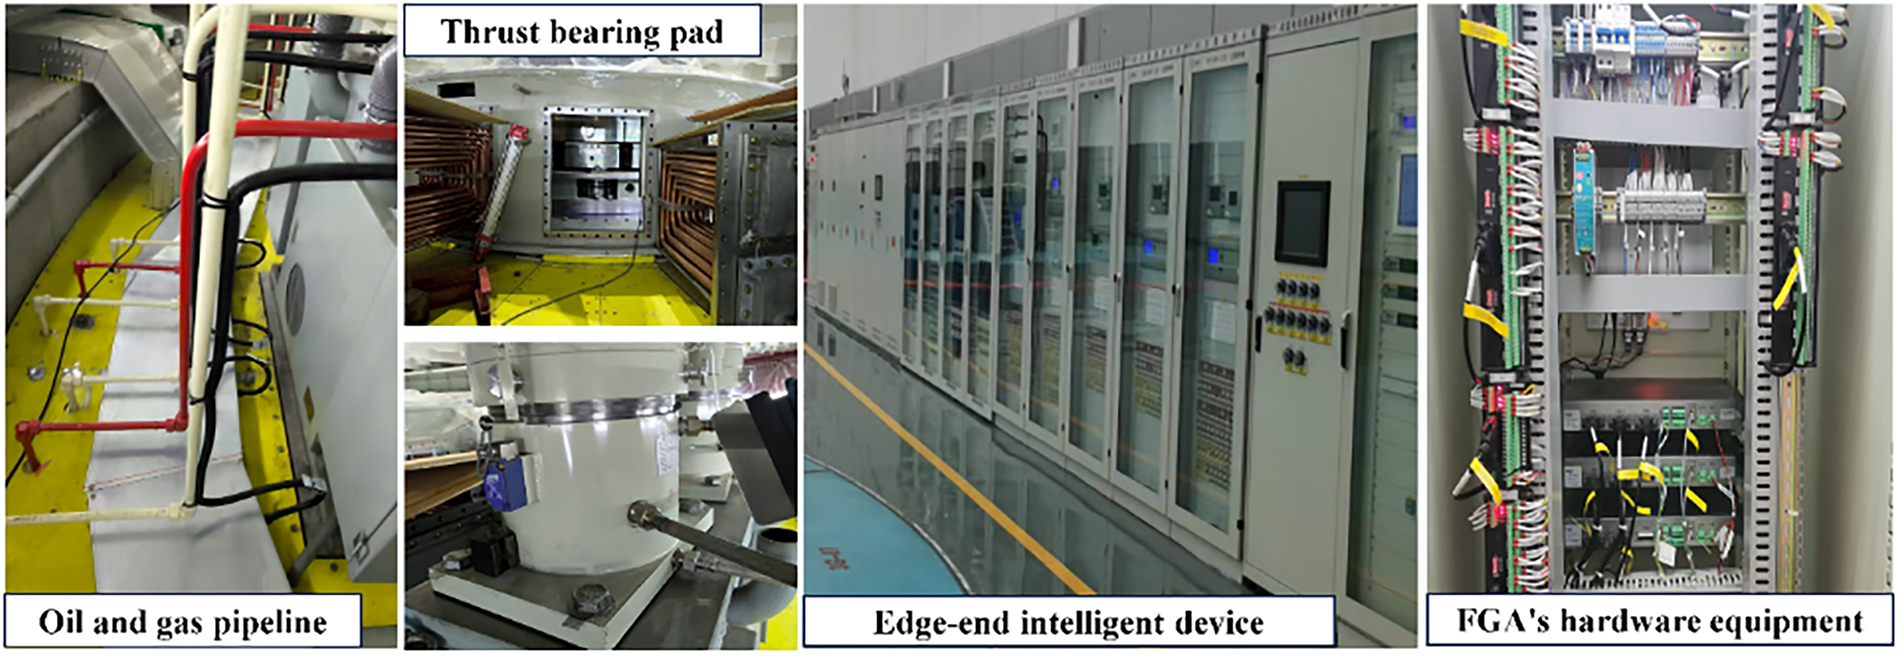
Figure 8: GA-based FGA installation hardware environment. Note: The FGA approach is suitable for concurrent feature data processing of thousands of signals.
Frequent start-stop of the machine leads to poor data quality and scattered data features. The GA plays a significant role in the trend analysis of the long-term sequence of hydropower data. The integration of ID with distributed streaming computing frameworks (e.g., Flink, Storm) enhances the processing capability of big data.
The feature generation plays a significant role in engineering, and Fig. 9 can be utilized as a basic framework for feature generation in the field of hydropower. The detailed algorithm is described in Algorithms 3 and 4.
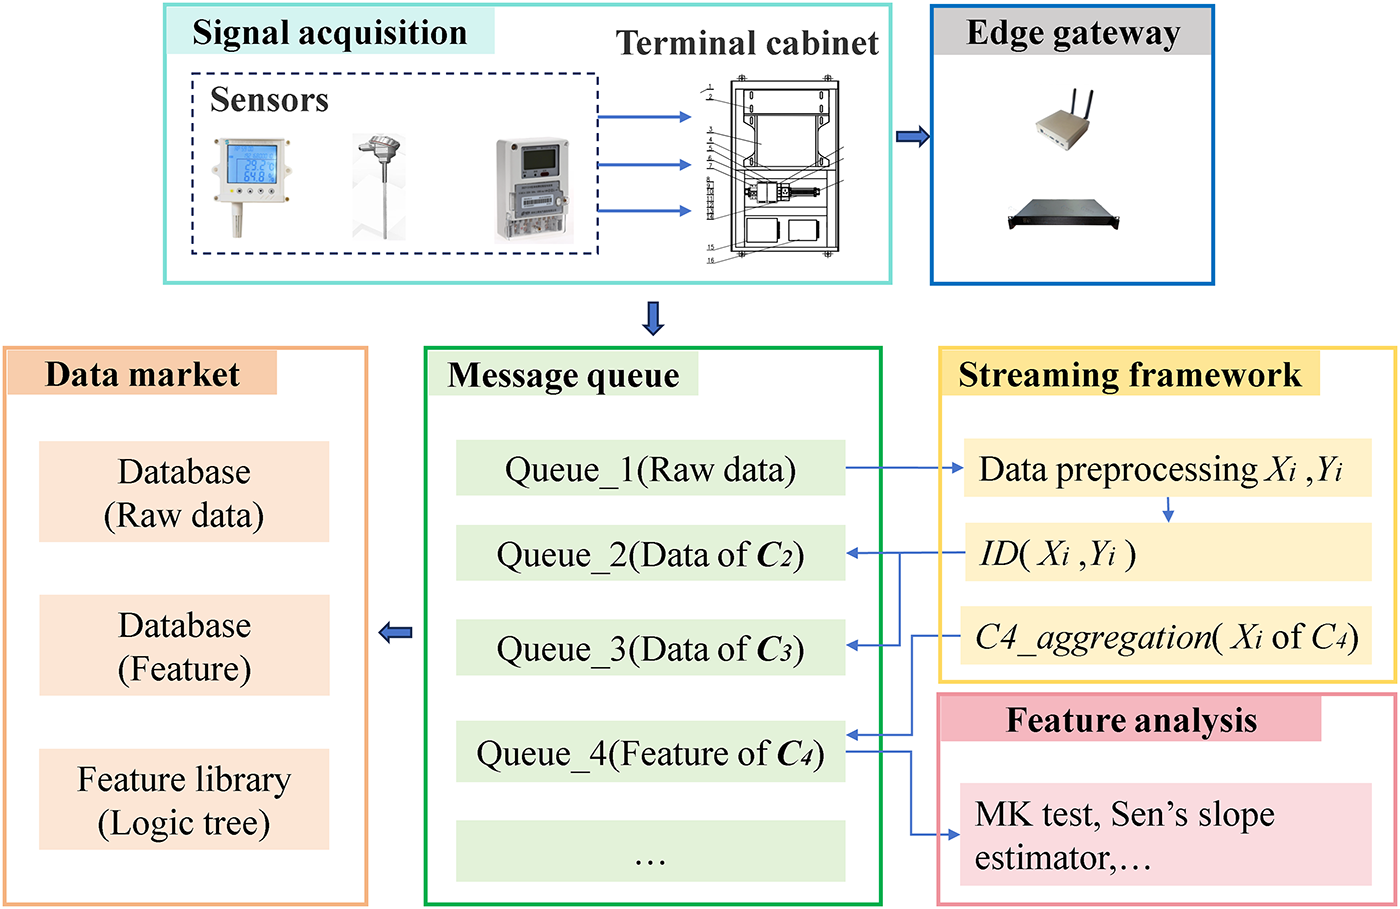
Figure 9: Schematic workflow diagram of the FGA data packaging process in the actual production and trial environment.
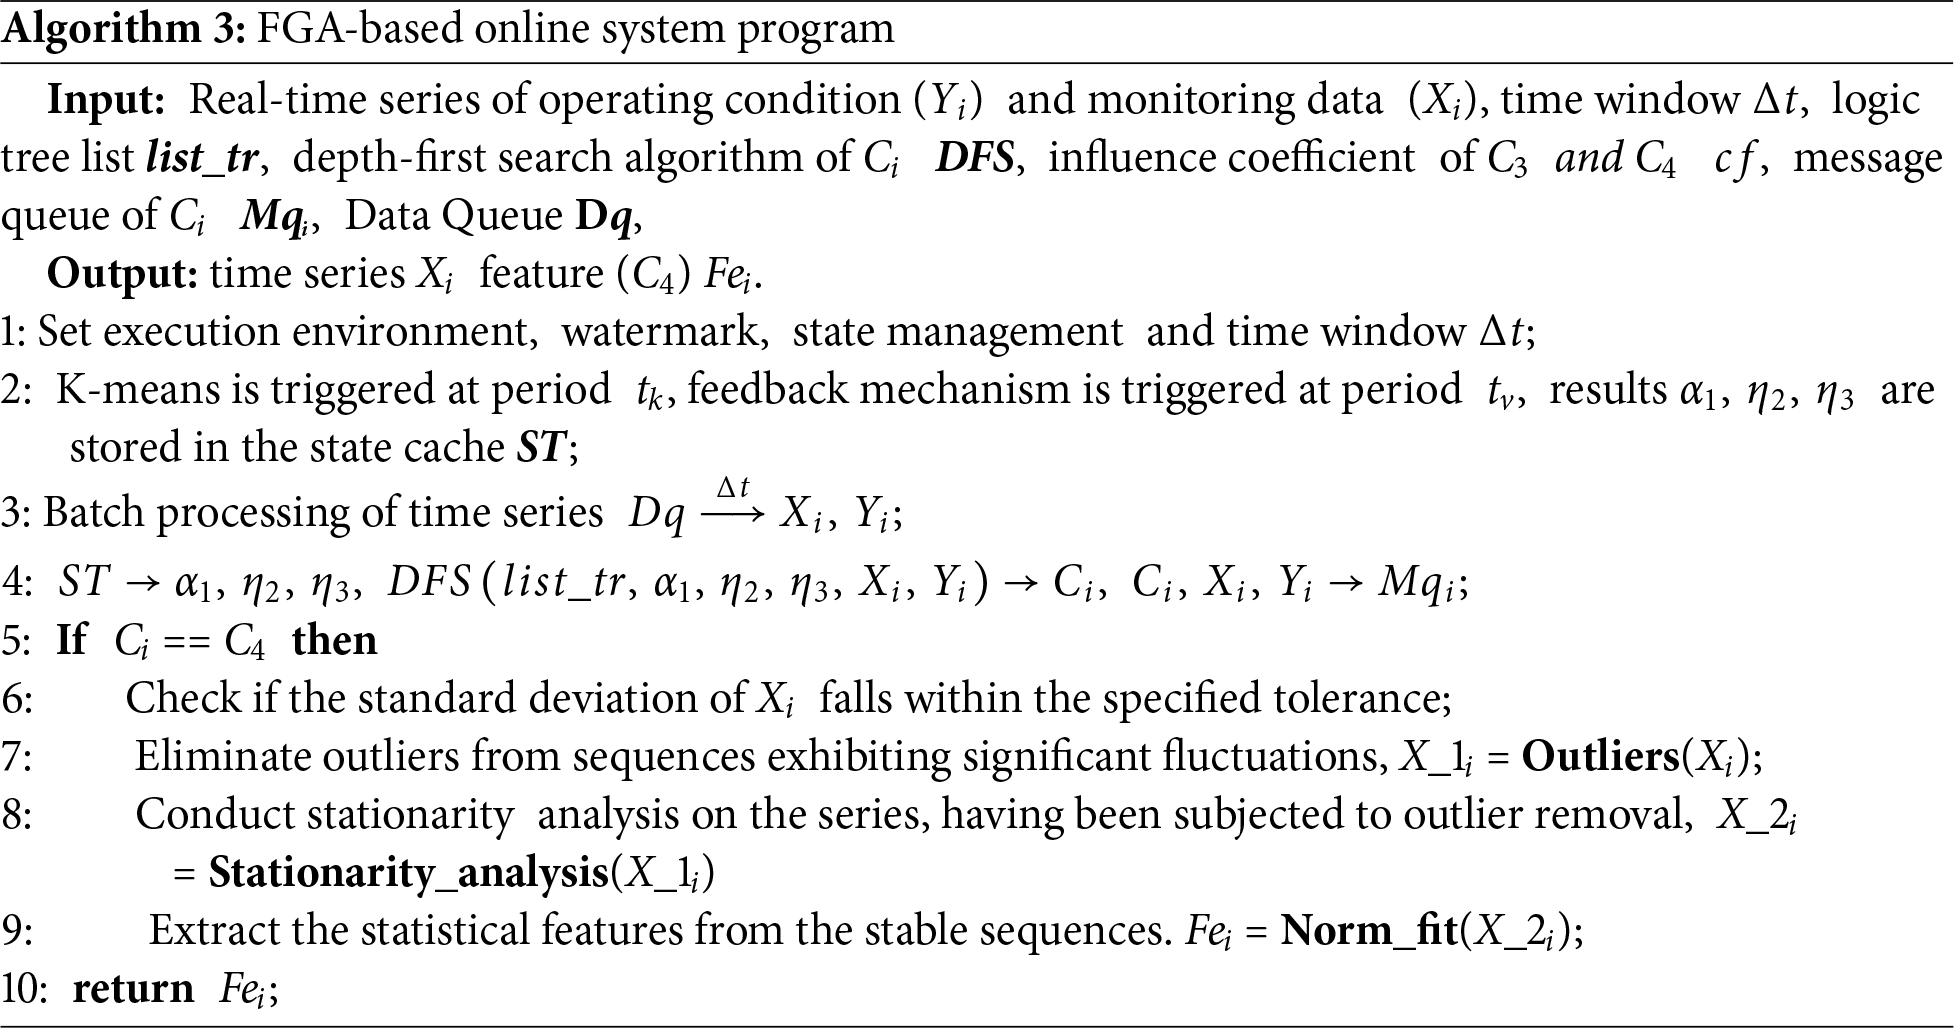
Streaming big data technology is employed to process tasks with high real-time requirements. In addition, Algorithm 5 shows the trend analysis of anomalies in the long-term sequence.
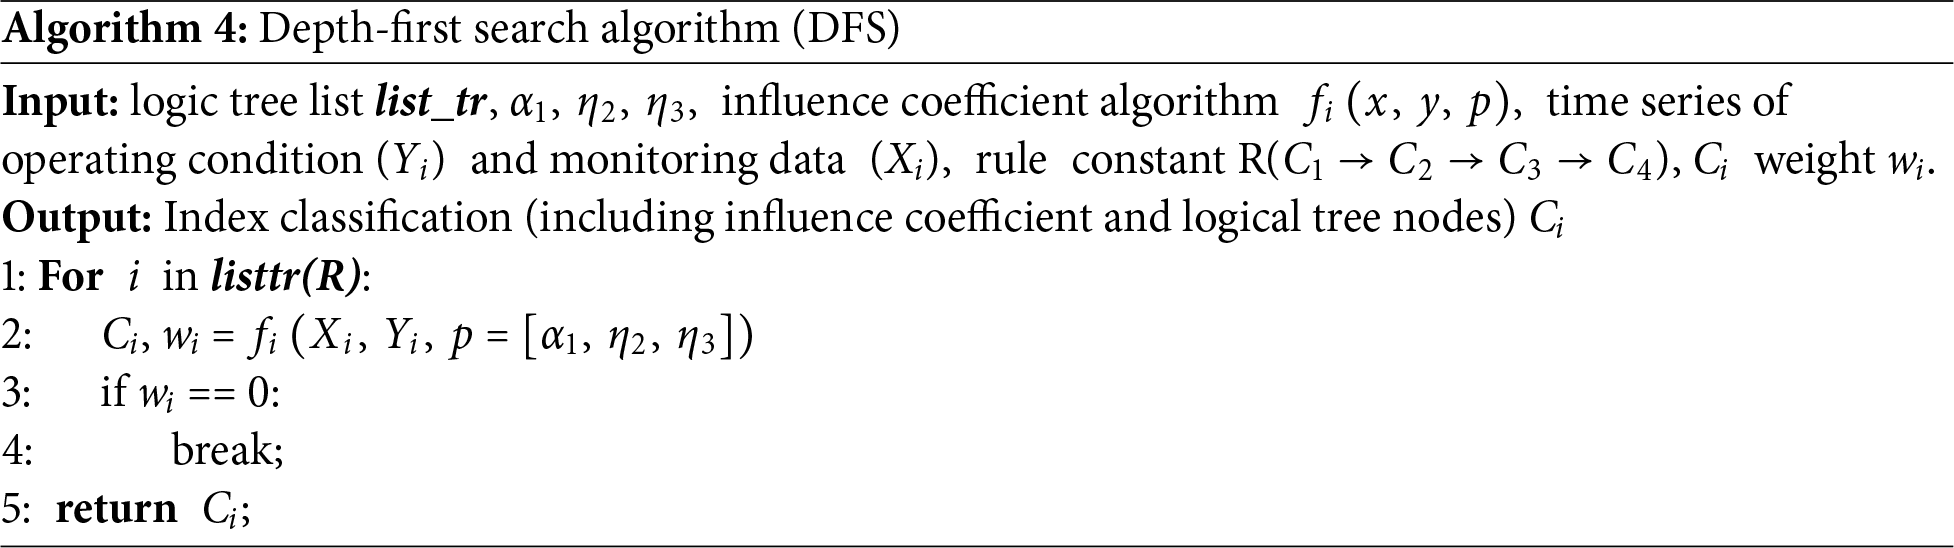
To improve the model’s adaptability, a logic tree needs to be constructed and processed using a depth-first search algorithm, as shown in Fig. 10. Logical trees provide systematic frameworks for quantifying event causality in industrial systems.
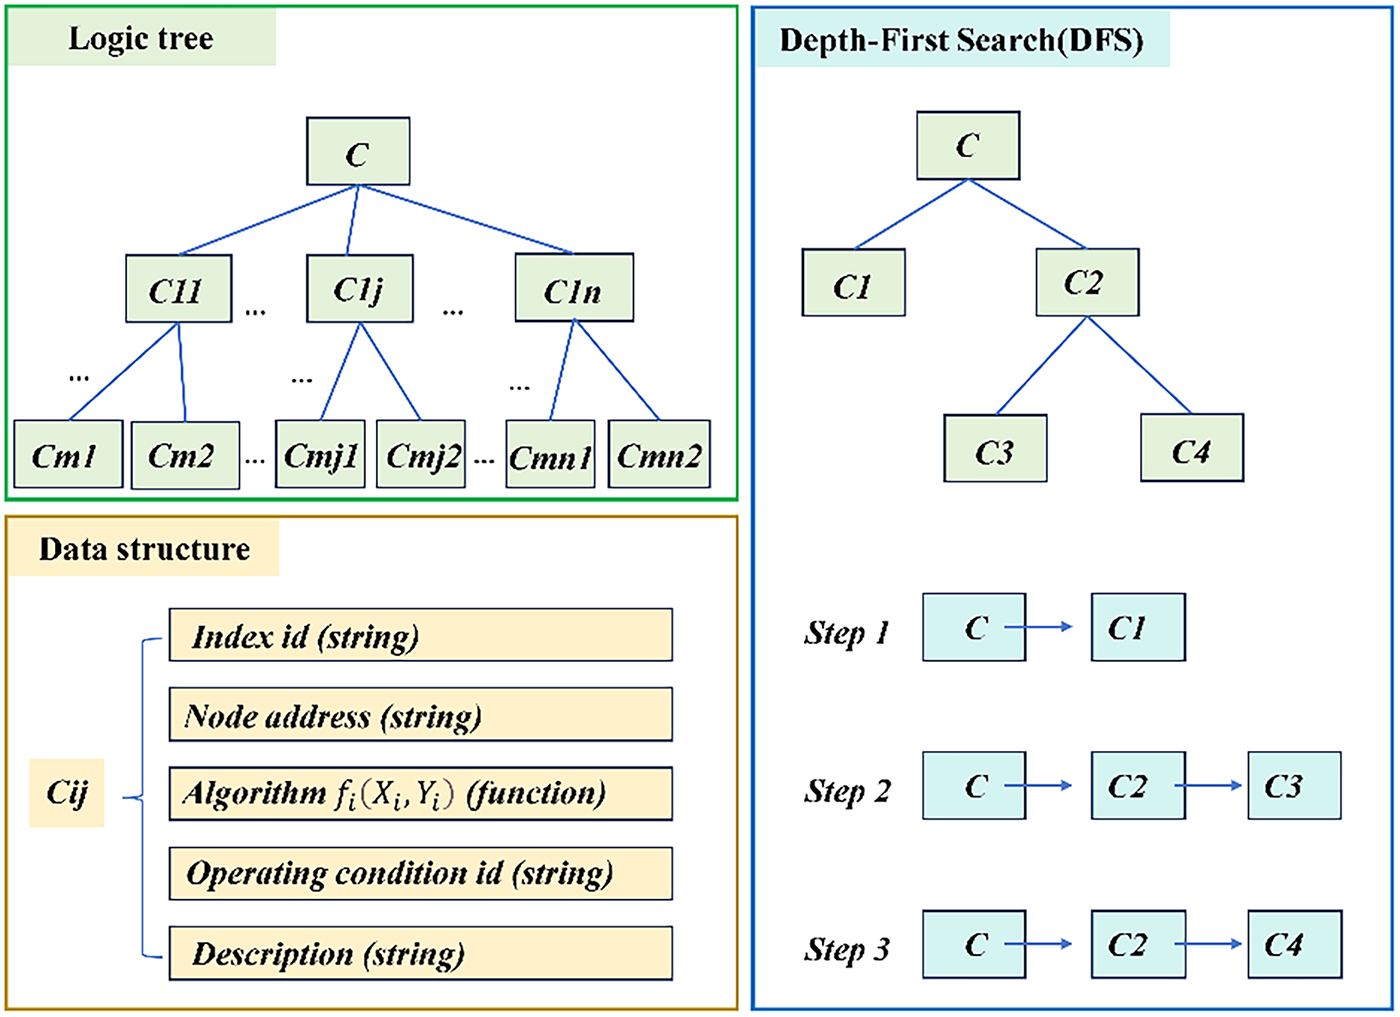
Figure 10: FGA index encapsulated data management framework of ID. Note: Data features that cannot be expressed by C1–C4 can be realized by expanding Ci.
The chapter first analyzes mainstream data processing methods in the field of industrial big data feature engineering, then applies FGA to analyze industrial monitoring data, and finally compares the experimental results.
5.1 Feature Data Generation Methods
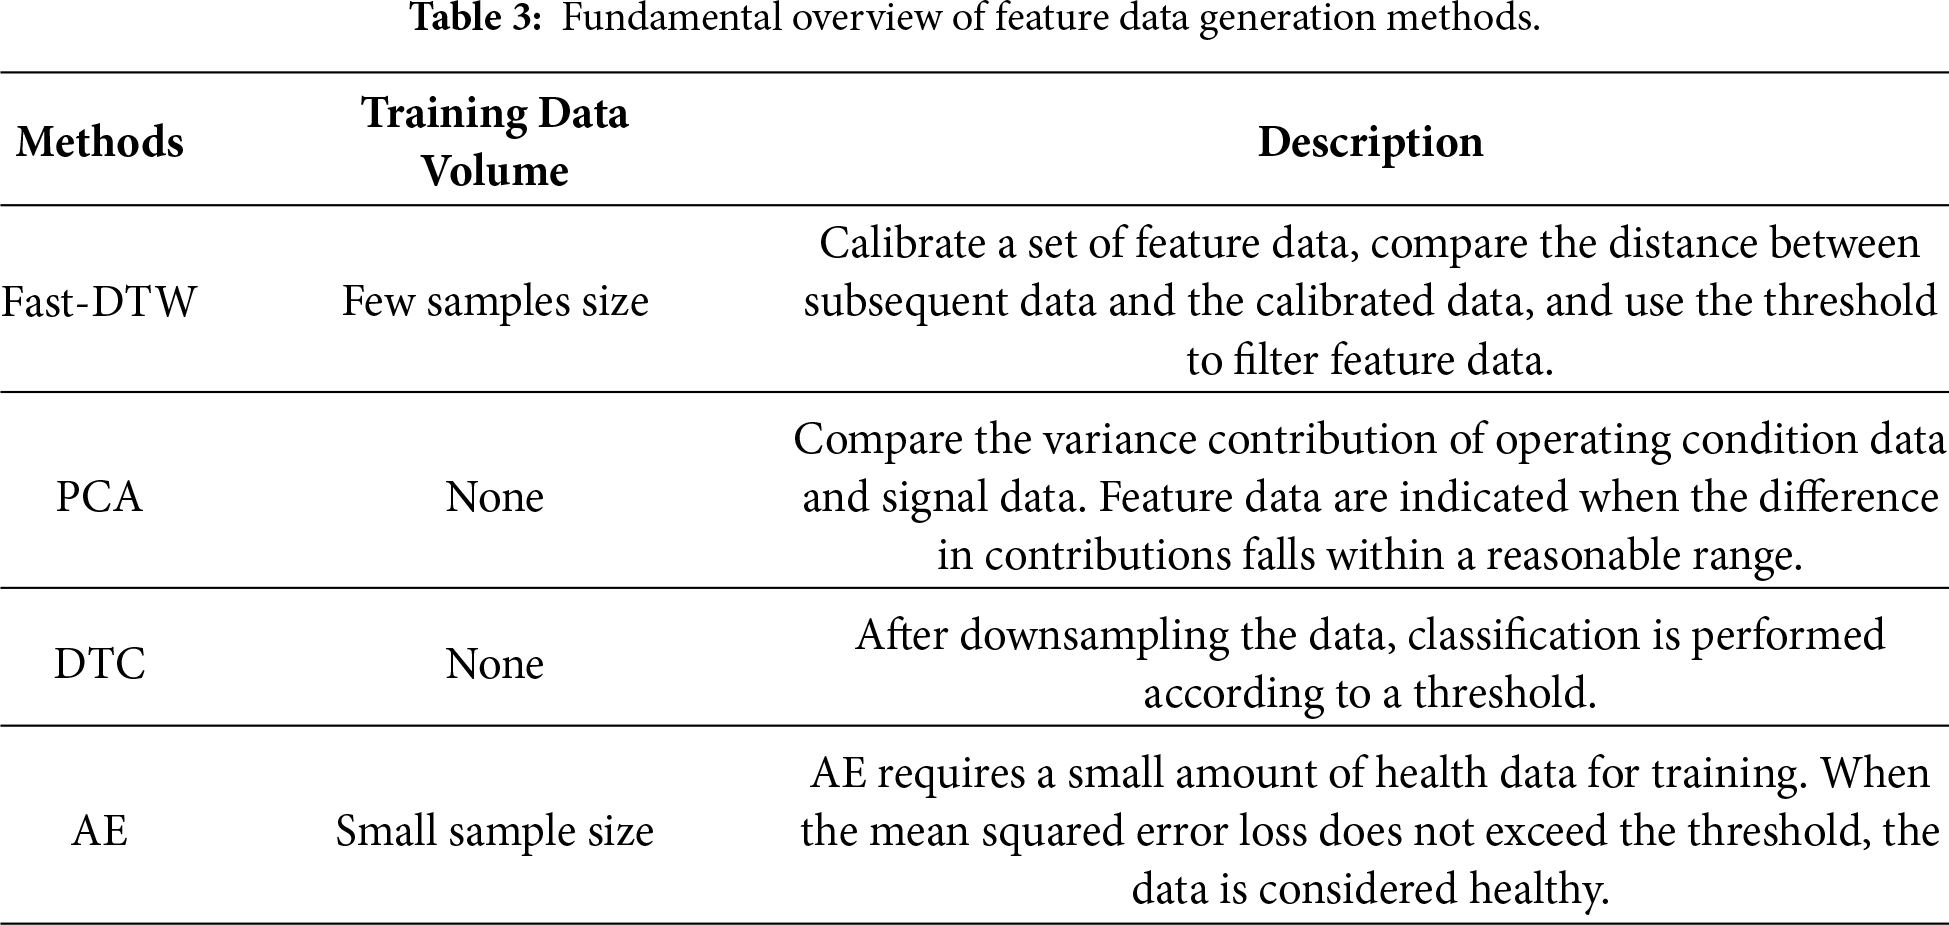
Industrial feature (health) data generation methods cannot rely on large volumes of health samples. The algorithms must respond quickly and have low requirements for data quality. To meet the industrial requirements, the fast dynamic time warping (Fast-DTW), principal Component Analysis (PCA), down-sampling threshold classification (DTC), and auto-encoder (AE) methods can achieve functionality similar to the FGA. Table 3 analyzes the main characteristics of several methods.
5.2 Main Computational Process of the FGA
Compared with the aforementioned methods, the GA-based FGA architecture is more complex and offers greater flexibility in handling time windows. ID requires a detailed introduction, and its parameter selection needs a thorough explanation. Fig. 11 further demonstrates the effectiveness of the temporal decoupling efficacy of the decomposition process, where operational variability (e.g., active power fluctuations) is statistically decoupled from health-related features in the extracted subsequences.
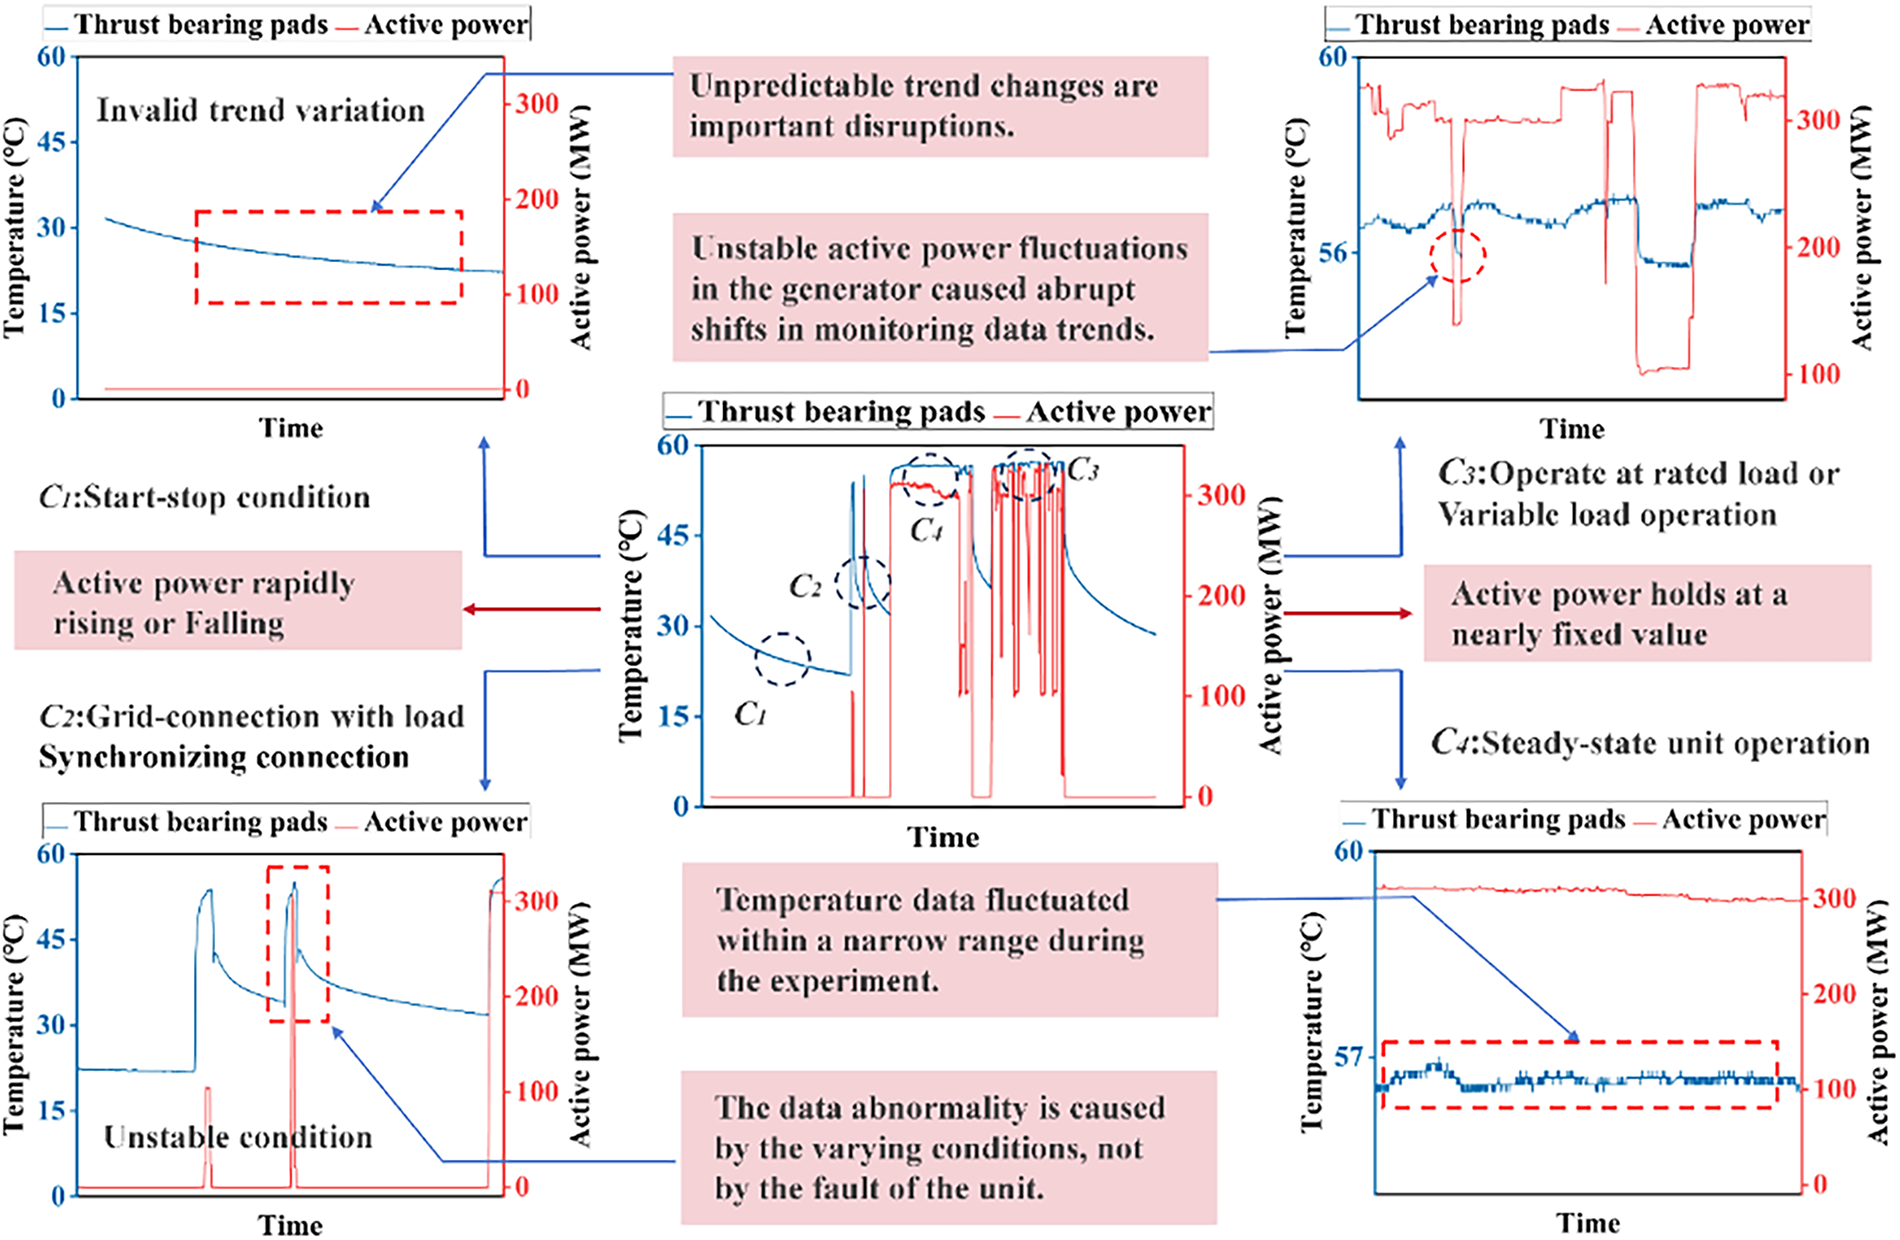
Figure 11: ID-based data decomposition flowchart. Note: The illustration of segmentation of operational data into C1–C4 indices for feature data extraction.
C1 is equivalent to a step function; The key lies in determining the parameter
Experimental research has found a significant correlation between active power and signals in Fig. 12.
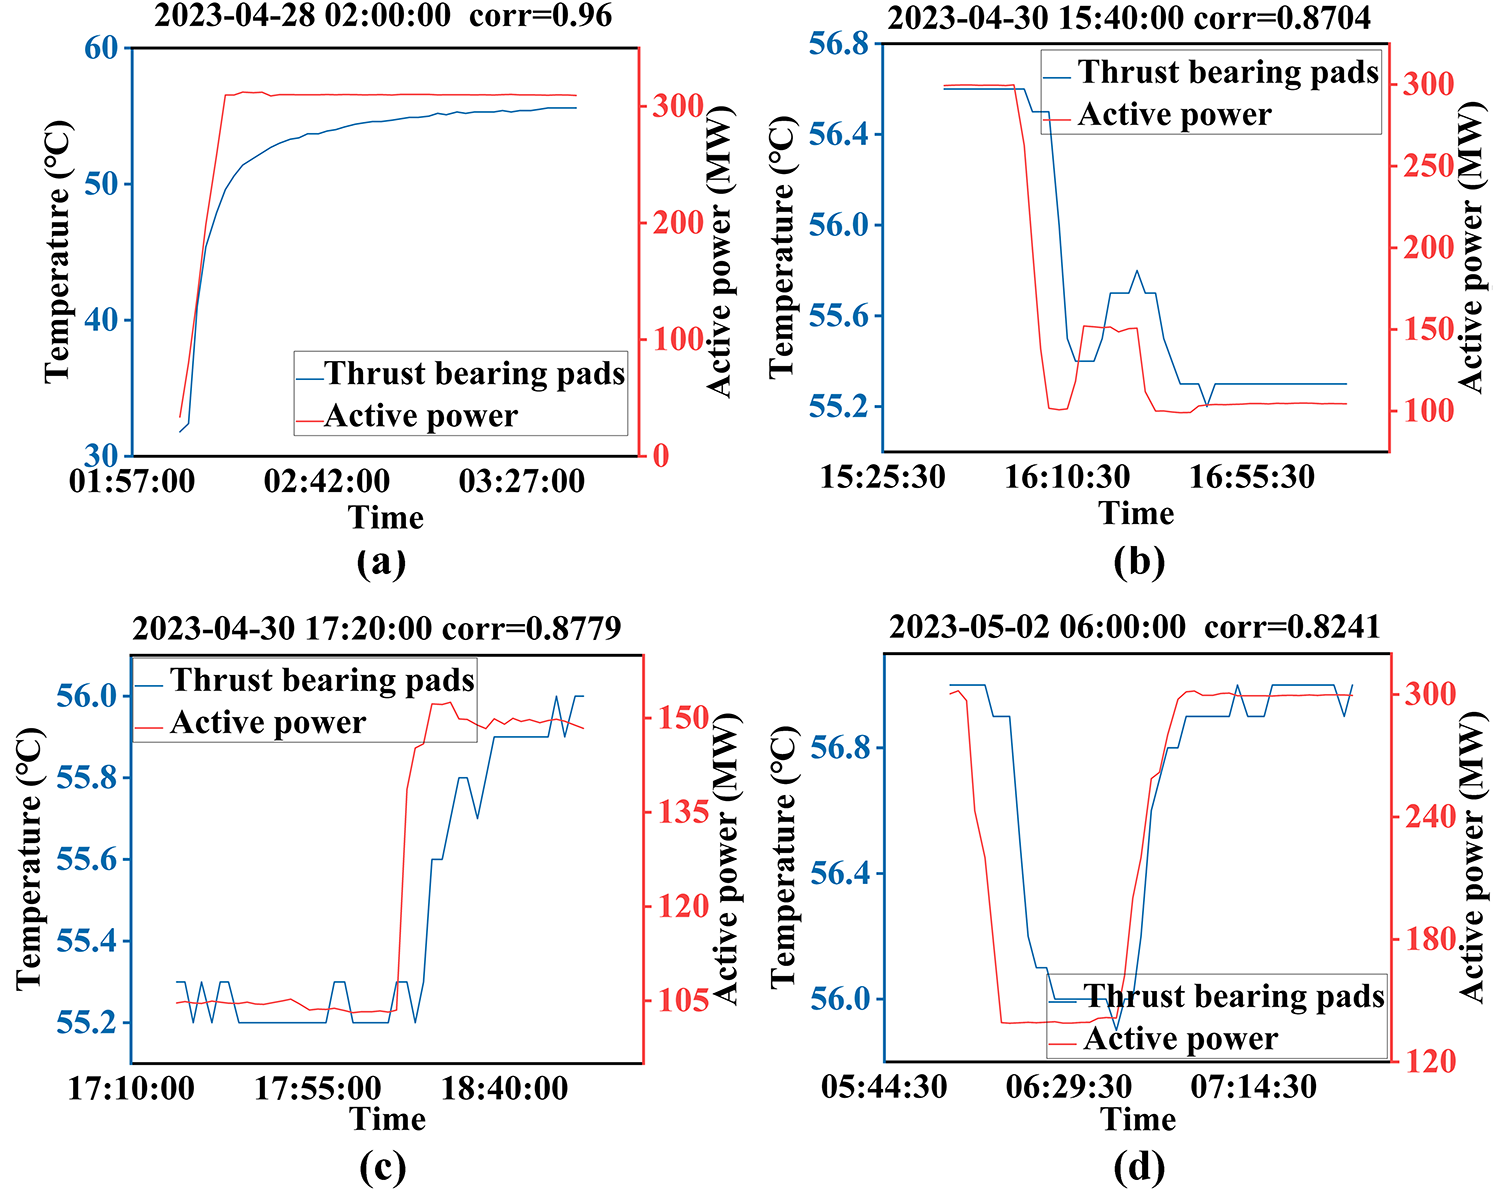
Figure 12: The disturbing influence of the active power on the C2 index: (a) Correlation between the thrust bearing temperature data and the active power data during the start-stop condition, (b) Descending trend of the thrust bearing temperature data with decreasing the active power, (c) Ascending trend of the thrust bearing temperature data with rising the active power, (d) Correlation between the thrust bearing temperature data and the active power fluctuation.
As illustrated in the index decomposition flowchart under variable conditions by ID (see Fig. 3), the overall variation of the thrust bearing pad temperature data of the hydropower unit is not regular, and the abnormal trend analysis of this time series cannot be readily carried out. The goal of the experiment is to collect short-time series with C4 characteristics and to analyze the trend of the data after aggregation.
The ID divides the data into four diagnostic indices (C1–C4) through sequential condition decoupling. After multi-stage segmentation, this framework extracts C4-characterized subsequences for aggregated trend analysis. This approach performs operational stability extraction under variable conditions and improves trend identification through correlation-driven aggregation of C4-classified subsequences, effectively decoupling transient interference while preserving health degradation patterns in long-term monitoring data.
The data covers the time interval of 21 April 2023 15:58:13 to 08 May 2023 10:00:58, during which there are many start-up and shutdown processes, and when the unit is operating stably, the active power exhibits large fluctuations. In the stable region of active power,
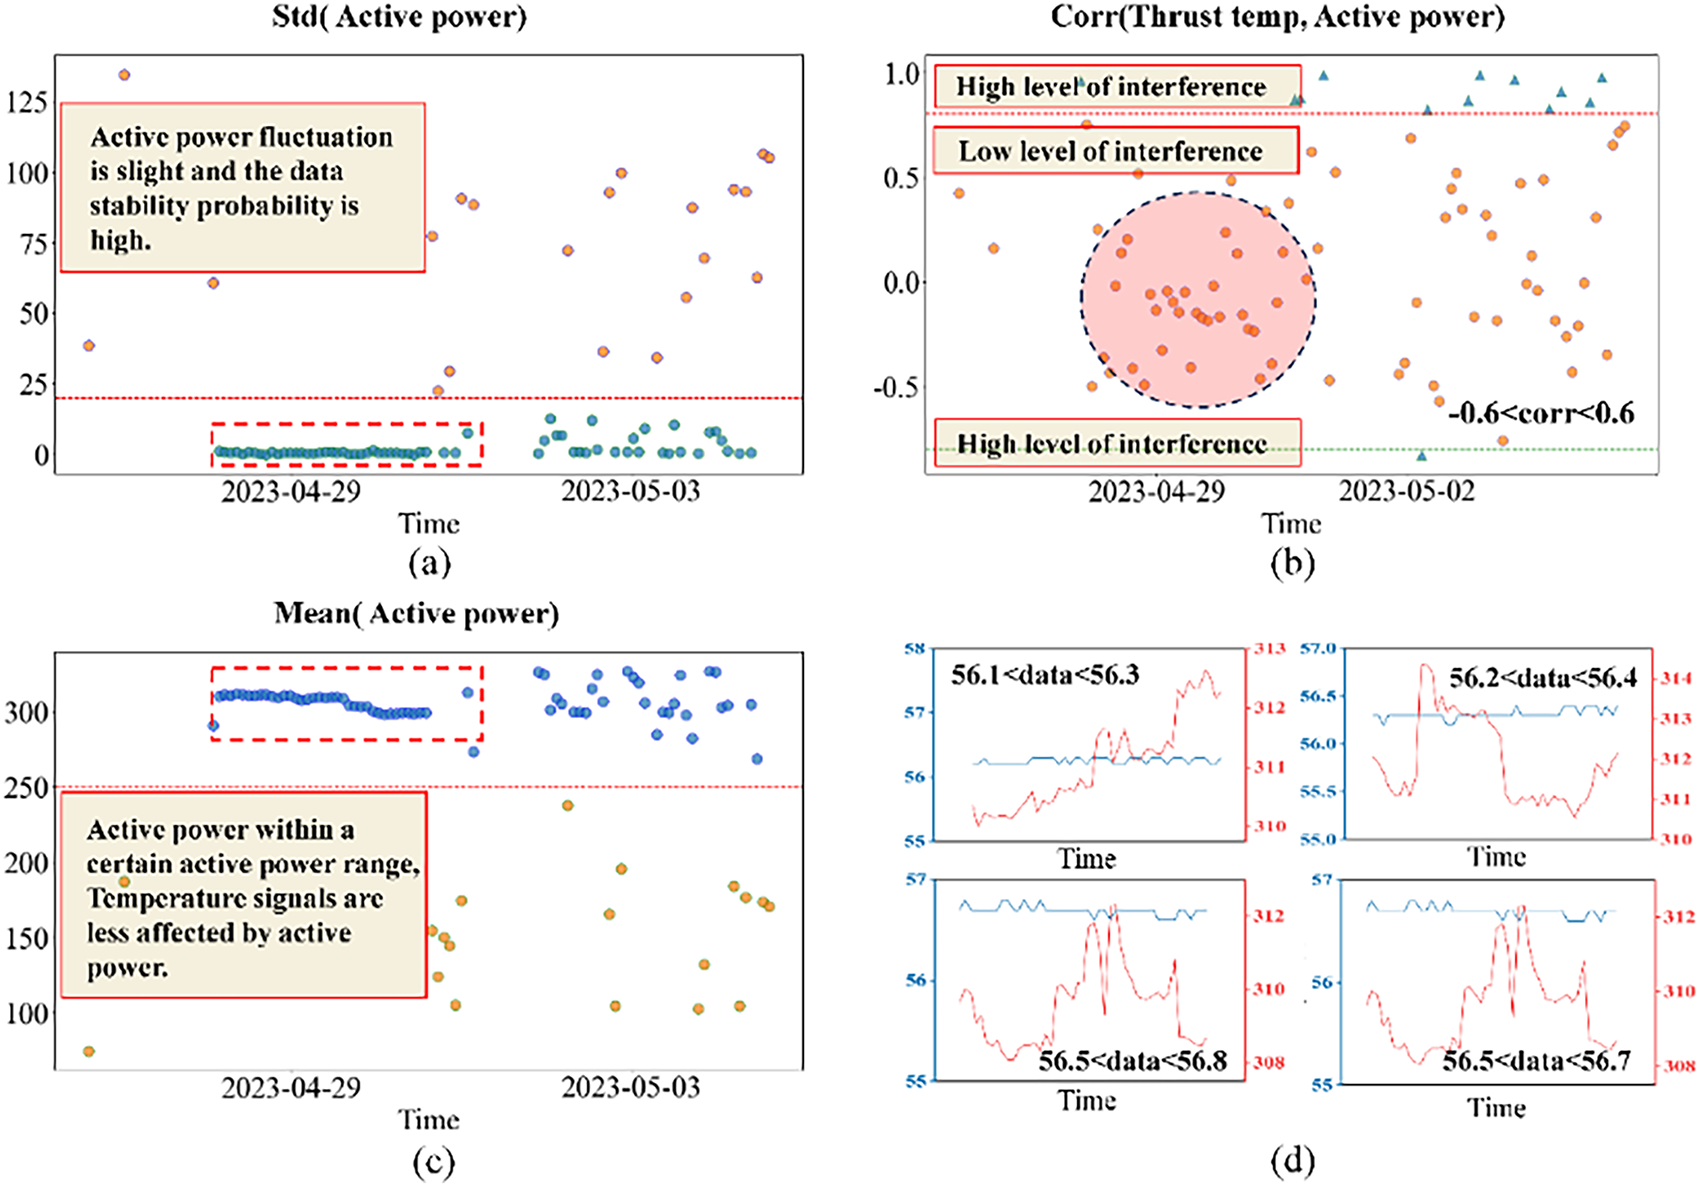
Figure 13: Effect of the active power on the thrust bearing pad temperature: (a) Small standard deviation of active power indicates stable operation of the unit, (b) Low correlation coefficient representation, indicating non-affection of the red area data by the operating condition, (c) Demonstrating the slight variation of the active power, (d) Unaffecting the data of stable operation of the unit by the active power.
The comparative data analysis reveals that pronounced active power fluctuations significantly affect the temperature variations of the thrust bearing pad, where these subtle deviations due to conditions compromise the accuracy of abnormal trend detection.
Table 4 identifies C2 (|r| >= 0.8), demonstrating a direct relationship between active power instability and temperature fluctuations of the reinforced thrust bearing pad. This analytical evidence proves that such thrust bearing temperature deviations are essentially caused by operational instability rather than equipment degradation, which requires systematic filtering of this condition-dominated dataset during aggregated trend analysis. This table also confirms the importance of operational decoupling in isolating intrinsic health degradation patterns from variations caused by transient conditions.
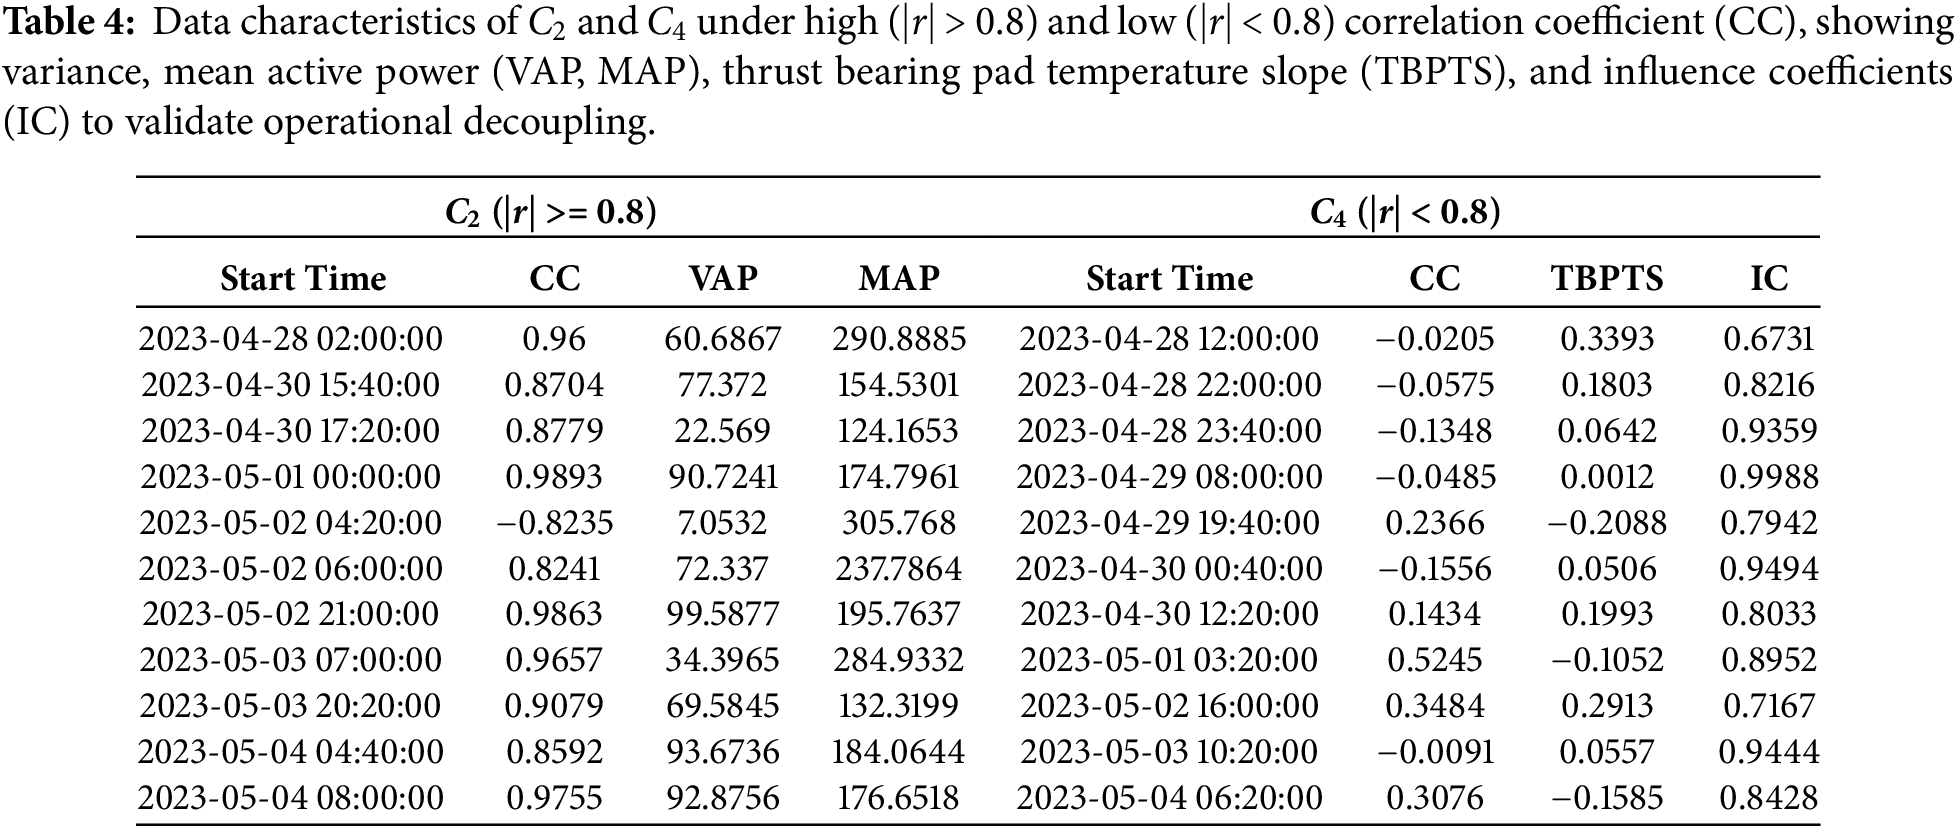
Fig. 14 demonstrates the critical limitation in distinguishing C3 and C4 indices under these weakly correlated conditions, revealing the incomplete condition decoupling through hierarchical indexing. A subset of C2 is classified as C3 and C4 because C2 > 0.2.
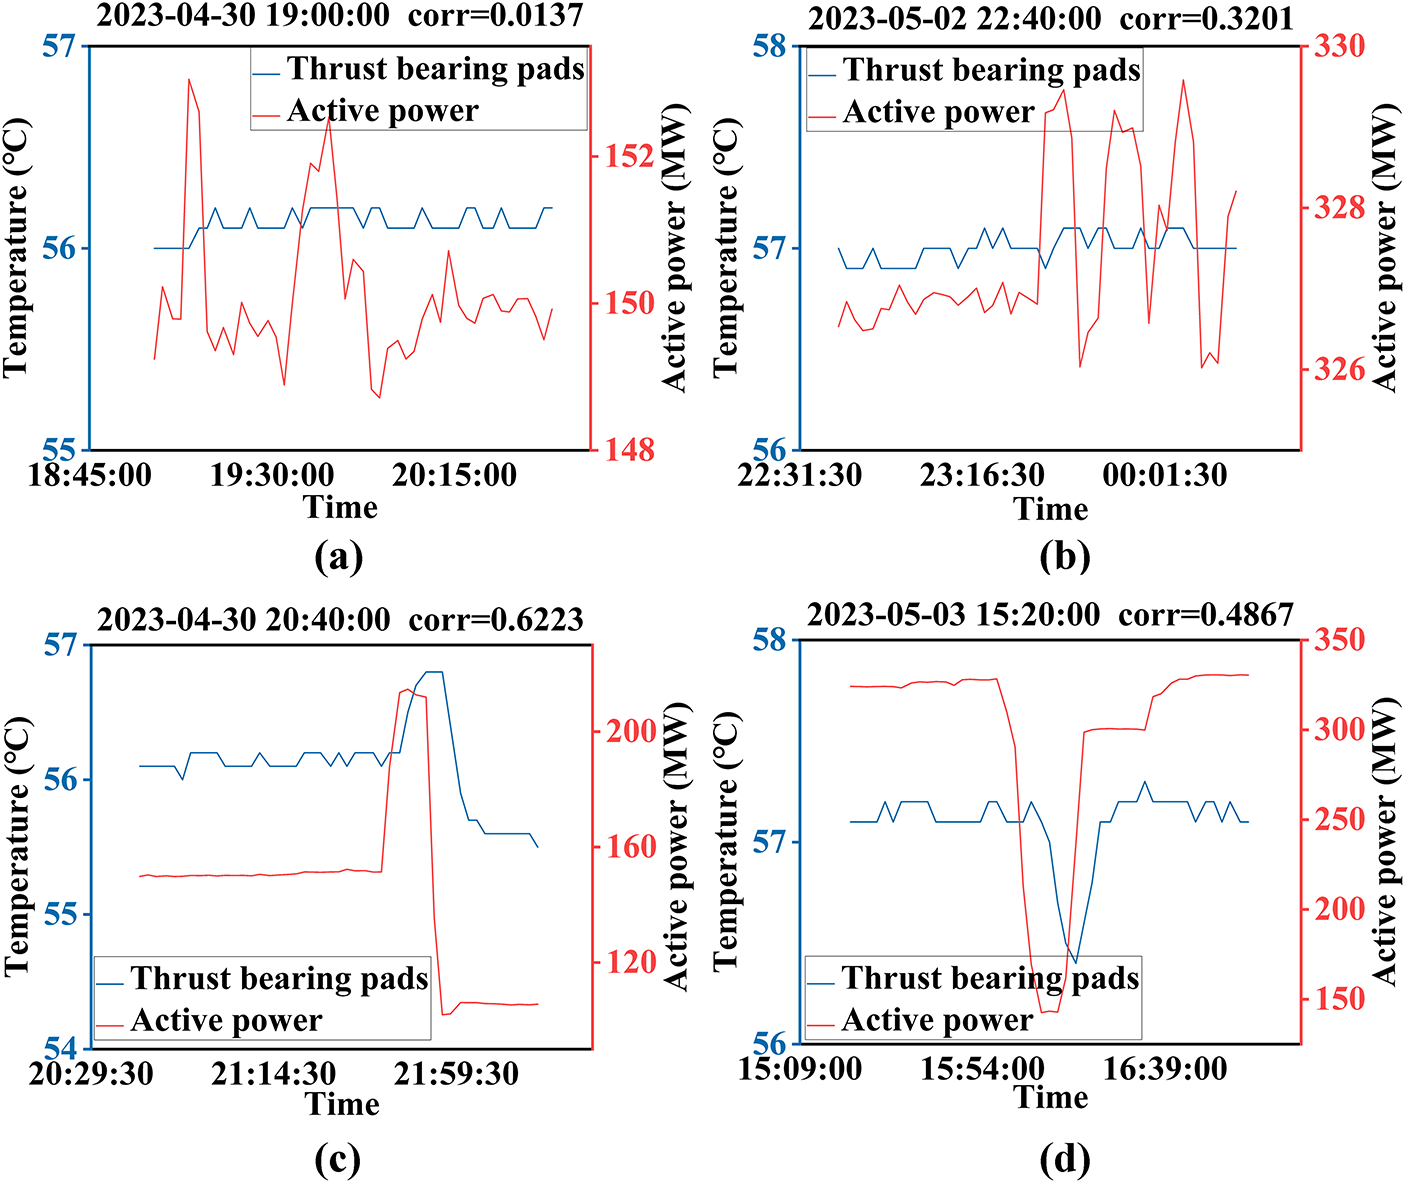
Figure 14: Identifying and displaying the C2, C3, and C4 indices: (a) The influence degree of active power and data is low, which meets the C4 property, (b) The data has a weak upward trend, which can be defined as C4 under the loose threshold range and C3 under the strict threshold range, (c) The active power has a significant impact on data variation, which can be defined as C2, (d) There is a clear change in the data, which can be defined as C3. Note: The division of data into C3 and C4 under stable operation should be performed based on the actual data situation.
Table 4 presents the characteristics of thrust bearing pad temperature data, where near-zero slopes (e.g., 0.0012 at 29 April 2023 08:00:00) and high influence coefficients (e.g., 0.9988) indicate minimal operational interference, confirming the effectiveness of the C4 aggregation scheme in isolating health-related trends.
Comparing the DTC with the GA method, the results predicted by the GA method are closer to the results of manual data extraction, whether it is the integrity of features or the accuracy of local features in Fig. 15.
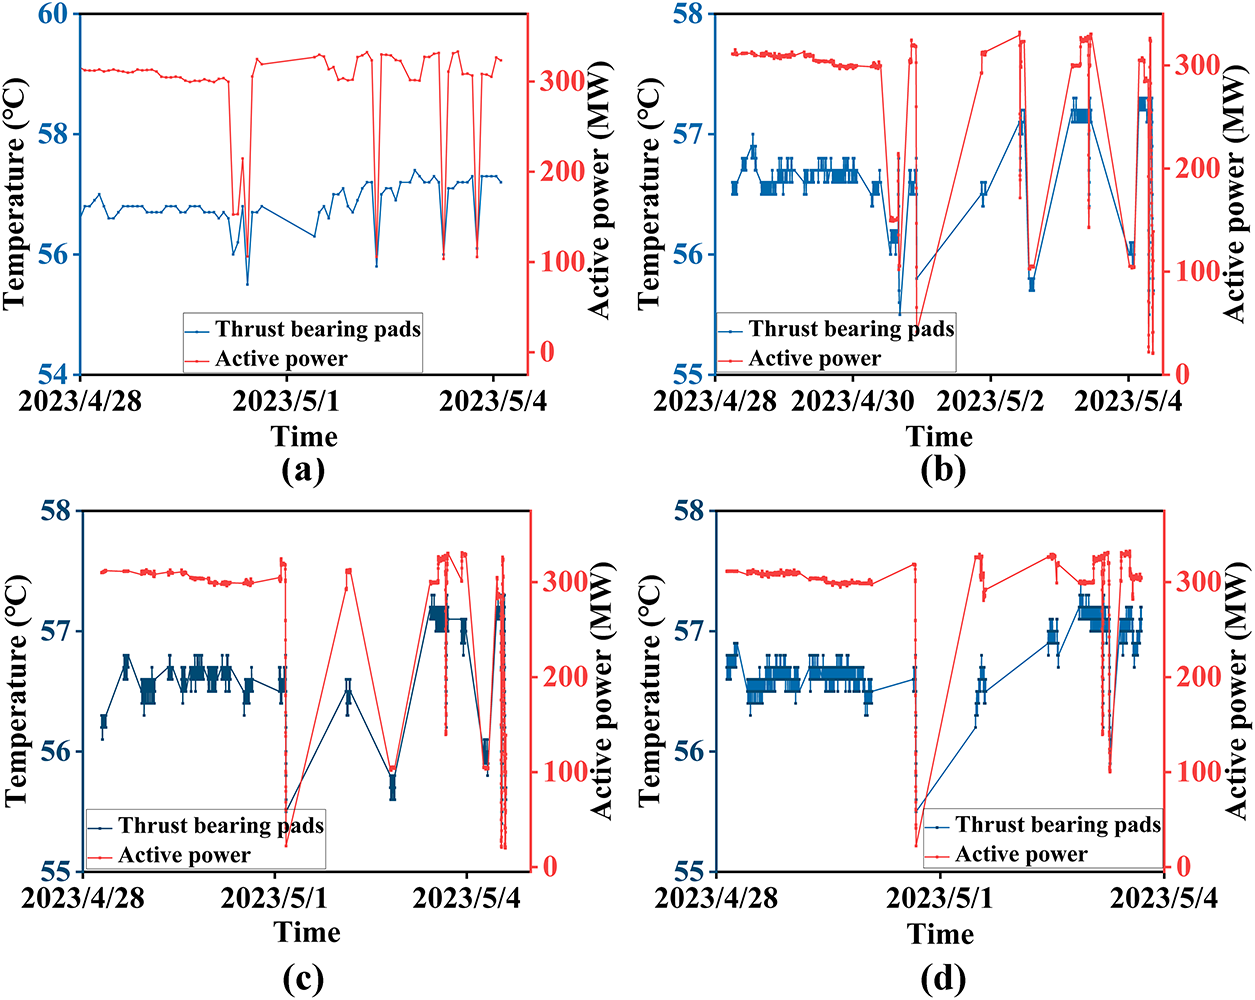
Figure 15: Comparison of data extraction effects between DTC and GA methods in long-time series. (DTC does not completely filter out the data affected by varying conditions and enhance local data features). (a) Data extracted by DTC of 100 min sampling period, (b) Data extracted by the GA-based method of 100 min time window with
Compared with temperature data, vibration data is more sensitive to active power. As illustrated in Fig. 16, the results of the FGA processing have less interference data. It demonstrates that the GA method can avoid the interference of short-time series and achieve the trend analysis of long-term series.
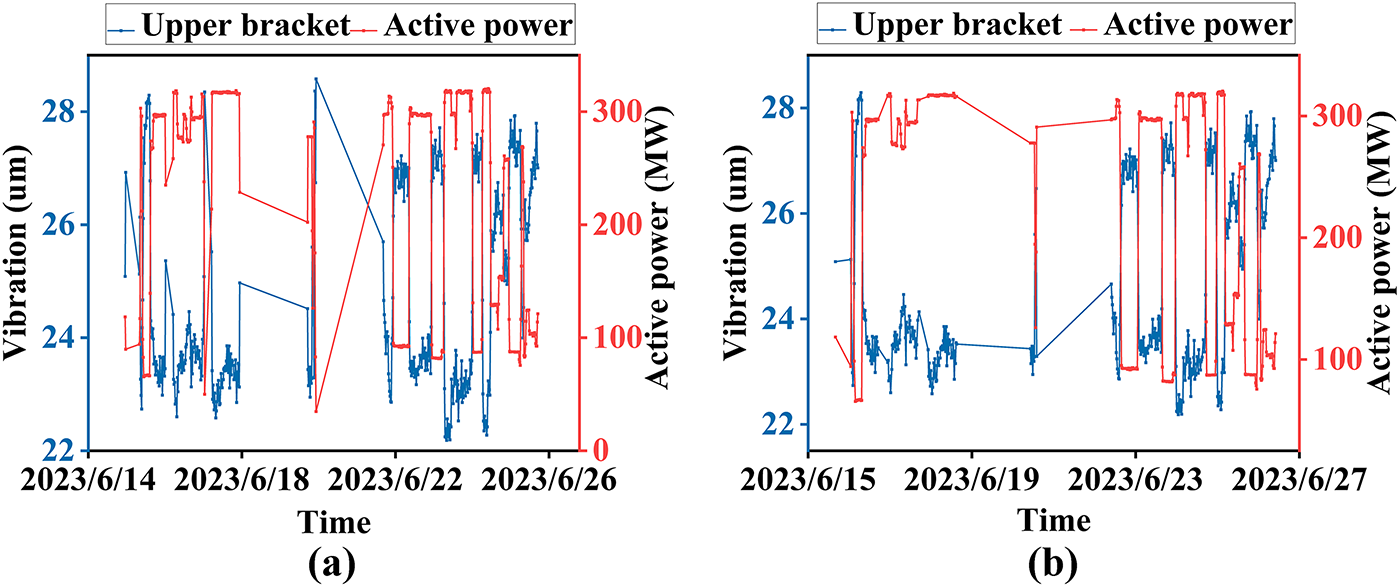
Figure 16: Data extraction of both the DTC and the GA-based FGA: (a) 20-min sampling period in DTC, (b) 20-min time window with
In order to enhance the generalization performance of the FGA, it is necessary to have a clear time window and a K-Means threshold of C3 and C4 indices. The decisive factors are presented in Fig. 17.
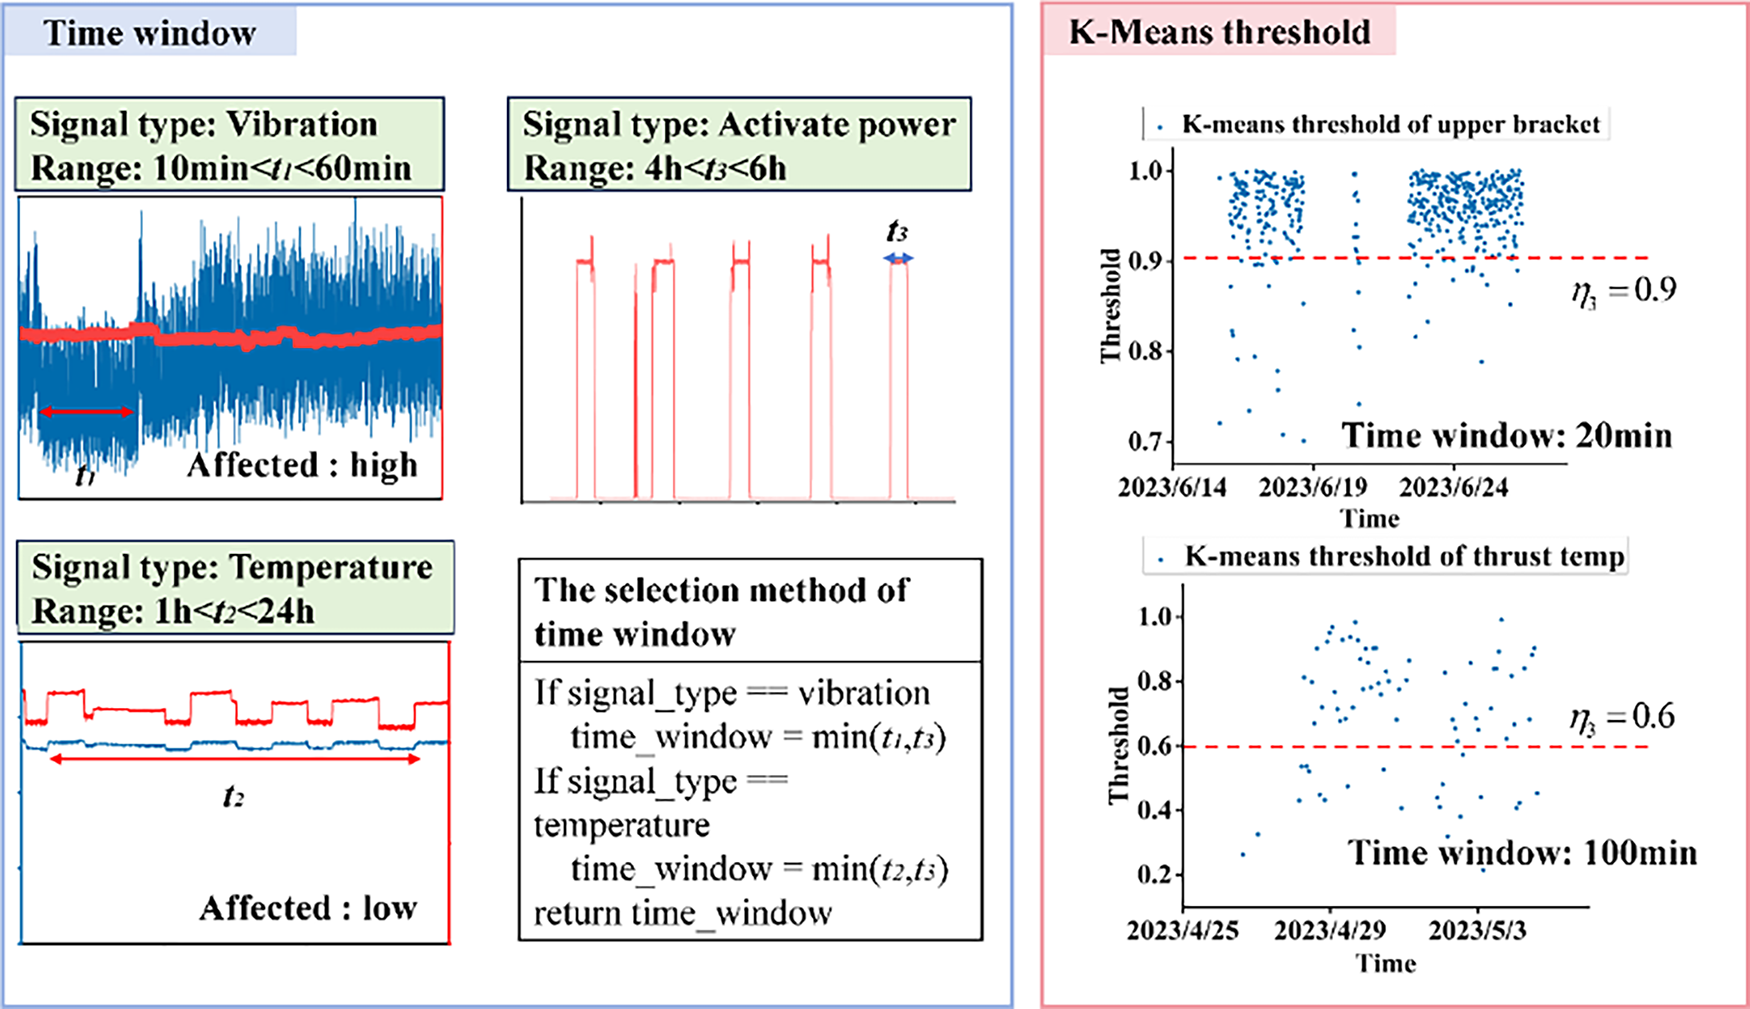
Figure 17: Engineering calculation method of time windows and thresholds. Note: The time window and K-Means threshold should be determined according to the rules of unit operation and the characteristics of the data.
To evaluate the effectiveness of anomalous trend detection in long-term time series, the experiment is divided into two parts: feature data generation and anomalous trend detection. In the first stage, the algorithm needs to generate a dataset with distinctive features (The temperature signal is less affected, and the vibration signal is more affected by the varying condition). In the second stage, the same validation algorithm (MK test and Sen’s slope estimator) is applied to evaluate the accuracy, recall rate, and F1 score of anomalous trend detection. To evaluate the performance of various methods, the comprehensive metrics and evaluation criteria are as follows:
• Standard deviation (SD) can detect the volatility of long-time series.
• Linear fit Slope (LFS) can test the long-time series stability.
• Spearman’s rank correlation (SRC) can quantify the influence of active power on the long-time series.
• Accuracy (A) is defined as the ratio of correctly classified instances (normal and anomalous trends of long time series) to the total number of instances evaluated.
• Recall (R) is used as a metric to evaluate the rate of missed detections in a method.
The experimental data utilizes pad temperature (PT) and bracket vibration peak-to-peak (BVPP) values. Take 100 PT datasets and 100 BVPP datasets, and use algorithms Fast-DTW, PCA, DTC, AE, and FGA to generate feature data. The results for one of these datasets are given in Table 5.
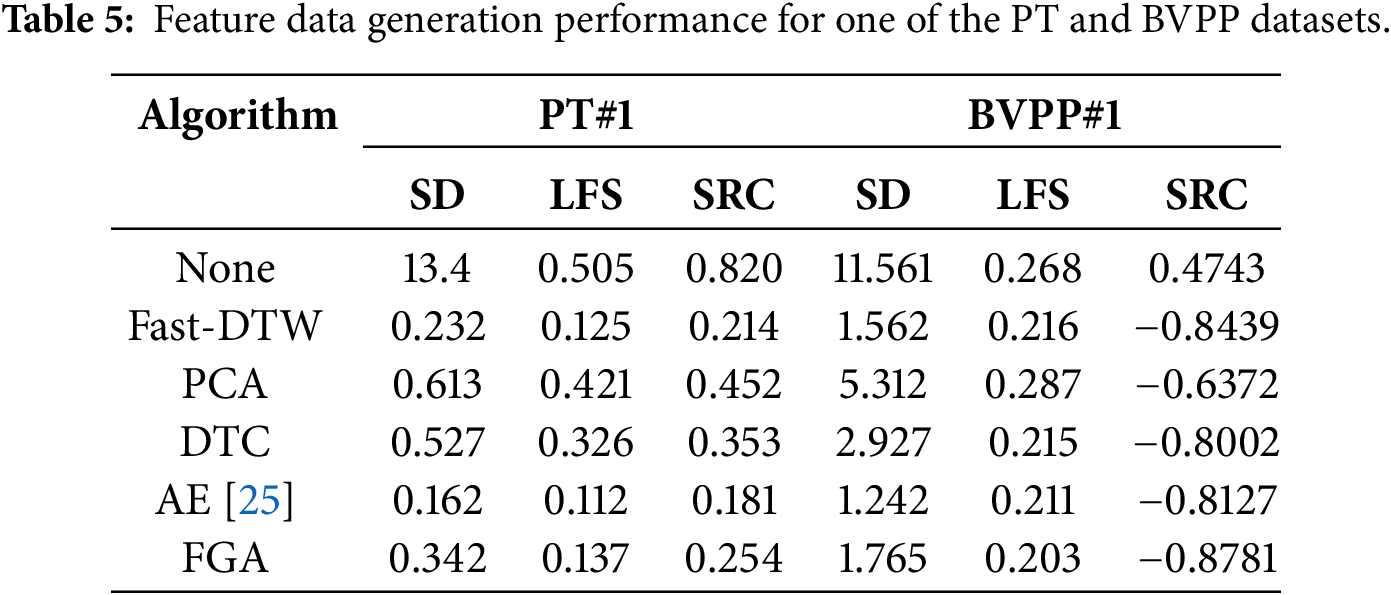
The temperature signal is generally insensitive to the operating condition data. In order to retain data that is insensitive to varying conditions, lower values of SD, LFS, and SRC indicate better performance. The vibration signal is sensitive to the operating condition data. The closer the absolute value of SRC is to 1, the more persuasive it is. It seems that the AE and Fast-DTW demonstrate superior performance compared to the FGA. Both test datasets contain 20% anomalous trend data, and the test results are shown in Table 6.
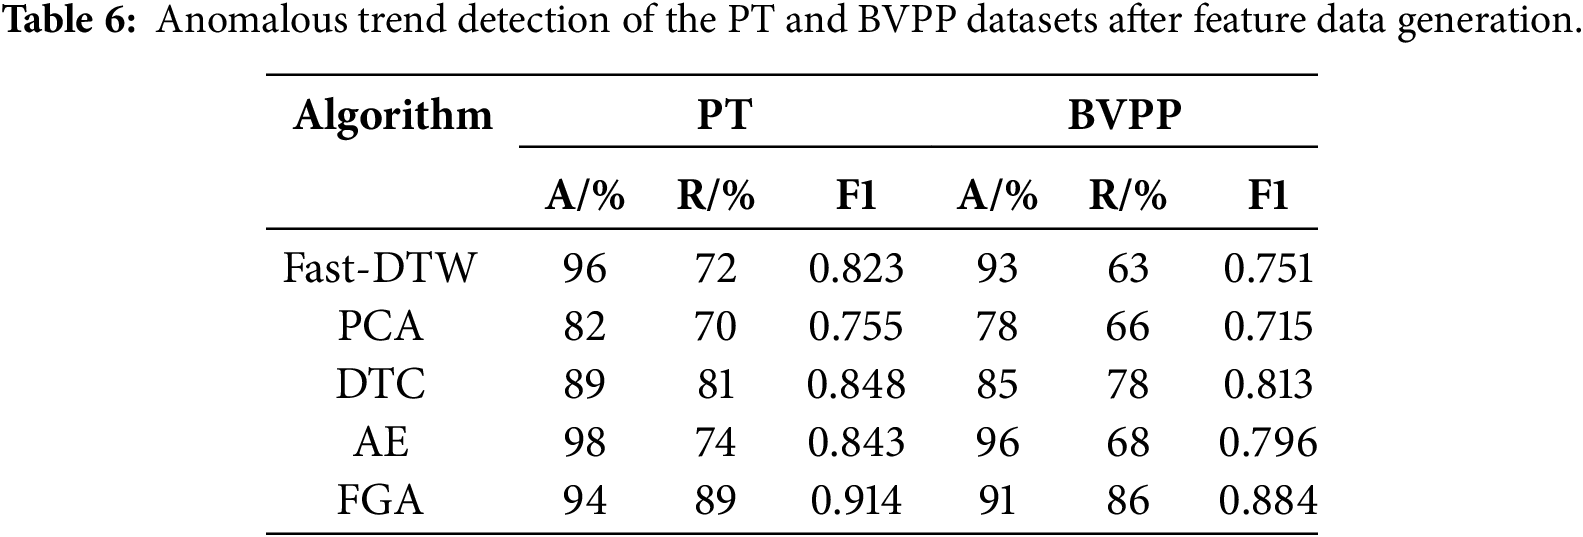
The experimental data above demonstrate that FGA can improve data stability (specific metrics require validation with actual industrial data) and enhance data features (SRC). The comprehensive metric (F1 score) for anomalous trend detection exceeds 85%. Although FGA exhibits strong overall metrics, its insufficient precision requires improvement.
5.4 Robustness and Generalization Capability Validation
Threshold systems are prone to underfitting. In comparative experiments, some experimental results of accuracy were slightly lower than those of Fast-DTW and AE. Overall performance of the aggregated time series is affected by C4. The selection of
To evaluate the system’s robustness and generalization capability, the following metrics are adopted:
• Feedback mechanism adaptability (FMA): K-Means outputs parameter
• Accuracy (A): C4 anomaly detection.
The experiment must ensure a consistent sample size for C4 with no abnormal samples. Setting
If
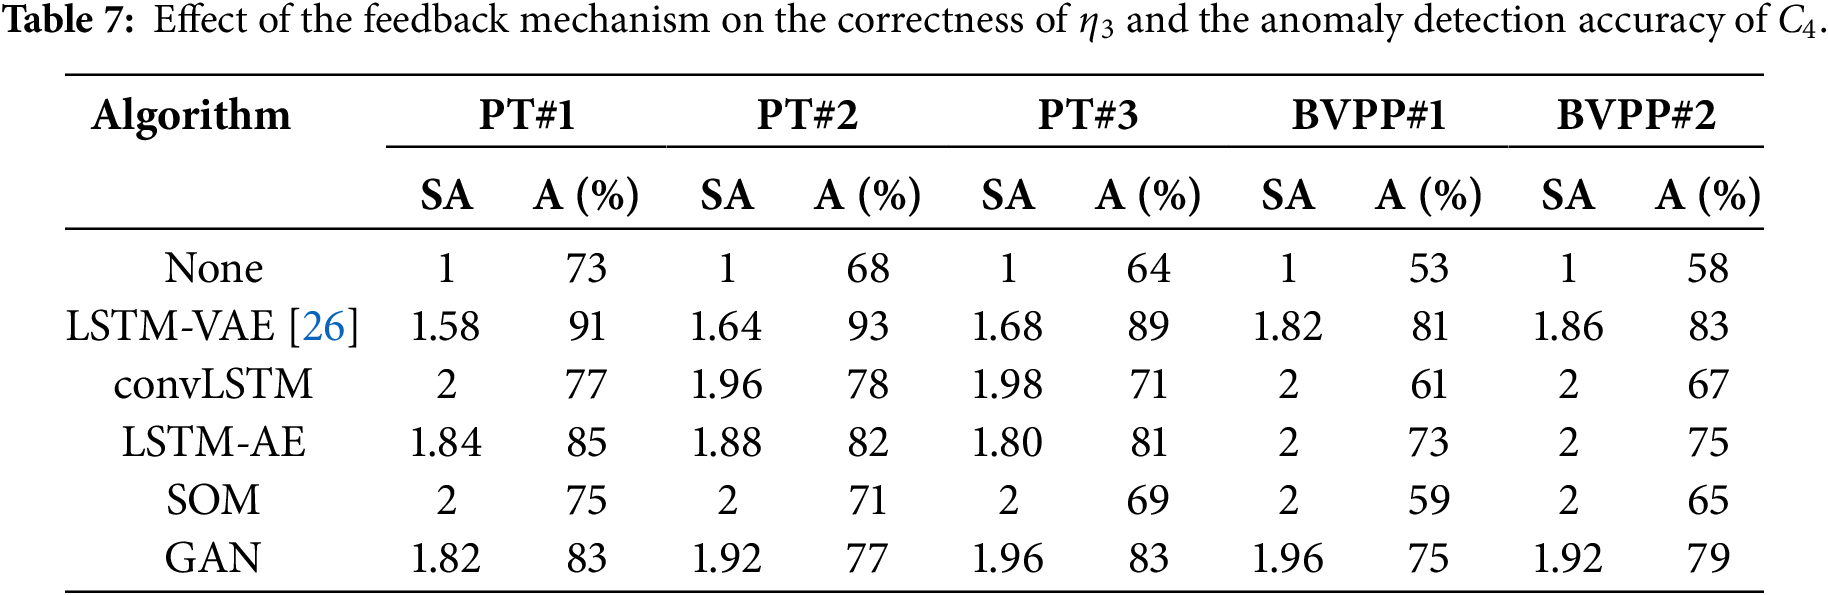
To visually demonstrate the system’s performance, ablation experiments were conducted on the FGA system. The operational cycle of k-means is tk and the triggering cycle of the feedback mechanism is tv. Let us define
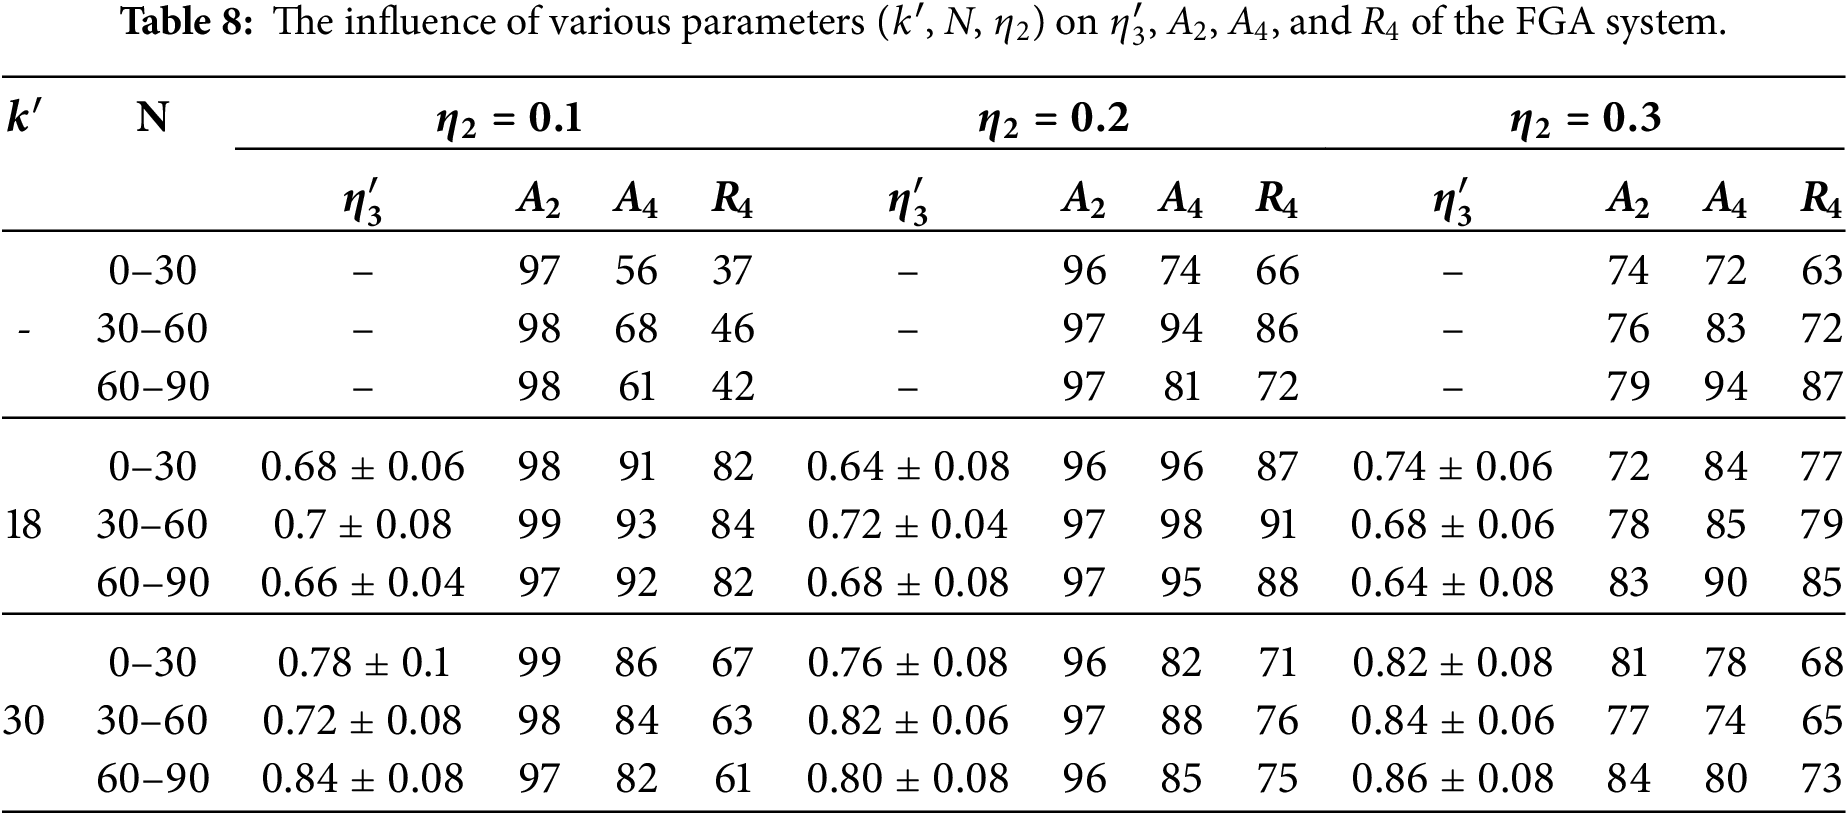
If
5.5 Data Prediction Performance
Increasing the performance of machine learning in hydropower unit monitoring requires prioritizing data quality over algorithmic innovation for high-dimensional time-series analysis. In industrial applications, a substantial amount of training data is required to ensure the accuracy of predictive models. The fundamental reason for requiring extensive training data is the strong randomness and unpredictability inherent in industrial data. The goal of this experiment is to determine whether reducing data complexity can improve model accuracy.
Two sets of industrial data with identical dimensions and time spans: one is raw data, and the other is C4 data. 75% of the data is used as the training set, and 25% is used as the test set. Compared to raw data, the C4 dataset is more stable, which can reduce the complexity of predictive models and thereby improve prediction accuracy with limited datasets in Table 9. The primary metrics are RMSE, MAE, MAPE, and R2.
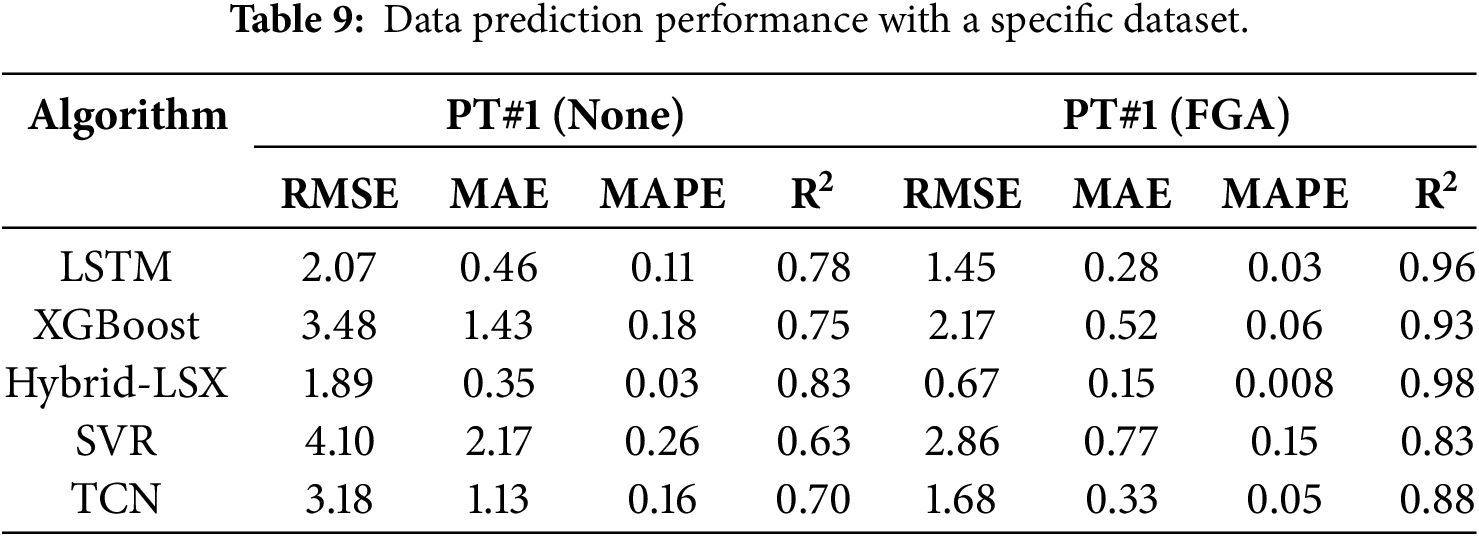
The fit goodness of the model using the FGA is significantly better than that without FGA. Experimental results indicate that the model’s goodness of fit improved by an average of 23%. Without substantial industrial data for support, data prediction models struggle to handle complex operating condition data.
The FGA enables online feature data generation in industrial scenarios characterized by small samples, multiple operating conditions, and high noise levels through hybrid operator scheduling and feedback mechanism. Experimental results demonstrate its ability to significantly enhance data stability and improve data features (The temperature signal is less affected, and the vibration signal is more affected by the varying condition).
FGA integrates linear hybrid (index decomposition) and hierarchical hybrid (aggregation) strategies, overcoming the limitations of single algorithms in handling multi-scale data. Meanwhile, the lightweight feature generator replaces raw data with C4, enhancing the accuracy of predictive models under limited training sets. Finally, the feedback-based threshold calibration integrates an LSTM-VAE passive adjustment mechanism, improving the C3/C4 classification rate by 20%–30%. This article only investigates four common types of operating conditions, which may present limitations in certain industrial contexts. Additionally, the size of the time windows requires optimization based on domain knowledge.
Application of the FGA to a hydropower plant in Hubei Province, China, confirms the effectiveness of this methodology in improving the accuracy of health status identification under varying operating conditions. The FGA can also dynamically collect health data, which solves the problem of a small sample in hydropower health evaluation. The concept of his software design is suitable not only for hydropower, but also for wind power and thermal power, which provides ideas for degradation trend analysis of the long-term series.
Future directions could involve incorporating physical information constraints to enhance the credibility of generated data or further exploring integrated frameworks for joint analysis of multimodal industrial data. FGA provides a highly adaptable, deployable, and low-data-dependency framework for industrial anomaly detection. Its dual-loop mechanism of “dynamic scheduling and feedback optimization” offers a new paradigm for the lightweight implementation of industrial intelligent systems.
Acknowledgement: Not applicable.
Funding Statement: This work was supported by Heilongjiang Provincial Natural Science Foundation Distinguished Young Program (No. JQ2023E006).
Author Contributions: The authors confirm contribution to the paper as follows: Conceptualization, Guanfeng Wang, Xuliang Yao and Jingfang Wang; methodology, Guanfeng Wang, Jincheng Geng and Erlou Shi; software, Guanfeng Wang; validation, Guanfeng Wang and Jincheng Geng; formal analysis, Guanfeng Wang and Zhili Zhou; investigation, Guanfeng Wang; resources, Yongxin Sun and Erlou Shi; data curation, Guanfeng Wang and Zhili Zhou; writing—original draft preparation, Guanfeng Wang and Jingfang Wang; writing—review and editing, Jingfang Wang and Jincheng Geng; visualization, Guanfeng Wang and Erlou Shi; supervision, Xuliang Yao; project administration, Yongxin Sun; funding acquisition, Yongxin Sun. All authors reviewed and approved the final version of the manuscript.
Availability of Data and Materials: Data are not available due to commercial restrictions.
Ethics Approval: Not applicable.
Conflicts of Interest: The authors declare no conflicts of interest.
References
1. Wang H, Yu K, Huang K, Ma L. Degradation evaluation of hydropower equipment based on variational modal decomposition. J Comput. 2024;35(4):31–8. doi:10.53106/199115992024083504003. [Google Scholar] [CrossRef]
2. Cordova MM, Finardi EC, Ribas FAC, de Matos VL, Scuzziato MR. Performance evaluation and energy production optimization in the real-time operation of hydropower plants. Electr Power Syst Res. 2014;116:201–7. doi:10.1016/j.epsr.2014.06.012. [Google Scholar] [CrossRef]
3. Zhang X, Jiang Y, Li C, Zhang J. Health status assessment and prediction for pumped storage units using a novel health degradation index. Mech Syst Signal Process. 2022;171:108910. doi:10.1016/j.ymssp.2022.108910. [Google Scholar] [CrossRef]
4. Yang W, Yang J, Guo W, Zeng W, Wang C, Saarinen L, et al. A mathematical model and its application for hydro power units under different operating conditions. Energies. 2015;8(9):10260–75. doi:10.3390/en80910260. [Google Scholar] [CrossRef]
5. Lin L, Zhao S, Zhang Y, Wen A, Zhang S, Yan J, et al. Purposive data augmentation strategy and lightweight classification model for small sample industrial defect dataset. IEEE Trans Ind Inform. 2024;20(9):11475–84. doi:10.1109/TII.2024.3404053. [Google Scholar] [CrossRef]
6. Ma L, Ding Y, Wang Z, Wang C, Ma J, Lu C. An interpretable data augmentation scheme for machine fault diagnosis based on a sparsity-constrained generative adversarial network. Expert Syst Appl. 2021;182:115234. doi:10.1016/j.eswa.2021.115234. [Google Scholar] [CrossRef]
7. Liang P, Deng C, Yuan X, Zhang L. A deep capsule neural network with data augmentation generative adversarial networks for single and simultaneous fault diagnosis of wind turbine gearbox. ISA Trans. 2023;135:462–75. doi:10.1016/j.isatra.2022.10.008. [Google Scholar] [PubMed] [CrossRef]
8. Whang SE, Roh Y, Song H, Lee JG. Data collection and quality challenges in deep learning: a data-centric AI perspective. VLDB J. 2023;32(4):791–813. doi:10.1007/s00778-022-00775-9. [Google Scholar] [CrossRef]
9. MS S, Sasidaran K. Machine learning for big data. In: Applications of big data in large- and small-scale systems. Hershey, PA, USA: IGI Global; 2021. p. 56–76. [Google Scholar]
10. Zhang F, Liu J, Liu Y, Li H, Jiang X. Data-model-interactive enhancement-based Francis turbine unit health condition assessment using graph driven health benchmark model. Expert Syst Appl. 2024;249:123724. doi:10.1016/j.eswa.2024.123724. [Google Scholar] [CrossRef]
11. Li B, Wang W, Guo J, Ding B. Research on condition operation monitoring of power system based on supervisory control and data acquisition model. Alex Eng J. 2024;99:326–34. doi:10.1016/j.aej.2024.05.027. [Google Scholar] [CrossRef]
12. Zemouri R, Ibrahim R, Tahan A. Hydrogenerator early fault detection: sparse dictionary learning jointly with the variational autoencoder. Eng Appl Artif Intell. 2023;120:105859. doi:10.1016/j.engappai.2023.105859. [Google Scholar] [CrossRef]
13. Li J, Meng Z, Yin N, Pan Z, Cao L, Fan F. Multi-source feature extraction of rolling bearing compression measurement signal based on independent component analysis. Measurement. 2021;172:108908. doi:10.1016/j.measurement.2020.108908. [Google Scholar] [CrossRef]
14. Zhang T, Chen J, Li F, Pan T, He S. A small sample focused intelligent fault diagnosis scheme of machines via multimodules learning with gradient penalized generative adversarial networks. IEEE Trans Ind Electron. 2021;68(10):10130–41. doi:10.1109/TIE.2020.3028821. [Google Scholar] [CrossRef]
15. Silionis NE, Liangou T, Anyfantis KN. Deep learning-based surrogate models for spatial field solution reconstruction and uncertainty quantification in structural health monitoring applications. Comput Struct. 2024;301:107462. doi:10.1016/j.compstruc.2024.107462. [Google Scholar] [CrossRef]
16. Nahak N, Satapathy S. A coordinated modelling and control of modified pumped storage governor with unified power flow controller to damp low frequency oscillations in power system for stochastic renewable penetrations. Eng Appl Artif Intell. 2024;130:107702. doi:10.1016/j.engappai.2023.107702. [Google Scholar] [CrossRef]
17. Li J, Shao H, Kong Y, Chen Z. Guest editorial special issue on industrial big data and artificial intelligence-driven intelligent perception, maintenance, and decision optimization in industrial systems. Comput Mater Contin. 2025;82(2):3609–13. doi:10.32604/cmc.2024.062183. [Google Scholar] [CrossRef]
18. Sahin ME, Ozbay Karakus M. Smart hydropower management: utilizing machine learning and deep learning method to enhance dam’s energy generation efficiency. Neural Comput Appl. 2024;36(19):11195–211. doi:10.1007/s00521-024-09613-1. [Google Scholar] [CrossRef]
19. Ma L, Chen S, Wei D, Zhang Y, Guo Y. A comprehensive hybrid deep learning approach for accurate status predicting of hydropower units. Appl Sci. 2024;14(20):9323. doi:10.3390/app14209323. [Google Scholar] [CrossRef]
20. Ke Y, Wang Q, Xiao H, Luo Z, Li J. Hydropower unit health assessment based on a combination weighting and improved fuzzy comprehensive evaluation method. Front Energy Res. 2023;11:1242968. doi:10.3389/fenrg.2023.1242968. [Google Scholar] [CrossRef]
21. Liu Y, Xu Y, Liu J, Shi Y, Li S, Zhou J. Real-time comprehensive health status assessment of hydropower units based on multi-source heterogeneous uncertainty information. Measurement. 2023;216:112979. doi:10.1016/j.measurement.2023.112979. [Google Scholar] [CrossRef]
22. Zhou Z, Su Y, Li J, Yu K, Jonathan Wu QM, Fu Z, et al. Secret-to-image reversible transformation for generative steganography. IEEE Trans Dependable Secure Comput. 2023;20(5):4118–34. doi:10.1109/TDSC.2022.3217661. [Google Scholar] [CrossRef]
23. Zhou Z, Dong X, Meng R, Wang M, Yan H, Yu K, et al. Generative steganography via auto-generation of semantic object contours. IEEE Trans Inf Forensics Secur. 2023;18:2751–65. doi:10.1109/TIFS.2023.3268843. [Google Scholar] [CrossRef]
24. Dudek G. STD: a seasonal-trend-dispersion decomposition of time series. IEEE Trans Knowl Data Eng. 2023;35(10):10339–50. doi:10.1109/TKDE.2023.3268125. [Google Scholar] [CrossRef]
25. Liu SZ, Ma S, Chen HQ, Cui LZ, Ding J. Combining KNN with AutoEncoder for outlier detection. J Comput Sci Technol. 2024;39(5):1153–66. doi:10.1007/s11390-023-2403-y. [Google Scholar] [CrossRef]
26. Xu X, Hu L, Liu J, Miao X, Yan X. T-LSTM-VAE: a random missing data imputation model for multivariate time series. J Frankl Inst. 2026;363(1):108231. doi:10.1016/j.jfranklin.2025.108231. [Google Scholar] [CrossRef]
Cite This Article
 Copyright © 2026 The Author(s). Published by Tech Science Press.
This work is licensed under a Creative Commons Attribution 4.0 International License , which permits unrestricted use, distribution, and reproduction in any medium, provided the original work is properly cited.
 Downloads
 Citation Tools