
 Submit a Paper
 Propose a Special lssue
 Open Access
ARTICLE

Predicting Software Security Bugs Using Machine Learning and Quality Metrics: An Empirical Study
1 Department of Computer Science and Mathematics (DIM), University of Quebec at Chicoutimi (UQAC), Chicoutimi, QC, Canada
2 Research and Development Department, VibroSystM, Longueuil, QC, Canada
3 LARODEC, Institut Supérieur de Gestion (ISG), University of Tunis, Tunis, Tunisia
* Corresponding Author: Elisée Toe. Email:
Computers, Materials & Continua 2026, 87(3), 12 https://doi.org/10.32604/cmc.2026.077139
Received 03 December 2025; Accepted 15 January 2026; Issue published 09 April 2026
 View Full Text
 Download PDF
Abstract
Software security bugs present significant security risks to modern systems, leading to unauthorized access, data breaches, and severe operational and financial consequences. Early prediction of such vulnerabilities is therefore essential for strengthening software reliability and reducing remediation costs. This study investigates the extent to which static software quality metrics can identify vulnerable code and evaluates the effectiveness of machine learning models for large-scale security-bug prediction. We analyze a dataset of 338,442 source files, including 33,294 buggy files, collected from seven major open-source ecosystems. These ecosystems include GitHub Security Advisories (GHSA), Python Package Index (PyPI), OSS-Fuzz (Google’s open-source fuzzing service), Node Package Manager (npm), Packagist (the PHP package repository), Apache Maven, and NuGet (the.NET package manager). Using the Open Source Vulnerabilities (OSV) platform, we identify 7685 confirmed security bugs and extract 25 static software quality metrics per file with the Understand analysis tool. We apply five complementary feature-importance techniques and evaluate eleven machine-learning classifiers under a time-series cross-validation protocol. Our analysis reveals three key findings. First, six core metrics consistently show strong associations with the presence of security bugs across all feature-selection methods. Second, buggy files exhibit substantially higher metric values, with medians approximately three times those of non-buggy files, a pattern we term the “3Keywords
Security vulnerabilities remain a critical threat to modern software systems, exposing organizations and users to risks such as data breaches, service disruption, and severe financial loss. As cyberattacks continue to increase in frequency and sophistication [1], the economic impact of cybercrime exceeded seven trillion USD in 20221. Numerous studies have shown that software security bugs are a significant source of such weaknesses [2], underscoring the need for early detection and mitigation in the development lifecycle [3]. However, as software grows in size and complexity, pinpointing the specific components most likely to harbor these flaws becomes increasingly challenging.
Traditional detection techniques rely heavily on dynamic analysis, which executes software under multiple inputs to identify problematic behaviors such as buffer overflows or unsafe library calls. Although widely used, dynamic approaches often suffer from high false-positive rates [4] and substantial computational cost, limiting their integration into rapid development workflows. Consequently, researchers have explored complementary approaches based on machine learning (ML), which has proven effective in domains such as spam filtering [5], intrusion detection [6], and cyberattack attribution [7]. Deep learning techniques, in particular, have gained significant attention for automated vulnerability detection [8]. In software engineering, ML has been applied to predict general software defects using static code metrics [1,9,10].
Despite these advances, comparatively little is known about how traditional software quality metrics relate specifically to security bugs [11–13]. Security vulnerabilities tend to be more subtle than functional bugs: they often arise from complex control-flow structures, rare edge cases, improper error-handling logic, API misuse, or intricate component interactions. Therefore, understanding whether classical quality metrics such as code size, structural complexity, or cyclomatic complexity can serve as meaningful indicators of vulnerability-prone code remains an open question.
Past studies investigating this topic have been limited by small datasets, language-specific scopes, or reliance on synthetic vulnerabilities, restricting the generalizability of their findings. The Open Source Vulnerabilities (OSV) platform enables the study of real-world security bugs across multiple ecosystems using commit-level vulnerability data. This platform enables large-scale empirical investigations that were previously infeasible. Throughout this study, we use the term security bugs to denote security-relevant code flaws that are addressed through security-fixing commits documented in the OSV database. While many of these bugs correspond to confirmed, exploitable vulnerabilities (e.g., associated with CVE identifiers), others represent latent security weaknesses whose exploitability may depend on specific deployment contexts or threat models. Consequently, our analysis focuses on security-relevant risk rather than confirmed exploitation alone.
The goal of this study is to explore, at scale, the relationship between software quality metrics and real-world security vulnerabilities. We also evaluate the feasibility of predicting security bugs using these metrics. To this end, we construct a dataset of 338,442 file-level instances drawn from seven major open-source ecosystems (GHSA, PyPI, OSS-Fuzz, npm, Packagist, Maven, and NuGet), including 33,294 files affected by 7685 confirmed security bugs. For each file, we extract 25 structural and complexity-related metrics using the Understand static analysis tool.
The following research questions guide our investigation:
• RQ1: Which software quality metrics are most strongly associated with the presence of security bugs? Identifying such metrics can help developers focus on code characteristics that elevate security risk.
• RQ2: Do specific values or thresholds of these metrics indicate a significantly higher likelihood of security bugs? Understanding differences in metric distributions can help define empirical guidelines for secure development.
• RQ3: Can machine learning models effectively predict security bugs using only software quality metrics? Assessing predictive capability is essential for integrating ML-based detectors into automated security workflows.
To address these questions, we combine feature importance analysis, statistical comparisons, and machine learning experiments using eleven classification algorithms evaluated through time-series cross-validation. Our findings reveal strong and consistent associations between specific metrics, particularly cyclomatic complexity and code size, and the presence of security bugs. In addition, ensemble-based ML models achieve high recall and strong discriminative performance, indicating that static quality metrics provide actionable signals for vulnerability detection. Overall, this study contributes large-scale empirical evidence that software quality metrics can play a meaningful role in identifying vulnerability-prone code. By linking traditional software metrics with real-world security bugs across multiple ecosystems, we provide actionable insights for integrating lightweight, automated, and metric-driven security analysis into modern software development practices.
The remainder of this paper is organized as follows: Section 2 reviews related work on software defect prediction, vulnerability prediction, and security bug analysis. Section 3 describes the empirical study design, including ecosystem selection, data collection, metric extraction, and analytical procedures (Section 4). Section 5 presents the results for each research question, along with their practical implications. Section 6 discusses threats to validity. Section 7 concludes the paper and outlines directions for future work. All data, scripts, and replication materials are available as Availability of Data and Materials at: https://github.com/MdioufDataScientist/PredictSecBugs.
Software security research commonly distinguishes between vulnerabilities (demonstrably exploitable weaknesses) and security bugs (security-relevant flaws that may not always be directly exploitable). This distinction matters when building empirical datasets from advisories and security-fixing commits, where labels often reflect security relevance rather than confirmed exploitability [2,14]. In this section, we review prior work on (i) defect/bug prediction using software metrics, (ii) vulnerability prediction and detection using machine learning and deep learning (ML/DL) with an emphasis on recent trends (2020–2024), and (iii) security bug prediction and empirical security studies. We conclude with a comparative positioning of our study.
2.1 Defect and Bug Prediction with Software Metrics
Foundational studies established that size and complexity metrics correlate with defect-proneness and can support risk-based quality assurance [15–17]. These works also showed that metric families (e.g., design vs. code metrics) can influence performance to a similar extent as the learning algorithm itself [17]. Later research highlighted the role of process metrics and the limitations of purely code-based metrics, including stasis (repeatedly flagging the duplicate files) and limited portability across releases and projects [18].
Two recurring challenges dominate the defect prediction literature and remain highly relevant for security settings: (i) class imbalance and (ii) evaluation realism. Extensive empirical studies show that class rebalancing techniques such as the Synthetic Minority Over-sampling Technique (SMOTE) [19], which generate artificial minority-class samples to rebalance training data, can improve recall, but may also distort explanatory analyses. The benefits of these techniques depend on the learner and the metric family used. Similarly, automated parameter optimization can substantially improve AUC but may alter variable importance rankings and interpretability [20]. Beyond traditional ML, deep and hybrid approaches have been investigated to capture non-linear interactions among metrics and reduce imbalance/overfitting effects, including autoencoder-ensemble strategies [21] and deep metric-driven models [22–25].
2.2 Vulnerability Prediction and Detection Using ML/DL
Vulnerability prediction extends defect prediction by focusing on security-relevant outcomes. Recent literature (2020–2024) reports a growing dominance of deep learning and hybrid pipelines (e.g., combining static analysis signals with learned code representations), while also emphasizing persistent issues related to dataset bias, label noise, and generalization across projects and time [26–28]. Recent empirical evaluations have revealed significant limitations in the generalization capabilities of deep learning models for vulnerability detection [29], while transformer-based approaches have been explored for fine-grained, line-level prediction [30]. A key message from recent work is that evaluation protocols strongly shape observed performance: improper separation or unrealistic settings can lead to overly optimistic conclusions [27]. Related work also highlights temporal shifts and distribution changes (concept drift) as important obstacles for realistic vulnerability assessment [31].
Another important line of research focuses on improving data quality. Evidence suggests that latent vulnerabilities (missed or delayed labels) can substantially affect training signals and measured performance; enriching datasets (e.g., via SZZ-based strategies) can increase labeled instances and improve detection performance [32]. For handling severe imbalance, recent approaches go beyond SMOTE and explore more advanced generation strategies (e.g., GAN-based oversampling) to improve minority recall under strong skew [33].
2.3 Security Bug Prediction and Empirical Security Studies
Empirical studies have investigated how security bugs differ from other defects in triage and evolution. Security-related bugs are often addressed faster and involve more developers and files [2]. Other large-scale analyses emphasize that vulnerabilities and general bugs are related but distinct phenomena [14]. Metric-based analyses of large systems, notably Mozilla, suggest that complexity and size metrics signal vulnerability-prone code. However, results may exhibit high false negatives depending on the setting [1,11]. Other studies report that while metrics can help identify buggy functions, strong correlations with security bugs can be elusive in smaller or heterogeneous settings [12].
Recent work increasingly leverages ML/DL on natural codebases and commit-level signals. For example, commit-focused ML combined with static analyzer signals has been used to predict vulnerability-fixing commits [34], while fine-grained vulnerability detection has been explored using learned representations on natural codebases (e.g., Python) [35]. Studies also report that gradient-boosted models, such as XGBoost, can be strong baselines for vulnerability prediction using static metrics, although cross-project transfer remains challenging [13]. In parallel, domain knowledge injection (e.g., CWE knowledge graphs) has been proposed to strengthen security bug report prediction [36], and large-scale classifications of security bugs highlight memory and input-validation issues as frequent root causes [37]. Finally, recent evidence shows that static analyzers may suffer from low precision/recall in practice, motivating complementary ML-based risk prioritization approaches [38,39].
2.4 Comparative Positioning of This Study
To explicitly position our work with respect to representative studies, Table 1 summarizes key dimensions, including task scope, analysis granularity, dataset scale and diversity, validation strategy, and whether actionable thresholds are derived. Overall, recent literature converges on three persistent challenges in security bug and vulnerability prediction: (i) noisy or incomplete labeling, (ii) severe class imbalance, and (iii) limited generalization across ecosystems, programming languages, and time [27,32]. Our study addresses these challenges by conducting a large-scale, multi-ecosystem empirical investigation at the file-level, combining multiple feature-importance techniques with statistical analysis and adopting a time-series validation strategy to reduce temporal information leakage. Unlike approaches that rely primarily on learned code representations, our metric-driven approach remains lightweight and directly actionable, enabling threshold-based risk screening and prioritization in CI/CD workflows.
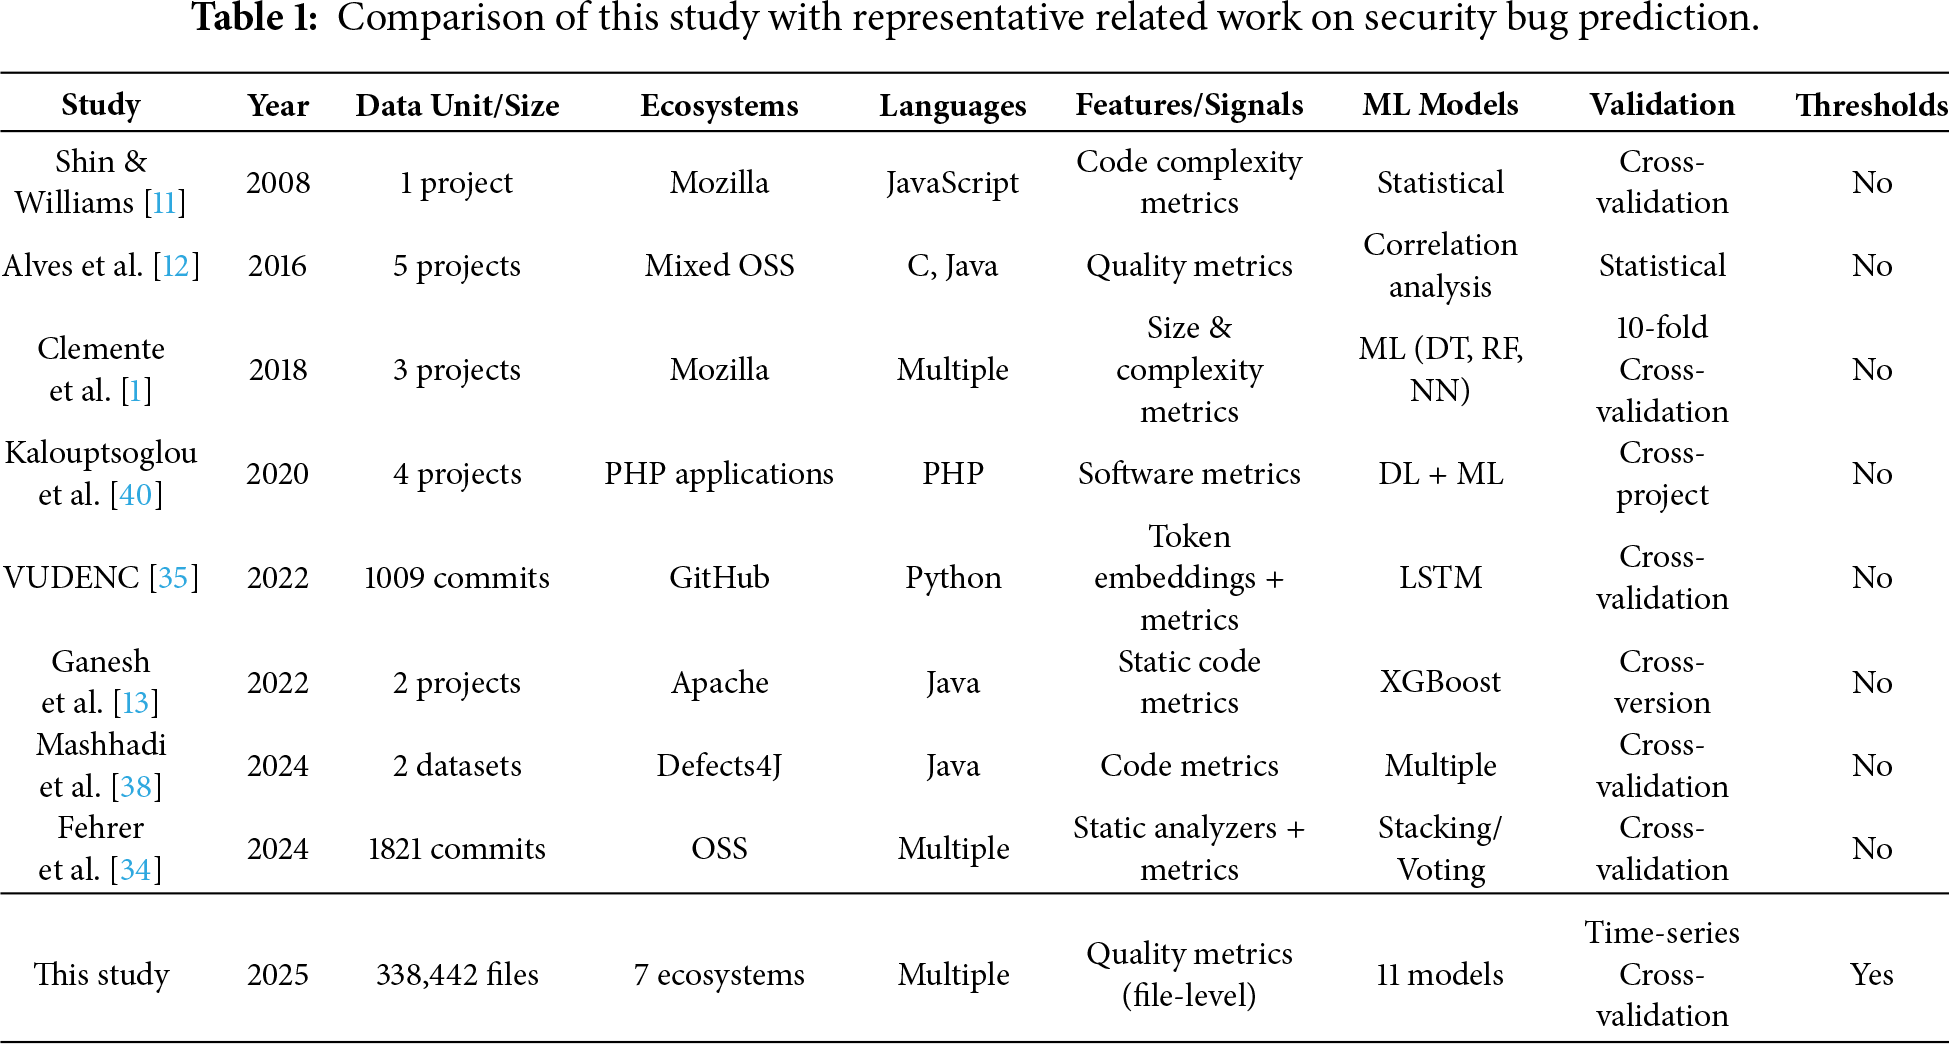
Table 1 shows that most existing studies focus on a single ecosystem, a limited number of projects, or commit-level analysis, and typically rely on random or cross-validation strategies. In contrast, our study operates at the file-level across seven major ecosystems and adopts a time-series validation protocol to better approximate realistic deployment scenarios. Moreover, unlike prior work that primarily reports predictive performance, we derive actionable metric thresholds that support practical risk screening and prioritization in software development workflows.
This section presents the design of our empirical study following the Goal-Question-Metric (GQM) approach [41]. We first introduce the research questions that guide our work, then describe the study context and subject systems, and finally outline the data collection and preparation procedures. Fig. 1 shows an overview of the methodology steps followed during this study.
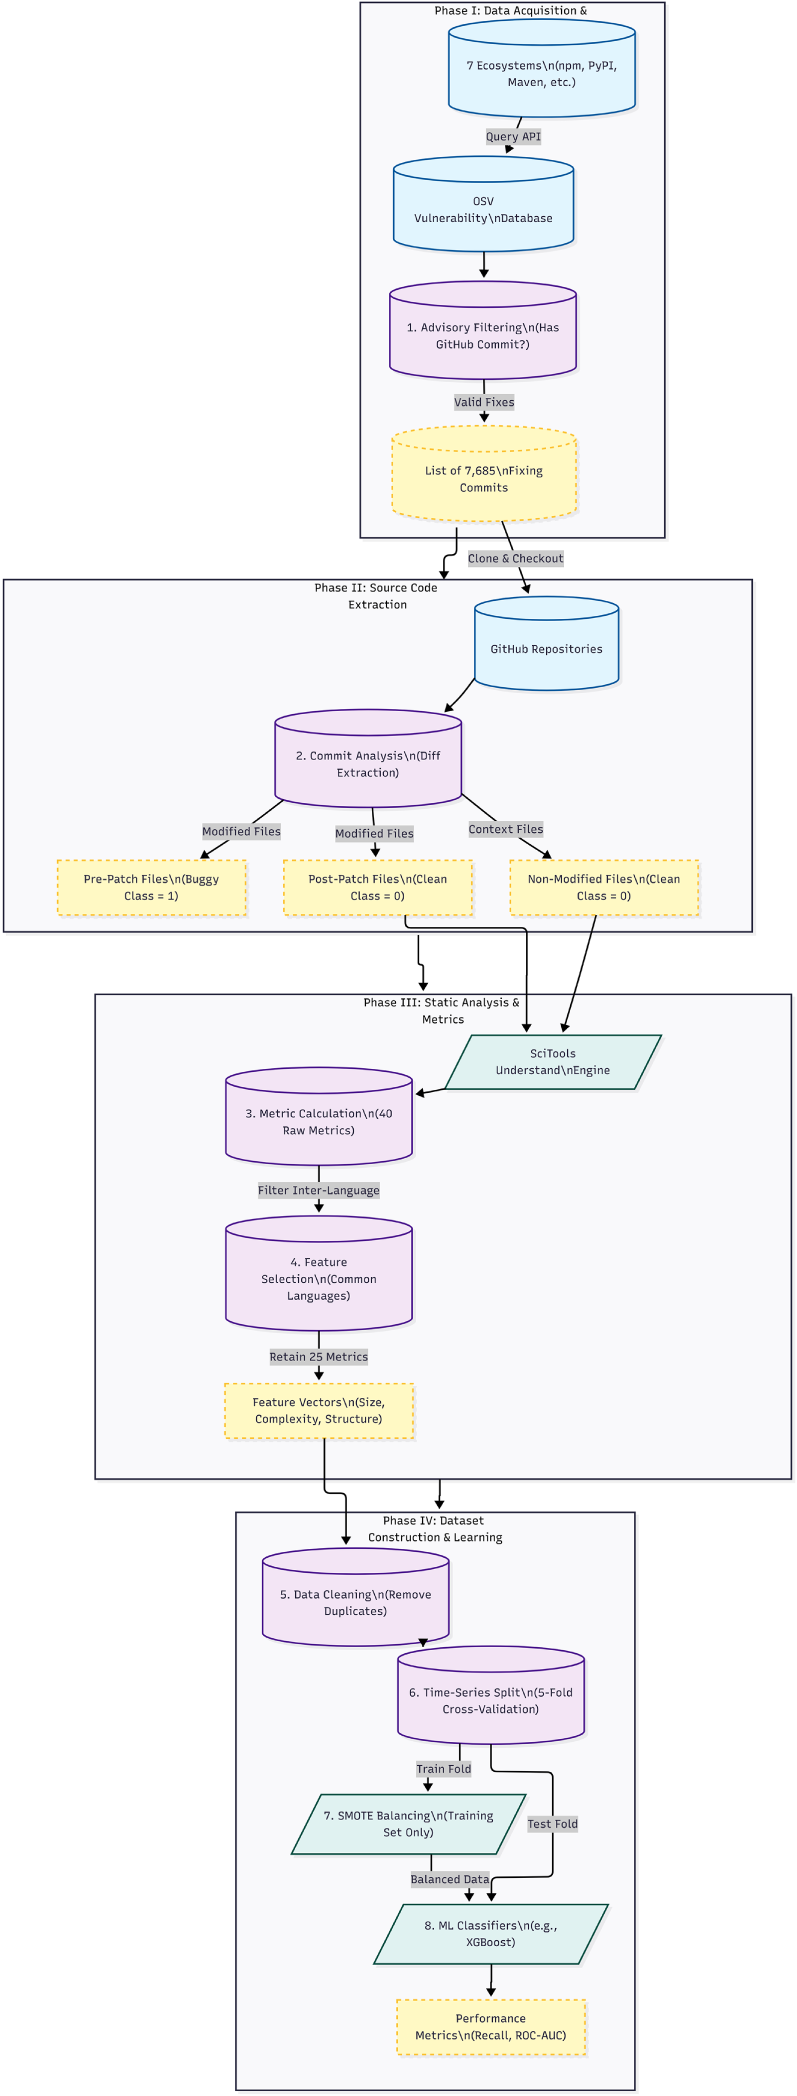
Figure 1: An overview of the methodology.
The overall goal of this study is to examine how file-level software quality metrics relate to the presence of security bugs and to assess whether these metrics can support early detection through machine learning. From the perspective of software developers and security practitioners, the study aims to provide actionable, metric-driven signals that help prioritize code review and security testing effort during development. Following the Goal–Question–Metric (GQM) approach, we formulate three research questions.
RQ1. Which specific quality metrics are most strongly correlated with predicting security bugs?
The objective of RQ1 is to identify a subset of metrics that contribute the most to distinguishing buggy from non-buggy files. This provides a first indication of which aspects of code structure and complexity are most relevant from a security perspective. Understanding which code quality metrics are most strongly associated with security bugs enables developers to focus on the most critical indicators of potential vulnerabilities.
RQ2. Do specific ranges or threshold values of these metrics correspond to significantly higher security-bug likelihood?
By comparing the distributions of metric values across buggy and clean files, RQ2 aims to identify critical ranges where the probability of a security issue increases significantly. Such thresholds could be integrated into quality gates or static analysis tools. Beyond determining which metrics matter, developers need concrete threshold values that signal elevated risk. Establishing these thresholds enables proactive alerts when code quality degrades to dangerous levels, allowing intervention before vulnerabilities are exploited.
RQ3. How accurately can machine learning models predict security bugs using software quality metrics?
Here, the goal is twofold: (i) to assess whether classification models can effectively discriminate between buggy and non-buggy files and (ii) to compare a set of representative machine learning algorithms in terms of standard evaluation metrics, with particular emphasis on recall in a highly imbalanced security context. If machine learning models can accurately predict security bugs based on quality metrics, they can be integrated into development workflows to provide automated security assessments. This question evaluates the practical feasibility of ML-based security bug prediction.
Together, these three questions form a coherent pipeline: RQ1 identifies the most informative metrics, RQ2 examines their value ranges and statistical properties, and RQ3 evaluates their practical usefulness as features in predictive models.
3.2 Study Context and Subject Systems
3.2.1 Ecosystem Selection Criteria
The study is conducted in the context of open-source software, where both vulnerability reports and code histories are publicly available. We selected open-source software ecosystems rather than individual projects to ensure:
• Diversity: coverage of multiple programming languages (Java, JavaScript, Python, PHP, C, etc.).
• Scale: large sample sizes for robust statistical analysis.
• Relevance: real-world security vulnerabilities documented in established databases.
• Reproducibility: publicly available data and well-maintained version control histories.
We rely on the Open Source Vulnerabilities (OSV) database2 as our primary source of security advisories to collect ecosystems that meet the following inclusion criteria:
1. Availability of documented security vulnerabilities with commit-level references.
2. Active maintenance with a substantial development history.
3. Diverse package sizes (from hundreds to millions of lines of code).
4. Supported by major package management platforms.
3.2.2 Selected Ecosystems and Projects
We apply three inclusion criteria: (i) OSV must support the ecosystem with a sufficient number of reported security bugs, (ii) projects must be hosted in Git-based repositories with accessible commit histories, and (iii) the selected platforms should contribute to linguistic and technological diversity, ensuring that results generalize beyond a single language or domain. Based on these criteria, we retain seven ecosystems: GHSA (GitHub Security Advisories), PyPI, npm, Packagist, Maven, NuGet, and OSS-Fuzz. These ecosystems cover a broad range of programming languages (e.g., Python, JavaScript, PHP, Java, .NET) and software types (libraries, frameworks, tools, and infrastructure components), collectively representing a significant portion of the modern open-source software stack. Within the selected ecosystems, we focus on security bugs, for which OSV provides a link to a specific version-control commit that fixes the vulnerability. This constraint is essential to retrieve the exact source code context before and after the fix. For each ecosystem, we query OSV and filter advisories that contain at least one GitHub commit reference.
Brief descriptions of each ecosystem:
1. OSS-Fuzz: A Google initiative using continuous fuzzing to discover vulnerabilities in critical open-source projects automatically. It collaborates with the OSV platform to disclose security bugs it finds.
2. GHSA (GitHub Security Advisory Database): Launched in 2019 to centralize security vulnerability management across GitHub-hosted projects. It enables maintainers to report vulnerabilities confidentially and publish advisories after patches are released.
3. PyPI (Python Package Index): The official repository for Python packages, established in 2003. As one of the oldest package ecosystems, it manages millions of packages and has an extensive history of vulnerability tracking.
4. Packagist (Composer): The primary PHP package repository launched in 2012, essential for modern PHP web application development and security.
5. npm (Node Package Manager): Introduced in 2010, npm is the most extensive package ecosystem, serving the JavaScript/Node.js community. Its modular architecture makes it particularly important for security research.
6. NuGet: The official package manager for .NET development, established in 2011, covering C#, F#, and Visual Basic projects.
7. Maven: A Java project management and build tool ecosystem launched in 2002, widely used in enterprise Java development.
Across these seven ecosystems, we identify 7685 confirmed security bugs for which fixing commits are available. These bugs are distributed across several open-source projects in different ecosystems. In this study, we adopt a more precise terminology: an ecosystem denotes a package management or vulnerability-reporting platform (such as PyPI or GHSA), whereas a project denotes a specific software repository hosted within one of these ecosystems. The final dataset aggregates file-level information from all projects that appear in at least one security-fixing commit in these seven ecosystems.
For each confirmed security bug, we retrieve the associated fixing commit. All files modified in that commit are considered part of the fix and are therefore labeled as buggy. To better characterize the context in which these fixes occur, we also include all other source files from the corresponding repository snapshot, which are not directly involved in the fix and are treated as non-buggy at that time. The final dataset comprises 338,442 file-level observations drawn from the seven ecosystems. Each observation corresponds to a specific source-code file, possibly in multiple versions (for example, before and after a fixing commit).
Table 2 presents the distribution of files per ecosystem; this distribution reflects both the intensity of vulnerability reporting and the size of the underlying code bases in each ecosystem.
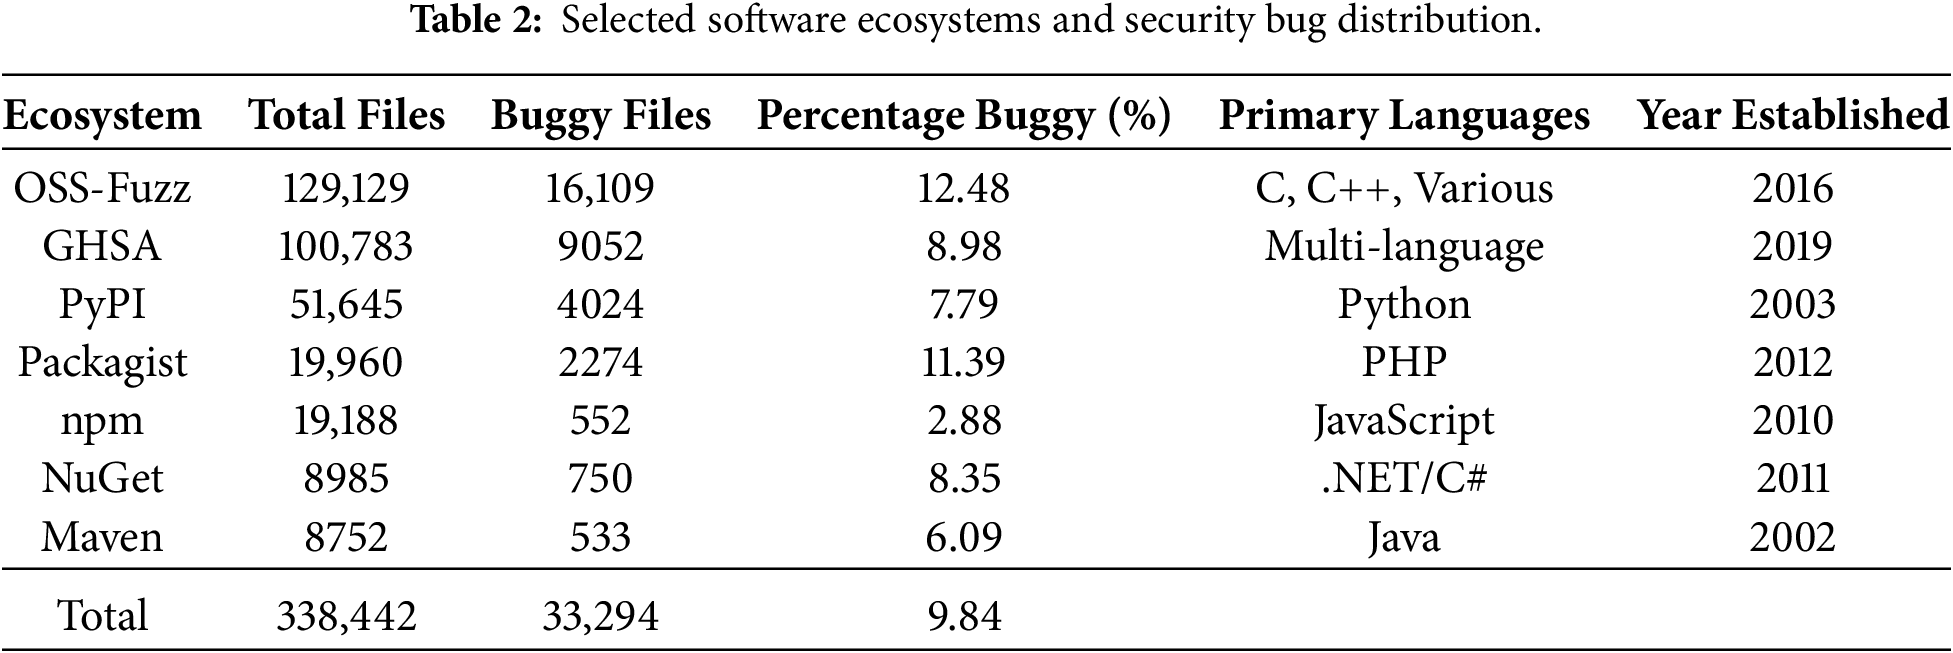
When available, we extract two versions of each file: the pre-patch version (before the fixing commit) and the post-patch version (after the fixing commit), as well as comparable versions for non-buggy files. These versions are later used to compute quality metrics and to construct the prediction dataset. As expected in a security context, the proportion of buggy files is relatively low across ecosystems, typically below 15% and as low as 2.88% in some cases, confirming that the resulting dataset is highly imbalanced. We address this through SMOTE oversampling [42] applied exclusively to training data (detailed in Section 3.3.3):
• 33,294 buggy files (9.84%): Files confirmed as containing security vulnerabilities.
• 305,148 non-buggy files (90.16%): Files from the same projects without confirmed security issues.
Each file is characterized by:
• 25 quality metrics (detailed in Section 3.3.2).
• Metadata: commit date, commit SHA, file path, ecosystem, extension, source (pre/post-commit).
• Target variable: Binary indicator (buggy = 1, non-buggy = 0).
Date Range: Security bugs span from 29 June 2005 to 07 May 2022, providing 17 years of security vulnerability data.
3.3 Data Collection and Preparation
3.3.1 Security Bug Identification
A rigorous multi-stage process is used to identify and validate security bugs, comprising five steps designed to improve labeling reliability while preserving dataset scale.
Step 1: advisory collection. We query the OSV API for each of the seven ecosystems and retrieve all security advisories containing structured metadata such as vulnerability descriptions, severity ratings, affected versions, and references. We retain only advisories that include at least one reference to a GitHub commit fixing the vulnerability, resulting in 8247 advisory-commit pairs.
Step 2: commit-level Mapping. For each advisory, we clone the corresponding repository and retrieve the complete diff associated with the fixing commit. All files modified in that commit are initially flagged as potentially security-relevant, yielding 41,892 candidate buggy files.
Step 3: automated Filtering. To reduce labeling noise caused by files incidentally modified alongside security fixes, three automated filtering mechanisms are applied. (i) Diff-based analysis: files are retained only if the diff contains substantive code changes (i.e., additions or deletions of executable statements). Files involving only whitespace, comments, import reordering, or empty line changes are excluded. (ii) Commit message validation: commit messages are automatically scanned for security-related terms (e.g., security, vulnerability, CVE, exploit, fix, patch), increasing confidence that retained commits correspond to genuine security fixes. (iii) File-type filtering: non-source files unlikely to contain exploitable security bugs, such as documentation, configuration files, test code, build artifacts, and static assets, are excluded.
Collectively, these automated filters remove approximately 12% of the initially flagged candidate files, yielding a refined set of security-relevant buggy file candidates.
Step 4: contextual File Collection. For each security-fixing commit, we collect all other source files from the same repository at the pre-fix commit state. Files not modified by the fixing commit are treated as non-buggy instances for that snapshot, ensuring that buggy and non-buggy files share the same project and temporal context.
Step 5: manual Validation. To assess the reliability of the automated labeling process, we manually inspected a random sample of 769 security advisories and their corresponding security-fixing commits (approximately 10% of the dataset), spanning all seven ecosystems. Each sampled case was reviewed to verify whether the referenced commit genuinely addressed a security-relevant issue and whether the modified files contained security-related code changes. This validation confirmed that 724 cases (94.2%) clearly corresponded to security fixes, while 31 cases (4.0%) were considered borderline (e.g., defensive hardening or security-related refactoring without a clearly exploitable flaw). Fourteen cases (1.8%) were identified as incorrectly labeled and were removed from the dataset before analysis. The resulting estimated labeling error rate of approximately 1.8% indicates that residual noise is limited. Importantly, this noise is conservative: potential mislabeling primarily corresponds to non-security changes being included as buggy files (false positives), which would attenuate observed differences between buggy and non-buggy files rather than artificially inflate them. Consequently, the reported associations between quality metrics and security bugs are likely to represent a conservative lower bound on the true effect.
Overall, while commit-level labeling may still introduce limited noise due to auxiliary files modified during security patches, this approach follows widely adopted practices in vulnerability prediction research and provides a scalable, reproducible, and empirically validated mechanism for extensive multi-ecosystem analysis.
3.3.2 Quality Metrics Extraction
We use the SciTools Understand3 static analysis tool to compute software quality metrics at the file-level. Understand is a widely used static analysis tool in software engineering research [43] that supports multiple programming languages and provides consistent metric definitions across languages [44]. For each source file in our dataset, whether buggy or non-buggy, we invoke Understand from the command line and extract the complete set of metrics supported for the corresponding language. The tool produces individual CSV files per project, which we then merge into a single data file.
In total, Understand provides 40 metrics4 across all considered languages, including various measures of size (e.g., lines of code), complexity (e.g., cyclomatic metrics), and structural information (e.g., counts of declarations and statements). However, since our dataset spans multiple programming languages, not all metrics are defined uniformly across languages. To ensure comparability, we retain only the 25 metrics that are common to all languages and consistently supported across ecosystems. Table 3 organizes these metrics into three categories.
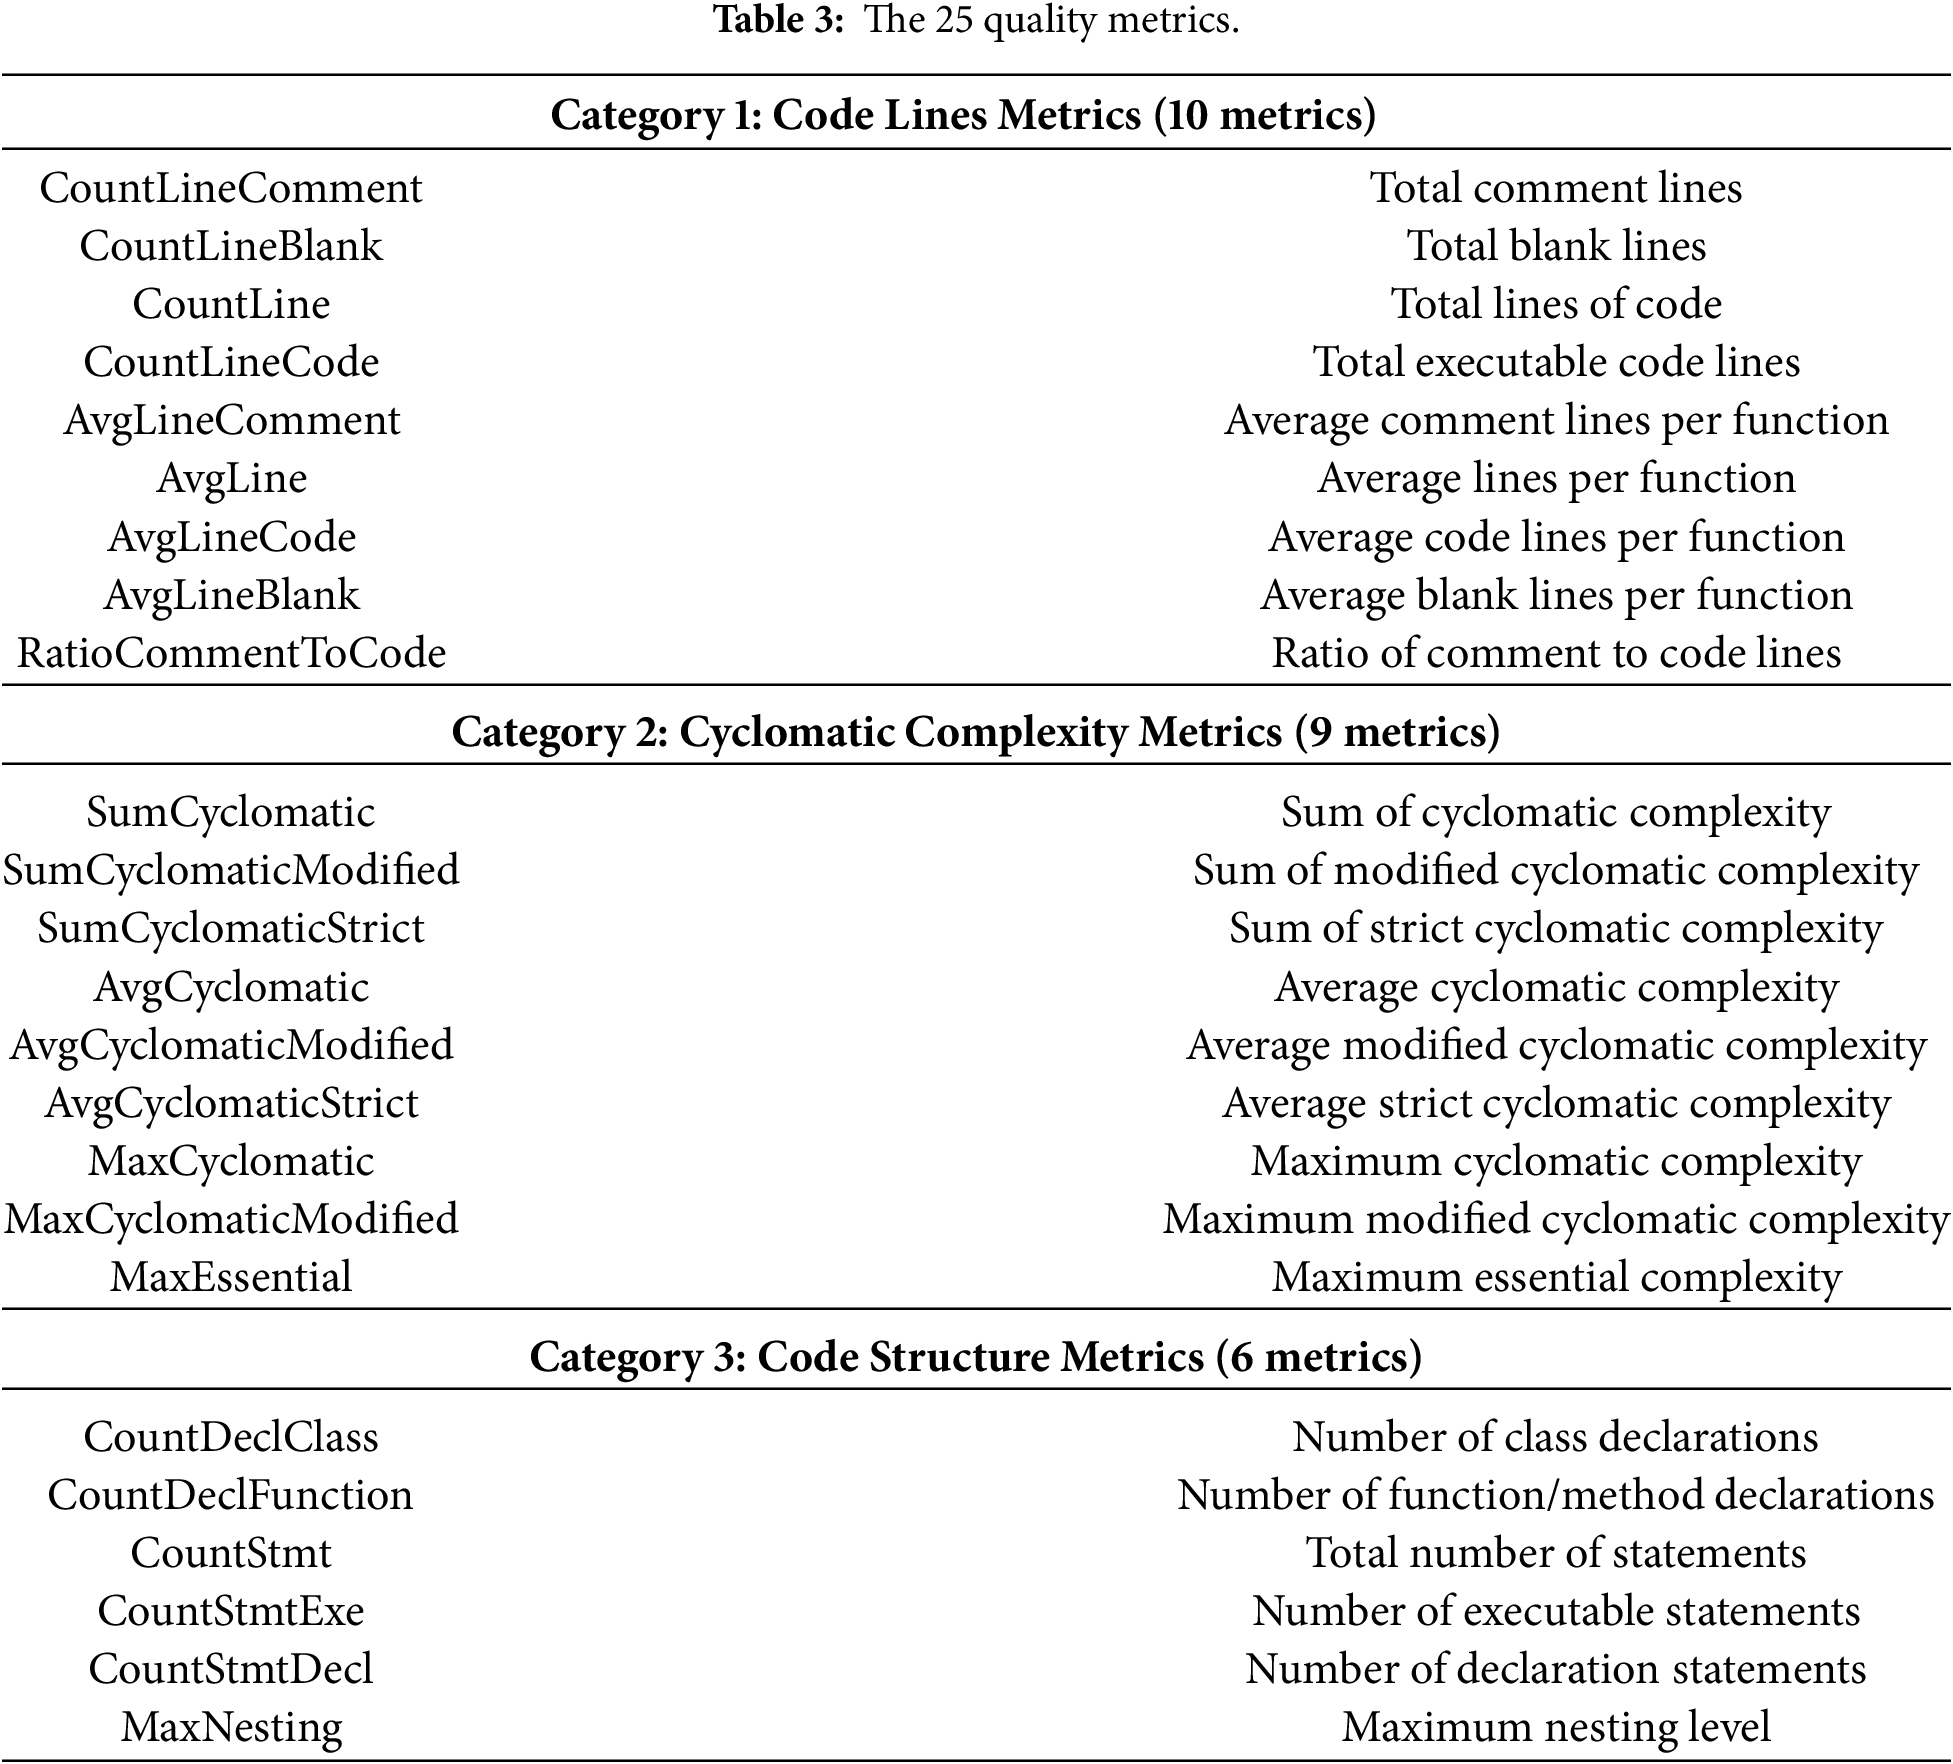
The resulting dataset contains, for each file: (i) the 25 selected quality metrics, (ii) a binary target variable “buggy”, indicating whether the file is involved in a security bug (1) or not (0) and (iii) several metadata attributes, including the file path, ecosystem, commit date and commit identifier, as well as the source version (pre-commit or post-commit).
As indicated by the distribution of buggy files across ecosystems, the proportion of buggy files is substantially lower than that of non-buggy files. Training machine learning models directly on such imbalanced data typically leads to classifiers that favor the majority class and achieve misleadingly high accuracy while performing poorly on the minority class, which is precisely the class of interest in our context [42].
To mitigate this issue, we introduce a binary target variable, “buggy”, that takes the value 1 when a file is associated with a security bug and 0 otherwise. We then apply oversampling techniques to the minority class during model training. Specifically, we compare three standard methods: naïve random oversampling5, the Synthetic Minority Over-sampling Technique6 (SMOTE), and ADASYN7. All three techniques assume that predictors are numerical; this assumption holds in our case, since the 25 retained metrics are continuous or integer-valued.
In our experiments, SMOTE consistently provides the best balance between preserving the original data distribution and improving model performance. SMOTE generates synthetic minority examples by interpolating between existing buggy instances in the feature space, which reduces overfitting compared to simply duplicating examples. Importantly, resampling is applied only to the training folds during cross-validation. The validation and test folds remain untouched and reflect the original class distribution, thereby providing an unbiased estimate of the generalization performance.
While SMOTE is an effective and widely used technique for mitigating class imbalance, its use may influence model generalization by introducing synthetic instances that can smooth decision boundaries. In particular, oversampling-based methods may reduce variance at the cost of potentially obscuring rare but meaningful patterns present in the minority class. To mitigate these risks, oversampling in our study is applied strictly within training folds, while validation and test sets preserve the original class distribution, thereby avoiding information leakage and overly optimistic performance estimates. Nevertheless, alternative imbalance handling strategies could also be considered. Cost-sensitive learning, for example, directly incorporates class imbalance into the loss function, while ensemble-based approaches or under-sampling techniques may reduce reliance on synthetic data. We selected SMOTE as the pragmatic baseline in this study due to its simplicity, reproducibility, and frequent use in prior security and defect prediction studies. A systematic comparison of imbalance-handling strategies and their impact on generalization across ecosystems represents a vital direction and is further discussed in the Threats to Validity section.
This section details the specific analytical techniques employed to answer each research question.
4.1 RQ1 Feature Importance Analysis
To address RQ1, we investigate which quality metrics are most strongly associated with the presence of security bugs. We analyze feature importance by applying five complementary feature-selection or importance-estimation techniques to the entire combined dataset (all ecosystems).
First, we fit a Linear Regression and a Logistic Regression model, with the “buggy” variable as the dependent variable and the 25 quality metrics as predictors. In both cases, the absolute values of the regression coefficients indicate feature importance, with larger magnitudes corresponding to stronger associations with the target. We used two approaches, “Extra Trees Classifier Learning”8 and “Scott-Knott ESD”9 to identify the importance of features, i.e., the quality metrics that may have the highest impact on the appearance of security bugs. These approaches combine predictions from multiple decision trees to effectively select the more informative features from the datasets [45]. Moreover, we analyzed the correlation between these quality metrics using Pearson’s correlation measurement [46,47].
Second, we train an XGBoost classifier and extract its internal feature importance scores, which are based on the gain in the objective function produced by splits on each feature across all trees in the ensemble.
Third, we compute the ANOVA F-score for each metric. In this context, the F-score measures the ratio of between-class variance to within-class variance for each feature. A higher F-score indicates that the distribution of the metric differs substantially between buggy and non-buggy files, making it more discriminative.
Finally, we employ the Boruta algorithm [48], which is a wrapper method built on top of Random Forests. Boruta creates shadow copies of the original features by shuffling their values, trains a Random Forest on the extended feature set, and iteratively compares the importance of each fundamental feature to the maximum significance of the shadow features. Features that consistently outperform their shadow counterparts are deemed necessary.
For each method, we rank the metrics by their importance scores, then compute the intersection of the top-10 metrics across methods to identify a stable subset of highly influential quality metrics. Additionally, we calculate Pearson correlation coefficients between all metric pairs and between each metric and the target variable. This reveals both:
• Which metrics are most associated with security bugs.
• Which metrics are highly correlated with each other (potential redundancy).
4.2 RQ2 for Statistical Analysis of Metric Values
For RQ2, we investigate whether specific ranges or thresholds of selected metrics are associated with a higher probability of a file being buggy. We focus on the subset of metrics that emerge as consistently crucial in the RQ1 analysis. For each of these metrics, we compute descriptive statistics separately for buggy and non-buggy files, including mean, standard deviation, minimum, maximum, median, and the first and third quartiles (Q1 and Q3). We then generate density and box plots to compare the distributions of metric values between the two groups. Density plots show the probability distributions of metric values for both classes, revealing differences in distribution shapes, and box plots display quartiles, medians, and outliers, providing an intuitive comparison of central tendency and spread. To statistically validate the observed differences, we apply the non-parametric Mann-Whitney U test [49], which assesses whether two independent samples are drawn from the same distribution. We choose this test as it is a popular nonparametric one used in several previous works in bug and software analysis to test whether two samples are likely to derive from the same population (i.e., that the two populations have the same shape) [50,51]. This test is appropriate for our data, as it does not assume normality and only requires independent observations. To avoid dominance of the majority class, we first perform random undersampling of non-buggy files to obtain a balanced sample and then draw a random subset of this balanced data for the test. For each metric, we test the null hypothesis that the distributions of values for buggy and non-buggy files are equal, against the alternative that they differ.
Test Details:
• Null Hypothesis (
• Alternative Hypothesis (
• Significance level:
• Test choice rationale: Mann-Whitney U is a non-parametric test appropriate for our data because:
– It does not assume normal distribution.
– It is robust to outliers.
– It tests whether two independent samples come from the same distribution.
– It is widely used in software engineering research [50,51].
4.3 RQ3: Machine Learning Models
To address RQ3, we evaluate the ability of various machine learning models to predict whether a given file is buggy solely from its quality metrics. We consider eleven widely used classification algorithms:
1.
2. Decision Tree: Single tree classifier (max_depth = 3).
3. Random Forest: Ensemble of decision trees (n_estimators = 10, max_depth = 3).
4. Multi-layer Perceptron (MLP): Neural network (activation = “relu”, solver = “adam”).
5. AdaBoost: Boosting ensemble (n_estimators = 50).
6. XGBoost: Gradient boosting (default parameters).
7. Naïve Bayes: Probabilistic classifier.
8. Quadratic Discriminant Analysis (QDA): Gaussian classifier.
9. Support Vector Machine (Linear): Linear kernel SVM.
10. Support Vector Machine (RBF): Gaussian kernel SVM.
11. Logistic Regression: Linear probabilistic classifier.
Table 4 presents the hyperparameter configurations for each algorithm.
We adopt a time-series cross-validation strategy with five folds. In each fold, the data is partitioned chronologically so that training is performed on earlier commits and validation on later ones, thereby mimicking a realistic prediction scenario and avoiding information leakage from the future to the past. Within each training fold, we apply SMOTE [42] to balance the classes, as described previously. The validation and final test sets retain the original class distribution.
Model performance is assessed using six evaluation metrics: Accuracy, Precision, Recall, F1-score, Matthews Correlation Coefficient (MCC), and the Area Under the ROC Curve (ROC AUC). Accuracy provides a global view of the proportion of correctly classified instances, but can be misleading under strong class imbalance. Precision and Recall capture, respectively, the proportion of predicted buggy files that are truly buggy and the proportion of truly buggy files that are correctly identified. The F1-score combines both into a single harmonic mean. MCC provides a more balanced summary statistic that accounts for all four entries of the confusion matrix and is robust to class imbalance. Finally, the ROC AUC measures the model’s discriminative power across all possible decision thresholds. Each evaluation metric provides different insights (Where: TP = True Positives, TN = True Negatives, FP = False Positives, FN = False Negatives):
1. Accuracy: Overall proportion of correct predictions.
Note: Can be misleading with imbalanced data.
2. Precision: Proportion of predicted bugs that are actual bugs.
Interpretation: Low precision means many false alarms.
3. Recall (Sensitivity): Proportion of actual bugs that are detected.
Interpretation: Low recall means missing real vulnerabilities. Critical for security applications.
4. F1-Score: Harmonic mean of precision and recall.
Balances precision and recall.
5. Matthews Correlation Coefficient (MCC): Balanced measure even with class imbalance.
Range:
6. ROC-AUC: Area under the Receiver Operating Characteristic curve.
• Measures ability to discriminate between classes across all thresholds.
• Range: 0.5 (random) to 1.0 (perfect).
• Critical for security applications as it’s threshold-independent.
In security contexts, false negatives (missing real vulnerabilities) are more costly than false positives (false alarms). Therefore, we prioritize Recall and ROC-AUC when evaluating model performance. High recall ensures we detect most security bugs, even if it means investigating some false alarms.
Following best practices for data preprocessing, we:
1. Removed duplicate files (identical files across commits that remained unchanged).
2. Verified data types and handled missing values (none found).
3. Applied SMOTE only to training folds (not test data).
4. Maintained temporal ordering throughout all processing steps.
In this section, we present and discuss the results obtained for each research question. For each RQ, we first report the quantitative findings and then discuss their implications. We conclude with an overall summary of the main findings.
5.1 RQ1: Quality Metrics Correlation with Security Bugs
Research Question: Which specific quality metrics are most strongly correlated with predicting security bugs?
The feature importance analyses reveal a consistent pattern across the five methods. Although each technique ranks metrics according to its own criterion, several metrics recur among the top-ranked features.
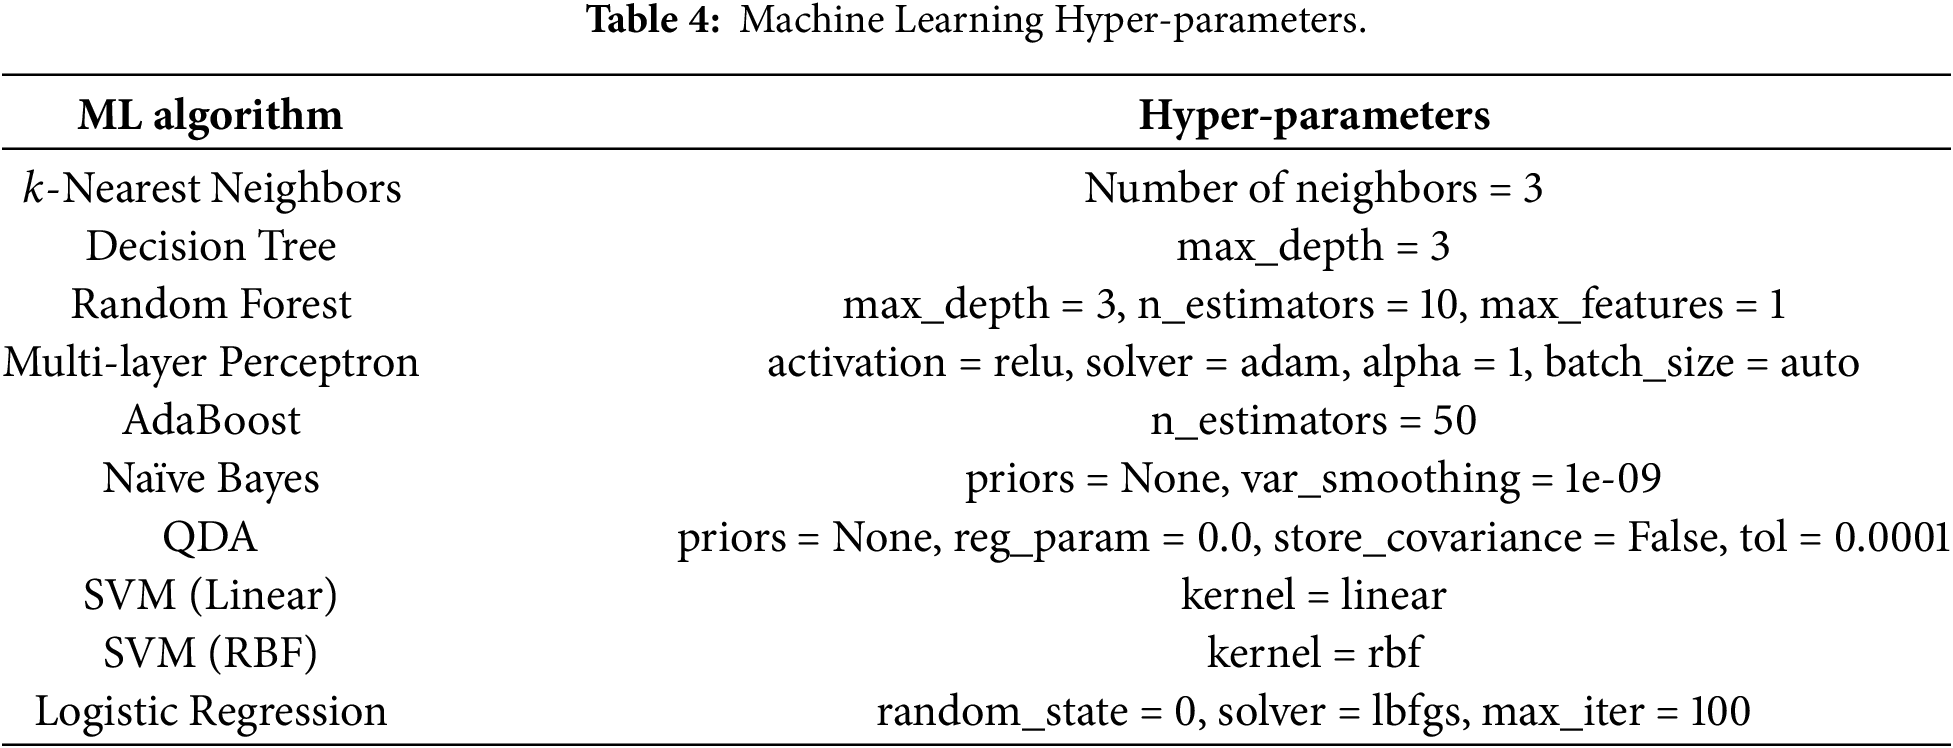
By intersecting the top-10 metrics obtained from Linear Regression, Logistic Regression, XGBoost, ANOVA F-score, and Boruta, we identify six metrics that are consistently highlighted as necessary: CountStmtExe, SumCyclomatic, SumCyclomaticModified, AvgCyclomaticModified, CountDeclClass, and the categorical variable extension, which encodes the programming language or file type. These metrics describe, respectively, the number of executable statements in a file, different variants of cyclomatic complexity, and the number of class declarations. Tables 5–9 present the ranked importance of all 25 quality metrics according to each method. Specifically, Table 5 shows Linear Regression coefficients, Table 6 reports XGBoost feature importance scores, Table 7 presents Logistic Regression coefficients, Table 8 displays ANOVA F-scores and Table 9 summarizes Boruta algorithm results.
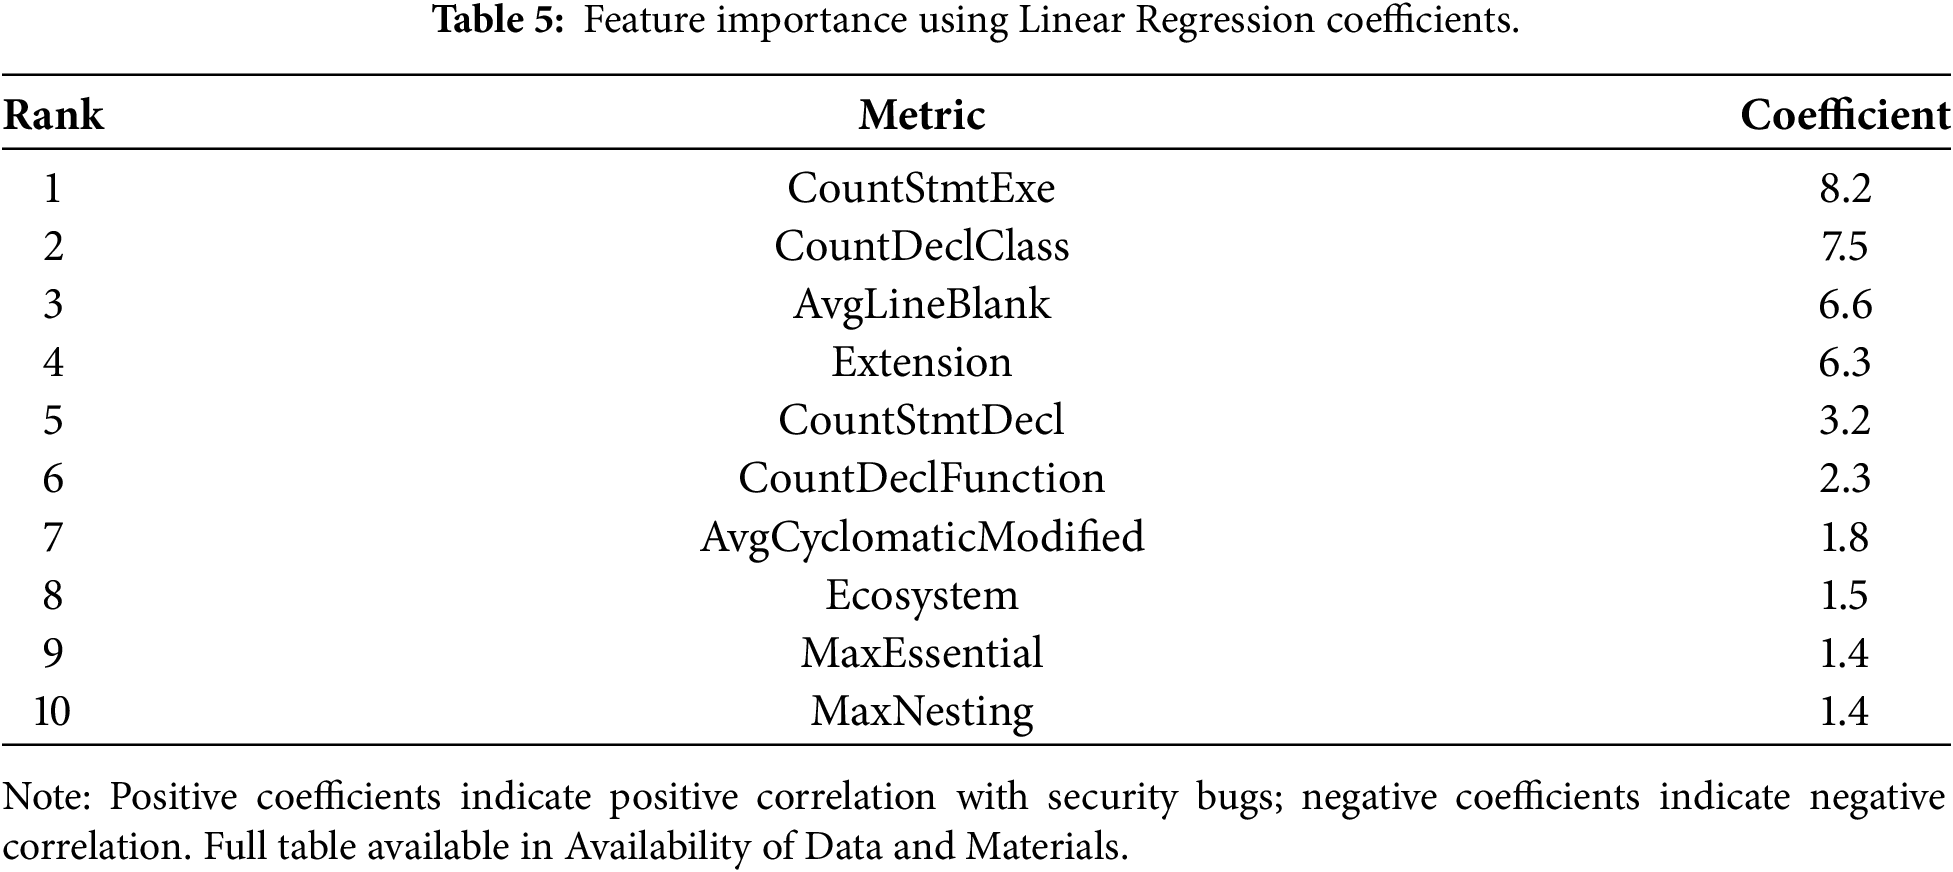
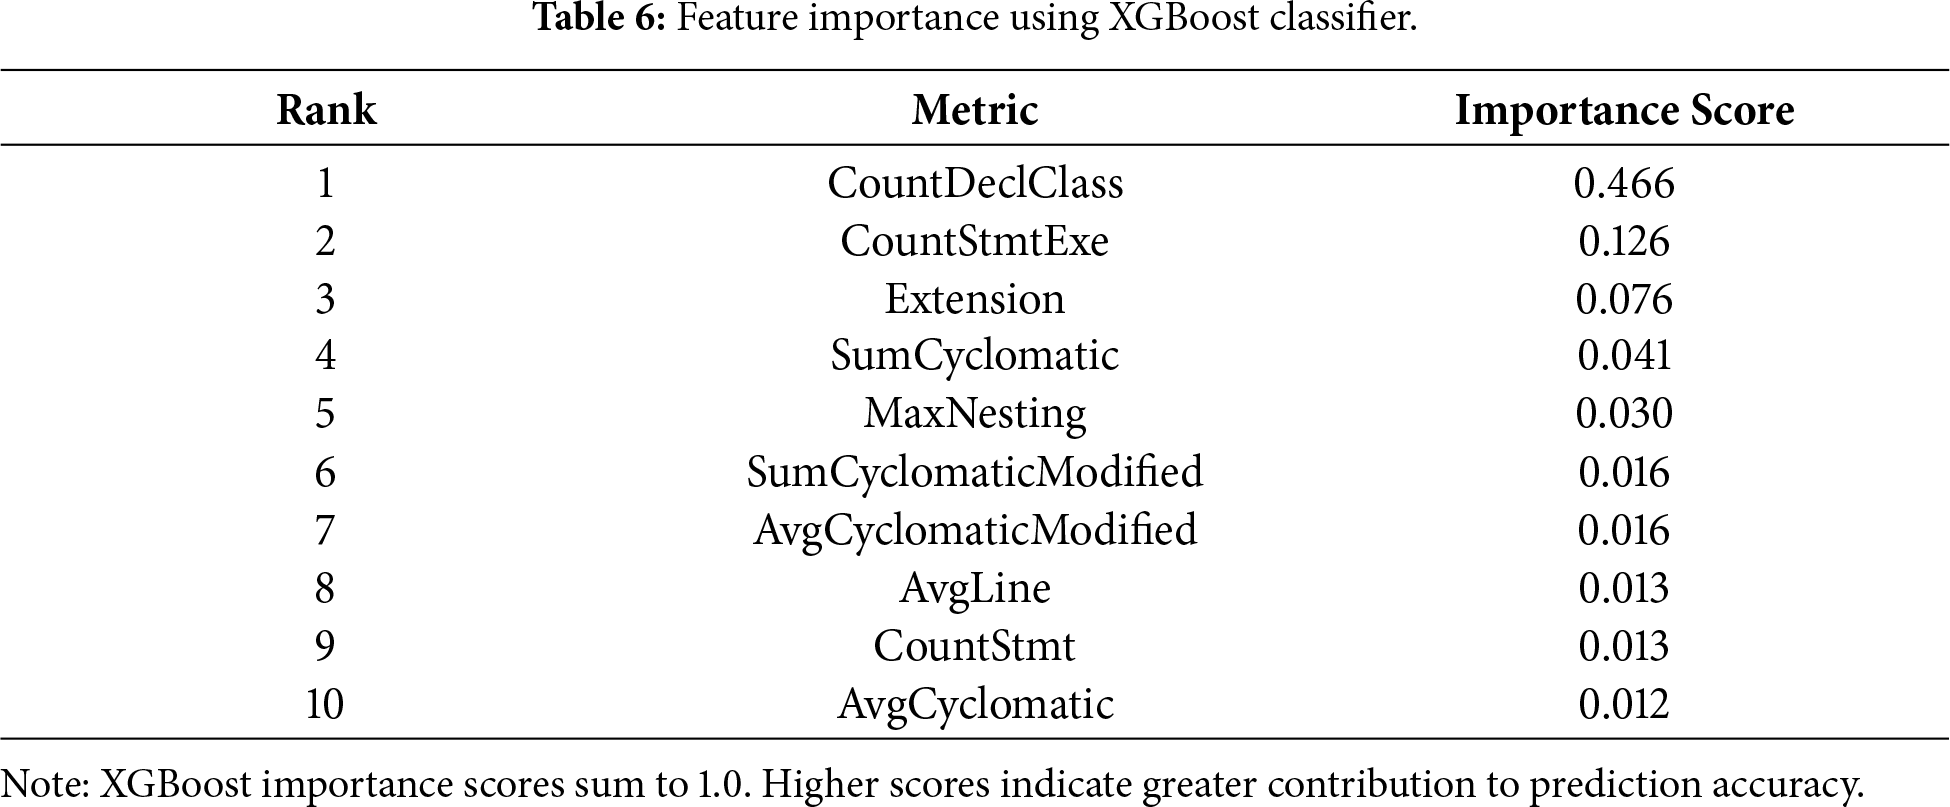
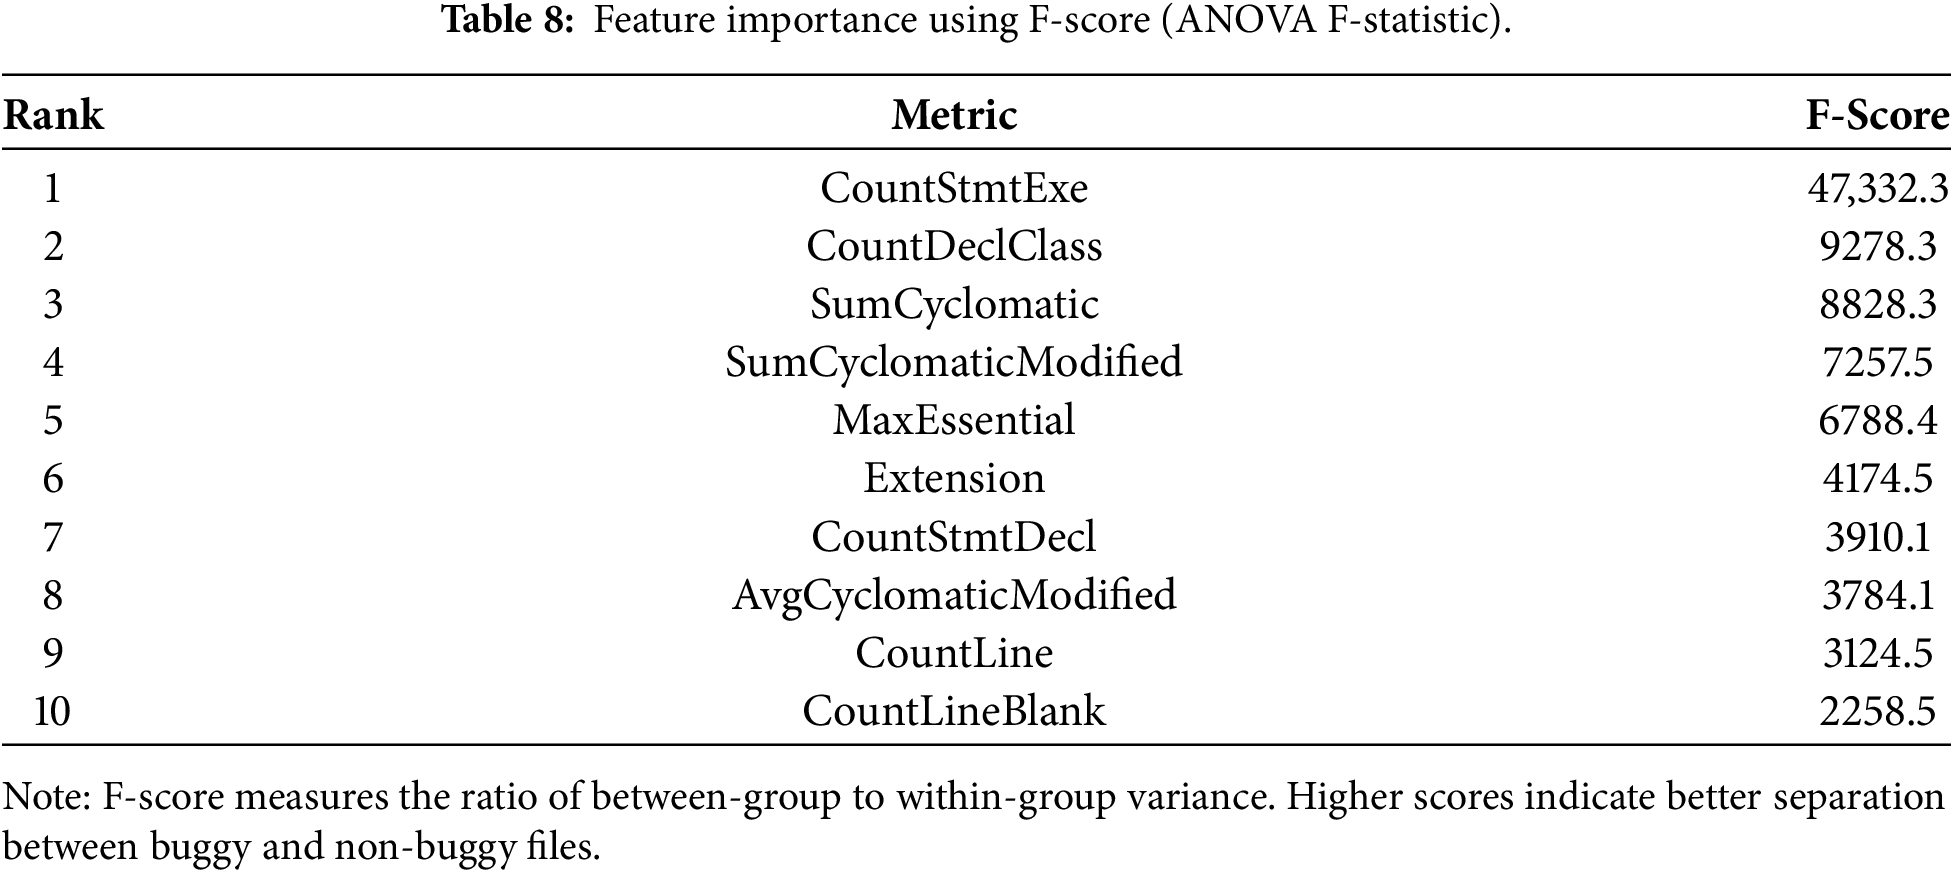
Table 10 synthesizes the top 10 features identified by each method. Despite different ranking mechanisms, we observe strong consensus on several metrics.
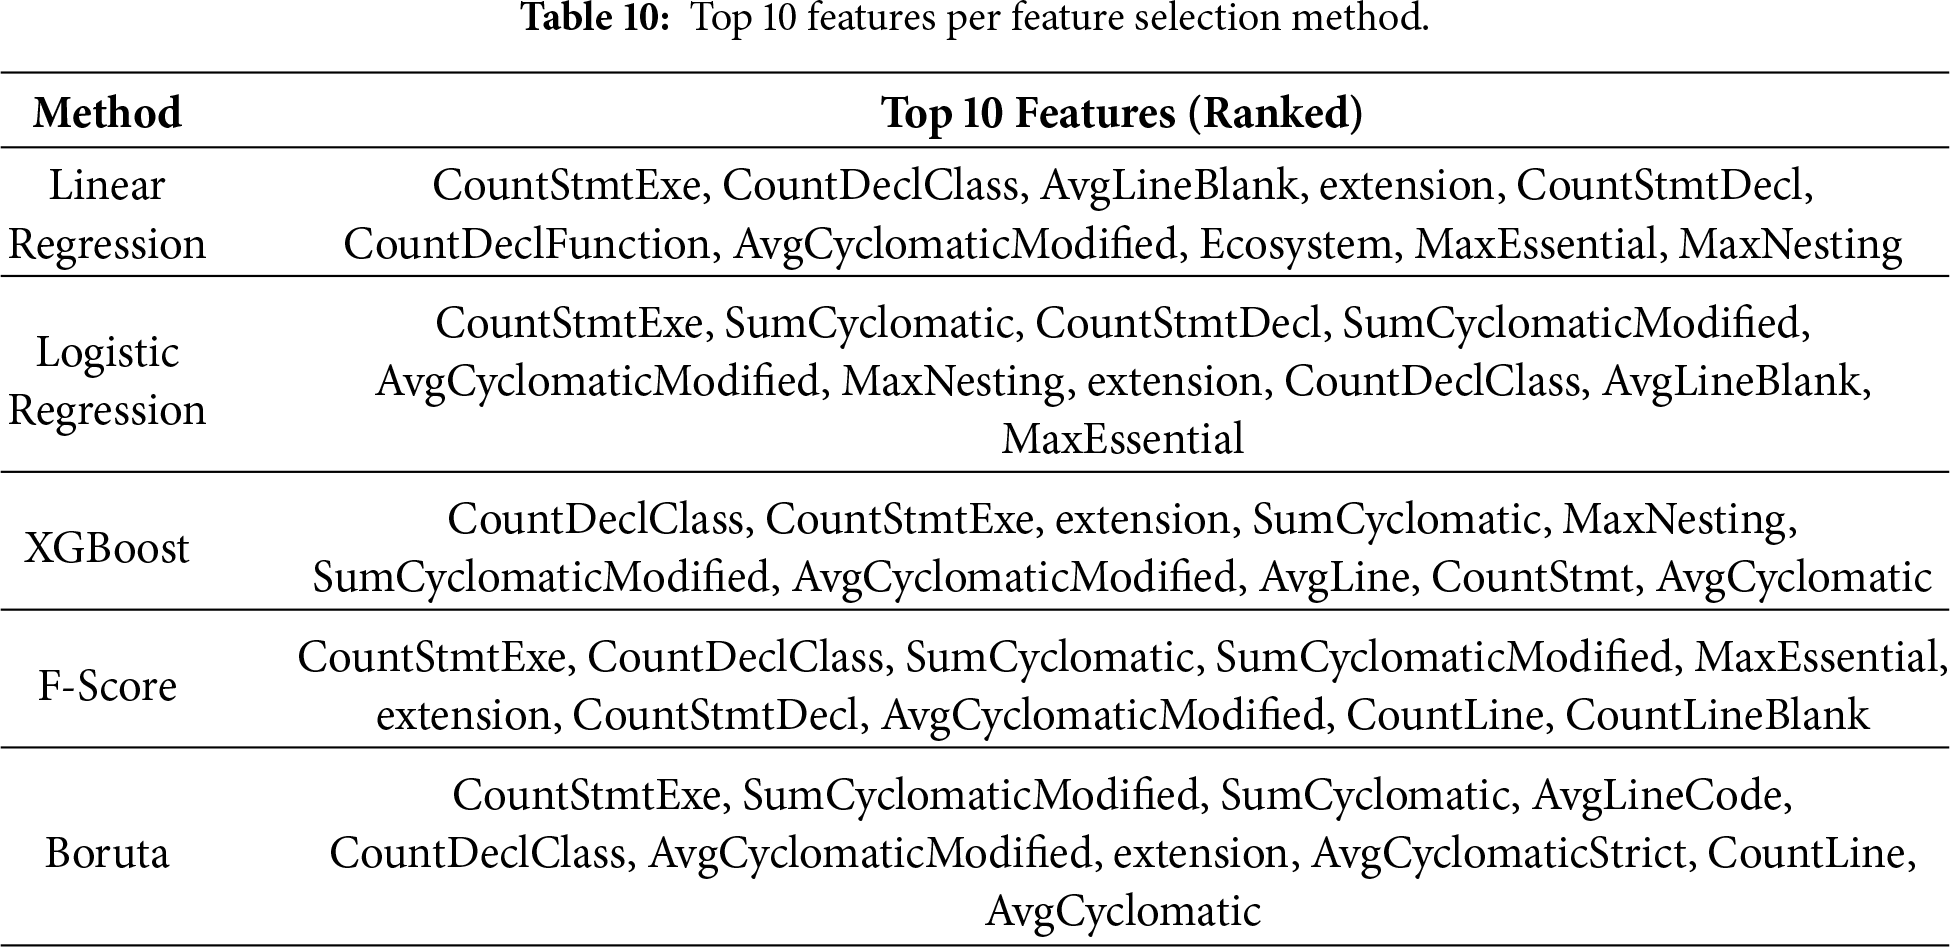
Analyzing the intersection of metrics appearing in the top 10 across all five methods, we identify six core metrics consistently ranked highly:
1. CountStmtExe (Executable statements count): ranked #1 or #2 in all methods.
2. CountDeclClass (Class declarations count): ranked between #1 and #8 across methods.
3. SumCyclomatic (Total cyclomatic complexity): ranked between #2 and #4 in four methods.
4. SumCyclomaticModified (Total modified cyclomatic complexity): ranked between #2 and #6 in four methods.
5. AvgCyclomaticModified (Average modified cyclomatic complexity): ranked between #5 and #8 in all methods.
6. Extension (File extension/programming language): ranked between #3 and #7 in all methods.
This convergence across multiple feature selection techniques suggests that code size and control-flow complexity are strongly associated with the presence of security bugs, regardless of the specific modeling assumptions underlying each method. Other metrics, such as various line-count measures or declaration counts, also appear as relevant in specific methods but do not show the same level of consistency.
The results of RQ1 confirm and extend observations made in prior defect-prediction studies: larger and more complex code units tend to be more prone to defects. In our context, the fact that cyclomatic complexity metrics and the number of executable statements are consistently ranked among the most influential features indicates that code structure is also a key factor in security-relevant defects. The consistent identification of these six metrics across diverse feature selection methods provides strong evidence of their fundamental relationship with security bugs. We interpret each metric as follows.
CountStmtExe (Executable Statements).
This metric’s dominant ranking across all methods (achieving the highest F-score of 47,332.3) indicates that files with more executable statements are substantially more likely to contain security bugs. This aligns with the intuition that larger, more complex code provides more opportunities for security-relevant errors. Each additional executable statement represents a potential location for vulnerabilities such as input validation failures, improper error handling, or unsafe operations.
CountDeclClass (Class Declarations).
The strong performance of the class declaration count suggests that files defining multiple classes exhibit a higher security risk. This may reflect:
• architectural complexity in files mixing multiple class definitions,
• “god classes” or utility files that handle diverse responsibilities,
• poor separation of concerns, making security boundaries harder to maintain.
Cyclomatic Complexity Metrics (SumCyclomatic, SumCyclomaticModified, AvgCyclomaticModified).
The prominence of multiple cyclomatic complexity variants confirms established software engineering principles: complex control flow increases the likelihood of vulnerabilities. High cyclomatic complexity indicates:
• multiple execution paths requiring comprehensive security validation,
• difficulty in reasoning about all possible states and transitions,
• increased cognitive load during code review, making vulnerabilities easier to overlook,
• greater surface area for logic errors that can be exploited.
This finding is consistent with McCabe’s10 research, which demonstrates that complexity directly correlates with security weaknesses.
Extension (Programming Language).
The significance of the file extension indicates that security bug prevalence varies by programming language. This likely reflects:
• Language-specific vulnerability patterns (e.g., memory safety issues in C/C++, injection attacks in PHP),
• Different security practices and tool support across language communities,
• Inherent language characteristics (memory management, type systems, etc.).
The inclusion of extension among the essential features suggests that programming language characteristics modulate how complexity and size translate into security risk. For instance, a given level of cyclomatic complexity may pose greater security challenges in languages that heavily use dynamic features or reflection. Conversely, statically typed languages with strict structural constraints may better tolerate the same complexity level. While a detailed analysis of language-specific effects is beyond the scope of this paper, the importance of extension indicates an interesting direction for future work.
The reason for employing multiple feature selection methods is that each technique has different assumptions and biases:
• Linear/Logistic Regression: assumes linear relationships, sensitive to feature scaling.
• XGBoost: captures non-linear interactions, ranks by prediction contribution.
• F-Score: univariate analysis, evaluates each feature independently.
• Boruta: accounts for feature interactions via Random Forest, robust to noise.
Developers and security practitioners should prioritize monitoring these six metrics during code review and continuous integration:
1. Flag files with high executable statement counts for security review.
2. Scrutinize files defining multiple classes for architectural security issues.
3. Enforce cyclomatic complexity thresholds in coding standards.
4. Apply language-specific security analysis tools appropriate to file extensions.
While these metrics show strong correlation, correlation does not imply causation. High complexity may not directly cause vulnerabilities but rather indicates code characteristics that make vulnerabilities more likely or harder to prevent. Additionally, these metrics are most useful in combination; no single metric should be used in isolation for security assessment. Overall, RQ1 provides empirical evidence that a relatively small subset of quality metrics accounts for most of the variance in security bugs. This subset forms the basis for the more fine-grained analyses in RQ2 and for the feature set used in the predictive models of RQ3.
5.2 RQ2: Critical Thresholds for Quality Metrics
Research Question: Do specific values or thresholds of quality metrics indicate a higher probability of security bug occurrence?
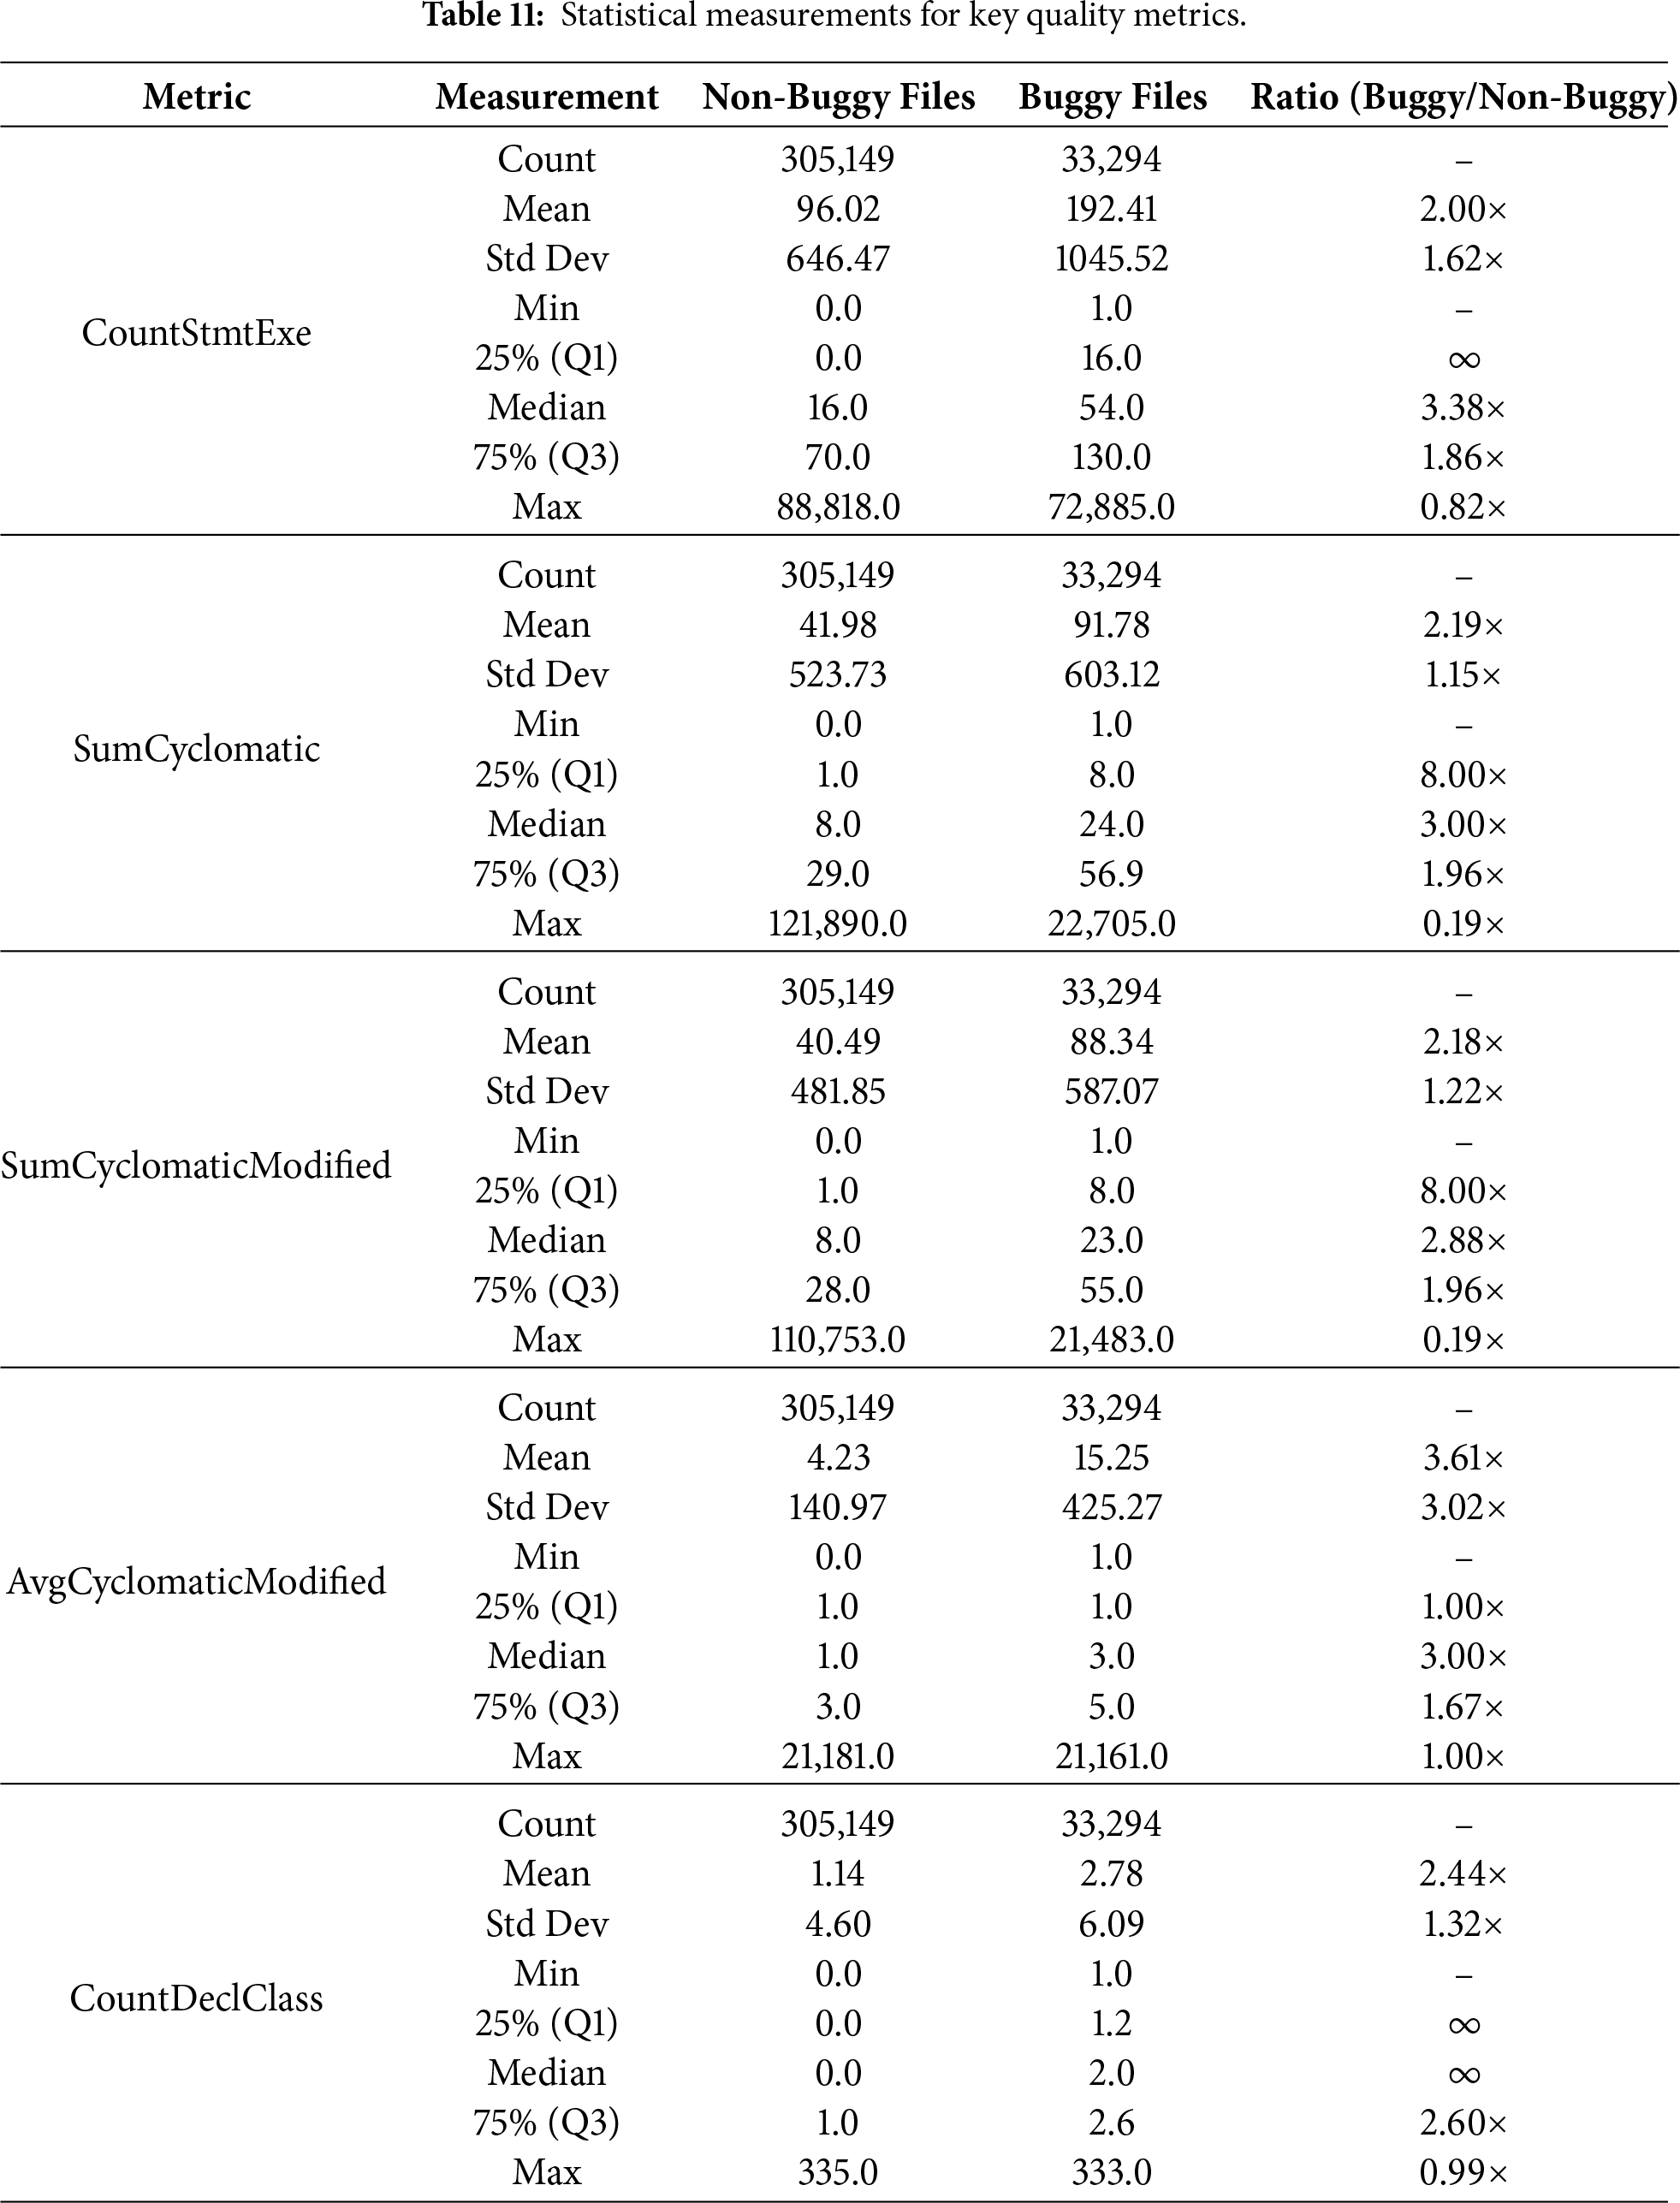
To address RQ2, we analyze the distributions of the five most consistently important metrics identified in RQ1 (excluding file extension, as it is categorical). We conducted a comprehensive statistical analysis comparing the distributions of quality metrics between buggy and non-buggy files. Across all metrics, we observe that the median values for buggy files are substantially higher than those for non-buggy files. For example, the median number of executable statements (CountStmtExe) is 16 for non-buggy files and 54 for buggy files, that is, more than a factor of three. A similar pattern holds for SumCyclomatic and SumCyclomaticModified. Density plots and box plots visually confirm that the distributions of buggy and clean files differ markedly, with buggy files exhibiting heavier tails and greater concentration in higher-value ranges. Table 11 presents detailed statistical measurements for five key metrics, computed separately for files without security bugs (305,148 files) and files with security bugs (33,294 files).
To assess whether a single ecosystem drives the observed distribution shifts, we replicated the RQ2 analysis across individual ecosystems. For each ecosystem, we compared buggy and non-buggy files using the same non-parametric statistical framework and descriptive statistics. Across all ecosystems, buggy files consistently exhibit higher values for the most influential metrics, particularly executable statement count and cyclomatic complexity measures. While absolute metric values differ due to language conventions and project characteristics, the relative differences between buggy and non-buggy files remain stable. This consistency indicates that the relationship between structural code properties and security bugs is not confined to a specific language or platform. Table 12 shows that the median ratios between buggy and non-buggy files exceed one across all ecosystems for the most discriminative metrics. The magnitude of these ratios varies depending on ecosystem characteristics. For instance, ecosystems that rely on low-level or strongly typed languages (e.g., OSS-Fuzz and NuGet) exhibit more pronounced ratios. In contrast, dynamic-language ecosystems such as npm show more moderate differences. These variations reflect language-specific development practices rather than contradictions of the general trend.
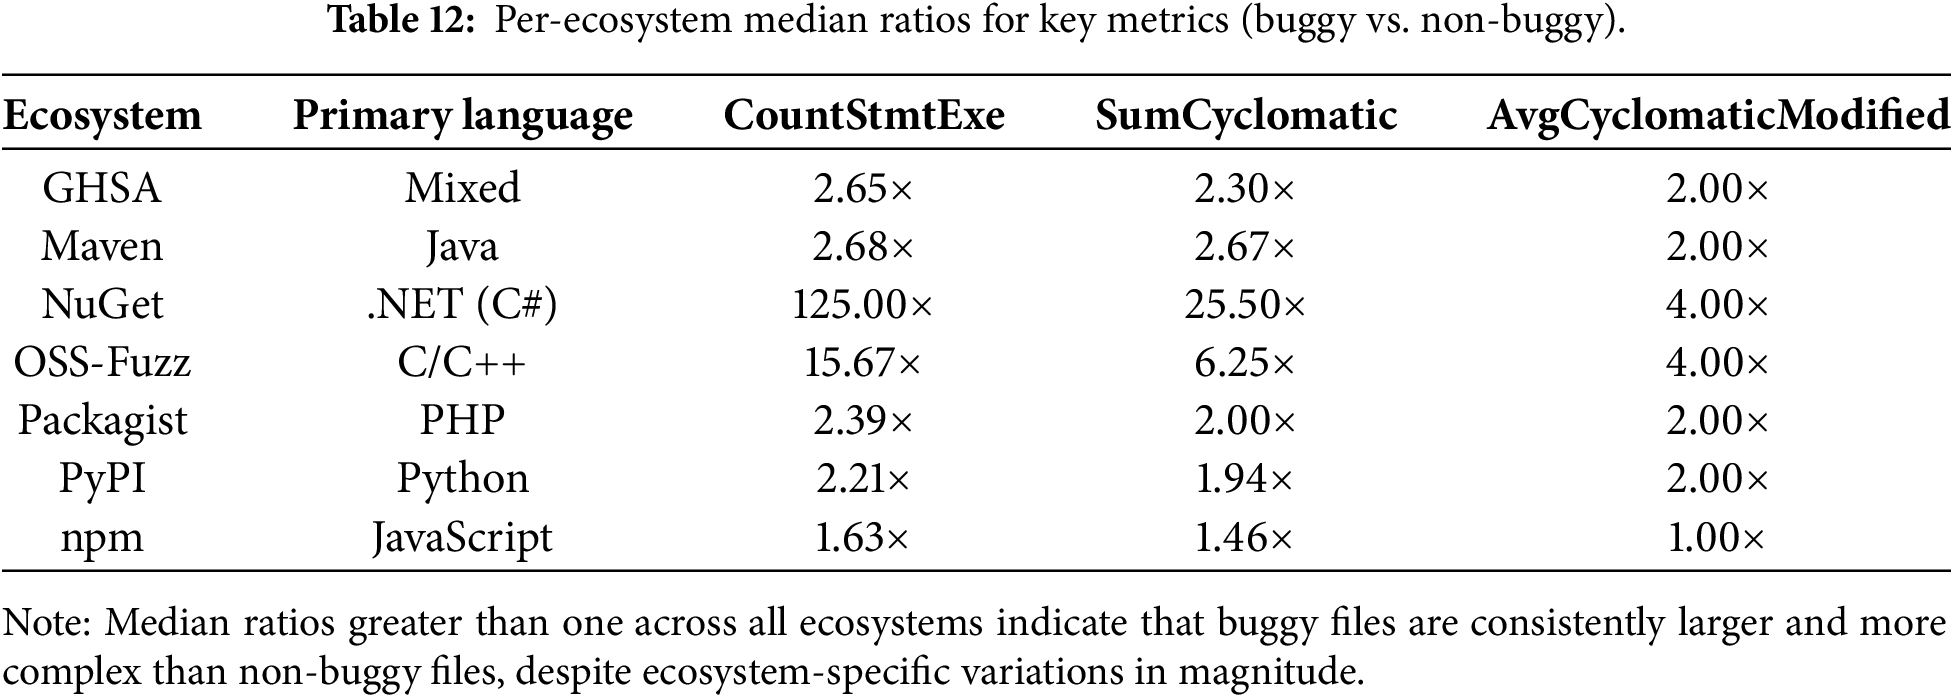
The exceptionally high median ratio observed for NuGet (125
It is important to note that ecosystem-specific ratios (Table 12) describe relative distributional shifts within individual ecosystems, whereas effect sizes (Table 13) quantify the global strength of these differences across the full dataset.
To further assess the generalizability of our findings, we examined ecosystem-specific patterns using two complementary perspectives. First, distribution-based analyses confirmed that key metrics consistently differentiate buggy from non-buggy files across all ecosystems. Second, we assessed the robustness of the global prediction model when applied to ecosystem-specific subsets, reflecting a realistic deployment scenario in which a single trained model is used for heterogeneous projects.
While predictive performance may vary due to ecosystem-specific characteristics such as language diversity and class imbalance, the model maintains robust performance across ecosystems. These observations indicate that the identified relationships between software quality metrics and security bugs generalize beyond individual languages or platforms, and suggest that ecosystem-aware calibration may further enhance practical effectiveness.
Key observation: Across all five metrics, the median values for buggy files are consistently between 2.88
Figs. 2–6 present density plots comparing the distribution of metric values between buggy (red curve) and non-buggy (green curve) files.
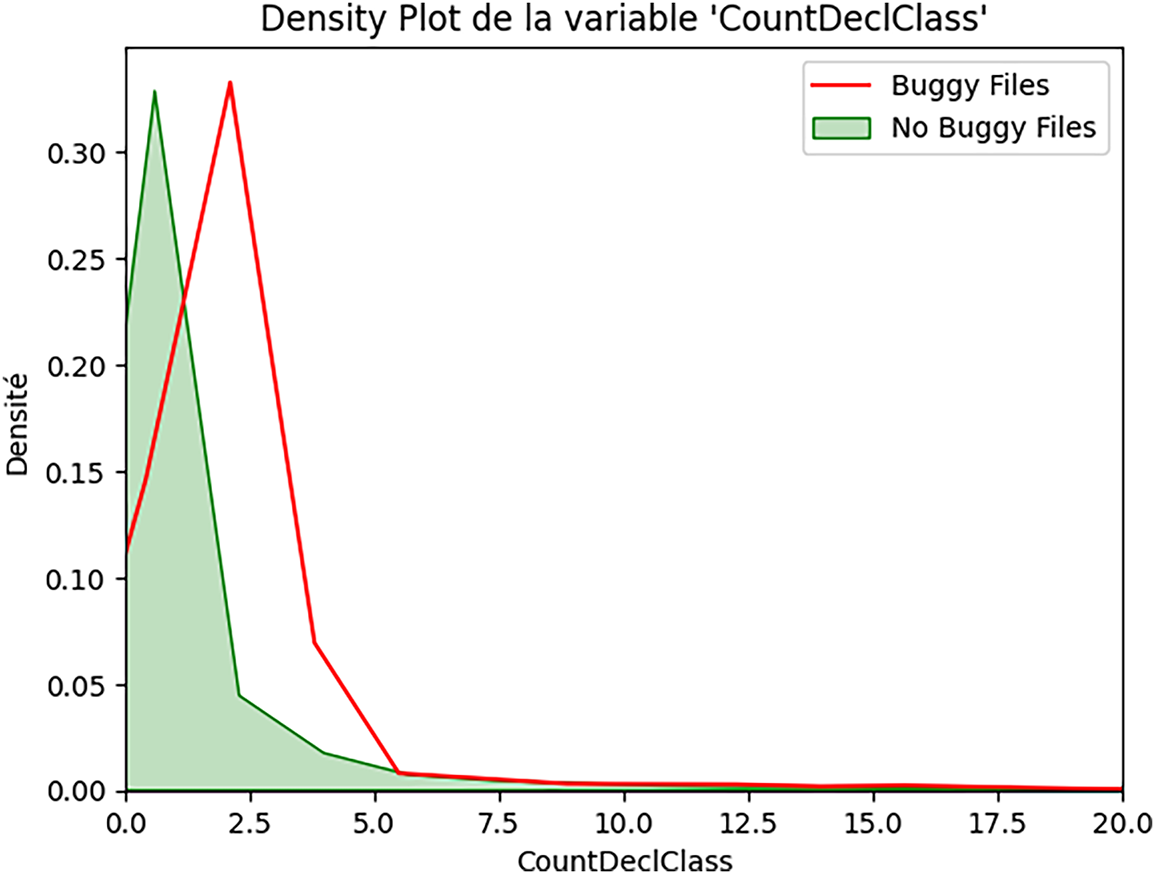
Figure 2: Class-level complexity and security bugs (CountDeclClass).
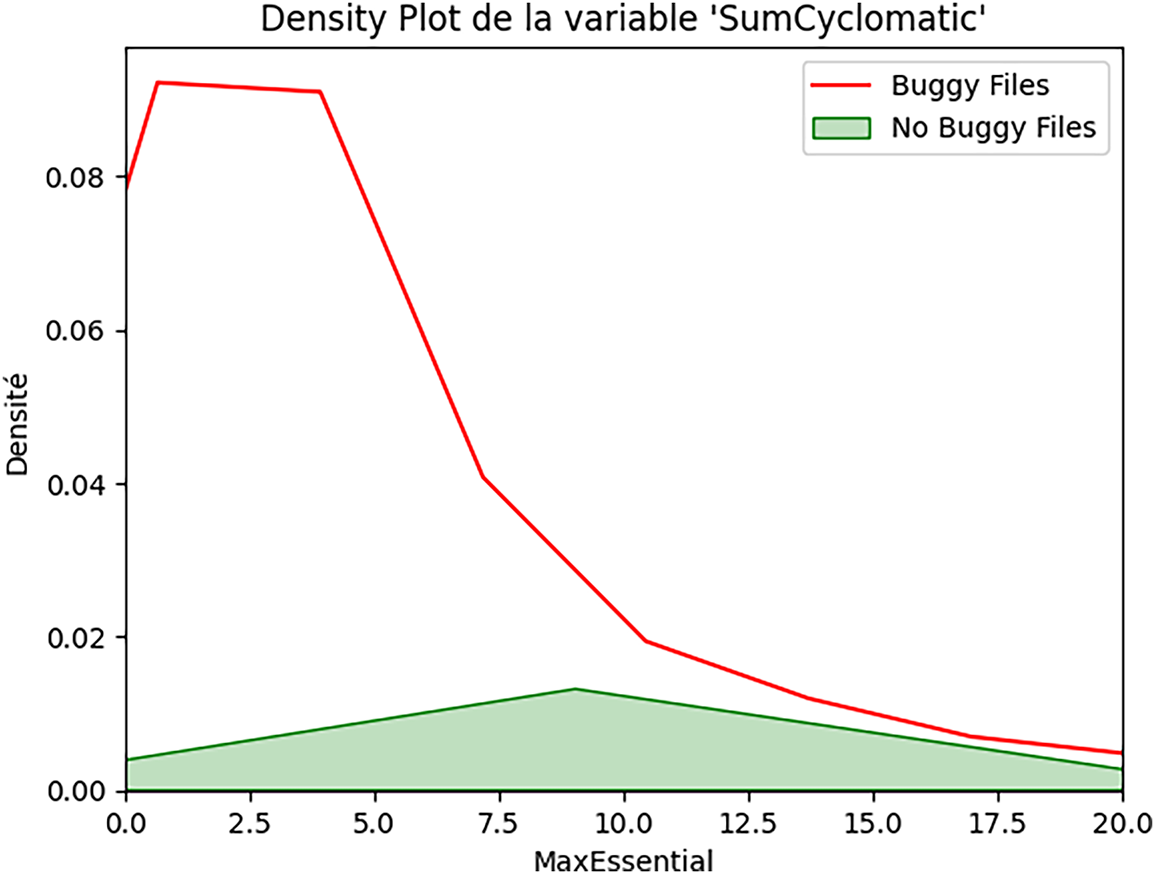
Figure 3: Aggregate control-flow complexity and security bugs (SumCyclomatic).
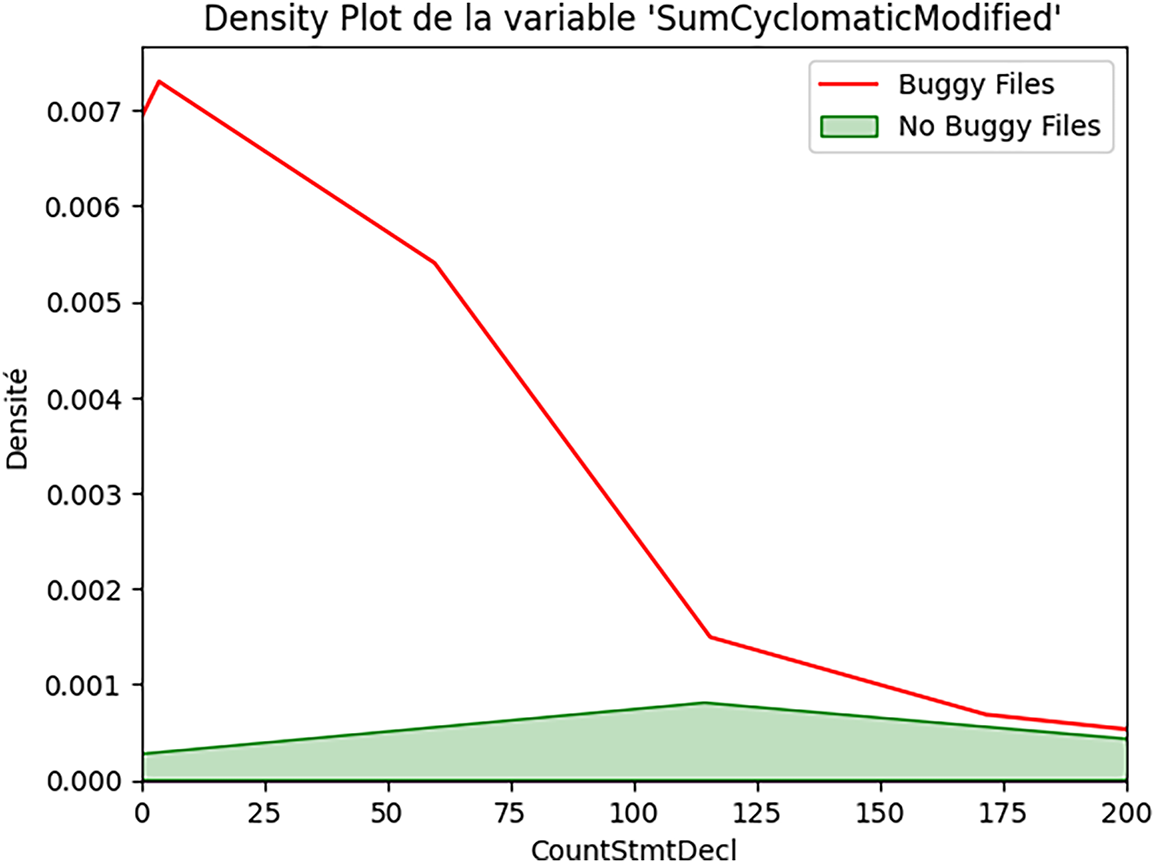
Figure 4: Modified cyclomatic complexity and security bugs (SumCyclomaticModified).
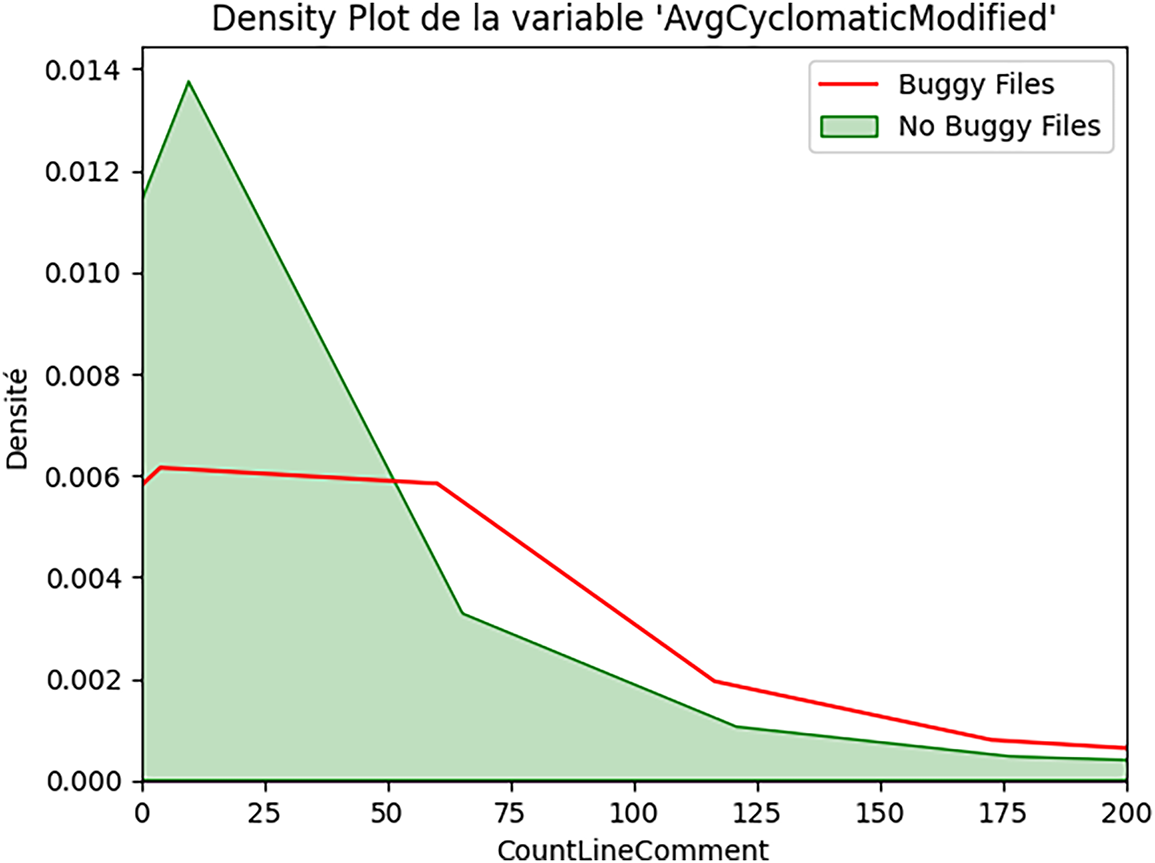
Figure 5: Average function complexity and security bugs (AvgCyclomaticModified).
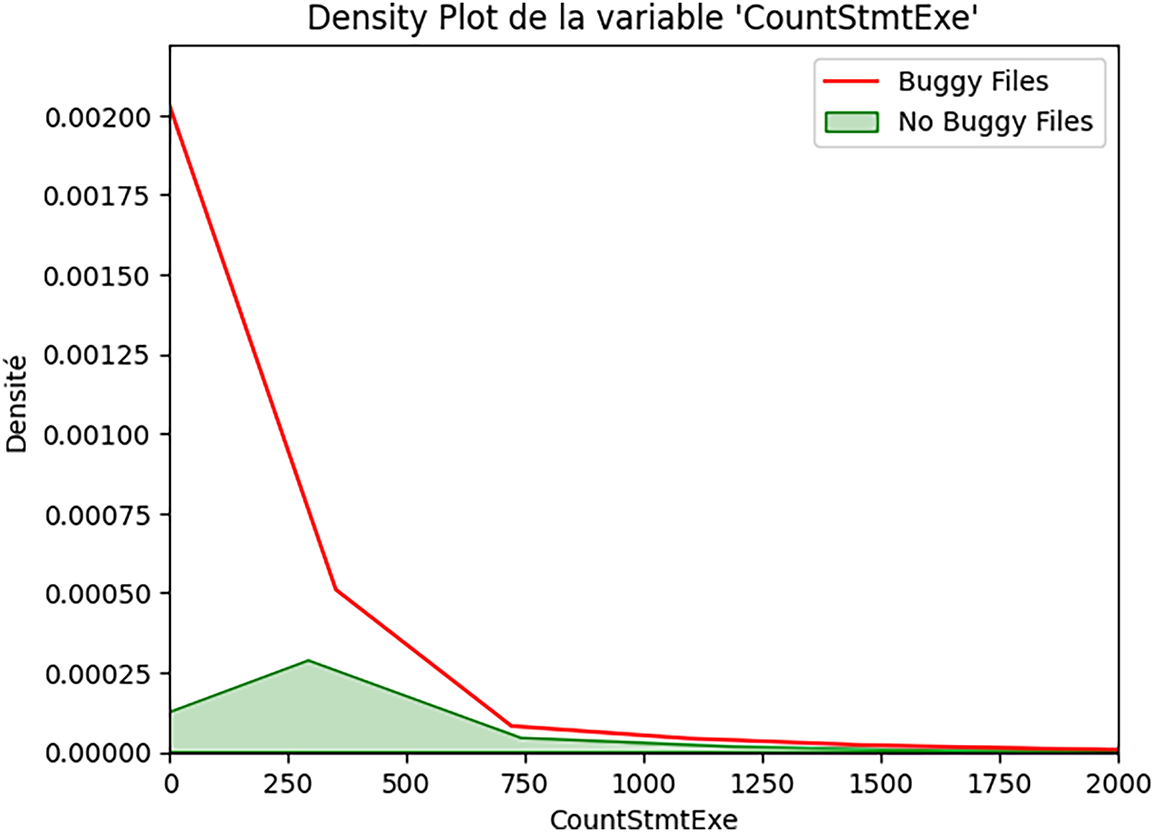
Figure 6: Executable code size and security bugs (CountStmtExe).
The density plot reveals:
• Non-buggy files: strong concentration at 0-1 class declarations, with a sharp peak near zero.
• Buggy files: broader distribution extending to higher values, peak around 1-2 classes.
This suggests that files defining multiple classes show substantially elevated security risk.
The distribution for SumCyclomatic (Fig. 3) shows:
• Non-buggy files: heavily right-skewed, most files under 50 total complexity.
• Buggy files: similar shape but shifted right, extending to higher complexity values.
There is a clear separation: buggy files consistently exhibit higher cyclomatic complexity sums.
The pattern for SumCyclomaticModified (Fig. 4) is similar to that of SumCyclomatic:
• Both distributions are right-skewed;
• Buggy files show a notable shift toward higher complexity values;
• There is substantial overlap but distinct peaks.
For AvgCyclomaticModified (Fig. 5), we observe a distinctive pattern:
• Non-buggy files: extreme concentration at very low values (near 1).
• Buggy files: broader distribution with heavier tail toward higher complexity.The median difference (1.0 vs. 3.0) indicates that buggy files have a complexity that is 3 times the average.
For CountStmtExe (Fig. 6), we observe the most pronounced separation:
• Non-buggy files: sharp peak near zero, rapid decline.
• Buggy files: broader distribution, substantial mass in the 50–200 range.
The median difference (16 vs. 54 executable statements) is substantial.
Box plots provide a complementary view. Figs. 7–11 present box plots for the five metrics, showing quartiles and outliers for both classes.
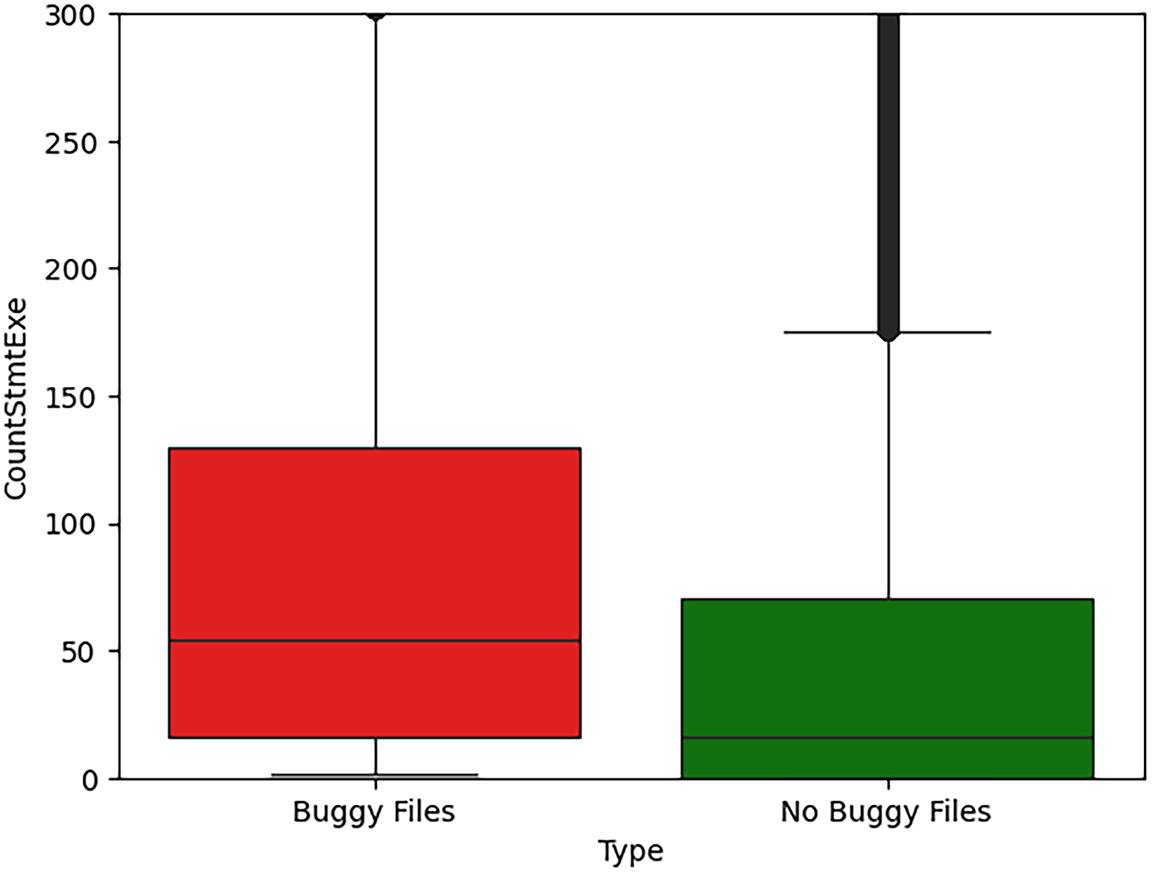
Figure 7: Executable statement count as a security risk indicator (CountStmtExe).
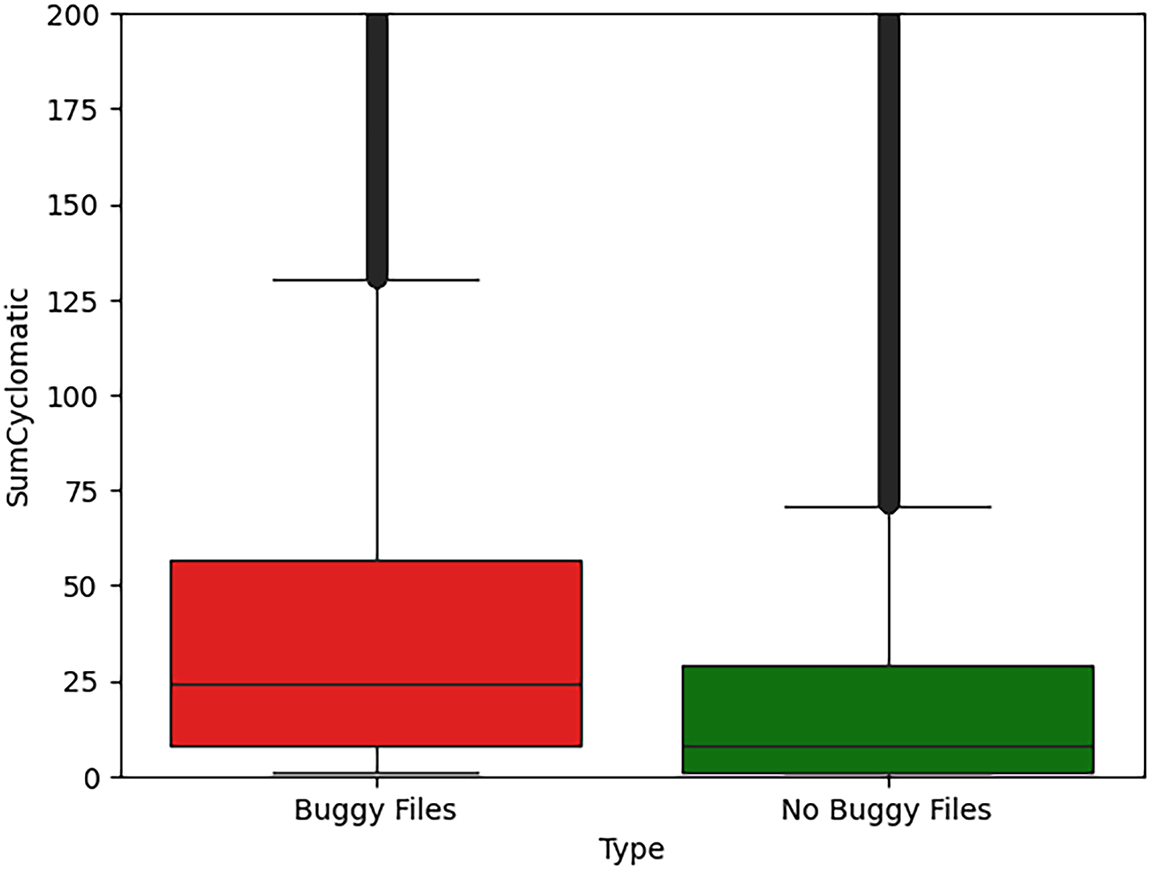
Figure 8: Control-flow complexity distribution in buggy vs. non-buggy files (SumCyclomatic).
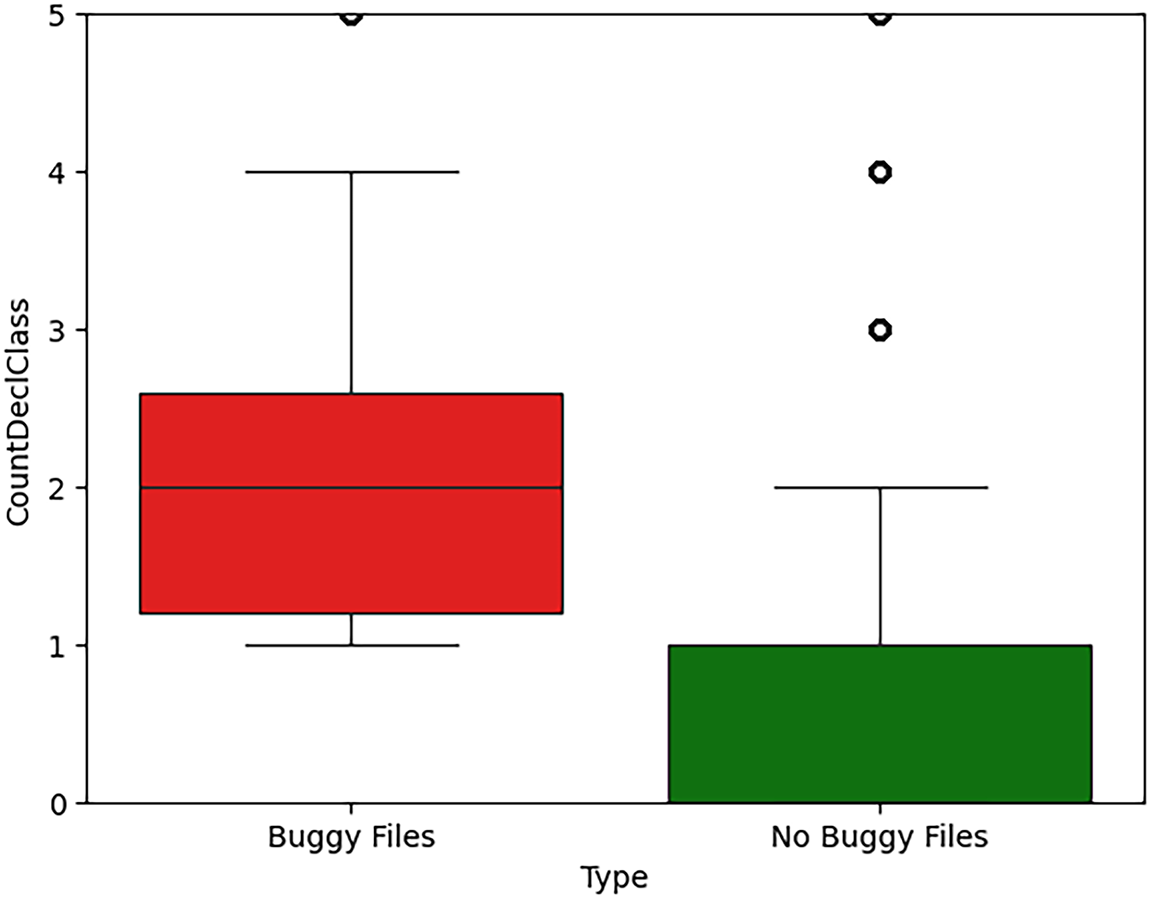
Figure 9: Class declaration count and security-prone code (CountDeclClass).
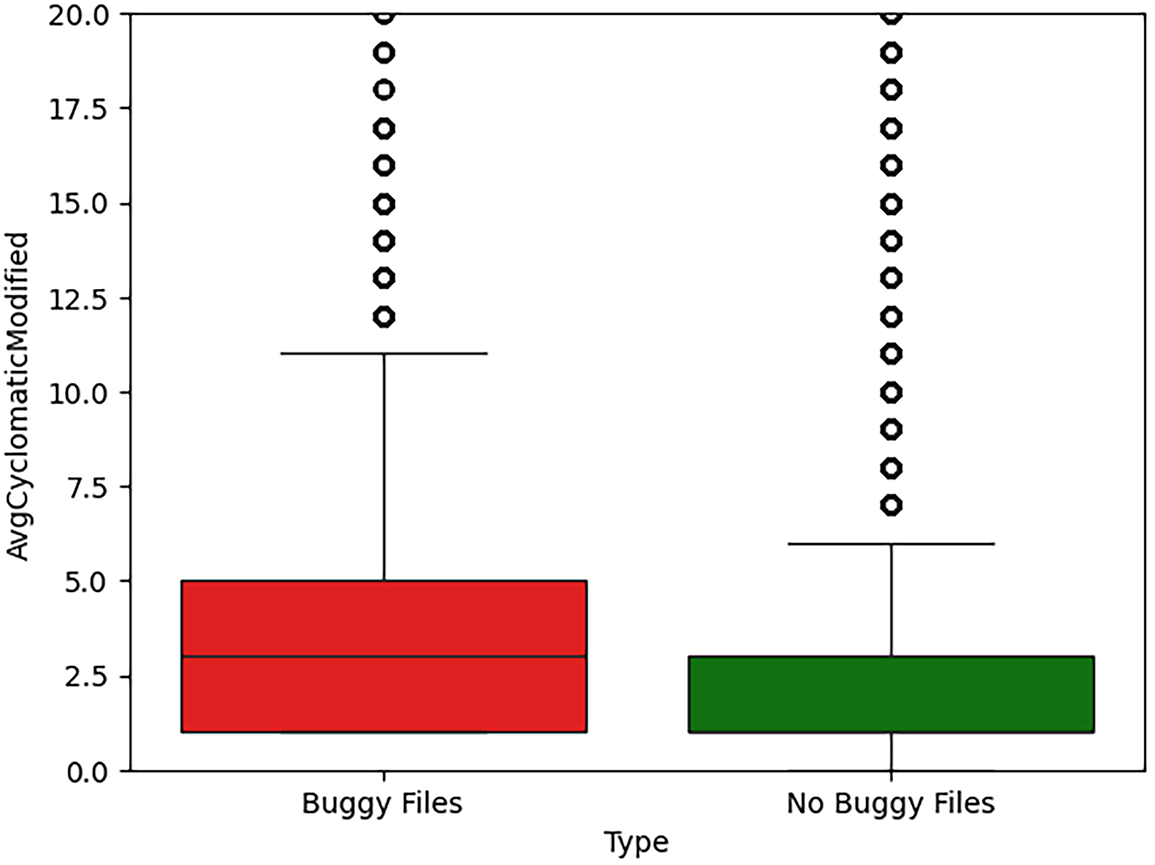
Figure 10: Average function complexity in security-prone files (AvgCyclomaticModified).
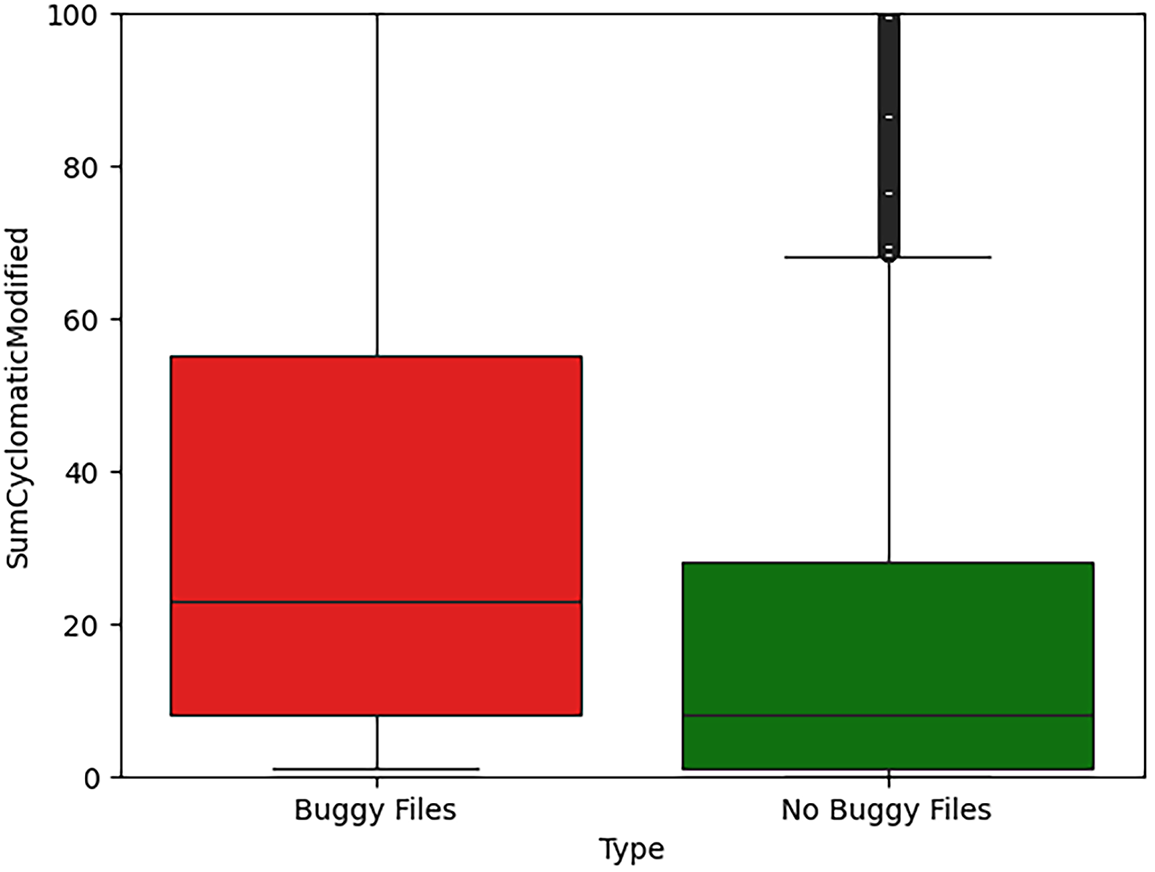
Figure 11: Aggregate modified cyclomatic complexity and security bugs (SumCyclomaticModified).
Key observations for CountStmtExe (Fig. 7) include:
• Q1 (25%): non-buggy = 0, buggy = 16 (substantial baseline difference).
• Median: non-buggy = 16, buggy = 54 (3.38
• Q3 (75%): non-buggy = 70, buggy = 130 (1.86
Both groups have extreme outliers, but buggy files show higher typical values.
For SumCyclomatic (Fig. 8), interquartile ranges show clear separation, with a median difference of 3.00
For CountDeclClass (Fig. 9), we observe a distinctive pattern:
• Non-buggy files: median of 0 (most files define no classes).
• Buggy files: median of 2.0 (typical buggy file defines multiple classes).
This suggests a clear threshold: files defining two or more classes warrant security scrutiny.
For AvgCyclomaticModified (Fig. 10):
• Non-buggy files: compact distribution, most files have average complexity near 1.
• Buggy files: wider distribution, median of 3.
This suggests that average function complexity
For SumCyclomaticModified (Fig. 11), the pattern is similar to SumCyclomatic, with clear separation in medians and quartiles. The 2.88
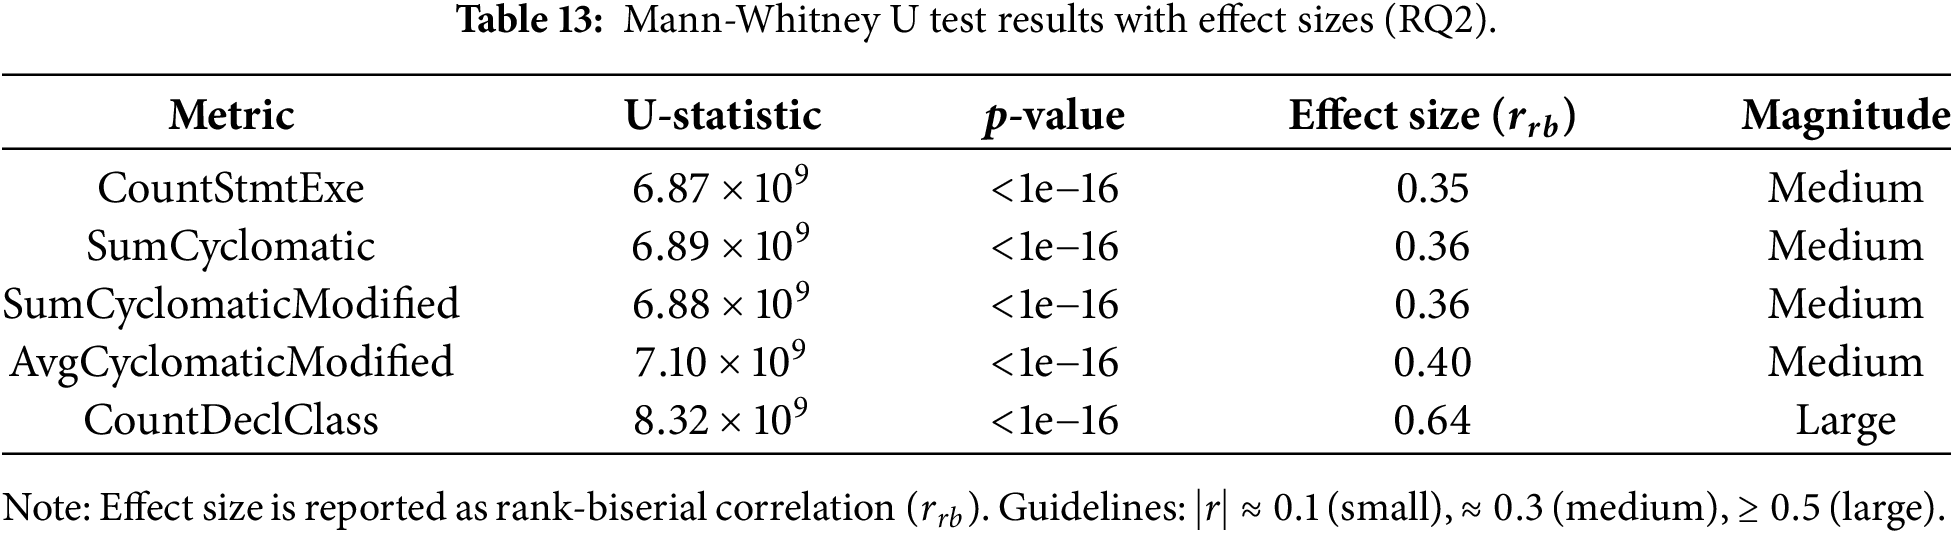
To confirm that the observed differences between buggy and non-buggy files are statistically significant rather than artifacts of random sampling, we conducted Mann-Whitney U tests for each metric. All examined metrics yield highly significant p-values, far below the conventional significance threshold of 0.05, leading us to reject the null hypothesis that buggy and non-buggy files follow identical distributions. While statistical significance confirms the existence of differences, effect size analysis provides a more practical estimate of their magnitude. As reported in Table 13, medium-to-large effect sizes are observed for the most influential metrics, indicating that the detected differences are not only statistically significant but also meaningful in practice. In particular, CountDeclClass exhibits a large effect size, highlighting the importance of structural class-level complexity as a strong indicator of security-prone code. Importantly, these distributional differences remain consistent across ecosystems. Although absolute metric values vary depending on language conventions and project characteristics, the relative shifts between buggy and non-buggy files persist across all ecosystems, supporting the generalizability of our findings beyond a single platform or language.
Test interpretation:
• Null Hypothesis (
• Alternative Hypothesis (
• Result: all p-values
All five metrics show statistically significant differences between buggy and non-buggy files, confirming that the observed patterns are not due to chance. Based on the median and Q3 values from buggy files, we propose threshold guidelines for security risk assessment, summarized in Table 14.
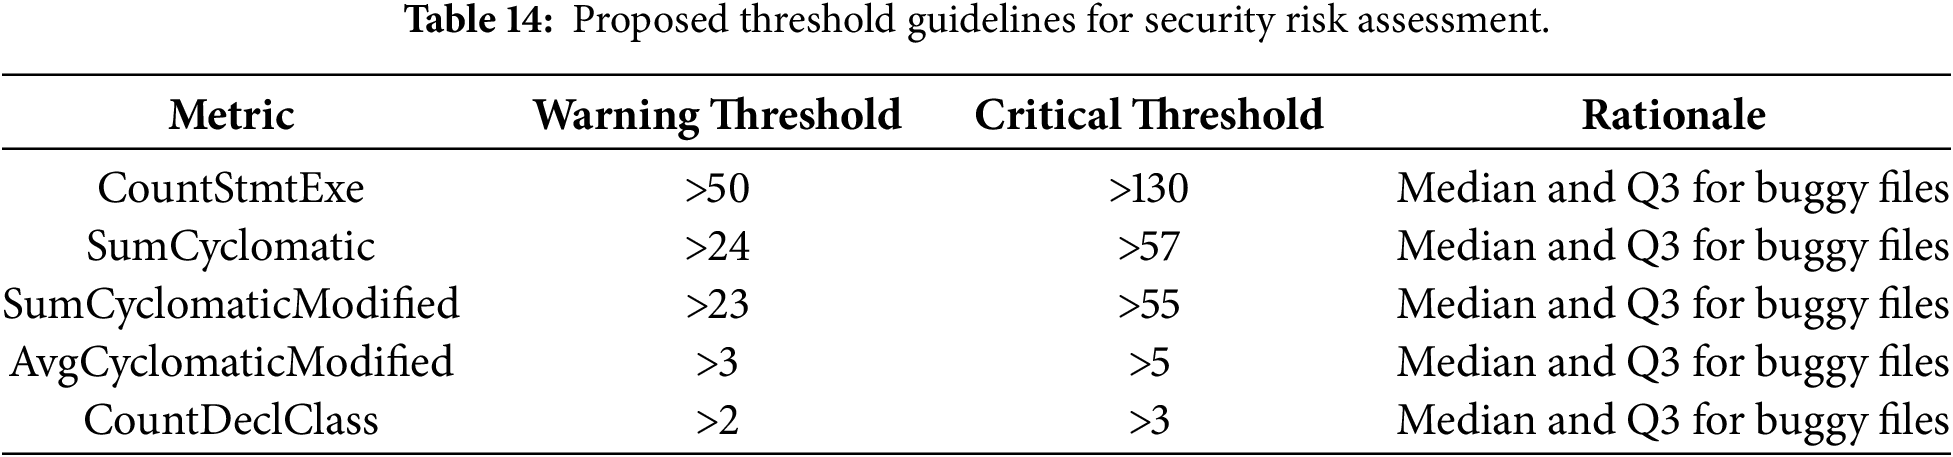
Threshold application:
• Warning Threshold: if the file exceeds the median of buggy files, schedule for security review.
• Critical Threshold: if the file exceeds the third quartile (Q3) of buggy files, prioritize for immediate security analysis.
5.2.2 Discussion: Towards Practical Threshold Validation
While the proposed thresholds are derived from statistically significant distributional differences, their primary objective is not to establish universal or prescriptive rules, but to provide empirically grounded risk indicators that can be adapted to diverse development contexts. In this sense, validation should be understood not only in terms of numerical performance metrics but also in terms of interpretability, stability across ecosystems, and practical applicability.
First, the thresholds are grounded in consistent patterns observed across multiple ecosystems and programming languages, suggesting that they capture a robust empirical signal rather than project-specific artifacts. Second, their formulation is intentionally simple and transparent (e.g., based on relative differences, such as the observed “3
From a practical perspective, these thresholds are best validated through incremental adoption. Organizations should initially deploy them as non-blocking indicators for exploratory analysis, security awareness, or review prioritization. Subsequently, teams can adjust thresholds based on project history, language characteristics, and observed false-positive rates. In addition, combining multiple metrics (e.g., size and complexity) can improve specificity and reduce reliance on any single indicator.
Finally, while our study provides empirical evidence supporting the usefulness of such thresholds at scale, prospective validation within active development pipelines and organization-specific calibration remain essential steps for operational deployment. We therefore view the proposed thresholds as a reproducible empirical baseline rather than definitive security criteria, enabling informed adaptation rather than one-size-fits-all enforcement.
The statistical analyses in RQ2 provide strong evidence that files involved in security bugs tend to exhibit significantly larger and more complex code structures than clean files. In particular, the fact that median values for buggy files are often around three times higher than those for non-buggy files suggests that high complexity and size may be interpreted as risk factors for security bugs (i.e., security-relevant code flaws), rather than as direct evidence of exploitability. From a practical standpoint, these results support the idea of defining empirical thresholds for specific metrics above which the risk of security bugs increases significantly. For example, values of CountStmtExe or SumCyclomatic exceeding the upper quartile observed in buggy files could serve as triggers for additional code review or security testing. Such thresholds should not be interpreted as strict rules, but rather as indicators that a file deserves closer scrutiny. Organizations can operationalize these findings by:
1. Automated code review triggers: configure continuous integration systems to flag files exceeding warning thresholds for mandatory security review before merge.
2. Technical debt prioritization: when refactoring, prioritize files exceeding critical thresholds, as they represent both maintainability and security liabilities.
3. Security testing focus: concentrate security testing resources (fuzzing, penetration testing, formal verification) on files exceeding thresholds, maximizing return on security investment.
Our “3
• Shin and Williams [11] showed that complexity metrics differentiate vulnerable code, but did not quantify specific thresholds.
• Alenezi and Zarour [53] established that higher complexity correlates with security weaknesses.
Our contribution is to provide specific quantitative threshold guidelines derived from a large-scale, multi-ecosystem empirical analysis.
While we propose general thresholds based on our dataset, organizations should consider calibrating them to their specific context:
• Language-specific: different languages exhibit different baseline complexity profiles.
• Project-specific: legacy systems may have different baselines than greenfield projects.
• Domain-specific: security-critical domains (e.g., cryptography or authentication) may warrant stricter thresholds.
Some limitations and cautions we note are:
1. Thresholds are guidelines, not absolutes. Exceeding a threshold indicates elevated risk but does not guarantee the presence of a vulnerability. Conversely, files below thresholds may still contain security bugs, particularly those arising from subtle logic or design errors.
2. Avoidance of metric gaming. Developers should not artificially manipulate metrics (e.g., splitting functions solely to reduce cyclomatic complexity) without genuine improvements to code clarity and security. Metric improvements should result from meaningful refactoring.
3. Ecological fallacy. Thresholds are derived from population-level statistics; individual files or projects may legitimately deviate without indicating increased security risk.
4. Evolution of threats. As attack techniques evolve, the relationship between metrics and security bugs may change. Periodic re-evaluation against updated vulnerability data is therefore recommended.
These thresholds represent an initial empirical baseline. Future work should:
• develop language-specific threshold recommendations,
• investigate threshold combinations (e.g., high complexity and high executable statement count),
• validate thresholds prospectively on new projects,
• explore dynamic threshold adjustment based on project history.
It is important to emphasize that high complexity and size do not cause security bugs; they correlate with underlying development and maintenance challenges such as reduced modularity, rushed development, or insufficient testing. Nevertheless, these metrics offer a lightweight, interpretable proxy that can be easily computed and monitored throughout the development process. RQ2 thus complements RQ1 by showing not only which metrics matter, but also how their values differ in the presence of security bugs.
5.3 RQ3: Security Bug Prediction Performance
Research Question: To what extent can machine learning models predict security bugs based on software quality metrics?
The classification results for the eleven machine learning models correspond to the average performance over the five folds of the time-series cross-validation, using the combined dataset from all ecosystems. At first glance, most models achieve high accuracy, often above 0.90. In contrast, given the strong class imbalance, accuracy alone is not informative. We therefore focus on Recall, F1-score, MCC, and ROC-AUC, which provide a more nuanced view of performance on the minority class. Table 15 presents the average performance across all folds for all ecosystems combined.
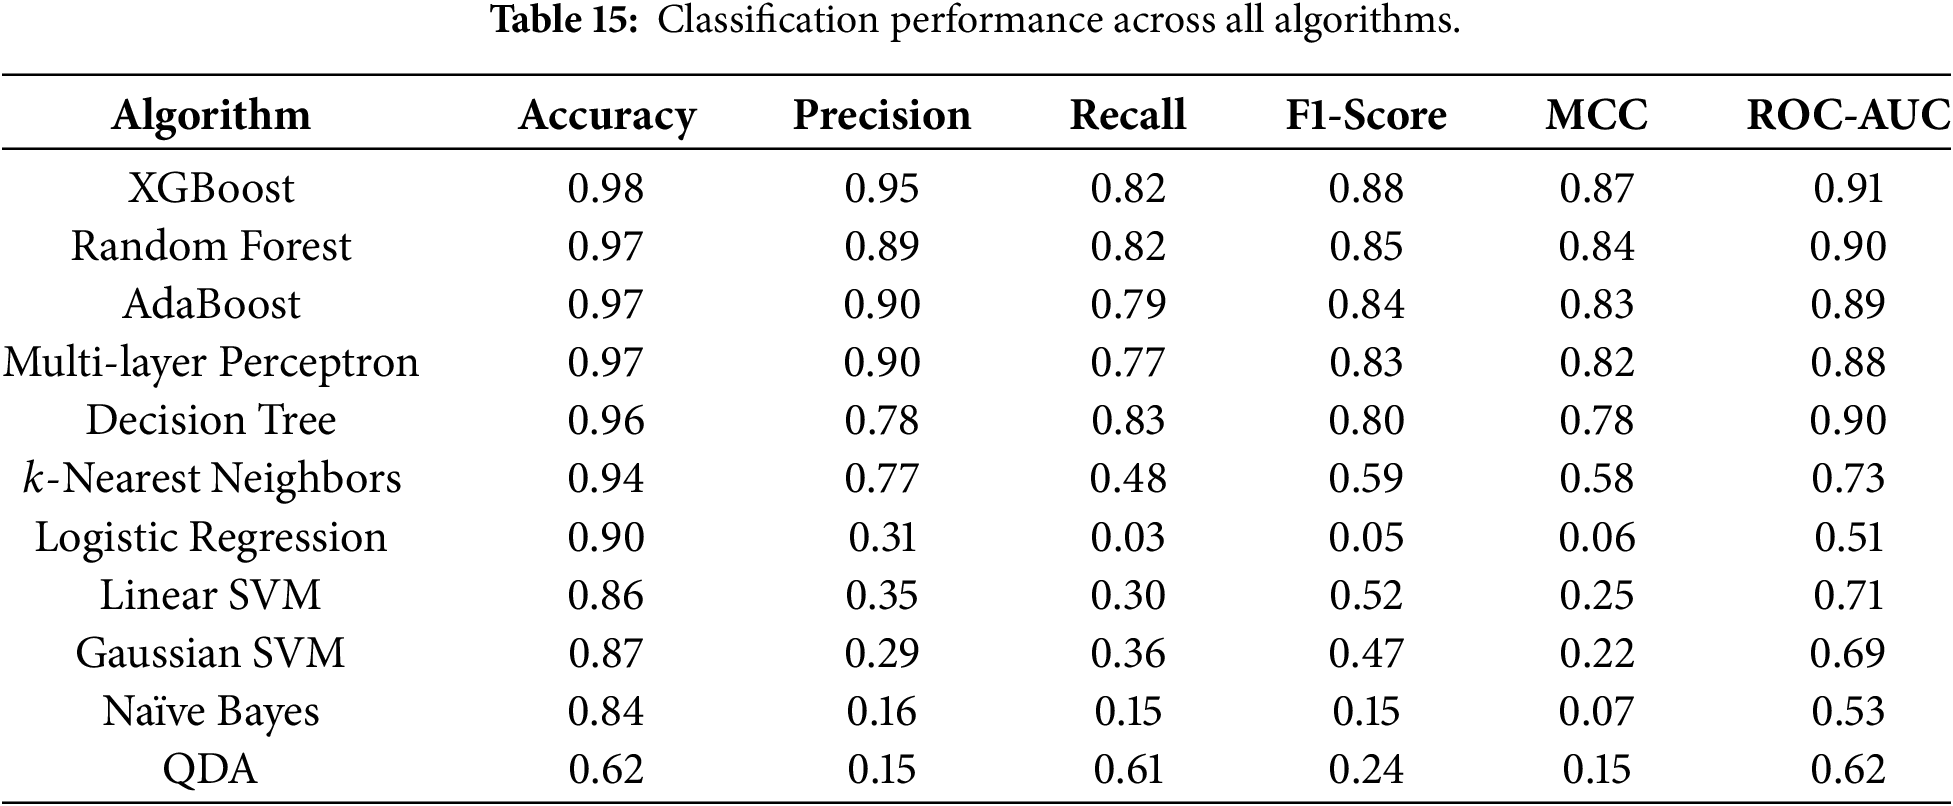
Among the evaluated models, tree-based methods and ensemble approaches such as XGBoost, Random Forests, Decision Trees, and AdaBoost clearly stand out. XGBoost achieves a Recall of about 0.82, a high F1-score, an MCC of about 0.87, and an ROC-AUC of about 0.91. Random Forests and AdaBoost achieve similar performance, with Recall values of 0.79–0.82 and ROC-AUC values of 0.90. Decision Trees also perform well, with high Recall and ROC-AUC, although their MCC is slightly lower than that of the ensemble models. In contrast, models such as Naïve Bayes, QDA, and Logistic Regression perform significantly worse in terms of Recall and MCC. Naïve Bayes, for instance, achieves a low Recall, indicating that it fails to capture the complex decision boundaries needed to distinguish buggy from non-buggy files. The Support Vector Machine models exhibit intermediate behavior, with relatively high accuracy but modest Recall and F1-scores.
While descriptive metrics indicate that XGBoost achieves the best overall performance, we further examined whether these differences are statistically significant across models. To this end, we applied the Friedman test followed by a Nemenyi post-hoc analysis, as recommended for comparing multiple classifiers over repeated cross-validation folds (Table 16).
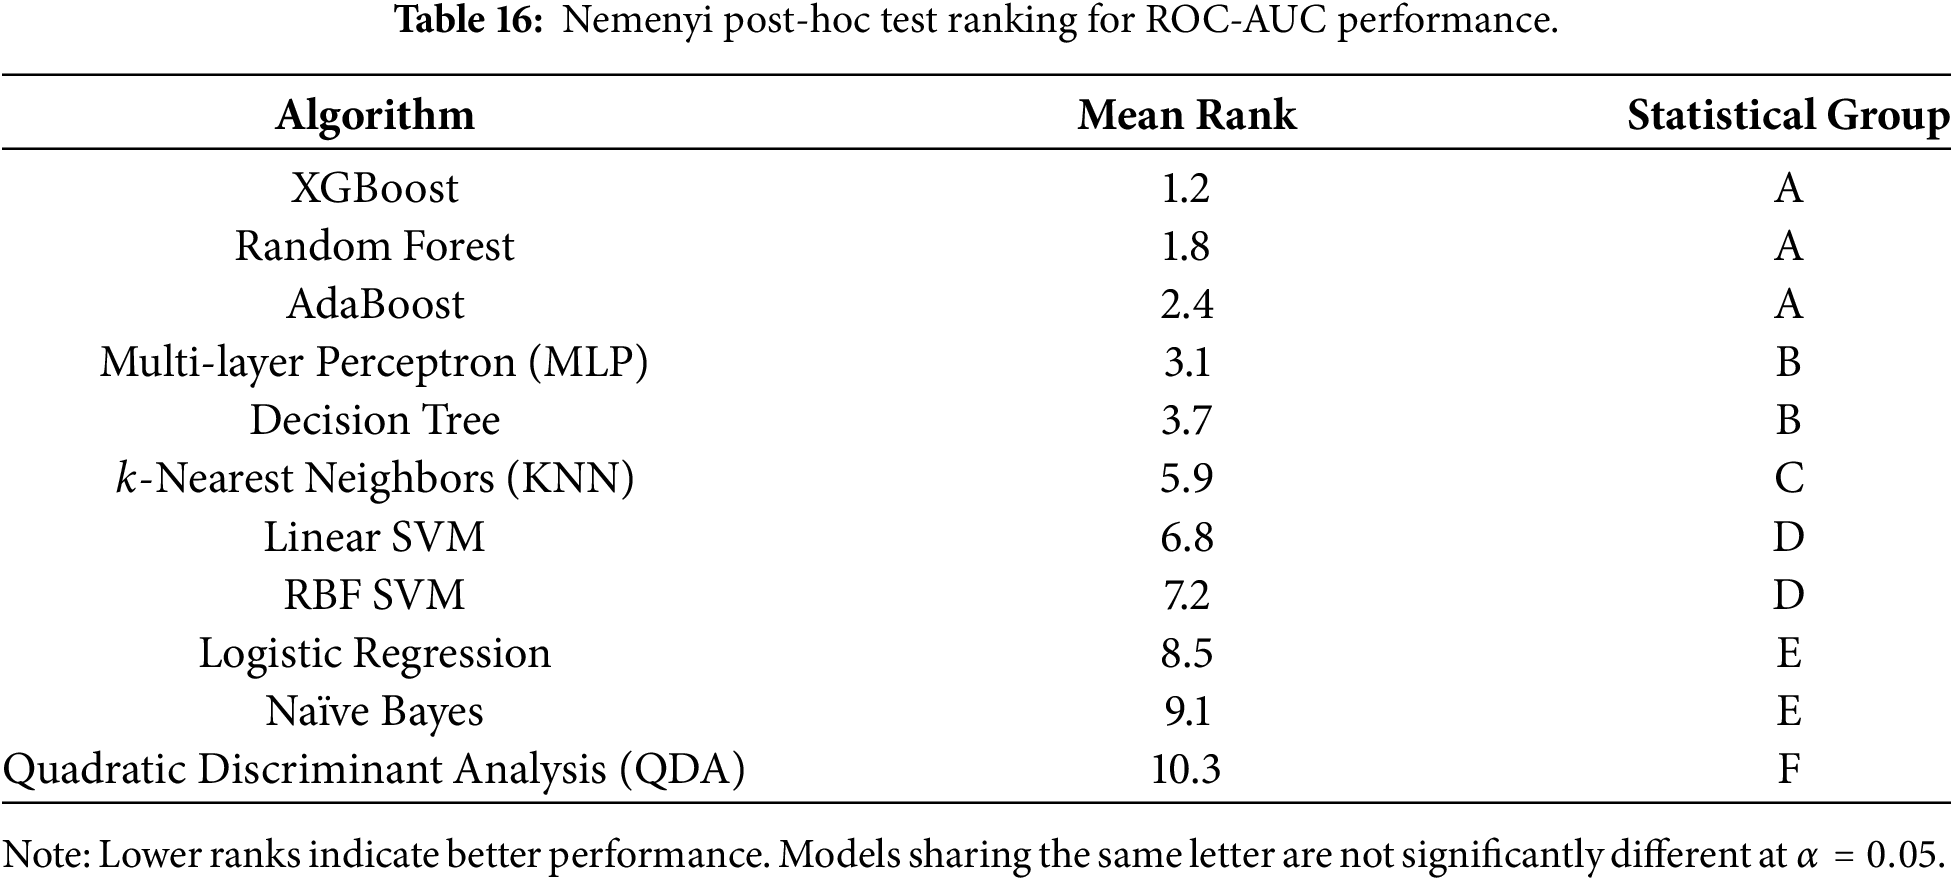
The Friedman test rejected the null hypothesis that all classifiers perform equally (
No statistically significant difference was observed between XGBoost, Random Forest, and AdaBoost. This result indicates that ensemble tree-based methods, whether based on boosting or bagging, form a statistically homogeneous group with consistently superior performance for security bug prediction using static quality metrics. These findings confirm that the observed advantage of XGBoost is not due to random variation across folds but rather reflects a robust, reproducible performance pattern. From a practical standpoint, these results suggest that the choice among ensemble tree-based models may be guided by secondary considerations such as training time, interpretability, or deployment constraints, rather than raw predictive performance alone.
The results for RQ3 demonstrate that machine learning models can effectively leverage software quality metrics to predict files likely to contain security bugs. In particular, tree-based ensemble methods such as XGBoost and Random Forests offer a favorable trade-off between high Recall, strong discriminative power (as reflected in ROC-AUC), and robust overall correlation with the correct labels (MCC).
In a security context, missing an actual vulnerability (false negative) is generally more costly than raising a false alarm (false positive). For this reason, Recall is a critical metric. The observed Recall values around 0.8 for the best models indicate that a substantial fraction of buggy files can be detected based on quality metrics alone. At the same time, the relatively high Precision and MCC scores suggest that the models do not simply label most files as buggy.
The relatively poor performance of generative models such as Naïve Bayes or QDA is expected given the complex, non-linear interactions between metrics observed in RQ1 and RQ2. These models rely on strong distributional assumptions (for example, conditional independence or Gaussianity) that are unlikely to hold in our data. In contrast, ensemble methods are better suited to capturing heterogeneous, high-order patterns.
Direct comparisons between our machine learning approach and traditional static analysis or typical static application security testing (SAST) tools such as SpotBugs, SonarQube, or Infer are inherently challenging, as these tools operate at different granularities and pursue distinct objectives. Static analyzers typically rely on predefined rules to detect specific vulnerability patterns and report line-level warnings. In contrast, our approach produces file-level risk predictions based on structural and complexity metrics. We emphasize that this comparison is intended to be conceptual rather than quantitative, given the fundamentally different objectives and outputs of machine-learning-based prediction and rule-based static analysis.
Rather than replacing static analyzers, our method is best viewed as complementary. Empirical studies report that static analysis tools often achieve moderate recall for real-world vulnerabilities, with performance strongly dependent on the vulnerability category and configuration, and frequently suffer from high false-positive rates that limit adoption in practice. In contrast, our model achieves high recall while maintaining substantial precision, making it well-suited as an upstream prioritization mechanism. In practical security workflows, the proposed approach can serve as a high-recall pre-filter that identifies security-prone files early in the development lifecycle. These files can then be subjected to more expensive static or dynamic analyses or prioritized for manual review. Such a layered strategy leverages the strengths of both paradigms: the broad coverage of metric-based machine learning and the precise diagnostics of rule-based static analyzers.
Collectively, the results of RQ3 indicate that quality-metric-based prediction can be a viable component of a broader security assurance process. For example, the models could be integrated into continuous integration pipelines to flag potentially vulnerable files early, thereby directing developers’ and security analysts’ attention to the most critical parts of the codebase. Possible production deployment and integration strategies include:
• Pre-commit hooks: flag files exceeding thresholds or predicted as risky.
• CI/CD gates: block merges for high-risk predictions pending security review, using tiered risk levels to mitigate alert fatigue and false positives.
• Prioritized review: rank files by prediction probability for efficient allocation of review and testing resources.
• Feedback loop: incorporate confirmed vulnerabilities to retrain and recalibrate models periodically.
Organizations can adapt prediction thresholds based on risk appetite:
• Conservative (high Recall): lower threshold, more false alarms, fewer missed bugs.
• Balanced (default): threshold optimizing F1-score.
• Aggressive (high Precision): higher threshold, fewer false alarms, more missed bugs.
Our validation strategy, using time-series cross-validation, is critical for realistic performance estimation. Our reported metrics reflect the expected real-world performance of predicting future security bugs from historical patterns. Traditional random
• training on “future” data to predict “past” bugs,
• violating temporal causality,
• failing to reflect real deployment scenarios.
The current limitations of our study include:
1. Static metrics only: we use code-level metrics, not runtime behavior or security-specific patterns.
2. Ecosystem aggregation: results combine diverse languages/frameworks; language-specific models might perform better.
3. Binary classification: we predict presence/absence, not vulnerability type or severity.
4. Historical data: trained on past bugs; new vulnerability classes may not be detected.
Future enhancements should focus on:
• Deep learning: exploring code embeddings (e.g., CodeBERT) combined with metrics.
• Process metrics: incorporating developer experience, code churn, and review quality.
• Semantic analysis: adding abstract syntax tree features and control flow graphs.
• Multi-task learning: simultaneously predicting bug type and severity.
• Active learning: prioritizing manual review of uncertain predictions to improve models.
• Cross-project prediction: developing models that generalize across projects with limited training data.
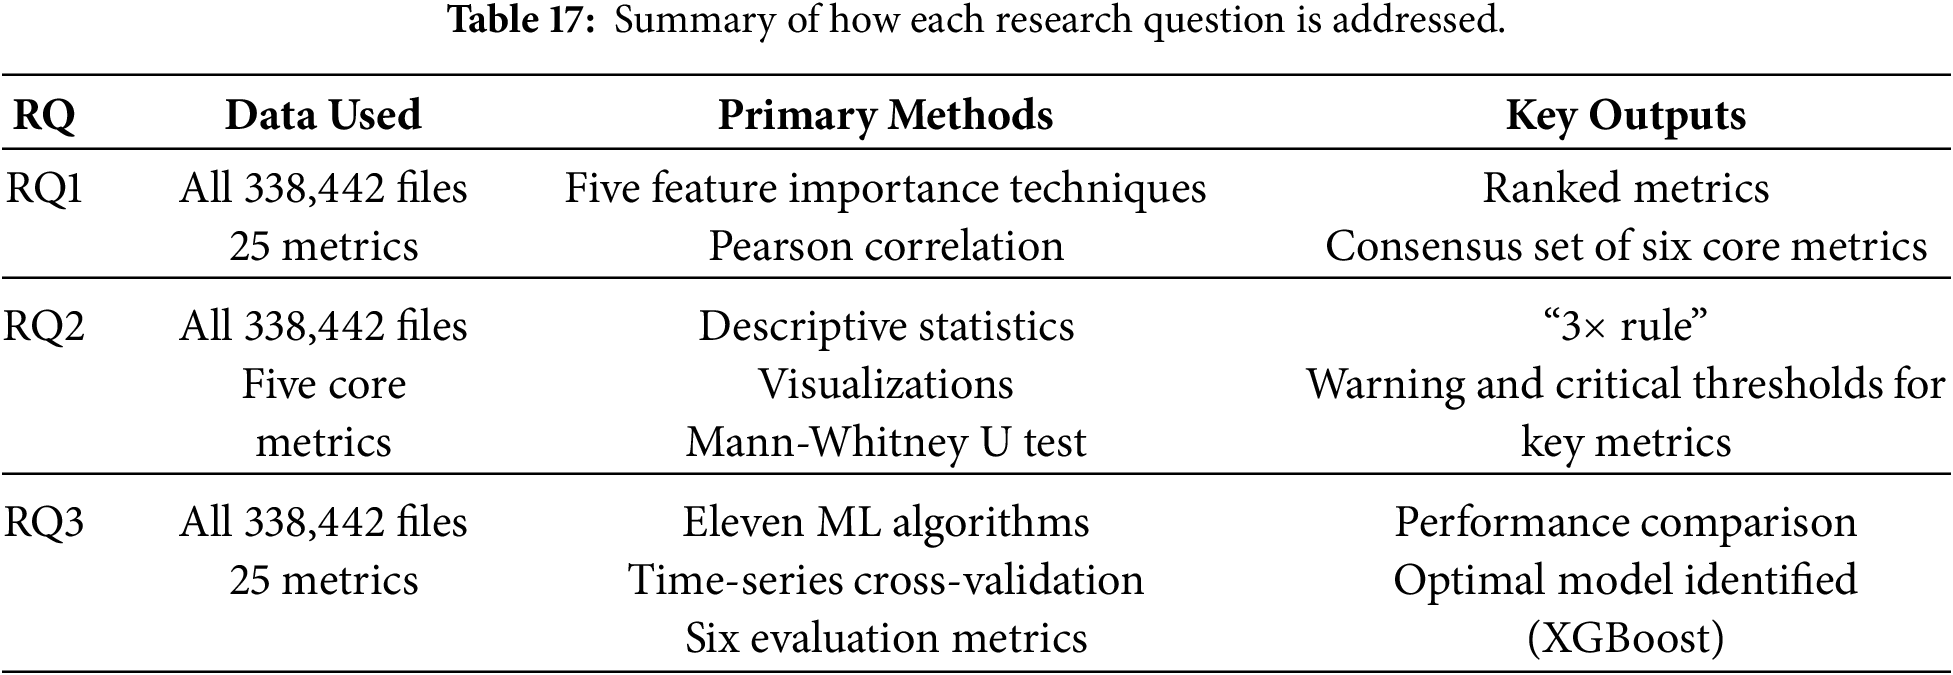
The three research questions addressed in this study provide complementary perspectives on the relationship between software quality metrics and security bugs. RQ1 shows that a small subset of metrics related to size and cyclomatic complexity is consistently associated with the presence of vulnerabilities. RQ2 demonstrates that the distributions of these metrics differ significantly between buggy and non-buggy files, with buggy files exhibiting substantially higher median and upper-quartile values. RQ3 establishes that machine learning models, particularly tree-based ensemble methods, can leverage these metrics to achieve high Recall and discriminative performance in predicting security bugs. Table 17 summarizes how each research question is addressed:
Overall, these findings suggest that static quality metrics, which are relatively cheap to compute, can play a meaningful role in supporting security assurance activities. They can help identify code regions that warrant additional review, serve as features for automated prediction models, and inform the definition of metric-based thresholds in secure development practices.
5.5 Synthesis and Implications for Research and Practice
Our findings align with a substantial body of prior work showing that code size and complexity are associated with defect proneness and security risk. Previous studies in vulnerability prediction have reported similar trends, though often at a smaller scale or with inconsistent conclusions [11,52]. By leveraging a large, multi-ecosystem dataset and multiple complementary analysis techniques, our study confirms and quantifies these relationships in a security-specific context.
In contrast to studies reporting weak or inconclusive correlations between complexity metrics and vulnerabilities, such as Alves et al. [12], our results reveal consistent, statistically significant patterns across ecosystems. This discrepancy is likely attributable to differences in dataset size, labeling precision, and analysis methodology. In particular, our use of multiple feature importance methods and effect size analysis reduces dependence on any single modeling assumption.
Our findings also refine prior observations. While earlier work emphasized specific metrics such as nesting depth or function-level complexity, we find that aggregate file-level metrics, especially executable statement count and cyclomatic complexity, are more robust indicators across diverse languages and ecosystems. This suggests that overall structural burden, rather than isolated local complexity, plays a key role in security risk.
From a practical perspective, our study provides actionable guidance for practitioners by proposing empirically grounded threshold ranges and demonstrating that lightweight machine learning models can achieve high recall. These results support integrating metric-based risk indicators as early-warning mechanisms in CI/CD pipelines, where they can guide review prioritization and security testing efforts. In practice, such integration should be incremental and non-disruptive. To mitigate alert fatigue and false positives, prediction scores and threshold exceedance can be used to define relative risk levels rather than complex blocking rules. In this way, the proposed approach complements existing security practices by directing expert attention to higher-risk code regions without replacing established review or analysis processes.
For researchers, our work highlights the importance of multi-ecosystem datasets, transparent labeling strategies, and effect-size reporting in vulnerability-prediction studies. The identified core metrics provide a focused baseline for future research, while the remaining limitations motivate further exploration of semantic and process-level factors.
Before concluding, we discuss the main threats to validity that may affect the interpretation and generalization of our findings. This section outlines potential threats to the validity of our empirical study and the measures adopted to mitigate them. Following standard guidelines in empirical software engineering, we consider internal, external, construct, and conclusion validity and conclude with a note on reproducibility.
Internal validity concerns whether the observed relationships between quality metrics and security bugs are genuine associations rather than artifacts of data collection or analysis. We address the following concerns:
Labeling accuracy: Our labeling strategy assumes that files modified in security-fixing commits are security-relevant. This may introduce noise, as some files may be changed for non-security reasons (e.g., refactoring or formatting). To mitigate this risk, we applied automated filtering to exclude non-source files and cosmetic-only changes (Section 3.3.1) and conducted manual validation on a random sample of commits. This inspection confirmed that 94.2% of the sampled cases clearly corresponded to security fixes, while 4.0% were borderline and 1.8% were incorrectly labeled and removed before analysis. This low estimated residual noise rate is therefore unlikely to affect the observed large-scale statistical patterns materially.
Confounding factors: The observed associations between complexity and security bugs may be influenced by confounding variables such as developer experience, code age, or review practices. While we cannot fully disentangle causal mechanisms in an observational study, our objective is predictive and risk-oriented rather than causal. The consistency of results across ecosystems and validation strategies supports their robustness for prioritization purposes.
Temporal effects: Our dataset spans multiple years, during which development practices and security awareness have evolved. We mitigate temporal confounding by adopting time-series cross-validation, ensuring that models are constantly evaluated on future data relative to training data.
External validity relates to the generalizability of our findings beyond the studied context. Our dataset covers seven major open-source ecosystems, a wide range of programming languages, and over 338,000 file-level observations, which strengthens generalizability to large, actively maintained open-source projects. Nevertheless, the results may not directly transfer to closed-source, safety-critical, or highly regulated domains (e.g., avionics or medical software), where development constraints differ substantially.
In addition, reliance on the OSV database may introduce reporting biases, as well-maintained projects are more likely to disclose vulnerabilities. While these limits representativeness, they reflect real-world vulnerability-discovery processes. We therefore encourage organizations to validate and calibrate thresholds using their own historical security data.
Construct validity assesses whether the selected measurements accurately represent the studied concepts:
Security bug definition: In this study, the term security bug refers to security-relevant code flaws that were subsequently fixed through security-related commits. While many correspond to documented vulnerabilities, others represent latent weaknesses whose exploitability depends on context. This broader definition aligns with proactive security assessment but differs from studies focusing exclusively on confirmed exploits. As highlighted in recent analyses of vulnerability datasets [54,55], the quality and consistency of labeling for such data remain ongoing challenges in the field.
Metric coverage: The selected static metrics capture code size and structural complexity, which are widely used proxies for maintainability and cognitive load. However, they do not capture semantic properties such as authentication logic correctness, data-flow violations, or API misuse. As such, our approach complements rather than replaces semantic or dynamic security analyses.
Granularity: Our analysis operates at the file-level, whereas vulnerabilities often manifest at finer granularity (function or line level). File-level analysis may dilute localized effects, but it aligns well with code review and refactoring workflows commonly used in practice.
Conclusion validity concerns the soundness of the statistical inferences drawn. We employed non-parametric statistical tests (Mann–Whitney U) suitable for non-normal distributions and applied the Bonferroni correction to control for multiple comparisons. Given the large sample size, we complemented significance testing with effect size analysis to ensure practical relevance. In the machine learning experiments, time-series cross-validation was used to avoid overly optimistic estimates caused by temporal leakage. Finally, class imbalance was addressed using SMOTE applied exclusively within training folds. At the same time, this choice may influence decision boundaries; alternative strategies such as cost-sensitive learning or ensemble balancing could be explored in future work.
Importantly, we avoid causal claims and interpret our results as predictive associations suitable for risk prioritization rather than mechanistic explanations. We also acknowledge the absence of a direct empirical, head-to-head comparison with static analysis tools on the same labeled dataset as a limitation of this study and identify such evaluation as an important direction for future work. Similarly, the proposed threshold guidelines have not yet been prospectively validated within active development workflows; such in-vivo validation would require longitudinal industrial studies and therefore falls beyond the scope of this retrospective analysis.
To support replication, we provide a companion repository11 containing datasets, scripts, and experimental configurations. While the Understand tool requires a license, pre-computed metrics are provided, and open-source alternatives can be used to reproduce the analysis pipeline.
Ensuring the security of modern software systems is essential, as security bugs continue to expose organizations and users to data breaches, system compromise, and significant financial losses. Although secure development practices and automated tools have advanced, detecting security bugs early in the software development lifecycle remains difficult, particularly as systems grow in size and complexity. Identifying which parts of the codebase are more likely to contain vulnerabilities, therefore, remains a critical challenge for both researchers and practitioners.
In this study, we investigated whether software quality metrics can help identify security-prone code and support early prediction of security bugs. Using data from seven major open-source ecosystems and 338,442 file-level instances, including 33,294 buggy files representing 7685 confirmed security bugs, we extracted 25 quality metrics with the Understand static analysis tool. We evaluated the relationship between these metrics and real-world vulnerabilities. To analyze this relationship, we applied five complementary feature-importance techniques, statistical analysis, and eleven machine learning models.
Our results reveal several key findings. First, a consistent subset of metrics, including Count StmtExe, CountDeclClass, SumCyclomatic, SumCyclomaticModified, and Avg CyclomaticModified, emerged as the strongest indicators of vulnerability-prone code across all feature selection methods. Second, files containing security bugs exhibited median metric values approximately 3 times higher than those of non-buggy files, a pattern we term the “3
These findings provide actionable insights for practitioners. The identified metrics and thresholds can guide targeted security reviews, inform metric-based alerts in continuous integration pipelines, and support automated prioritization of potentially vulnerable files. Moreover, the demonstrated predictive power of lightweight machine learning models highlights their potential to complement existing secure development practices. It is important to reiterate the fundamental scope of this work. Our approach relies exclusively on static, structural code metrics. While these metrics are effective for identifying files that are statistically more likely to contain security bugs, they cannot capture semantic vulnerabilities, flawed business logic, insecure API usage patterns, or runtime-dependent behaviors such as race conditions or state-dependent flaws. Accordingly, the proposed method is not a complete solution for vulnerability detection. Rather, it should be understood as a prioritization and triage filter whose primary value lies in directing limited security resources toward the most security-prone parts of the codebase. In practice, metric-based prediction is best used as an upstream component in a defense-in-depth strategy, complementing semantic analysis tools, dynamic testing, and manual security review rather than replacing them.
Despite these contributions, some limitations must be acknowledged. Our analysis relies exclusively on static, file-level quality metrics and does not incorporate semantic or process-oriented factors such as code churn, developer experience, or review activity. Additionally, although our dataset spans multiple ecosystems and programming languages, the thresholds and patterns we identified may need to be calibrated for specific projects or domains. Finally, vulnerability introduction is influenced by complex socio-technical factors that cannot be fully captured by static metrics alone.
Building on this work, several specific research directions emerge. First, extending the study to more software systems would enhance generalizability. Second, future studies could differentiate between vulnerability types to explore whether distinct categories exhibit distinct metric signatures. Third, comparative analyses between mono- and multi-language systems could shed light on the impact of linguistic diversity on the introduction of vulnerability. Prior work has shown that multi-language systems, particularly those relying on foreign function interfaces such as JNI, exhibit distinct reliability and maintenance challenges [56,57], suggesting that vulnerability patterns may differ substantially in such contexts. Fourth, qualitative investigations into the severity and characteristics of security bugs may provide complementary insights. Finally, we plan to explore intra-project prediction approaches to address cold-start scenarios or highly imbalanced projects, enabling more effective prediction in early-stage or low-data environments. Future work could explore developing a lightweight CI/CD integration or plugin that operationalizes the proposed thresholds and model predictions, enabling practitioners to adopt the approach with minimal overhead. In addition, empirical studies evaluating the cost-benefit trade-off of acting on these predictions within real development teams would provide valuable insights into the operational efficiency and practical impact of metric-based security prioritization.
Overall, this study demonstrates that static software quality metrics, when leveraged with appropriate analytical and machine learning techniques, can offer meaningful support for early security bug detection and more secure software development practices.
Acknowledgement: None.
Funding Statement: This research was supported by the Natural Sciences and Engineering Research Council of Canada (NSERC) through a Discovery Grant RGPIN-2019-05062.
Author Contributions: The authors confirm contribution to the paper as follows: study conception and design: Mohamed Diouf, Elisée Toe; data collection: Mohamed Diouf; implementation and experimental analysis: Mohamed Diouf; analysis and interpretation of results: Mohamed Diouf, Elisée Toe, Manel Grichi; draft manuscript preparation: Elisée Toe, Manel Grichi; supervision and methodological guidance: Haïfa Nakouri, Fehmi Jaafar. All authors reviewed and approved the final version of the manuscript.
Availability of Data and Materials: The data that support the findings of this study are openly available in a public repository (PredictSecBugs) at https://github.com/MdioufDataScientist/PredictSecBugs.
Ethics Approval: Not applicable.
Conflicts of Interest: The authors declare no conflicts of interest.
1https://cybersecurityventures.com/boardroom-cybersecurity-report/
4https://support.scitools.com/support/solutions/articles/70000582223-what-metrics-does-understand-have-
5https://machinelearningmastery.com/random-oversampling-and-undersampling-for-imbalanced-classification/
6https://machinelearningmastery.com/smote-oversampling-for-imbalanced-classification/
7https://www.kaggle.com/residentmario/oversampling-with-smote-and-adasyn
8https://www.geeksforgeeks.org/ml-extra-tree-classifier-for-feature-selection/
9https://github.com/klainfo/ScottKnottESD
10http://www.mccabe.com/pdf/MoreComplexEqualsLessSecure-McCabe.pdf
11https://github.com/MdioufDataScientist/PredictSecBugs
References
1. Clemente CJ, Jaafar F, Malik Y. Is predicting software security bugs using deep learning better than the traditional machine learning algorithms? In: 2018 IEEE International Conference on Software Quality, Reliability and Security (QRS). Piscataway, NJ, USA: IEEE; 2018. p. 95–102. [Google Scholar]
2. Zaman S, Adams B, Hassan AE. Security versus performance bugs: a case study on firefox. In: Proceedings of the 8th Working Conference on Mining Software Repositories (MSR ’11). New York, NY, USA: ACM; 2011. p. 93–102. [Google Scholar]
3. Tan L, Liu C, Li Z, Wang X, Zhou Y, Zhai C. Bug characteristics in open source software. Empir Softw Eng. 2014;19(6):1665–705. doi:10.1007/s10664-013-9258-8. [Google Scholar] [CrossRef]
4. Aggarwal A, Jalote P. Integrating static and dynamic analysis for detecting vulnerabilities. In: 30th Annual International Computer Software and Applications Conference (COMPSAC ’06). Vol. 1. Piscataway, NJ, USA: IEEE; 2006. p. 343–50. [Google Scholar]
5. Tretyakov K. Machine learning techniques in spam filtering. In: Data mining problem-oriented seminar, MTAT.03.177. Vol. 3. Tartu, Estonia: University of Tartu; 2004. p. 60–79. [Google Scholar]
6. Zamani M, Movahedi M. Machine learning techniques for intrusion detection. arXiv:1312.2177. 2013. [Google Scholar]
7. Livadas C, Walsh R, Lapsley D, Strayer WT. Using machine learning techniques to identify botnet traffic. In: Proceedings of the 31st IEEE Conference on Local Computer Networks. Piscataway, NJ, USA: IEEE; 2006. p. 967–74. [Google Scholar]
8. Lin G, Wen S, Han QL, Zhang J, Xiang Y. Software vulnerability detection using deep neural networks: a survey. Proc IEEE. 2020;108(10):1825–48. doi:10.1109/jproc.2020.2993293. [Google Scholar] [CrossRef]
9. Catal C, Akbulut A, Karakatič S, Pavlinek M, Podgorelec V. Can we predict software vulnerability with deep neural network? In: Proceedings of the 12th International Conference on Software Technologies (ICSOFT 2017). Madrid, Spain: SCITEPRESS; 2017. p. 69–76. [Google Scholar]
10. Scandariato R, Walden J, Hovsepyan A, Joosen W. Predicting vulnerable software components via text mining. IEEE Trans Softw Eng. 2014;40(10):993–1006. doi:10.1109/tse.2014.2340398. [Google Scholar] [CrossRef]
11. Shin Y, Williams L. An empirical model to predict security vulnerabilities using code complexity metrics. In: Proceedings of the Second ACM-IEEE International Symposium on Empirical Software Engineering and Measurement (ESEM ’08). New York, NY, USA: ACM; 2008. p. 315–7. [Google Scholar]
12. Alves H, Fonseca B, Antunes N. Software metrics and security vulnerabilities: dataset and exploratory study. In: 2016 12th European Dependable Computing Conference (EDCC). Piscataway, NJ, USA: IEEE; 2016. p. 37–44. [Google Scholar]
13. Ganesh S, Palma F, Olsson T. Are source code metrics “Good enough” in predicting security vulnerabilities? Data. 2022;7(9):127. [Google Scholar]
14. Camilo F, Meneely A, Nagappan M. Do bugs foreshadow vulnerabilities? A study of the chromium project. In: 2015 IEEE/ACM 12th Working Conference on Mining Software Repositories (MSR). Piscataway, NJ, USA: IEEE; 2015. p. 269–79. [Google Scholar]
15. Misra SC, Bhavsar VC. Relationships between selected software measures and latent bug-density: guidelines for improving quality. In: International Conference on Computational Science and Its Applications (ICCSA 2003). Cham, Switzerland: Springer; 2003. p. 724–32. [Google Scholar]
16. El Emam K, Melo W, Machado JC. The prediction of faulty classes using object-oriented design metrics. J Syst Softw. 2001;56(1):63–75. doi:10.1016/s0164-1212(00)00086-8. [Google Scholar] [CrossRef]
17. Jiang Y, Cuki B, Menzies T, Bartlow N. Comparing design and code metrics for software quality prediction. In: Proceedings of the 4th International Workshop on Predictor Models in Software Engineering (PROMISE ’08). New York, NY, USA: ACM; 2008. p. 11–8. [Google Scholar]
18. Rahman F, Devanbu P. How, and why, process metrics are better. In: Proceedings of the 35th International Conference on Software Engineering (ICSE ’13). Piscataway, NJ, USA: IEEE; 2013. p. 432–41. [Google Scholar]
19. Tantithamthavorn C, Hassan AE, Matsumoto K. The impact of class rebalancing techniques on the performance and interpretation of defect prediction models. IEEE Trans Softw Eng. 2020;46(11):1200–19. doi:10.1109/tse.2018.2876537. [Google Scholar] [CrossRef]
20. Tantithamthavorn C, McIntosh S, Hassan AE, Matsumoto K. The impact of automated parameter optimization on defect prediction models. IEEE Trans Softw Eng. 2019;45(7):683–711. doi:10.1109/tse.2018.2794977. [Google Scholar] [CrossRef]
21. Pandey SK, Mishra RB, Tripathi AK. BPDET: an effective software bug prediction model using deep representation and ensemble learning techniques. Expert Syst Appl. 2020;144(1):113085. doi:10.1016/j.eswa.2019.113085. [Google Scholar] [CrossRef]
22. Li J, He P, Zhu J, Lyu MR. Software defect prediction via convolutional neural network. In: 2017 IEEE International Conference on Software Quality, Reliability and Security (QRS). Piscataway, NJ, USA: IEEE; 2017. p. 318–28. [Google Scholar]
23. Manjula C, Florence L. Deep neural network based hybrid approach for software defect prediction using software metrics. Cluster Comput. 2019;22(4):9847–63. doi:10.1007/s10586-018-1696-z. [Google Scholar] [CrossRef]
24. Ferenc R, Bán D, Grósz T, Gyimóthy T. Deep learning in static, metric-based bug prediction. Array. 2020;6(2):100021. doi:10.1016/j.array.2020.100021. [Google Scholar] [CrossRef]
25. Rhmann W, Pandey B, Ansari G, Pandey DK. Software fault prediction based on change metrics using hybrid algorithms: an empirical study. J King Saud Univ Comput Inf Sci. 2020;32(4):419–24. doi:10.1016/j.jksuci.2019.03.006. [Google Scholar] [CrossRef]
26. Zeng P, Lin G, Pan L, Tai Y, Zhang J. Software vulnerability analysis and discovery using deep learning techniques: a survey. IEEE Access. 2020;8:197158–72. doi:10.1109/access.2020.3034766. [Google Scholar] [CrossRef]
27. Chakraborty S, Krishna R, Ding Y, Ray B. Deep learning based vulnerability detection: are we there yet? IEEE Trans Softw Eng. 2022;48(9):3280–96. doi:10.1109/tse.2021.3087402. [Google Scholar] [CrossRef]
28. Zhu J. Research on software vulnerability detection methods based on deep learning. J Comput Elec Inf Manag. 2024;14(3):21–4. doi:10.54097/q1rgkx18. [Google Scholar] [CrossRef]
29. Steenhoek B, Rahman MM, Jiles R, Le W. An empirical study of deep learning models for vulnerability detection. In: Proceedings of the 45th International Conference on Software Engineering (ICSE ’23). Piscataway, NJ, USA: IEEE; 2023. p. 2237–48. [Google Scholar]
30. Fu M, Tantithamthavorn C. LineVul: a transformer-based line-level vulnerability prediction. In: Proceedings of the 19th International Conference on Mining Software Repositories (MSR ’22). New York, NY, USA: ACM; 2022. p. 608–20. [Google Scholar]
31. Le THM, Sabir B, Babar MA. Automated software vulnerability assessment with concept drift. In: Proceedings of the 16th International Conference on Mining Software Repositories (MSR ’19). Piscataway, NJ, USA: IEEE; 2019. p. 371–82. [Google Scholar]
32. Le THM, Du X, Babar MA. Are latent vulnerabilities hidden gems for software vulnerability prediction? An empirical study. arXiv:2401.11105. 2024. [Google Scholar]
33. Shu R, Xia T, Williams L, Menzies T. Dazzle: using optimized generative adversarial networks to address security data class imbalance issue. In: Proceedings of the 19th International Conference on Mining Software Repositories (MSR ’22). New York, NY, USA: ACM; 2022. p. 144–55. [Google Scholar]
34. Fehrer T, Lozoya RC, Sabetta A, di Nucci D, Tamburri DA. Detecting security fixes in open-source repositories using static code analyzers. In: Proceedings of the 28th International Conference on Evaluation and Assessment in Software Engineering (EASE ’24). New York, NY, USA: ACM; 2024. p. 210–20. [Google Scholar]
35. Wartschinski L, Noller Y, Vogel T, Kehrer T, Grunske L. VUDENC: vulnerability detection with deep learning on a natural codebase for python. Inf Softw Technol. 2022;144:106809. [Google Scholar]
36. Zheng W, Cheng J, Wu X, Sun R, Wang X, Sun X. Domain knowledge-based security bug reports prediction. Knowl Based Syst. 2022;241:108293. doi:10.1016/j.knosys.2022.108293. [Google Scholar] [CrossRef]
37. Wei Y, Sun X, Bo L, Cao S, Xia X, Li B. A comprehensive study on security bug characteristics. J Softw Evol Process. 2021;33(10):e2376. doi:10.1002/smr.2376. [Google Scholar] [CrossRef]
38. Mashhadi E, Chowdhury S, Modaberi S, Hemmati H, Uddin G. An empirical study on bug severity estimation using source code metrics and static analysis. J Syst Softw. 2024;217(1):112179. doi:10.1016/j.jss.2024.112179. [Google Scholar] [CrossRef]
39. Yerramreddy S, Mordahl A, Koc U, Wei S, Foster JS, Carpuat M, et al. An empirical assessment of machine learning approaches for triaging reports of static analysis tools. Empir Softw Eng. 2023;28(2):28. doi:10.1007/s10664-022-10253-z. [Google Scholar] [CrossRef]
40. Kalouptsoglou I, Siavvas M, Tsoukalas D, Kehagias D, Chatzigeorgiou A, et al. Cross-project vulnerability prediction based on software metrics and deep learning. In: Computational Science and Its Applications–ICCSA 2020. Lecture Notes in Computer Science. Cham, Switzerland: Springer; 2020. p. 877–93. [Google Scholar]
41. Basili VR, Weiss DM. A methodology for collecting valid software engineering data. IEEE Trans Softw Eng. 1984;SE-10(6):728–38. doi:10.1109/tse.1984.5010301. [Google Scholar] [CrossRef]
42. Blagus R, Lusa L. SMOTE for high-dimensional class-imbalanced data. BMC Bioinform. 2013;14(1):106. doi:10.1186/1471-2105-14-106. [Google Scholar] [PubMed] [CrossRef]
43. Gupta A, Suri B, Kumar V, Jain P. Extracting rules for vulnerabilities detection with static metrics using machine learning. Int J Syst Assur Eng Manag. 2021;12(1):65–76. doi:10.1007/s13198-020-01036-0. [Google Scholar] [CrossRef]
44. SciTools. What Metrics Does Understand Have [Internet]? 2022 [cited 2026 Jan 2]. Available from: https://support.scitools.com/support/solutions/articles/70000582223. [Google Scholar]
45. Ghaemi M, Feizi-Derakhshi MR. Feature selection using forest optimization algorithm. Pattern Recognit. 2016;60(1):121–9. doi:10.1016/j.patcog.2016.05.012. [Google Scholar] [CrossRef]
46. Benesty J, Chen J, Huang Y, Cohen I. Pearson correlation coefficient. In: Noise reduction in speech processing. Cham, Switzerland: Springer; 2009. p. 1–4. doi:10.1007/978-3-642-00296-0_5. [Google Scholar] [CrossRef]
47. Adler J, Parmryd I. Quantifying colocalization by correlation: the pearson correlation coefficient is superior to the mander’s overlap coefficient. Cytometry Part A. 2010;77(8):733–42. doi:10.1002/cyto.a.20896. [Google Scholar] [PubMed] [CrossRef]
48. Kursa MB, Rudnicki WR. Feature selection with the boruta package. J Statistical Softw. 2010;36(11):1–13. doi:10.18637/jss.v036.i11. [Google Scholar] [CrossRef]
49. Hollander M, Wolfe DA, Chicken E. Nonparametric statistical methods. 3rd ed. Hoboken, NJ, USA: John Wiley & Sons; 2013. [Google Scholar]
50. Meléndez R, Giraldo R, Leiva V. Wilcoxon and mann-whitney tests for functional data: an approach based on random projections. Mathematics. 2020;9(1):44. doi:10.3390/math9010044. [Google Scholar] [CrossRef]
51. Xiao Y, Keung J, Bennin KE, Mi Q. Improving bug localization with word embedding and enhanced convolutional neural networks. Inf Softw Technol. 2019;105(11):17–29. doi:10.1016/j.infsof.2018.08.002. [Google Scholar] [CrossRef]
52. Aleem S, Capretz LF, Ahmed F. Comparative performance analysis of machine learning techniques for software bug detection. In: Proceedings of the 4th International Conference on Software Engineering and Applications. Amsterdam, The Netherlands: Elsevier; 2015. p. 71–9. [Google Scholar]
53. Alenezi M, Zarour M. On the relationship between software complexity and security. Int J Softw Eng Appl. 2020;14(1):73–88. doi:10.5121/ijsea.2020.11104. [Google Scholar] [CrossRef]
54. Guo Y, Bettaieb S, Casino F. A comprehensive analysis on software vulnerability detection datasets: trends, challenges, and road ahead. Int J Inf Secur. 2024;23(5):3311–27. doi:10.1007/s10207-024-00888-y. [Google Scholar] [CrossRef]
55. Croft R, Babar MA, Kholoosi MM. Data quality for software vulnerability datasets. In: Proceedings of the 45th International Conference on Software Engineering (ICSE ’23). Piscataway, NJ, USA: IEEE; 2023. p. 121–33. [Google Scholar]
56. Grichi M, Abidi M, Guéhéneuc YG, Khomh F. State of practices of java native interface. In: Proceedings of the 29th Annual International Conference on Computer Science and Software Engineering (CASCON ’19). Riverton, NJ, USA: IBM Corp.; 2019. p. 274–83. [Google Scholar]
57. Grichi M, Abidi M, Jaafar F, Eghan EE, Adams B. On the impact of interlanguage dependencies in multilanguage systems: empirical case study on java native interface applications (JNI). IEEE Trans Reliab. 2021;70(1):428–40. doi:10.1109/tr.2020.3024873. [Google Scholar] [CrossRef]
Cite This Article
 Copyright © 2026 The Author(s). Published by Tech Science Press.
This work is licensed under a Creative Commons Attribution 4.0 International License , which permits unrestricted use, distribution, and reproduction in any medium, provided the original work is properly cited.
 Downloads
 Citation Tools