
 Submit a Paper
 Propose a Special lssue
 Open Access
ARTICLE

Synergistic Finite Element and Experimental Analysis of Tribological Performance and Stress Distribution in Solvent Textured Epoxy Coatings
Department of Mechanical Engineering, Chosun University, Gwangju, Republic of Korea
* Corresponding Author: Chang-Lae Kim. Email:
# These authors contributed equally to this work
Computers, Materials & Continua 2026, 87(3), 30 https://doi.org/10.32604/cmc.2026.077143
Received 03 December 2025; Accepted 02 February 2026; Issue published 09 April 2026
 View Full Text
 Download PDF
Abstract
Epoxy resins are widely used as protective coatings due to their excellent adhesion and chemical resistance; however, their inherent brittleness and susceptibility to shear stress-induced crack propagation limit their tribological performance. This study investigates the stress distribution mechanisms governing the wear resistance of solvent-textured epoxy coatings using finite element analysis (FEA) and experimental validation. Three solvents with distinct volatilities—acetone, methyl ethyl ketone (MEK), and ethyl acetate (EA)—generated characteristic surface morphologies through Marangoni convection, with roughness ranging from Ra = 0.17 μm (EA) to 0.66 μm (acetone). X-ray diffraction (XRD) and Fourier-transform infrared (FT-IR) spectroscopy confirmed identical chemical structures regardless of solvent type, isolating surface morphology as the sole variable. FEA simulations revealed that textured surfaces experienced higher localized coating stress (58.24 vs. 15.35 MPa for smooth surfaces), while stress transmitted to the counterface remained comparable (~6.9 vs. ~6.7 MPa). The FEA predictions were validated through tribological testing: MEK-derived coatings achieved a wear rate of 3.0 × 10⁻⁸ mm3/N·mm, 36% lower than bare glass and 80% lower than acetone-based coatings. All coatings converged to a steady-state friction coefficient of 0.51 ± 0.02. The microdroplet morphology reduced the real contact area and trapped wear debris, suppressing abrasive wear. This integrated computational-experimental methodology demonstrates that FEA effectively predicts tribological performance of textured surfaces, establishing design guidelines for wear-resistant coatings through solvent selection without external additives. This approach provides a simple and cost-effective route for fabricating wear-resistant polymer coatings applicable to precision devices, optical films, and protective coating technologies where tribological reliability is a primary concern.Keywords
Polymer thin-film coatings have become indispensable functional elements in optical films, microelectromechanical systems (MEMS), and protective coating technologies. These coatings serve to protect substrate surfaces while imparting various functionalities; however, under operational conditions involving repetitive contact and sliding, wear and failure often occur. In precision devices with nano- and micro-scale thin films, the generation of fine wear particles or delamination of coating layers can lead to catastrophic system failures, rendering the tribological reliability of thin films a paramount engineering concern [1].
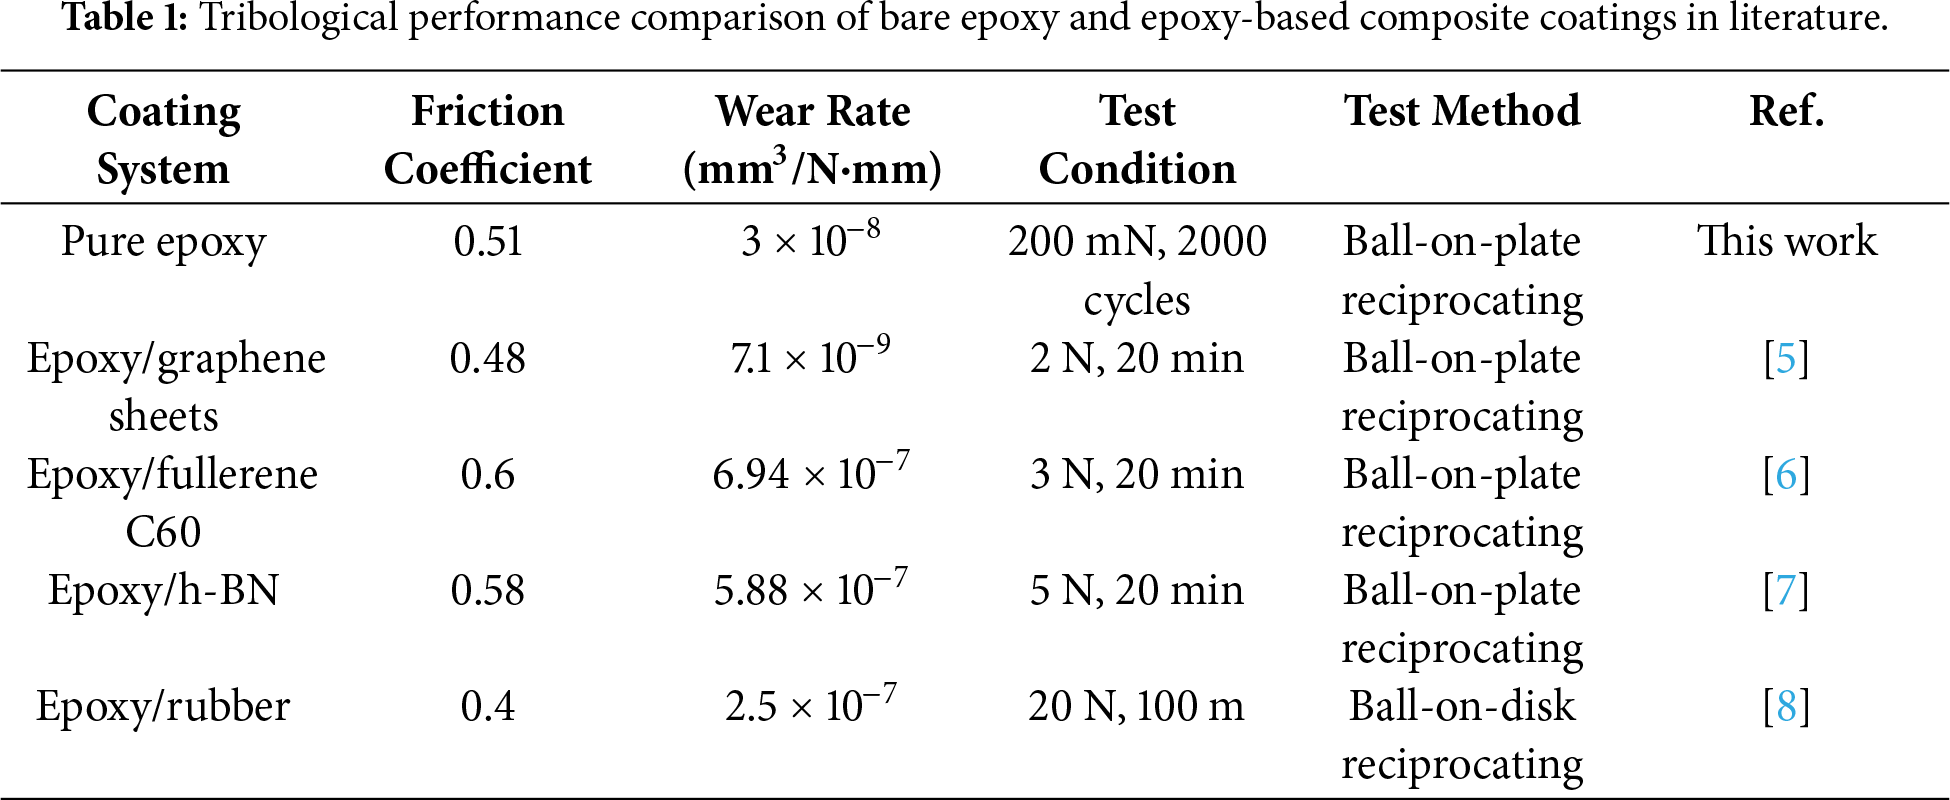
Among coating materials, epoxy resins are extensively used as thermosetting polymers owing to their excellent adhesion, chemical resistance, and mechanical strength. However, the inherently high crosslink density of epoxy renders it a brittle material that is susceptible to shear stress-induced crack propagation during friction processes [2]. The inherent brittleness and relatively low fracture toughness of epoxy resins make them weak to the initiation and growth of cracks, limiting their performance in tribological applications [3]. Furthermore, the low abrasion resistance of epoxy under mechanical friction conditions constrains its durability in high-stress contact environments [4]. To overcome this limitation, substantial research efforts have focused on incorporating particles or modifying the chemical structures to improve the tribological performance. Table 1 compares the tribological performance of bare epoxy and epoxy-based composite coatings reported in the literature [5–8]. Chen et al. demonstrated that 1,4-phenylenediboronic acid (P2BA)-functionalized graphene significantly reduced the wear rate through improved dispersion while simultaneously providing corrosion protection [5]. Liu et al. compared the friction behavior of fullerene C60 and graphene based on their structural differences, showing that spherical C60 particles were more effective in improving wear resistance [6]. Yu et al. elucidated the friction and wear characteristics arising from the crystallographic differences between cubic and hexagonal boron nitride (h-BN) [7]. Adesina et al. used micronized waste tire rubber as reinforcement, achieving improved wear resistance through improved impact absorption and toughness [8]. Nevertheless, such composite approaches face inherent limitations, including difficulties in particle dispersion, elevated processing costs due to expensive additives, and complex manufacturing procedures. Despite the understanding of the effects of solvents on film formation, the direct correlation between solvent-induced surface texturing and the tribological performance of epoxy coatings remains unexplored. Previous studies have primarily focused on incorporating functional fillers to improve wear resistance, while the potential of solvent-driven morphological control as an alternative approach has not been investigated. This study hypothesizes that by using the distinct evaporation kinetics of different solvents, it is possible to generate characteristic surface morphologies that inherently optimize wear resistance without requiring external additives or complex processing steps.
The application of epoxy resins as thin films necessitates coating processes, such as dip coating, spray coating, or spin coating. Among the factors determining the film quality in these processes, solvent behavior plays a pivotal role. As the solvents evaporate from the liquid phase, a coating layer is formed, involving the removal of organic components and the formation of oxide crystal structures through thermal drying [9]. The interplay between fluid reactivity, density, and evaporation rate determines the surface morphology within short timeframes [10,11]. The difference in the Hildebrand solubility parameter between the solvent and polymer directly influences the intrinsic viscosity of the solution, which, in turn, governs the fluidity of the coating liquid on the substrate [12]. The solvent evaporation rate determines the timing at which flowing polymer chains become fixed on the substrate, playing a critical role in the surface roughness and microstructure formation.
Various approaches have been explored to engineer surface structures during the coating process. Kim et al. fabricated hierarchically structured counter surfaces and patterned thermosetting polymer surfaces through imprinting, achieving a 79% reduction in the friction coefficient and demonstrating that the formed surface structures effectively distributed the applied loads [13]. Wodlei et al. demonstrated that precise control of Marangoni flow during solvent evaporation enabled spontaneous formation of highly ordered flower-like micropatterns [14]. Telford et al. proposed that thin-film instabilities generating spontaneously formed micropatterns represent an economical and scalable approach for fabricating functional surfaces [15]. When these perspectives are applied to tribology, surface microstructures formed through controlled solvent evaporation can reduce friction resistance by decreasing the real contact area with counter-surfaces.
Despite the understanding of the effects of solvents on film formation, the direct correlation between solvent-induced surface texturing and the tribological performance of epoxy coatings remains unexplored. It is hypothesized that by using the distinct evaporation kinetics of different solvents, it is possible to generate characteristic surface morphologies that inherently optimize wear resistance without requiring external additives or complex processing steps. The novelty of this work lies in the integrated computational-experimental methodology that isolates surface morphology as the sole variable by confirming identical chemical structures across all coatings, and then correlates the solvent-induced textures with quantified tribological performance through finite element analysis validation.
Accordingly, this study investigates the fluid dynamics during epoxy film formation using three solvents with different solubility parameters: acetone, ethyl acetate (EA), and methyl ethyl ketone (MEK). These solvents exhibit evaporation rates in the order of acetone > MEK > EA, and such volatility differences induce distinct hydrodynamic instabilities during drying, generating characteristic surface textures [12]. The objective of this study is to elucidate the wear mechanisms that manifest in actual friction environments for various surface morphologies controlled by solvents. Through an analysis of surface roughness, friction coefficient, morphological characterization of wear tracks, and finite element analysis, this study presents guidelines for fabricating durable functional coatings solely by optimizing solvent systems without complex surface treatment processes.
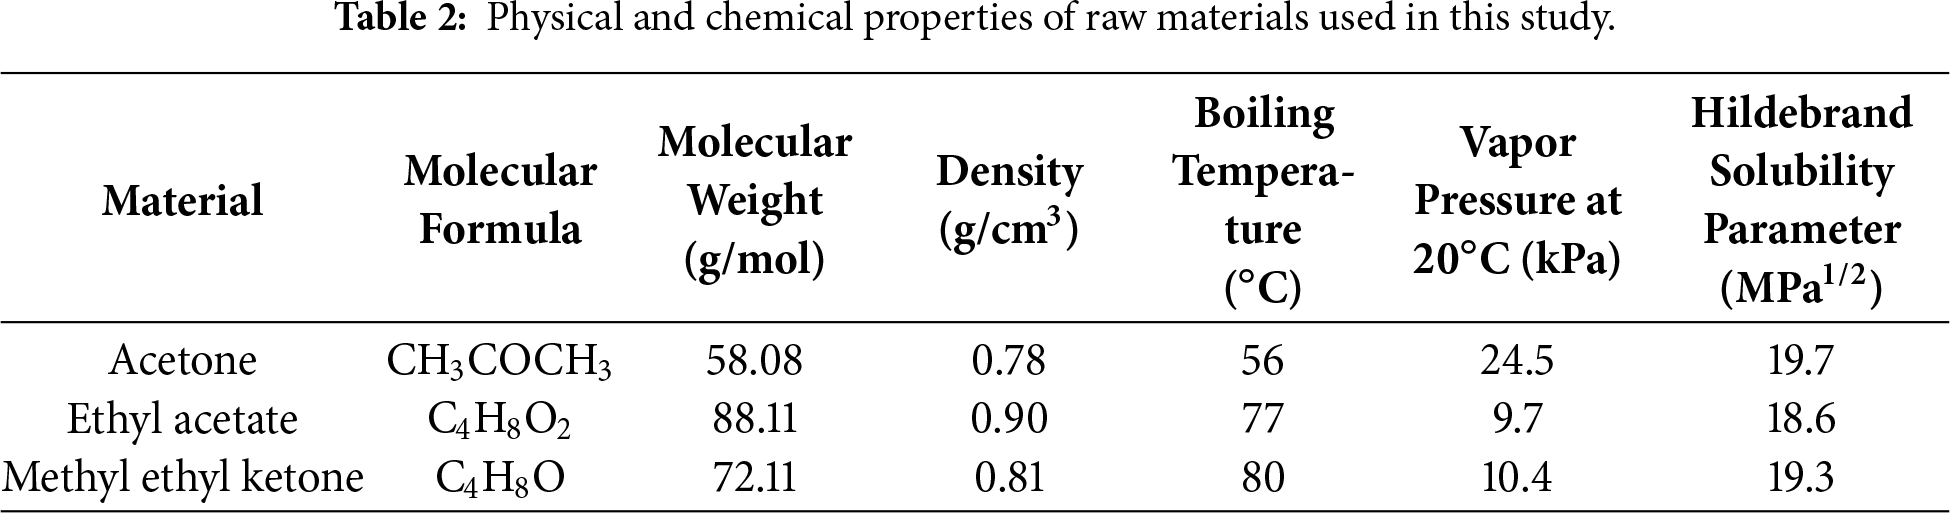
The following materials were used to fabricate epoxy-coated substrates with different solvents: epoxy resin E-51 (Guangzhou Suixin Chemical Co., Ltd., Guangzhou, China); triethylenetetramine (TETA, Daejung Chemicals & Metals Co., Ltd., Siheung, Republic of Korea) as a curing agent; acetone (CH3COCH3, 99.9%, Duksan Pure Chemicals Co. Ltd., Ansan, Republic of Korea), ethyl acetate (CH3COOC2H5, 99.5%, Daejung Chemicals & Metals Co., Ltd., Siheung, Republic of Korea), and methyl ethyl ketone (C2H5COCH3, 99%, Duksan Pure Chemicals Co. Ltd., Ansan, Republic of Korea) for dilution. Glass slides (76 mm × 26 mm × 1 mm, Paul Marienfeld GmbH & Co., KG, Lauda-Königshofen, Germany) were used as substrates. Table 2 summarizes the physical and chemical properties of the raw materials used in this study.
The preparation of the coating solution and the coating process are illustrated in Fig. 1. Glass slides were cleaned with acetone to remove residual contaminants. In separate beakers, 10 g of epoxy was added, followed by the addition of 75 g of each solvent (acetone, ethyl acetate, or methyl ethyl ketone). The mixtures were subjected to ultrasonic dispersion for 20 min to dissolve the epoxy in the solvent, followed by magnetic stirring for 30 min to obtain homogeneous solutions. The curing agent was added to the beakers at an epoxy resin-to-TETA ratio of 2:1 (wt/wt), which is a stoichiometric ratio for complete curing of bisphenol A type epoxy resins with amine curing agents, with an additional 30 min of magnetic stirring to prepare the coating solutions. The prepared solutions were applied to glass slides using vertical dip coating, following previously established procedures [16]. The withdrawal speed was identical for all specimens; the slides were immersed until two-thirds of the glass slide was submerged, held for 1 min, and withdrawn at the same controlled speed. All specimens were dried in a thermal oven at 60°C for 6 h in a vertical orientation to improve the adhesion between the coating material and substrate. Specimens with completely removed solvents were designated as follows: uncoated substrate as bare glass, acetone-solvent specimen as acetone, ethyl acetate-solvent specimen as EA, and methyl ethyl ketone-solvent specimen as MEK. Each coating exhibited a similar thickness of 2–3 μm.
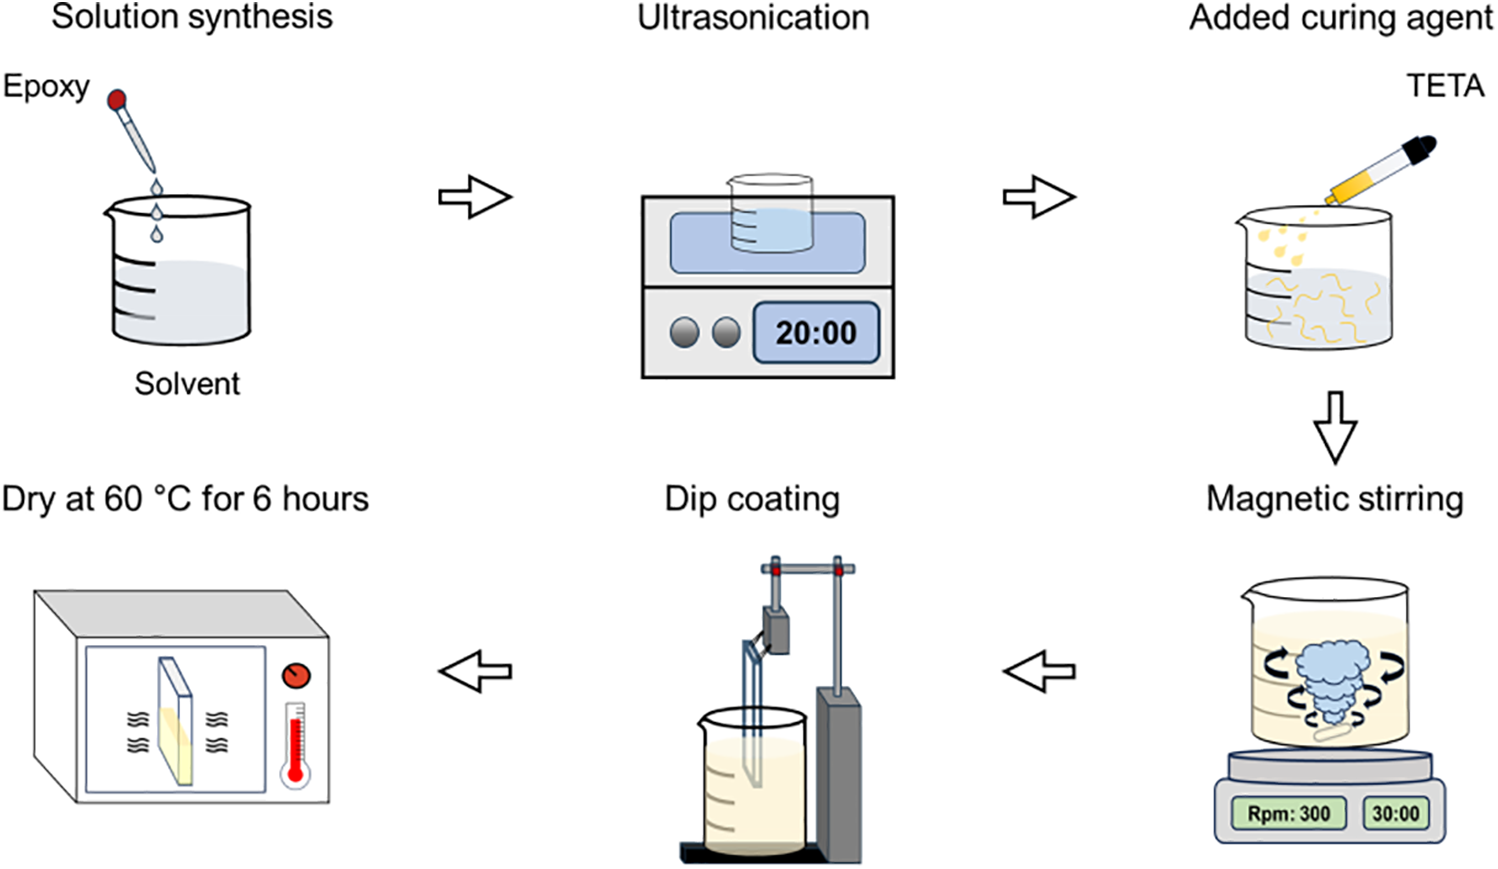
Figure 1: Schematic of the specimen fabrication process.
The phase structure of the coatings was analyzed via X-ray diffraction (XRD; EMPyrean, PANalytical, UK) at 40 kV and 30 mA, scanning from 5° to 50° at 0.02° intervals. The identification of the amorphous halo pattern was based on comparison with XRD data of cured epoxy resins reported in previous literature [17]. Fourier-transform infrared spectroscopy (FT-IR; Spectrum 3, PerkinElmer, USA) was performed over 550–4000 cm−1 at a resolution of 1 cm−1 to analyze the chemical bonding characteristics of the samples. The band assignments were based on characteristic absorption frequencies of epoxy-amine systems reported in previous studies [18–20]. The surface morphologies of the fabricated epoxy coatings were examined using optical microscopy (DM750, Leica, Wetzlar, Germany). Surface roughness was measured with a 2D profilometer (SV-2100M4, Mitutoyo Co., Ltd., Kawasaki-shi, Japan) with a reference length of 2.5 mm, 2 intervals, evaluation length of 5 mm, and speed of 0.2 mm/s [21]. The measurements were performed at least three times, and the Ra values were obtained according to ISO 21920-2. For the contact angle measurements to evaluate wettability, the sessile drop method was applied according to ASTM D7334. A volume of 10 μL of DI water was placed on the coated substrates and photographed using a digital microscope [22]. The contact angles were calculated using the ImageJ software.
The friction and wear behaviors were investigated using a reciprocating tribometer (RFW 160, NEOPLUS Co., Ltd., Daejeon, Republic of Korea) with a stainless-steel ball (D: 1 mm) as the counterface. The tribological test was conducted based on the methodology described in ASTM G133 [23]. Under dry friction conditions, a normal load of 200 mN was applied, and reciprocating motion was performed at 16 mm/s with a 4 mm stroke for 2000 cycles. The low normal load was selected to evaluate the tribological behavior of thin coatings at the micro-scale while preventing immediate coating failure, which is consistent with previous studies on thin polymer film tribology [1,24]. The sliding speed and stroke were chosen to simulate mild contact conditions representative of protective coating applications. To confirm reliability, friction tests were performed at least three times, and average friction coefficient values were obtained. The wear track width and depth were measured using a digital microscope and 2D profilometer, respectively. The wear rate was calculated by dividing the wear volume by the applied load and total sliding distance. The formed wear tracks were observed using optical microscopy.
Finite element analysis (FEA) was performed to investigate the stress distribution behavior according to the surface roughness during contact and sliding. Two models were constructed: a smooth surface model (Ra < 0.1 μm) and a rough-surface model (Ra < 0.4 μm). The material properties used in the simulation were as follows: epoxy coating with elastic modulus of 2.6 GPa and Poisson’s ratio of 0.37; glass substrate with elastic modulus of 64 GPa and Poisson’s ratio of 0.22; and 304 stainless steel counterface with elastic modulus of 210 GPa and Poisson’s ratio of 0.35 [1,25,26]. The coating thickness was set to 2.5 μm, the substrate size was 1 mm × 50 μm, and the counterface diameter was 1 mm.
The boundary conditions and mesh parameters were defined as follows. A reference point was designated at the upper surface of the counter tip and coupled to control the loading condition. A normal load of 200 mN was applied during contact (indentation), followed by a sliding displacement of 0.5 mm to simulate the tribological contact conditions. The contact between the counter tip and epoxy coating was defined using surface-to-surface contact interaction. The substrate and epoxy coating employed quad-dominated element shapes for improved accuracy in stress distribution analysis, while the counter tip used triangular (Tri) element shapes to better conform to its spherical geometry. The mesh sizes were set as follows: 0.02 for the counter tip, 0.01 for the coating layer, and 0.02 for the substrate. The coating and substrate were bonded using a tie constraint to represent the deposited coating layer. The analysis was performed using a static general step type.
Fig. 2 shows the XRD patterns of the epoxy coatings prepared using different solvents. All specimens exhibited a broad diffraction halo spanning 2θ = 10°–30°, with a center located at approximately 23°. This characteristic pattern indicates that the polymer chains within the cured epoxy resin possess a typical amorphous structure [17]. Despite the changes in the solvent type, the diffraction pattern shape and peak positions remained consistent across all specimens. This observation demonstrates that differences in the solvent evaporation rate or solubility do not influence the crosslinking structure formation or microcrystallization of the epoxy matrix. Each solvent served solely as a processing medium for the dip-coating process while preserving the intrinsic properties of the epoxy.
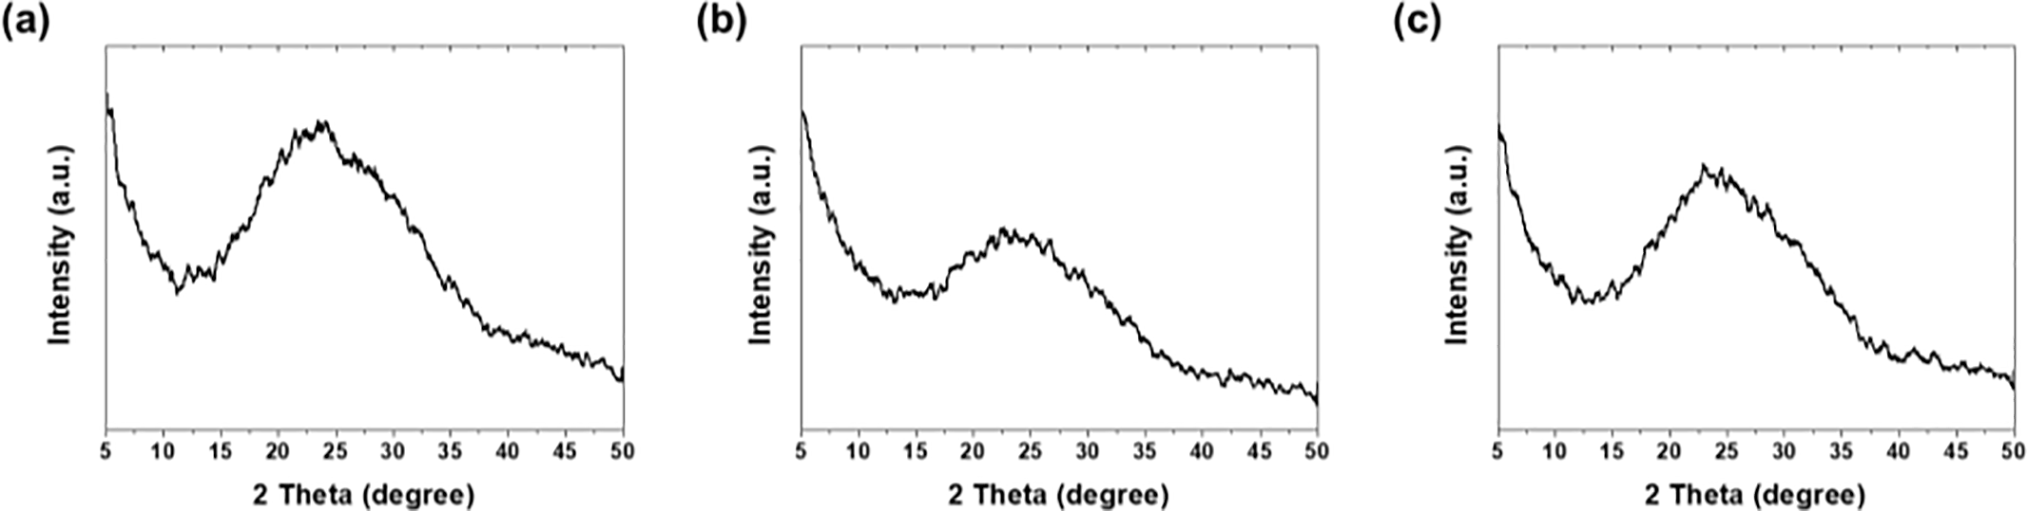
Figure 2: XRD patterns of epoxy coatings: (a) acetone, (b) EA, and (c) MEK.
Fig. 3 shows the FT-IR spectra of the epoxy coatings prepared using each solvent. The chemical bonding characteristics resulting from the reactions between the epoxy resin and curing agent were confirmed for all the specimens. Vibrations in the 3700–3100 cm−1 range appeared as overlapping N-H stretching vibrations of primary and secondary amines with O-H vibrations of hydroxyl groups generated during curing reactions, indicating the participation of the curing agent in epoxy network formation [18]. Vibrations in the 2975–2870 cm−1 range correspond to symmetric/asymmetric C-H stretching vibrations of the methyl and methylene groups in the aliphatic chains constituting the epoxy resin [19]. The peaks at 1608, 1580, and 1508 cm−1 are C=C skeletal and stretching vibration peaks of aromatic benzene rings within the epoxy resin, indicating the maintenance of the fundamental backbone. The peaks at 1296 and 1246 cm−1 are attributed to the C-N stretching vibration of the amine curing agent and O-H deformation vibration absorption, respectively [20]. At 1037 cm−1, C-O-C ether bond stretching vibrations generated after curing reaction were observed, and vibrations through aromatic ring substitution were detected at 825 cm−1.
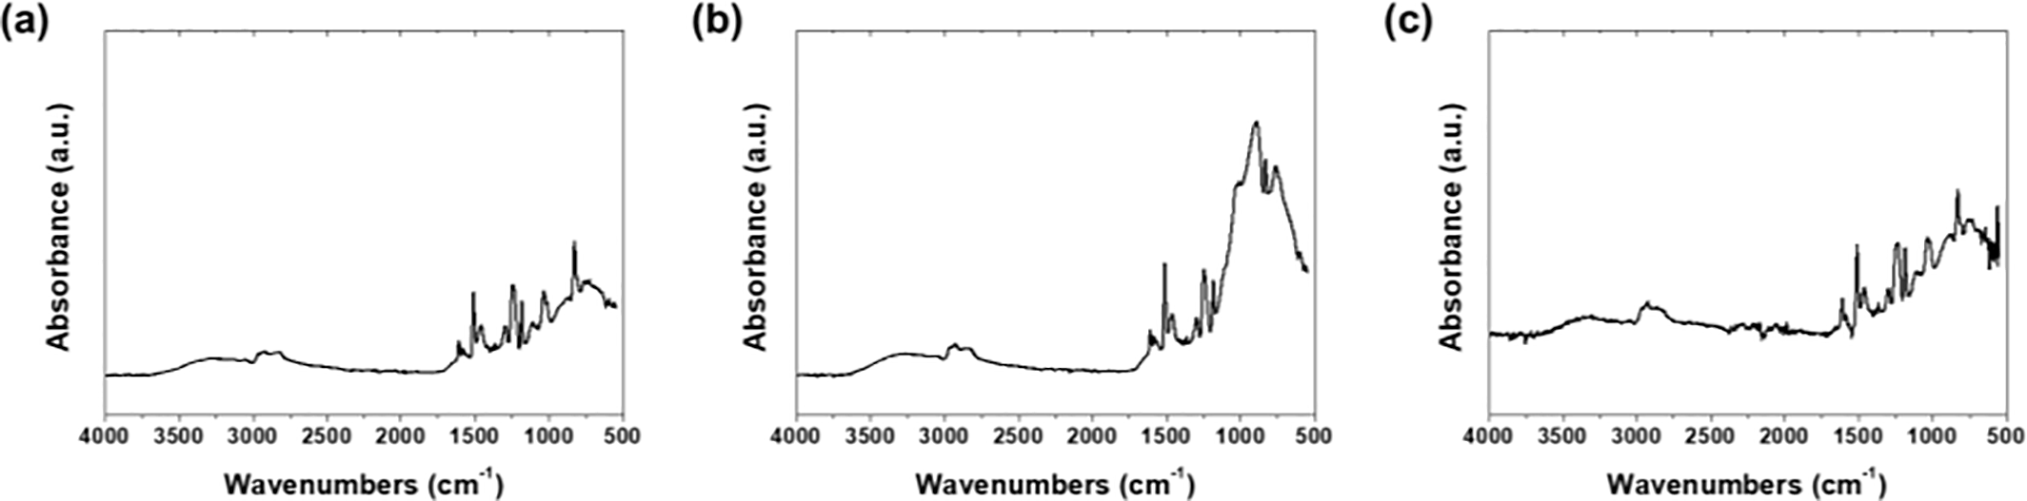
Figure 3: FT-IR spectra of epoxy coatings: (a) acetone, (b) EA, and (c) MEK.
The oxirane ring C-O-C bond peaks at 912–915 cm−1 disappeared in all specimens, confirming complete epoxy group consumption in the crosslinking reactions, regardless of the solvent type. The EA specimen exhibited the highest and sharpest absorbance compared to the other solvents, suggesting that the slower evaporation rate of EA relatively increased the coating film density. A new peak observed near 893 cm−1 was attributed to the structural rearrangement of the polymer chains induced during the solvent evaporation process.
The primary objective of XRD and FT-IR analysis in this study was to confirm that the different solvents did not induce any chemical or structural changes in the cured epoxy coatings. The solvent selection was based on previously published studies [12,27–29]. By confirming identical chemical structures across all coatings, the effect of solvent-induced surface morphology on tribological performance can be isolated as the sole variable.
Fig. 4 presents optical microscopy images showing the surface morphologies of each specimen. The bare glass exhibited a clean surface without defects (Fig. 4a). When acetone was used as the solvent, severe undulations occurred throughout the surface, and rough structures were observed (Fig. 4b). This structure originates from the Marangoni instability [30]. The high vapor pressure of acetone induced rapid evaporation during the drying process. As acetone evaporates, it removes the latent heat of vaporization, causing the surface temperature to become lower than that of the coating interior, generating localized temperature differences. Surface tension variations according to temperature differences induced epoxy flow toward regions where acetone had evaporated. Convective flow occurred during acetone drying and solidified, forming a stripe-like surface morphology. Circular features were distributed throughout the surface, which was attributed to the popping phenomena, where trapped solvents attempted to escape through the cured film [31].
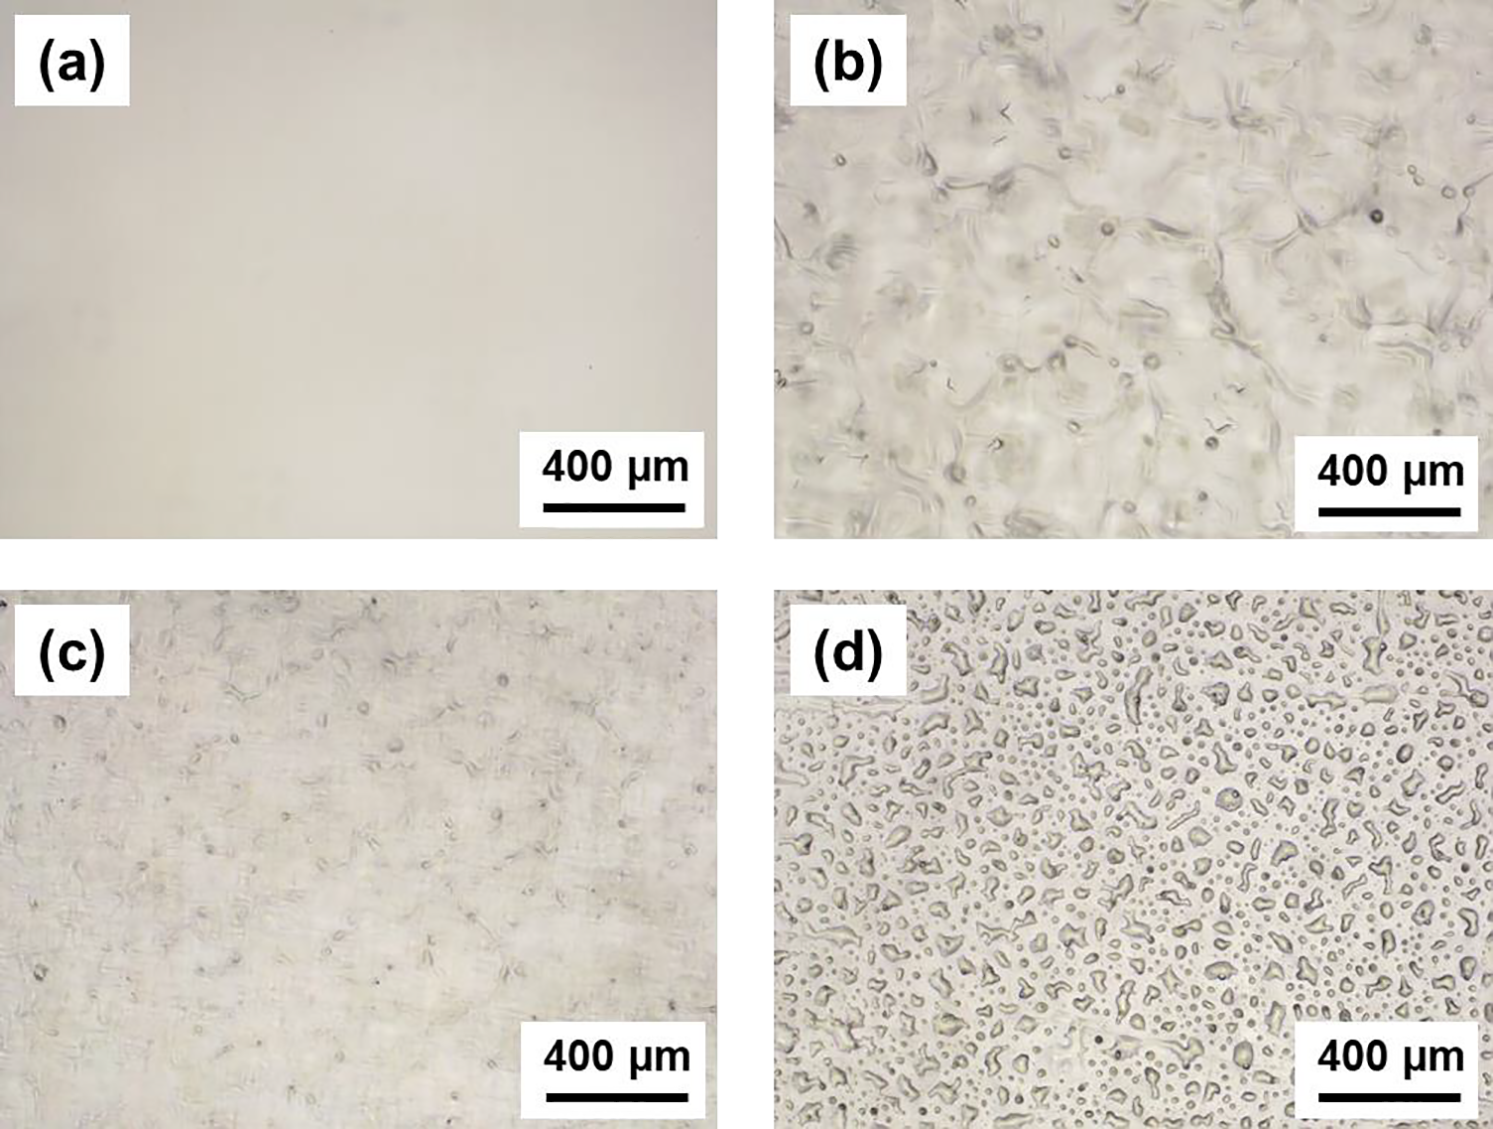
Figure 4: Optical microscopy images of the coating surfaces: (a) bare glass, (b) acetone, (c) EA, and (d) MEK.
In contrast, the EA specimens exhibited a smoother surface morphology than the acetone specimens (Fig. 4c). The lower vapor pressure and slower volatilization rate of EA relative to acetone eliminated the irregular surface flow. Gradual evaporation maintained the solvent on the surface long enough to minimize the concentration gradients caused by surface tension differences, preventing abrupt convection phenomena. However, small circular features remained on the surface. The MEK specimens showed irregular droplets of several micrometers in size formed throughout the surface (Fig. 4d). Unlike Acetone or EA, where evaporation-induced holes became embedded as structural features, in MEK, these holes grew and pushed the coating layer apart, causing the epoxy to agglomerate into droplets to minimize the surface area [32].
Fig. 5 presents the surface roughness measurements of the bare and epoxy-coated glass substrates. Bare glass exhibited Ra of 0.013 (±0.0005) μm, possessing the smooth surface characteristics of pristine glass. The acetone specimens recorded the highest surface roughness of Ra = 0.66 (±0.017) μm, consistent with the structures observed in optical microscopy, confirming that Marangoni flow significantly influenced roughness development. The EA specimens exhibited the lowest roughness value of Ra = 0.17 (±0.009) μm. As the solvent evaporated most slowly, the solution viscosity increased gradually, which suppressed Marangoni convection and provided sufficient time for the polymer chains to rearrange into flattened configurations. MEK specimens showed intermediate roughness of Ra = 0.39 (±0.019) μm, between Acetone and EA. The Hildebrand solubility parameter of MEK lies between those of Acetone and EA, indicating the influence of both viscosity and evaporation rate [27]. These results show a clear correlation: the surface roughness increased with increasing solvent evaporation rate.
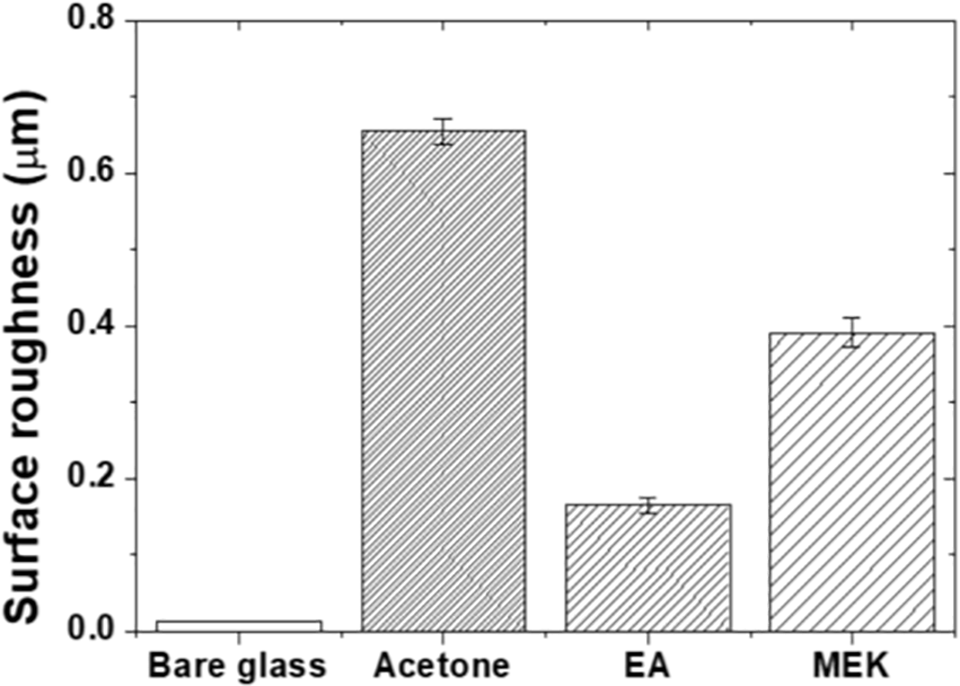
Figure 5: Surface roughness of the bare and epoxy-coated glass substrates.
The correlation between solvent evaporation rate and surface roughness can be attributed to the influence of evaporation kinetics on the curing process. The faster evaporation of acetone leads to rapid solvent loss during the early stages of thermal curing, creating conditions for microdroplet formation and coalescence before the epoxy network reaches its gel point. In contrast, the slower evaporation of ethyl acetate allows more time for the coating solution to level and flow on the substrate surface before gelation, producing smoother surfaces. Thus, the solvent evaporation rate effectively controls the curing dynamics and the resulting surface morphology.
Fig. 6 presents the water droplet contact angle measurements for bare glass and epoxy coatings. Bare glass exhibited a very low contact angle of approximately 8.6 (±0.476)°, indicating superhydrophilicity, which reflects the high surface energy due to silanol groups on the glass surface. The acetone, EA, and MEK specimens showed contact angles of 66.4 (±0.879)°, 68.1 (±1.823)°, and 68.7(±1.08)°, respectively, representing increases compared to the bare glass substrate. This demonstrates that the hydrocarbon chains and aromatic rings of the epoxy resin lowered the surface energy, reducing wettability.
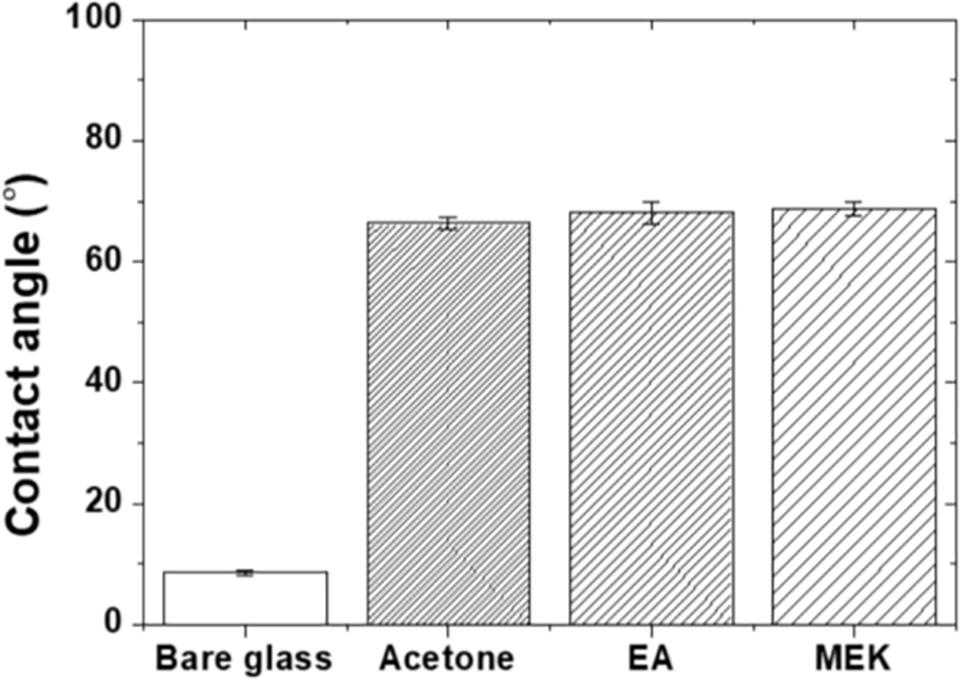
Figure 6: Water droplet contact angles of the specimens.
Despite significantly different roughness values, the contact angles showed similar results across all epoxy coatings. According to the Wenzel equation (cos θm = r·cos θ, where θm is the apparent contact angle on a rough surface, θ is the intrinsic contact angle on a smooth surface, and r is the roughness factor defined as the ratio of actual surface area to projected area), increasing the surface roughness of hydrophilic surfaces (θ < 90°) generally leads to lower contact angles [33]. All epoxy coatings in this study exhibited contact angles between 66.4° and 68.7°, indicating hydrophilic behavior. If roughness were the dominant factor, the acetone specimen (Ra = 0.66 μm) should exhibit a lower contact angle than the EA specimen (Ra = 0.17 μm). However, the contact angles remained nearly constant across all coatings, suggesting that the roughness factor r within this roughness range was not large enough to produce measurable contact angle variations. The chemical functional groups on the epoxy surface, including hydrocarbon chains and aromatic rings, dominated the wetting behavior rather than the surface topography. This finding provides additional confirmation that the chemical composition of the epoxy surface remains constant regardless of the solvent choice, further isolating the surface topography as the primary variable affecting the tribological behavior.
Fig. 7 presents the friction coefficient evolution during 2000 cycles of reciprocating motion. The specimens exhibited different patterns in the initial friction, transition, and steady-state stages, depending on the surface characteristics.
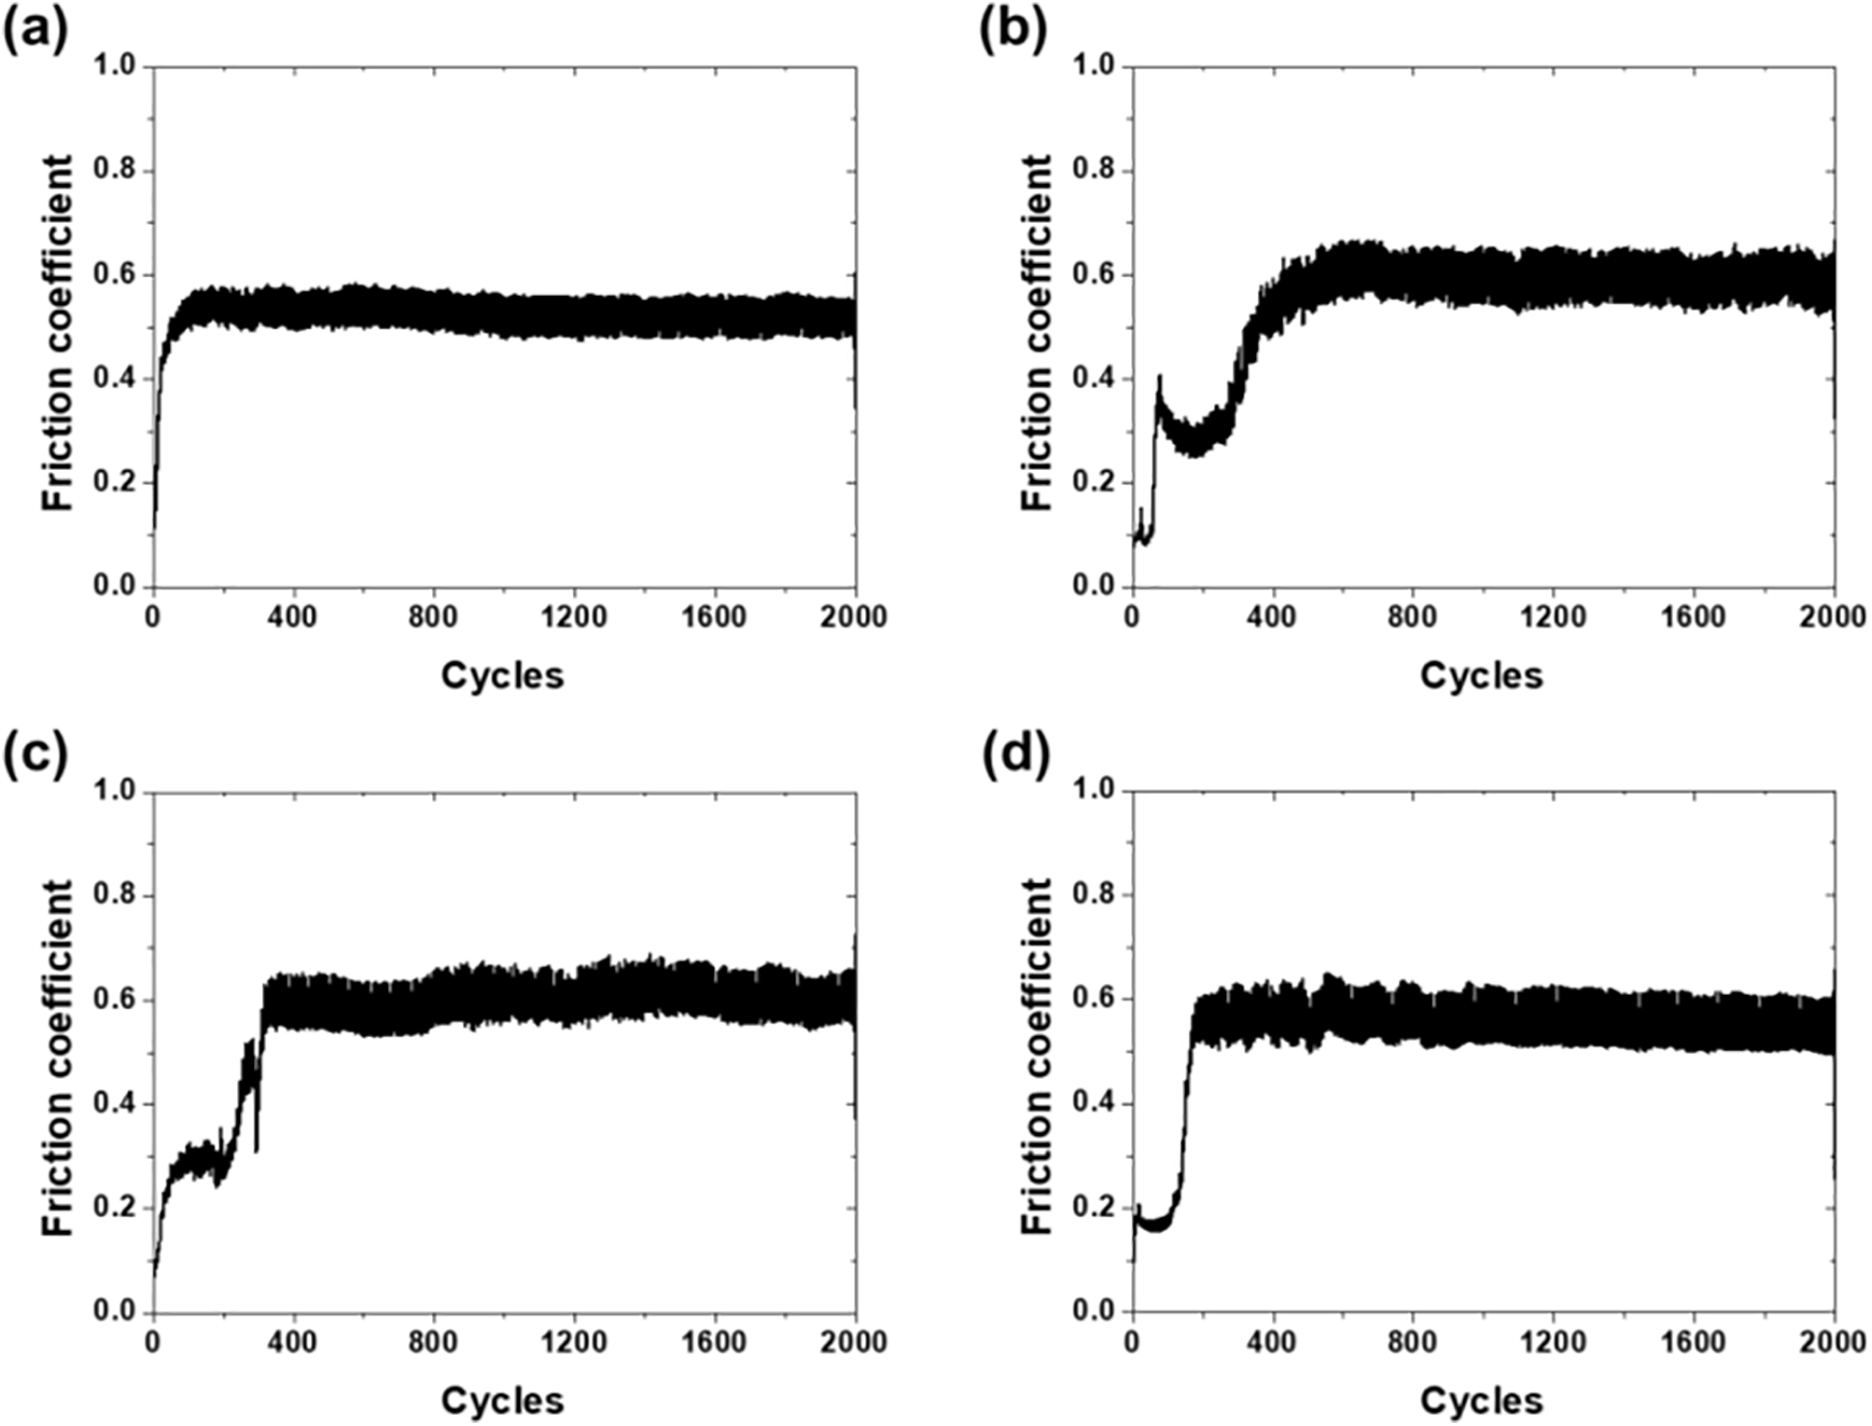
Figure 7: Friction coefficient history: (a) bare glass, (b) acetone, (c) EA, and (d) MEK.
Bare glass, lacking a coating layer, showed a rapid increase in the friction coefficient to approximately 0.55 within approximately 100 cycles after friction initiation, and this level was maintained until the end of the test (Fig. 7a). This was due to the direct contact between the metallic counterface and glass substrate. Without a protective layer, abrasive wear occurred immediately, displaying typical glass friction behavior with a friction coefficient of 0.55 maintained throughout 2000 cycles.
The acetone specimens showed an increase in the friction coefficient to 0.4 in the initial 50 cycles, followed by a temporary decrease until 300 cycles, exhibiting running-in behavior (Fig. 7b). The friction coefficient increased again, reaching a steady state at 0.6 by 600 cycles. The high roughness of the acetone specimens induced interlocking between micro-asperities during the initial friction, causing a high initial friction force. The decrease in the friction coefficient during 50–300 cycles is interpreted as temporary surface smoothing through the wear removal of protruding micro-asperities [1]. The friction coefficient increased after 300 cycles, indicating that the worn epoxy particles acted between the friction surfaces, increasing the friction resistance.
The friction coefficient of the EA specimens gradually increased to 0.3 during the initial 50 cycles, and this level was maintained for approximately 200 cycles (Fig. 7c). A sharp increase in the friction coefficient occurred at approximately 400 cycles, after which a friction coefficient of 0.6 was maintained. The low roughness of the EA specimens served to uniformly distribute the contact load, preventing localized stress concentration and contributing to a low initial friction coefficient. The sharp increase in the friction coefficient at approximately 400 cycles followed by stabilization represents the transition from the running-in period to steady-state friction, which is a characteristic tribological behavior of thermoset polymers. During the running-in period, the surface asperities are progressively worn and a transfer film may form on the counterface, after which the friction coefficient stabilizes to a steady-state value [34].
The MEK specimens exhibited the lowest initial friction coefficient of 0.2 during the initial 100 cycles (Fig. 7d). The friction coefficient reached 0.6 after approximately 200 cycles. The factor reducing the initial friction coefficient originates from the surface structure of the MEK specimens. The convexly protruding epoxy surface structures reduced the real contact area with the counterface, decreasing the contact resistance and forming a low friction coefficient.
Fig. 8 shows the average friction coefficient of each specimen measured over 2000 cycles. Although the initial friction behavior patterns differed markedly according to the solvent type, the average values over the entire test range converged to 0.51 (±0.02) for all epoxy-coated specimens. This convergence to a common steady-state friction coefficient, despite vastly different initial behaviors, indicates that while the surface texture governs the early stage tribology, the intrinsic material properties of epoxy ultimately dictate the long-term friction response.
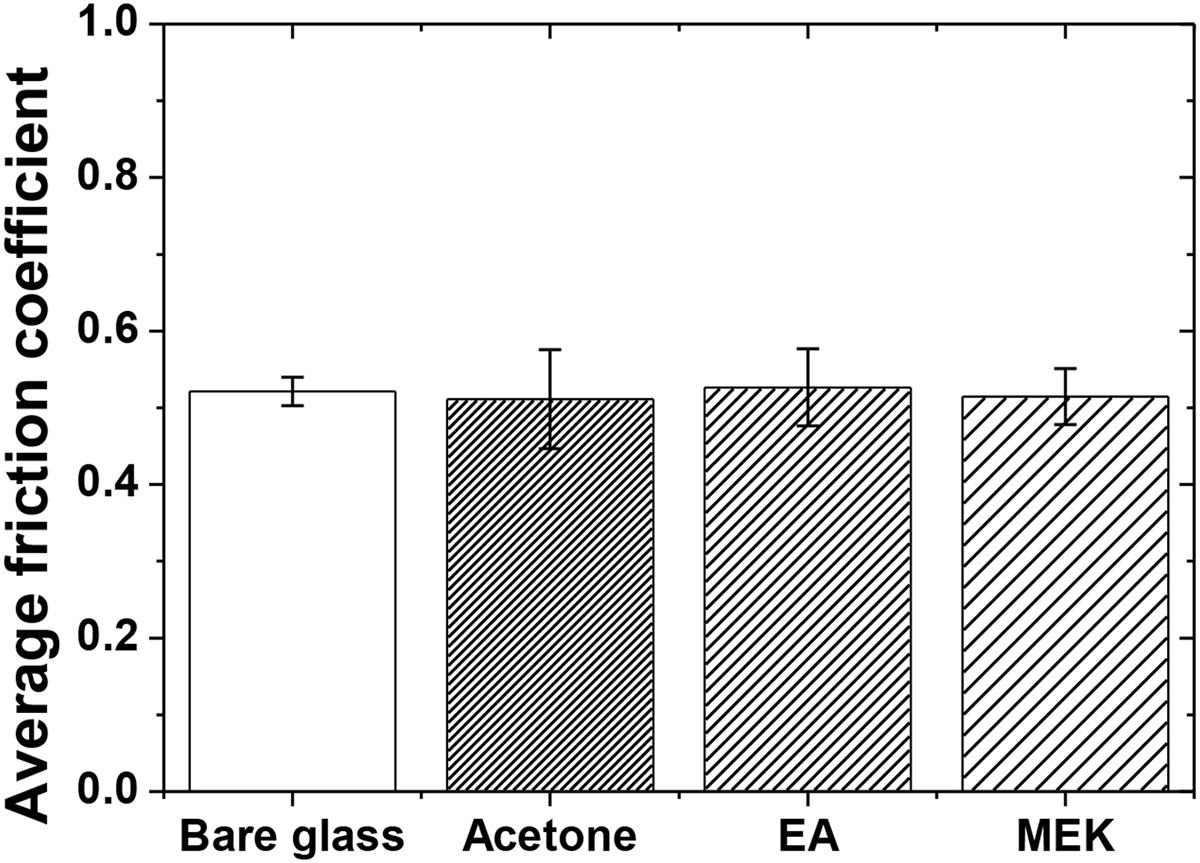
Figure 8: Average friction coefficient of each specimen.
Fig. 9 presents the wear analysis, including the track width, depth, and wear rate. Although the steady-state friction coefficient values converged across all coatings, the wear characteristics, which determine coating durability and substrate protection, exhibited pronounced differences.
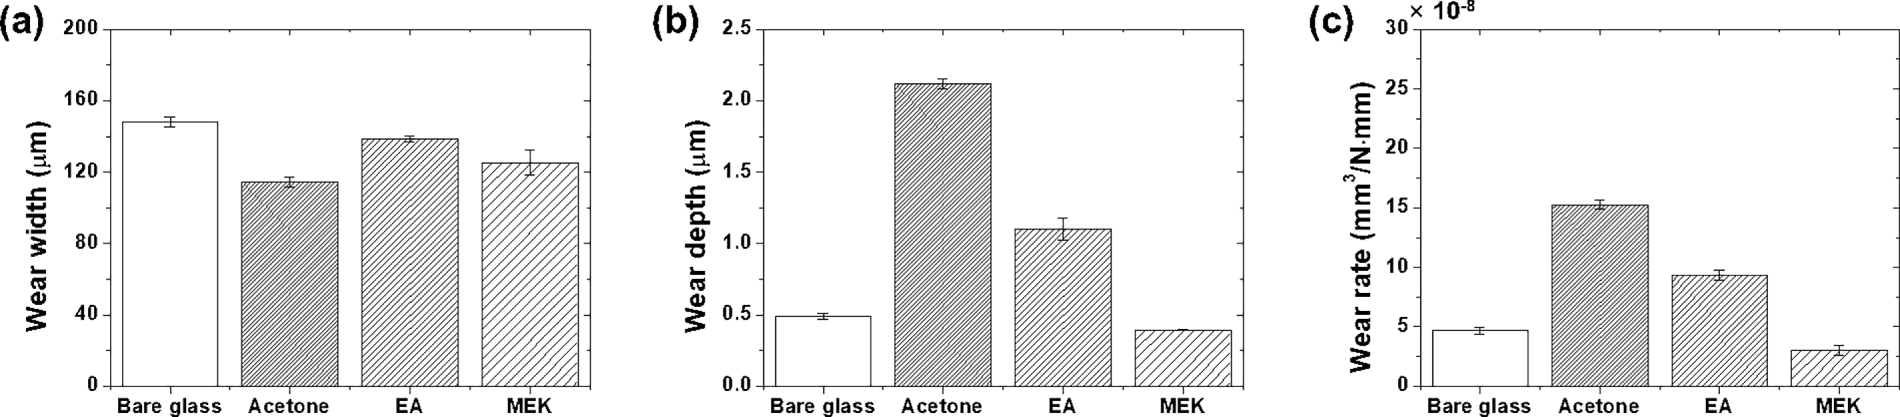
Figure 9: Wear characteristics: (a) wear width, (b) wear depth, and (c) wear rate.
Fig. 9a shows the wear width results. Bare glass exhibited the widest wear width of 148 (±2.93) μm. When a smooth glass contacts the counterface, it forms a face contact according to the Hertzian contact theory, securing the maximum contact area corresponding to the counterface curvature radius [35]. Among the epoxy coatings, the EA specimens exhibited the largest wear width of 138 (±1.79) μm, followed by MEK at 125 (±6.85) μm and acetone at 114 (±2.65) μm. This trend is inversely correlated with surface roughness; smoother surfaces form wider contact areas, whereas rougher surfaces concentrate contact into narrower regions.
Fig. 9b shows the wear depth measurements. Bare glass formed a relatively low depth of 0.49 (±0.02) μm because of its higher hardness than that of epoxy resin. The acetone specimens exhibited the largest wear depth of 2.12 (±0.04) μm; the localized pressure acting on the narrow contact width caused severe coating layer loss. EA specimens showed an intermediate depth of 1.1 (±0.08) μm; the smooth surface distributed stress more effectively than acetone, resulting in a shallower wear depth. Remarkably, the MEK specimens showed a wear depth of only 0.39 (±0.004) μm, which is shallower than that of bare glass. This result suggests that the fine texture formed during solvent evaporation effectively protected the coatings. The spaces between the microstructures trap wear particles during friction, minimizing coating layer loss while protecting the substrate.
Fig. 9c presents the calculated wear rate. Bare glass showed 4.7 × 10⁻⁸ mm3/N·mm, reflecting the inherent hardness of glass. Acetone specimens showed the highest wear rate of 15.3 × 10⁻⁸ mm3/N·mm—despite having the narrowest wear width, stress concentration on the rough surface penetrated deeply into the coating layer. The EA specimens exhibited an intermediate wear rate of 9.33 × 10⁻⁸ mm3/N·mm. Although the smooth surface formed the widest wear width, the stress distribution effects reduced the wear depth compared to that of acetone, resulting in an approximately 40% lower volume loss. Most notably, MEK specimens achieved 3.0 × 10⁻⁸ mm3/N·mm, which is 36% lower than that of bare glass and 80% lower than that of acetone-based coatings. The surface texture formed during MEK evaporation minimized adhesion to the sliding surface and trapped wear debris, demonstrating superior wear resistance.
Fig. 10 shows optical microscopy images of the wear tracks after 2000 cycles of testing. Bare glass showed clear wear track boundaries with partial scratches (Fig. 10a). The optical images revealed fractured regions within the glass wear track, and the surrounding debris suggested that the brittle glass material underwent microfracture at the micro-scale level visible. The brittle glass material underwent microfracture, generating particles that participated in the abrasion process. The acetone specimens showed the most abundant large epoxy fragments scattered around the track (Fig. 10b), which appeared as large fragments at the micro-scale level observable. The irregular track boundaries and the size of the scattered debris indicated severe adhesive wear with large-scale coating delamination. The EA specimens exhibited wide gouging in the track center with numerous scratch marks parallel to the sliding direction (Fig. 10c). The irregular track boundaries indicate that the crushed and displaced epoxy caused continuous abrasive wear. The MEK specimens formed the cleanest and shallowest wear tracks among all the specimens (Fig. 10d). The track contours were very faint, and wear particles outside the track were hardly observed. Although black spots were formed throughout the track, their number was negligibly small, indicating effective debris trapping within the surface interstices.
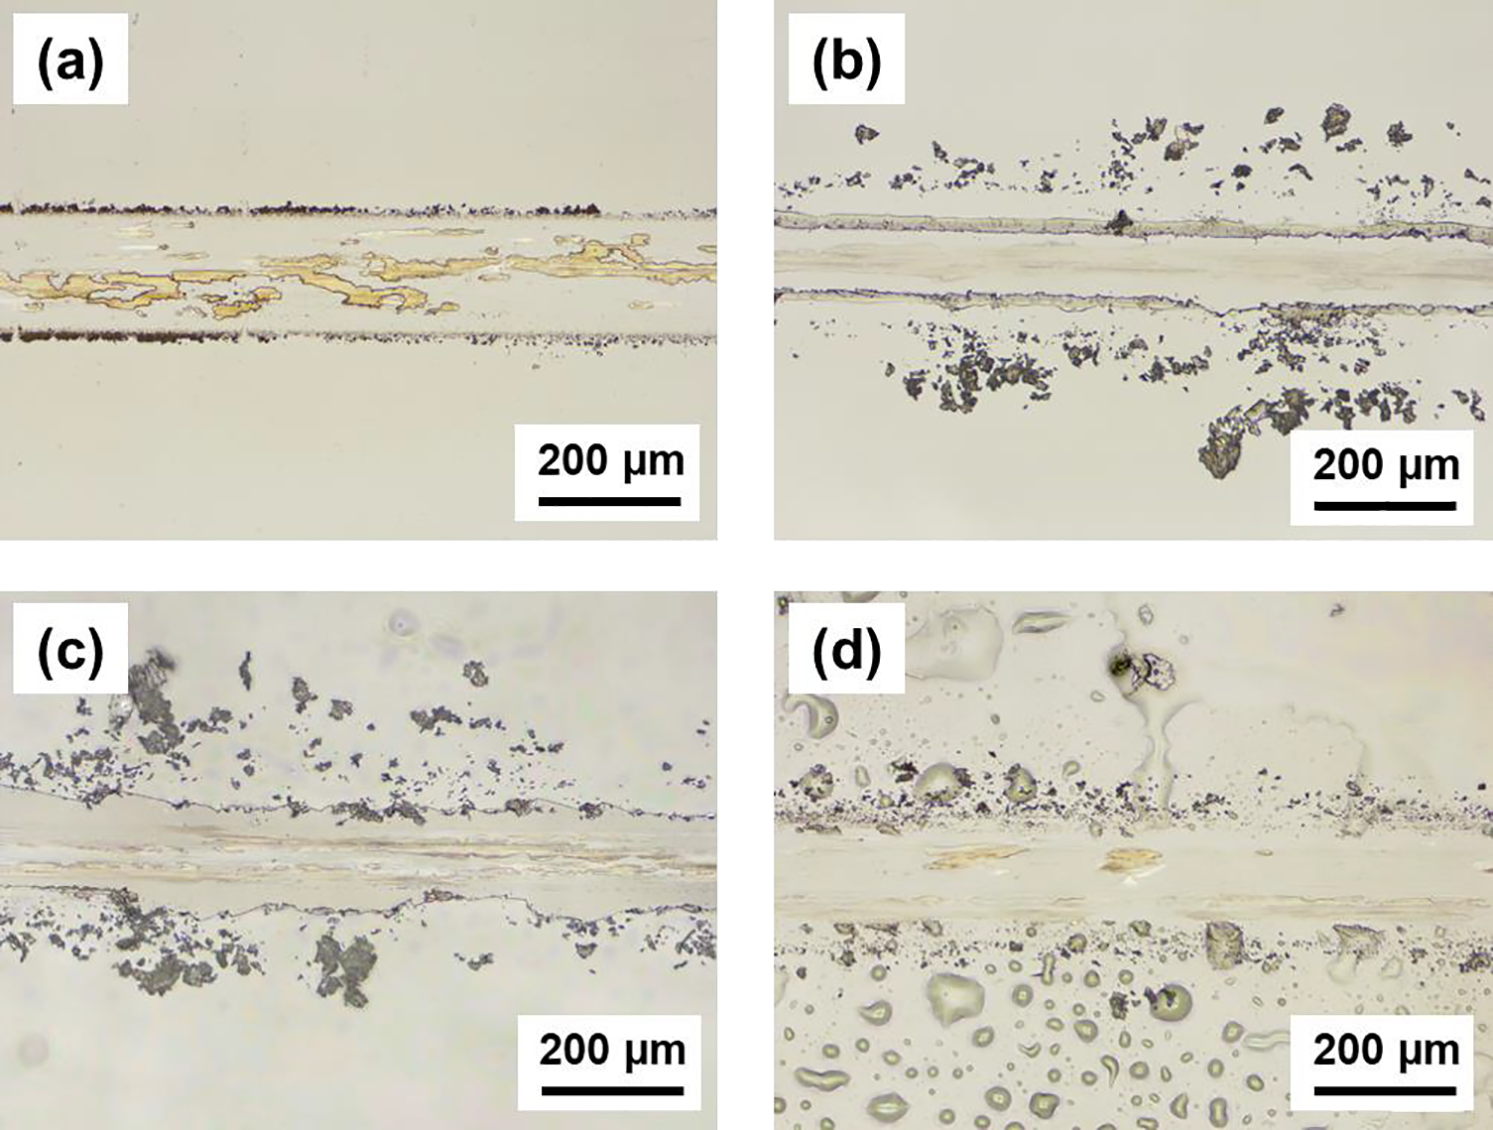
Figure 10: Optical microscopy images of wear tracks: (a) bare glass, (b) acetone, (c) EA, and (d) MEK.
To further validate the proposed wear mechanism and quantify the stress distribution behavior according to surface roughness, a finite element analysis was performed. Fig. 11 presents the stress distribution contours for the smooth and rough surface models under contact conditions. Both models exhibited similar stress distribution patterns; however, the morphology of the contact zone differed significantly. The rough-surface model exhibited a narrower contact region than the smooth-surface model, indicating improved stress absorption and distribution performance through the textured geometry.
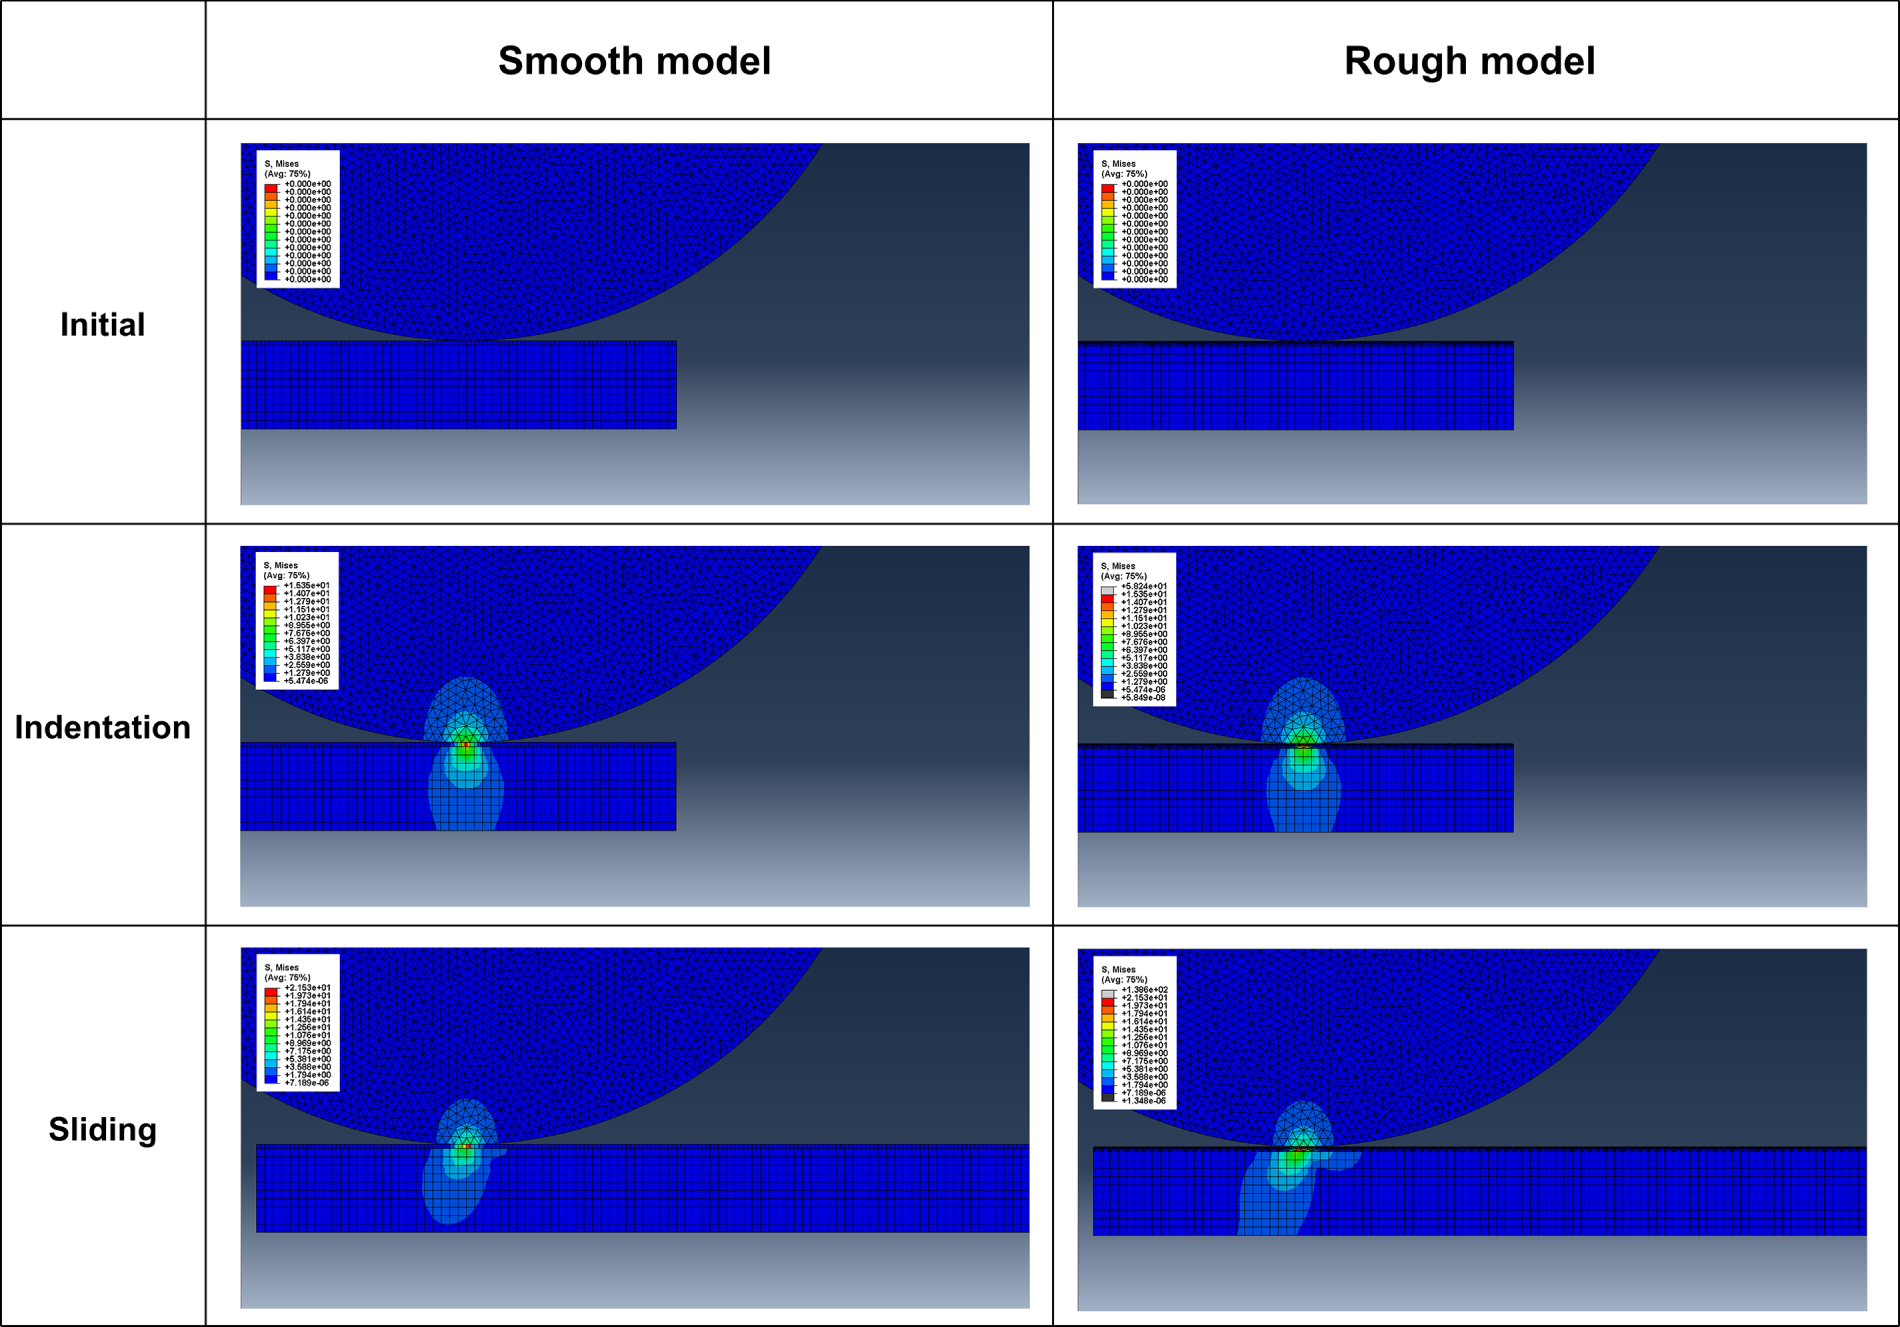
Figure 11: FEA stress distribution contour for smooth surface and rough surface.
Fig. 12 presents a quantitative stress comparison between the smooth and rough surface models. During indentation, the stress applied to the coating surface layer showed a substantial difference: 15.35 MPa for the smooth model and 58.24 MPa for the rough model (Fig. 12a). This significant increase in the coating stress for the rough surface is attributed to the localized contact at the asperity peaks, which concentrates the applied load into smaller contact areas. However, despite this pronounced difference in the coating layer stress, the stress transmitted to the counterface remained nearly identical: 6.59 MPa for the smooth model and 6.87 MPa for the rough model during indentation (Fig. 12b). During sliding, the counterface stress values were also comparable at approximately 6.7 MPa for smooth and 6.9 MPa for rough surfaces (Fig. 12c).
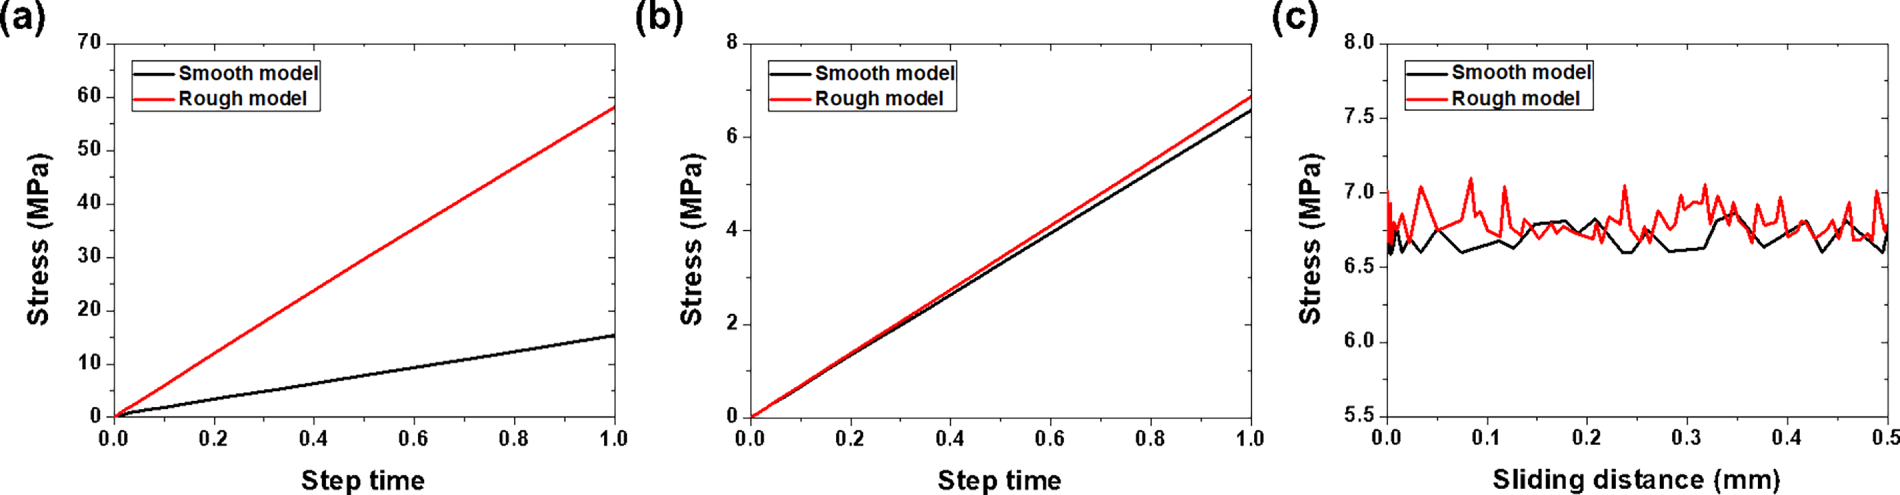
Figure 12: FEA stress comparison: indentation stress on (a) coating and (b) counterface and (c) sliding stress on counterface.
These FEA results provide critical information on the wear mechanisms of textured surfaces. Although the rough surface experiences significantly higher localized stress within the coating layer, this stress is effectively distributed such that the counterface experiences comparable stress levels, regardless of surface roughness. This stress distribution capability explains why textured surfaces can maintain a low wear rate despite the seemingly unfavorable high local stress concentration. The microstructures act as stress absorbers, dissipating energy through localized deformation rather than transmitting destructive forces to the substrate or generating large amounts of wear debris.
The primary objective of the finite element analysis in this study was to quantify the stress distribution behavior that governs the wear resistance of textured surfaces. Experimental measurements can determine the friction coefficient and wear rate, but they cannot directly measure the internal stress distribution within the coating and at the contact interface. The FEA results revealed that while textured surfaces experience significantly higher localized stress within the coating layer (58.24 vs. 15.35 MPa for smooth surfaces), the stress transmitted to the counterface remains comparable (approximately 6.9 MPa vs. 6.7 MPa during both indentation and sliding). This finding explains why the MEK coating with intermediate roughness (Ra = 0.39 μm) achieved the lowest wear rate (3.0 × 10⁻⁸ mm3/N·mm) despite not having the smoothest surface. The microdroplet morphology formed during MEK evaporation acts as stress absorbers, dissipating energy through localized deformation of the asperity peaks rather than transmitting destructive forces to the substrate. Combined with the debris entrapment function, the FEA results confirmed that the irregular microtexture formed by MEK evaporation provided an optimal surface architecture for tribological protection. The computational predictions were validated by the experimental wear data, demonstrating that the integrated FEA-experimental approach can effectively predict tribological performance and guide the design of wear-resistant coatings.
Based on the experimental results (Figs. 9 and 10) and finite element analysis (Figs. 11 and 12) presented above, Fig. 13 schematically illustrates the wear mechanisms influenced by the surface roughness and structure of the epoxy coatings. The proposed mechanism is supported by the following evidence: optical microscopy observations showing distinct debris distribution patterns between smooth and textured surfaces; quantitative wear rate differences; and FEA validation demonstrating that textured surfaces absorb localized stress while transmitting comparable stress levels to the counterface.
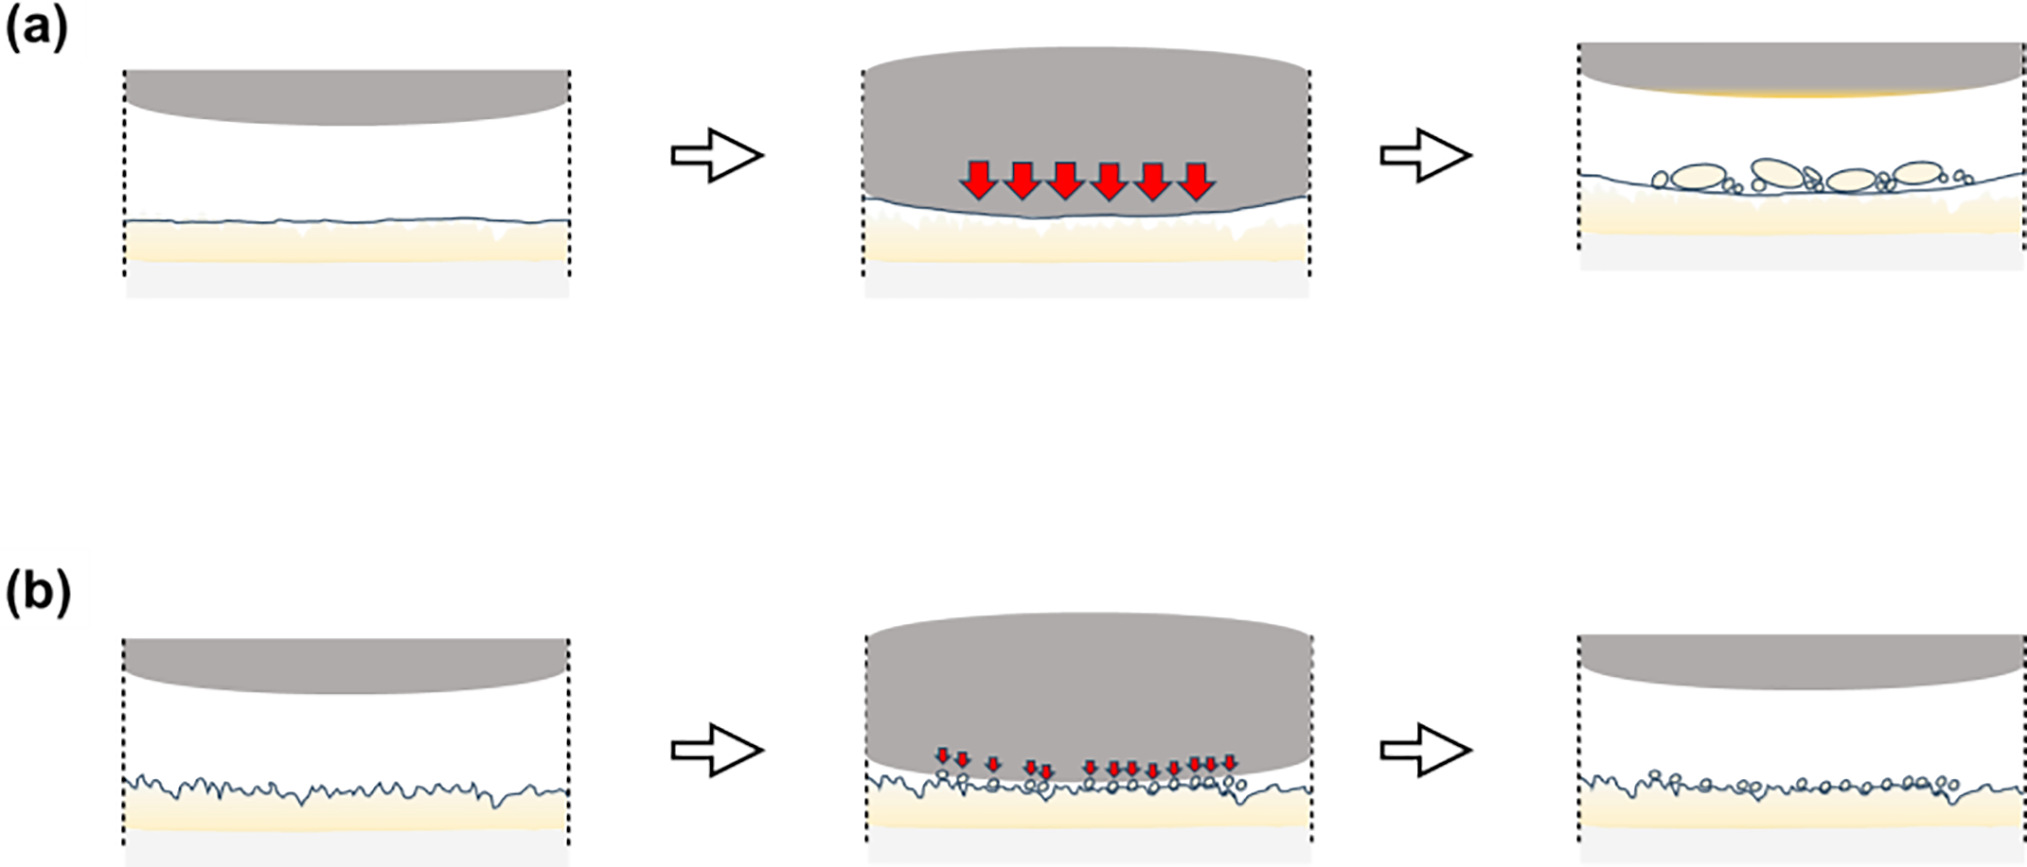
Figure 13: Schematic of wear mechanisms: (a) smooth surface and (b) textured surface.
Fig. 13a shows the wear progression on smooth surfaces. Initially, smooth and continuous surfaces form wide contact with the counterface, applying high shear stress uniformly across the friction surface. Epoxy resins, experience the propagation of microcracks initiated at the surface into the coating interior when a load is applied [7]. The upper coating layer peeled off in large fragments, forming substantial wear particles. These delaminated particles cannot escape the friction interface and adhere to the counterface, accumulating in the wear tracks during sliding. Particles trapped between the counterface and coating layer act as third-body abrasives, accelerating wear and inducing a high wear rate.
Fig. 13b illustrates the wear behavior of the textured surfaces. Micro-asperities and droplet structures formed on the surface reduced the real contact area with the counterface, contributing to reduced adhesion during the initial friction. The discontinuous surface structures interrupt crack propagation pathways even when cracks initiate, preventing large-scale delamination and generating fine debris. The fine wear particles generated during friction are not expelled from the contact zone but are distributed within the interstices between the microstructures. This debris entrapment serves dual functions: it prevents particles from acting as aggressive third-body abrasives, while the trapped particles may form a protective transfer layer, reducing the wear rate.
This study has several limitations that should be considered. The wear track and debris analysis were performed using optical microscopy, and SEM with EDS analysis was not conducted. While optical microscopy was sufficient to observe micro-scale wear patterns and debris distribution, more detailed characterization of debris composition and finer morphological features would strengthen the proposed wear mechanisms. The conclusion regarding identical curing degrees across all solvent types was based on spectroscopic evidence, but quantitative thermal analysis such as differential scanning calorimetry was not performed. The tribological tests were conducted under a single set of conditions, and the effects of varying test parameters on the observed trends were not investigated. This study focused on short-term tribological performance, and long-term durability under extended cycling or different environmental conditions was not evaluated.
Future research directions include: (1) performing SEM and EDS analysis for detailed characterization of wear debris and transfer films; (2) conducting DSC measurements to quantitatively verify the curing degree across different solvent types; (3) investigating the effects of varying load, speed, and environmental conditions on tribological performance; (4) evaluating long-term wear behavior under extended cycling; and (5) extending this solvent-based surface texturing approach to other thermosetting polymer systems and substrate materials.
This study investigated the effect of solvent volatility on the surface morphology and tribological properties of dip-coated epoxy coatings. The main findings are summarized as follows:
(1) XRD, FT-IR, and contact angle analyses confirmed that epoxy coatings prepared with acetone, ethyl acetate, and methyl ethyl ketone exhibited identical amorphous structures, complete curing, and similar surface chemistry (contact angles of 66.4°–68.7°). Surface morphology was isolated as the sole variable for tribological analysis.
(2) Surface roughness increased with solvent evaporation rate: acetone produced the highest roughness (Ra = 0.66 μm) due to Marangoni convection, EA produced the smoothest surface (Ra = 0.17 μm), and MEK produced an intermediate microdroplet morphology (Ra = 0.39 μm).
(3) Acetone-based coatings exhibited severe adhesive wear with the highest wear rate (15.3 × 10⁻⁸ mm3/N·mm) despite the narrowest wear width (114 μm). EA-based coatings showed continuous abrasive wear with an intermediate wear rate (9.33 × 10⁻⁸ mm3/N·mm) and the widest wear width (138 μm). MEK-based coatings achieved the lowest wear rate (3.0 × 10⁻⁸ mm3/N·mm), which was 36% lower than bare glass (4.7 × 10⁻⁸ mm3/N·mm) and 80% lower than acetone-based coatings.
(4) Finite element analysis confirmed that textured surfaces experience higher localized coating stress (58.24 MPa vs. 15.35 MPa for smooth surfaces), but the stress transmitted to the counterface remains comparable (~6.9 vs. ~6.7 MPa). The microdroplet morphology reduced real contact area and trapped wear debris, suppressing abrasive wear.
(5) All epoxy coatings converged to a similar steady-state friction coefficient (0.51 ± 0.02), indicating that surface texture predominantly affects wear resistance rather than long-term friction coefficient.
This study demonstrates that wear resistance of epoxy coatings can be improved through surface texturing achieved solely by solvent selection, without material additives or complex post-processing. This simple approach of selecting appropriate solvents to control surface morphology may be applicable to thin protective coatings where wear resistance is required.
Acknowledgement: Not applicable.
Funding Statement: This study was supported by a research fund from Chosun University, 2025.
Author contributions: Sung-Jun Lee: Conceptualization, Methodology, Software, Validation, Formal analysis, Investigation, Data Curation, Writing—Original Draft, Writing—Review & Editing, Visualization. Chan-Woo Kim: Methodology, Validation, Investigation, Data Curation, Writing—Original Draft. Chang-Lae Kim: Conceptualization, Methodology, Resources, Writing—Review & Editing, Supervision, Project administration. All authors reviewed the results and approved the final version of the manuscript.
Availability of Data and Materials: The original contributions presented in this study are included in this article. Further inquiries should be directed to the corresponding author.
Ethics Approval: Not applicable.
Conflicts of Interest: The authors declare no conflicts of interest.
References
1. Lee SJ, Kim CL. Improved tribological performance of silica glass via surface texturing by chemical etching. RSC Adv. 2025;15(51):43620–31. doi:10.1039/d5ra06230f. [Google Scholar] [PubMed] [CrossRef]
2. Tian J, Qi X, Li C, Xian G. Friction behaviors and wear mechanisms of multi-filler reinforced epoxy composites under dry and wet conditions: effects of loads, sliding speeds, temperatures, water lubrication. Tribol Int. 2023;179:108148. doi:10.1016/j.triboint.2022.108148. [Google Scholar] [CrossRef]
3. Zaghloul MMY, Zaghloul MMY, Fuseini M. Recent progress in epoxy nanocomposites: corrosion, structural, flame retardancy and applications—a comprehensive review. Polym Adv Technol. 2023;34(11):3438–72. doi:10.1002/pat.6144. [Google Scholar] [CrossRef]
4. Fuseini M, Yousry Zaghloul MM, Abakar D, Yousry Zaghloul MM. Review of epoxy nano-filled hybrid nanocomposite coatings for tribological applications. FlatChem. 2025;49:100768. doi:10.1016/j.flatc.2024.100768. [Google Scholar] [CrossRef]
5. Chen C, Qiu S, Cui M, Qin S, Yan G, Zhao H, et al. Achieving high performance corrosion and wear resistant epoxy coatings via incorporation of noncovalent functionalized graphene. Carbon. 2017;114:356–66. doi:10.1016/j.carbon.2016.12.044. [Google Scholar] [CrossRef]
6. Liu D, Zhao W, Liu S, Cen Q, Xue Q. Comparative tribological and corrosion resistance properties of epoxy composite coatings reinforced with functionalized fullerene C60 and graphene. Surf Coat Technol. 2016;286:354–64. doi:10.1016/j.surfcoat.2015.12.056. [Google Scholar] [CrossRef]
7. Yu J, Zhao W, Wu Y, Wang D, Feng R. Tribological properties of epoxy composite coatings reinforced with functionalized C-BN and H-BN nanofillers. Appl Surf Sci. 2018;434:1311–20. doi:10.1016/j.apsusc.2017.11.204. [Google Scholar] [CrossRef]
8. Adesina AY, Zainelabdeen IH, Dalhat MA, Mohammed AS, Sorour AA, Al-Badour FA. Influence of micronized waste tire rubber on the mechanical and tribological properties of epoxy composite coatings. Tribol Int. 2020;146:106244. doi:10.1016/j.triboint.2020.106244. [Google Scholar] [CrossRef]
9. Brinker CJ. Dip coating. In: Chemical solution deposition of functional oxide thin films. Vienna, Austria: Springer; 2013. p. 233–61. doi:10.1007/978-3-211-99311-8_10. [Google Scholar] [CrossRef]
10. Hurd AJ. Evaporation and surface tension effects in dip coating. In: The colloid chemistry of silica. Washington, DC, USA: American Chemical Society; 1994. p. 433–50. doi:10.1021/ba-1994-0234.ch021. [Google Scholar] [CrossRef]
11. Zhang Z, Peng F, Kornev KG. The thickness and structure of dip-coated polymer films in the liquid and solid states. Micromachines. 2022;13(7):982. doi:10.3390/mi13070982. [Google Scholar] [PubMed] [CrossRef]
12. Han KH, Jeon GS, Hong IK, Lee SB. Prediction of solubility parameter from intrinsic viscosity. J Ind Eng Chem. 2013;19(4):1130–6. doi:10.1016/j.jiec.2012.12.009. [Google Scholar] [CrossRef]
13. Kim GM, Lee JW, Lee SJ, Kim CL. Friction property of hierarchical micro/nanopatterned PDMS. Materials. 2022;15(24):8736. doi:10.3390/ma15248736. [Google Scholar] [PubMed] [CrossRef]
14. Wodlei F, Sebilleau J, Magnaudet J, Pimienta V. Marangoni-driven flower-like patterning of an evaporating drop spreading on a liquid substrate. Nat Commun. 2018;9(1):820. doi:10.1038/s41467-018-03201-3. [Google Scholar] [PubMed] [CrossRef]
15. Telford AM, Thickett SC, Neto C. Functional patterned coatings by thin polymer film dewetting. J Colloid Interface Sci. 2017;507:453–69. doi:10.1016/j.jcis.2017.07.004. [Google Scholar] [PubMed] [CrossRef]
16. Hwang YH, Myung BS, Kim HJ. Study on frictional behavior of carbon nanotube thin films with respect to surface condition. Friction. 2018;6(4):432–42. doi:10.1007/s40544-017-0182-6. [Google Scholar] [CrossRef]
17. Alhumade H, Rezk H, Nassef AM, Al-Dhaifallah M. Fuzzy logic based-modeling and parameter optimization for improving the corrosion protection of stainless steel 304 by epoxy-graphene composite. IEEE Access. 2019;7:100899–909. doi:10.1109/ACCESS.2019.2930902. [Google Scholar] [CrossRef]
18. Trentin A, Samiee R, Pakseresht AH, Duran A, Castro Y, Galusek D. Influence of pre-treatments on adhesion, barrier and mechanical properties of epoxy coatings: a comparison between steel, AA7075 and AA2024. Appl Surf Sci Adv. 2023;18:100479. doi:10.1016/j.apsadv.2023.100479. [Google Scholar] [CrossRef]
19. Ji Y, Chen Y, Han X, Hu X, Yuan B, Qiao Y. Effect of acetone on mechanical properties of epoxy used for surface treatment before adhesive bonding. Polym Test. 2020;86:106492. doi:10.1016/j.polymertesting.2020.106492. [Google Scholar] [CrossRef]
20. Chai H, Wang X, Ur Rehman W, Yang X, Meng T, He R. Preparation and performance study of nano-Ti-MWCNT hybrid filler reinforced epoxy resin composite coating. Fibres Polym. 2022;23(10):2937–44. doi:10.1007/s12221-022-0076-8. [Google Scholar] [CrossRef]
21. Horodinca M, Chifan F, Paduraru E, Dumitras CG, Munteanu A, Chitariu DF. A study of 2D roughness periodical profiles on a flat surface generated by milling with a ball nose end mill. Materials. 2024;17(6):1425. doi:10.3390/ma17061425. [Google Scholar] [PubMed] [CrossRef]
22. Li YF, Sheng YJ, Tsao HK. Solute concentration-dependent contact angle hysteresis and evaporation stains. Langmuir. 2014;30(26):7716–23. doi:10.1021/la501438k. [Google Scholar] [PubMed] [CrossRef]
23. Silva TI, Ferreira MOA, Nascimento JPL, Pietro LR, Neto LARC, Moreira HC, et al. Development of a low-cost ball-on-flat linear reciprocating apparatus: test validation using Ti-6Al-4V and Ti-6Al-4V/Nb2O5 coatings. J Mater Sci Technol Res. 2025;9:43–52. doi:10.31875/2410-4701.2022.09.05. [Google Scholar] [CrossRef]
24. Dang T, Cao J, Wu Z, Abbas Z, Liu L, Zhu C, et al. Effect of microtexture morphology on the tribological properties of PI/EP-PTFE-WS2 coating under starved oil and dry sliding wear. Surf Interfaces. 2024;48:104221. doi:10.1016/j.surfin.2024.104221. [Google Scholar] [CrossRef]
25. Maicas R, Yungerman I, Weber YB, Srebnik S. United-atom molecular dynamics study of the mechanical and thermomechanical properties of an industrial epoxy. Polymers. 2021;13(19):3443. doi:10.3390/polym13193443. [Google Scholar] [PubMed] [CrossRef]
26. Lee SJ, Kwon HM, Kim CL. Optimization of tribological performance of polyvinyl alcohol coatings on micro-structured aluminum substrates. Mater Chem Phys. 2025;343:131075. doi:10.1016/j.matchemphys.2025.131075. [Google Scholar] [CrossRef]
27. Burke J. Solubility parameters: theory and application. In: The book and paper group of the american institute for conservation. Vol. 3. Washington, DC, USA: The American Institute for Conservation; 1984. p. 13–58. [Google Scholar]
28. Strawhecker KE, Kumar SK, Douglas JF, Karim A. The critical role of solvent evaporation on the roughness of spin-cast polymer films. Macromolecules. 2001;34(14):4669–72. doi:10.1021/ma001440d. [Google Scholar] [CrossRef]
29. Uchiyama H, Matsui T, Kozuka H. Spontaneous pattern formation induced by Bénard-Marangoni convection for sol-gel-derived titania dip-coating films: effect of co-solvents with a high surface tension and low volatility. Langmuir. 2015;31(45):12497–504. doi:10.1021/acs.langmuir.5b02929. [Google Scholar] [PubMed] [CrossRef]
30. Guo J, Zhou Q, Wu Z, Shao M, Wu R, Zha L, et al. Counteracting Marangoni flow by faster adsorption: a route to continuous fabrication of uniform polymer nanofilms. ACS Appl Polym Mater. 2025;7(17):11666–78. doi:10.1021/acsapm.5c02127. [Google Scholar] [CrossRef]
31. Schoff CK. Craters and other coatings defects: mechanisms and analysis. In: Protective coatings. Cham, Switzerland: Springer International Publishing; 2017. p. 403–25. doi:10.1007/978-3-319-51627-1_18. [Google Scholar] [CrossRef]
32. Reiter G. Dewetting of thin polymer films. Phys Rev Lett. 1992;68(1):75–8. doi:10.1103/physrevlett.68.75. [Google Scholar] [PubMed] [CrossRef]
33. Wenzel RN. Surface roughness and contact angle. J Phys Chem. 1949;53(9):1466–7. doi:10.1021/j150474a015. [Google Scholar] [CrossRef]
34. Alajmi M, Shalwan A. Correlation between mechanical properties with specific wear rate and the coefficient of friction of graphite/epoxy composites. Materials. 2015;8(7):4162–75. doi:10.3390/ma8074162. [Google Scholar] [PubMed] [CrossRef]
35. Adams GG, Nosonovsky M. Contact modeling—forces. Tribol Int. 2000;33(5–6):431–42. doi:10.1016/s0301-679x(00)00063-3. [Google Scholar] [CrossRef]
Cite This Article
 Copyright © 2026 The Author(s). Published by Tech Science Press.
This work is licensed under a Creative Commons Attribution 4.0 International License , which permits unrestricted use, distribution, and reproduction in any medium, provided the original work is properly cited.
 Downloads
 Citation Tools