
 Submit a Paper
 Propose a Special lssue
 Open Access
ARTICLE

Freeway Emergency Lane Opening Strategy under Accident Conditions Based on Improved Markov Model
Business School, University of Shanghai for Science and Technology, Shanghai, China
* Corresponding Author: Chenqiang Zhu. Email:
Computers, Materials & Continua 2026, 87(3), 70 https://doi.org/10.32604/cmc.2026.077329
Received 07 December 2025; Accepted 20 February 2026; Issue published 09 April 2026
 View Full Text
 Download PDF
Abstract
In accident scenarios on freeways, traffic congestion, sharp declines in capacity, and the limitations of closed systems where vehicles cannot turn around or exit freely often pose serious challenges. To address these issues, this study develops an improved Markov Decision Process (MDP) framework for dynamic emergency lane opening. Compared with traditional MDP-based traffic control models, the proposed method integrates three enhancements: Firstly, an explicit action decision space transition mechanism that couples variable speed limits with emergency lane opening decisions; Secondly, vehicle-type–differentiated actions to support fine-grained and adaptive opening strategies; and a redesigned reward function incorporating congestion cost, action cost, rewards earned and penalty received to ensure decision rationality and operational feasibility. Based on this improved structure, the optimal strategy is derived using the value iteration algorithm. Finally, simulation results using SUMO demonstrate that under the innermost-lane accident scenario, the optimal strategy is to first implement “variable speed limits”, followed by “opening the emergency lane to all vehicles”. This approach increases average speed by 10.81% but enlarges the headway between vehicles at the detection cross-section, leading to an 8.79% decrease in vehicle throughput. Under the outermost-lane accident scenario, the optimal strategy is to first implement “variable speed limits”, followed by “opening the emergency lane to HOVs”, which increases average speed by 5.47% while reducing vehicle throughput by 3.13%. These results validate the effectiveness of the proposed model.Keywords
Freeways are referred to as “high-speed” primarily due to their high-standard geometric conditions. More importantly, they operate within a closed system characterized by lateral separation, physical isolation of opposing traffic, and strict access control, as well as emergency lanes that help maintain pavement stability and offer temporary refuge for disabled vehicles. However, sudden accidents or short-term surges in passenger traffic during holidays can drastically reduce the capacity of bottleneck sections on these major arteries. The inherent drawbacks of the closed system—such as the inability to turn around or exit freely—become apparent, often turning the so-called “freeway” into a “massive parking lot”. Under such special circumstances, the rational utilization of emergency lanes has become one of the most effective measures to alleviate short-term congestion on freeways and prevent the formation of extensive “traffic jams”.
Research on emergency lane management, both domestically and internationally, has primarily focused on aspects such as variable speed limits, route optimization, dynamic control, and vehicle type-specific lane management. Variable speed limits for lanes are mainly optimized based on real-time traffic flow conditions and freeway lane characteristics. For instance, Yuan et al. [1] investigated rulebased variable speed limit (VSL) and lane-switching control strategies, focusing on the influence of upstream VSL zone distance on system performance. Regarding the traffic impact and safety implications caused by the accident. Malekzadeh et al. [2] examined VSL control in road traffic networks. Using modeling, simulation, and case studies, it shows that combining variable speed limits with lane management improves traffic efficiency, safety, and supports dynamic traffic management. Avelar et al. [3] evaluated safety benefits to develop collision correction factors. By combining logistic regression with generalized estimating equations for negative binomial distributions, they statistically analyzed and reduced accident frequencies across categories. Zhang et al. [4] showed that the strategy can effectively optimise the mixed-vehicle traffic state and maintain better control performance under any connected and autonomous vehicle (CAV) penetration rates. Wu et al. [5] studied a more effective deep reinforcement learning (DRL) model is developed for differential variable speed limit (DVSL) control, in which dynamic and distinct speed limits among lanes can be imposed. Grumert et al. [6] conducted comparative studies on control algorithm characteristics, focusing on the impacts of different algorithms on traffic efficiency, safety, and environmental factors. Yang et al. [7] analyzed the effects of variable speed limits on freeway macroscopic traffic flow, showing that VSL improves speed–occupancy relationships, increases critical occupancy, and enables higher flow at the same occupancy, demonstrating its potential to enhance traffic control efficiency. Researchers such as Binjaku et al. [8] proposed a physically regularized Gaussian mixture model, aiming at the problem of traffic state estimation for multiple vehicle classes on freeways. For instance, Yuan et al. [9] examined the effectiveness and management strategies of HOV lanes under the influence of ridesharing services, addressing conflicts that arise when ride-sourcing and carpooling share HOV lanes. Naseri et al. [10] used the Tehran-Karaj Freeway in Iran as a case study and concluded that dual HOV lanes significantly improve HOV lane speeds through an evaluation of implementation outcomes.
Furthermore, research on emergency lane management, both domestically and internationally, primarily focuses on the spatial limitations of emergency lanes. This includes examining speed limits, usage restrictions, and especially emergency lane opening strategies. Existing studies explore dynamic decision-making models for emergency lane operation, opening measures, and the impacts of such openings on freeway traffic conditions. Dynamic lane opening has been shown to effectively enhance roadway capacity. For instance, Li et al. [11] investigated platoons of connected autonomous vehicles on multilane highways. They employed an extended cellular transport model to characterize capacity degradation and designed a hierarchical optimization strategy based on a model predictive control framework. Model calibration and validation were conducted using VISSIM microsimulation. Zhang et al. [12] adopted the YOLOv11 and ByteTrack algorithms to extract traffic flow parameters from videos, and designed a decision-making process for the activation and closure of emergency lanes based on the interval occupancy rate threshold. Tang et al. [13] carried out research on the optimization problem of emergency lane management and control, adopting methods to build a master-slave two-layer optimization model, which effectively improved traffic efficiency and safety. Jenior et al. [14] studied dynamic partial time shoulder usage. Through historical traffic data analysis, they constructed a decision parameter system with flow and speed as thresholds, and validated its effectiveness using tools such as VISSIM. Liu et al. [15] studied the impact of emergency lane opening on traffic flow. Through comparative analysis of measured data, the article found that the dynamic opening strategy should be combined with real-time traffic flow and accident early warning. Lu et al. [16] proposed a dynamic speed limit zone strategy to address the limited performance of variable speed limit control at fixed bottleneck sections. Besides, Choi et al. [17] proposed a modular architecture and quantitative evaluation metrics to support multiobjective optimization for emergency lane management. Their study demonstrated a 25% reduction in congestion duration and a 30% improvement in emergency response efficiency on the test section. Kononov et al. [18] investigated the safety impacts of emergency lane opening measures on South Korean freeways, identifying a correlation between the length of open emergency lanes and collision frequency. Wang et al. [19] used a multi-agent framework to construct under the connected vehicle environment, and a distributed reinforcement learning algorithm was adopted to design different reward functions for traffic efficiency and traffic safety, respectively. Li et al. [20] researched in a mixed traffic flow environment, a basic linear stability formula and capacity calculation expression. Papageorgiou et al. [21] analyzed methods for evaluating and enhancing urban transportation network resilience.
In summary, both domestic and international studies have made numerous valuable contributions to freeway lane management, emergency lane utilization, and opening strategies. However, several limitations remain:
(1) Existing methods employing variable speed limits to mitigate congestion under high traffic volumes have yet to integrate variable speed limits with emergency lane opening, which warrants further investigation;
(2) Current research on emergency lane opening strategies generally fails to account for differences among vehicle types;
(3) Optimization approaches for emergency lane opening strategies are often restricted to either time-based or space-based conditions, reflecting single-variable control mechanisms.
To address these issues, this study leverages the comprehensive modeling capabilities and flexibility of the Markov Decision Process (MDP). By defining an action space (opening or closing the emergency lane) within the state transition process and evaluating each action’s effectiveness through a reward function, this study integrates variable speed limits and heterogeneous vehicle types to develop scientifically grounded emergency lane opening strategies. The proposed approach aims to effectively mitigate freeway congestion and enhance traffic operational safety.
The contributions of this paper are summarized as follows:
(1) An integrated decision-making mechanism is established under a unified MDP framework. Unlike most existing studies, it jointly models variable speed limits and emergency lane opening as coordinated controls.
(2) The proposed framework explicitly captures state-dependent strategy differences linked to accident lane locations, enabling differentiated opening decisions for innermost and outermost lane accident scenarios.
To address the dynamic decision-making problem of emergency lane opening on freeways, this study constructs a Markov Decision Process (MDP) model to determine the threshold of the traffic congestion index at which emergency lanes should be opened following an incident. It should be noted that the effectiveness of such a strategy may be influenced by specific vehicles do not adhere to the Vehicle Speed Control (VSC) protocol, but previous studies [22,23] have indicated that higher compliance with Variable Speed Limits (VSL) generally improved traffic safety and operational performance, whereas lower compliance weakens control effectiveness. Accordingly, the proposed MDP framework is developed under assumptions of typical VSL compliance.
2.1 Construction of the Markov Decision Process
The Markovian property refers to a stochastic process in which the probability distribution of future states depends solely on the current state and is independent of all preceding states. In this study, examples of state variables include current traffic volume, accident duration, and emergency lane occupancy. Each state variable evolves over time, and the decision (whether to open or close the lane) influences the subsequent state.
A Markov Decision Process (MDP) primarily consists of five components: State Space, Action Space, State Transition Probabilities, Reward Function, and Discount Factor.
As illustrated in Fig. 1, these components are defined as follows:
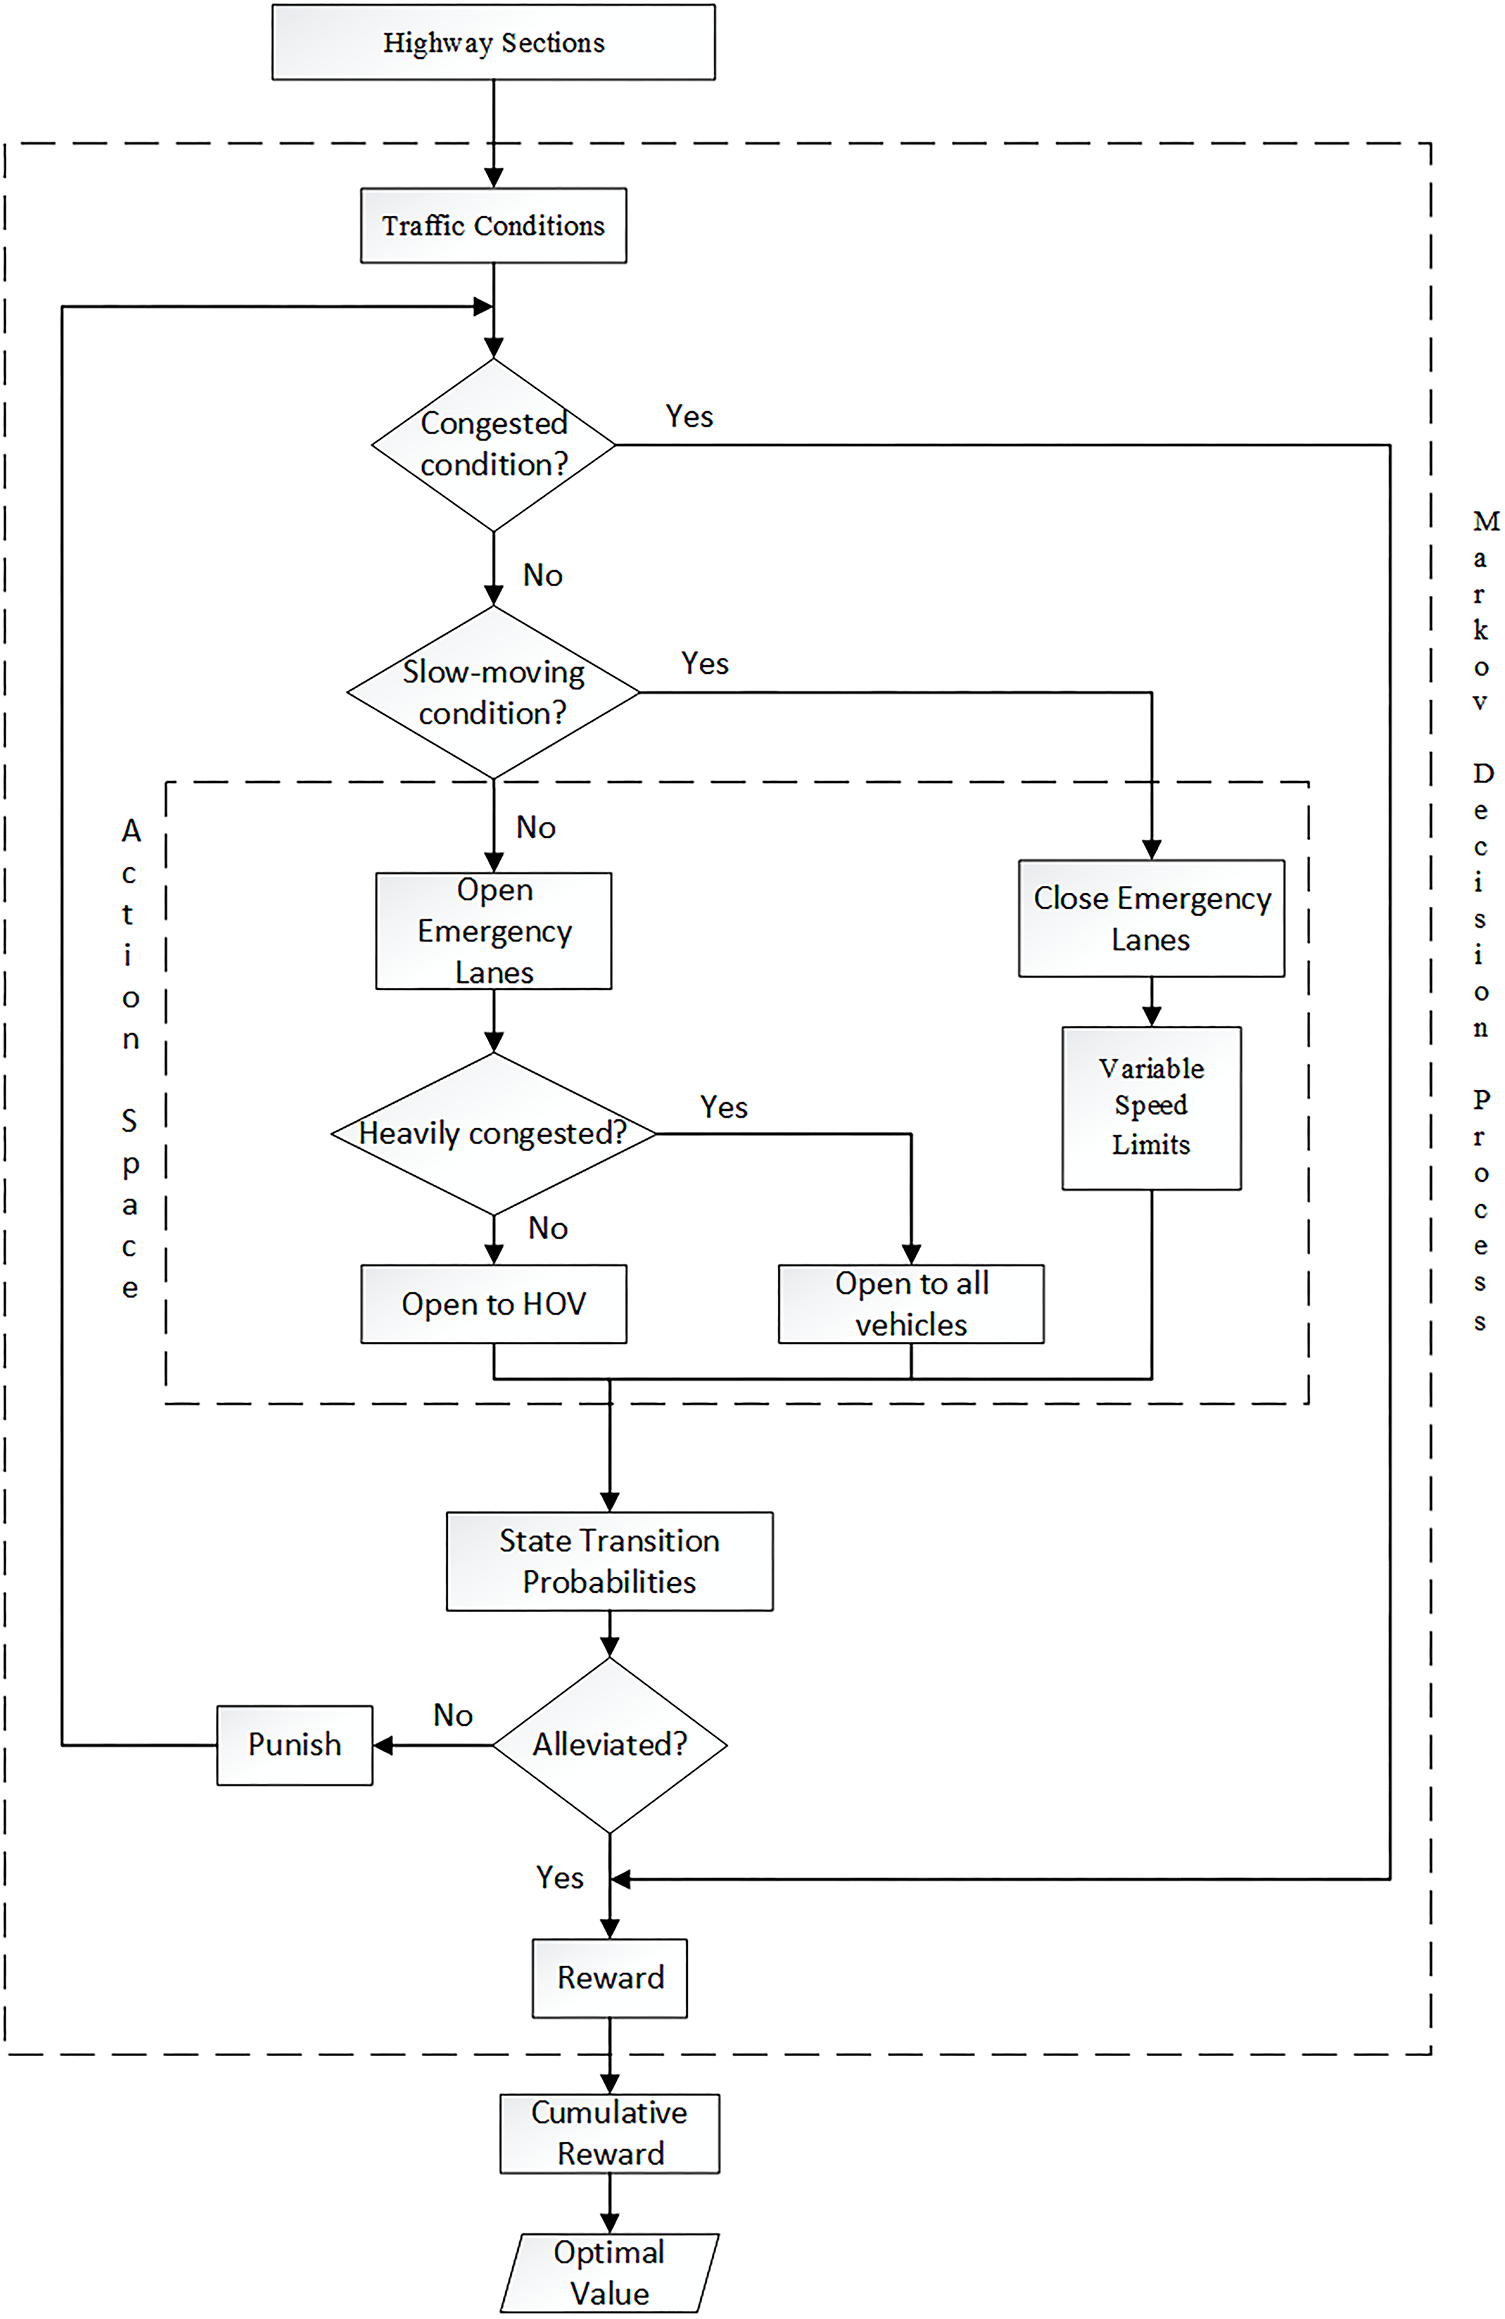
Figure 1: Markov decision process diagram.
State space: represents the traffic conditions of freeway sections, categorized into five states: free-flow, near free-flow, slow-moving, congested, and heavily congested.
State transition probabilities: indicate the likelihood of transitioning from the current state to another state within a given time interval.
Action space: includes variable speed limit control, emergency lane opening strategies, and vehicle-type differentiation during lane opening decisions.
Reward function: assigns a positive reward when congestion is alleviated after an action is executed, and a penalty otherwise. The cumulative reward is then computed, with the objective of maximizing overall benefit.
Discount factor: determines the relative weighting of immediate vs. future rewards in the optimization process.
The emergency lane opening problem on freeways focuses on making rapid, spaceconstrained decisions to relieve traffic congestion following an accident. The traffic congestion state evaluation criteria serve as the foundation for constructing the emergency lane opening decision model.
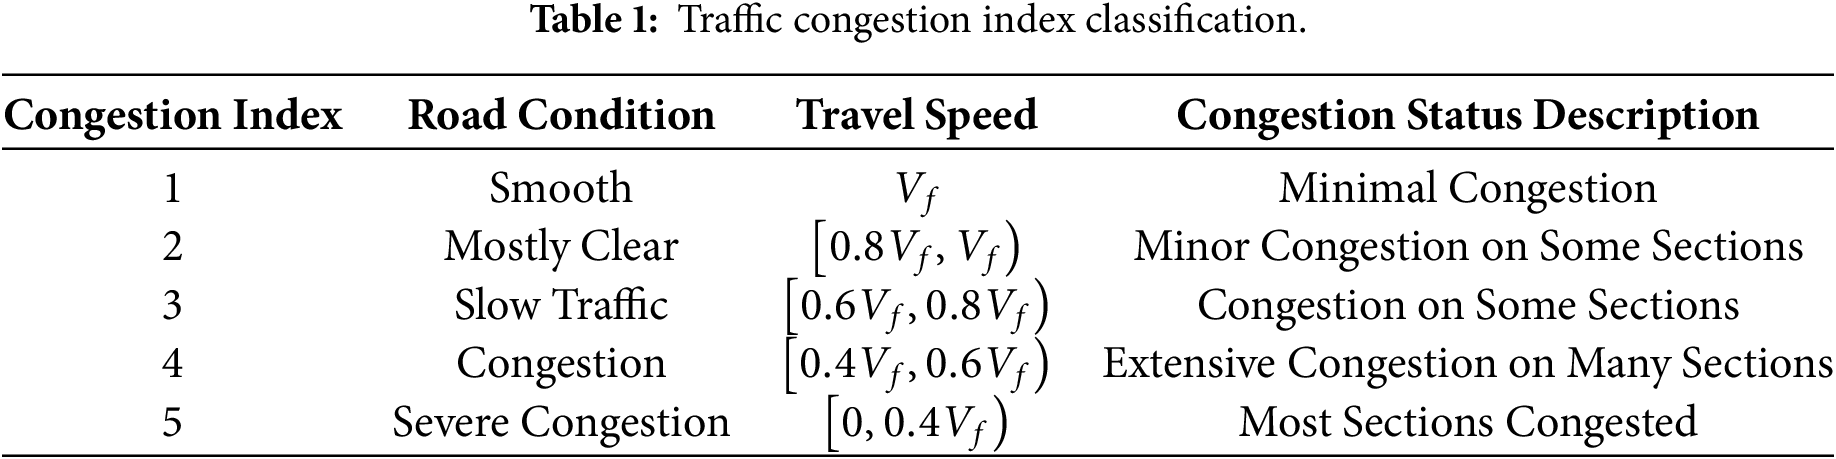
The Traffic Performance Index, TPI is a conceptual indicator that comprehensively reflects traffic flow conditions and congestion levels. In this study, the Traffic Congestion Index is adopted to quantify the degree of congestion. The index ranges from 1 to 5 and is divided into five levels: free-flow, near free-flow, slowmoving, congested, and heavily congested. Higher index values indicate more severe congestion, as summarized in Table 1.
where:
2.2 Establishment of the Emergency Lane Opening Strategy Model
As shown in Fig. 2, the freeway is divided into several segments. Road vehicle information is obtained through detectors installed along the freeway. Since detectors cannot cover the entire section, this study deploys corresponding detectors on the upstream main road and upstream ramp. The average travel speed for each segment in the road network is calculated using Eq. (1).
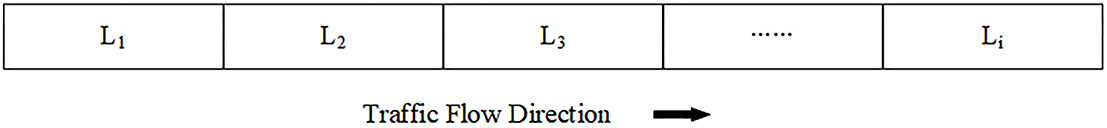
Figure 2: Division of freeway section.
(1) Decision Time
In the equation,
(2) State Space
The state space describes environmental information, denoted as
where:
(3) Action Decision Space
A decision made at a specific moment that alters the state of the environment is denoted as
When the traffic congestion state is
where:
As shown in Fig. 3, when the traffic congestion state is
where:
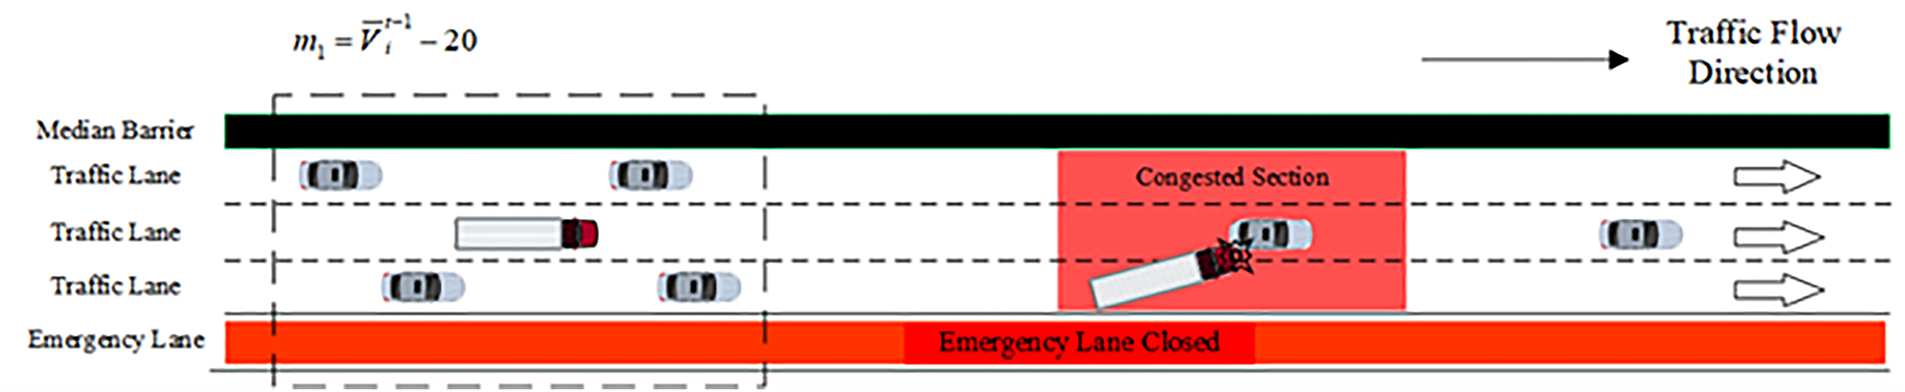
Figure 3: Action diagram
As shown in Fig. 4, when the traffic congestion state is in the slow-moving state
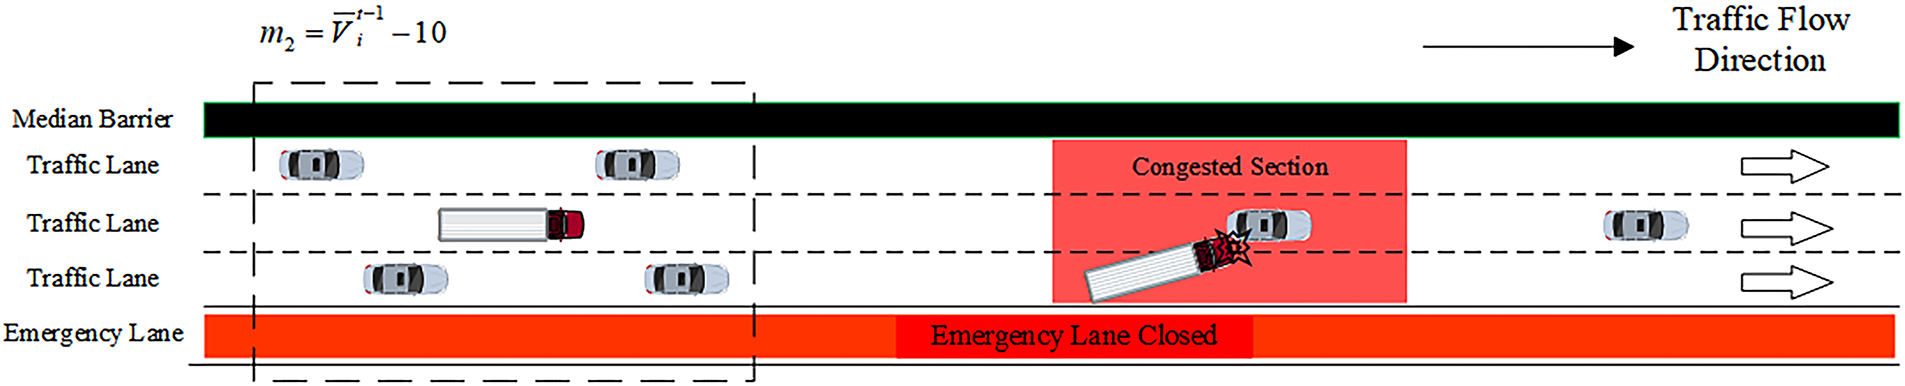
Figure 4: Action diagram
In the formula,
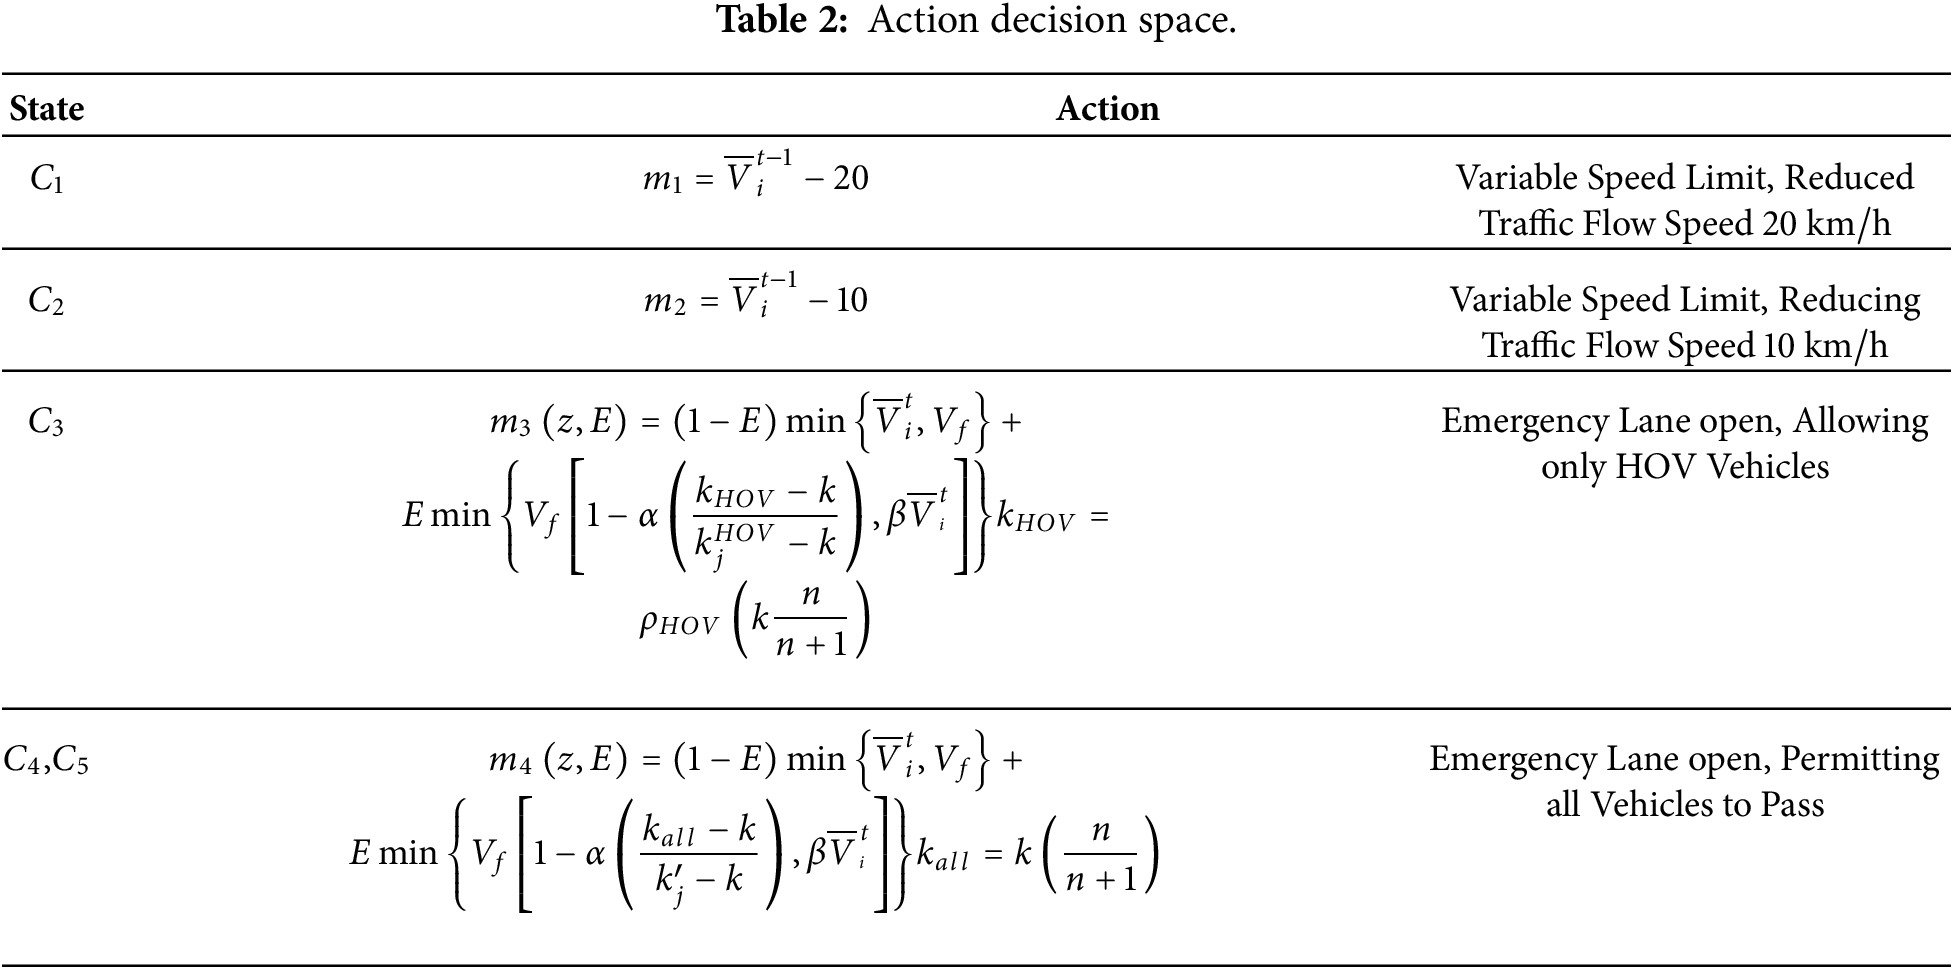
As shown in Figs. 5 and 6, when the traffic congestion state is in

Figure 5: Action diagram
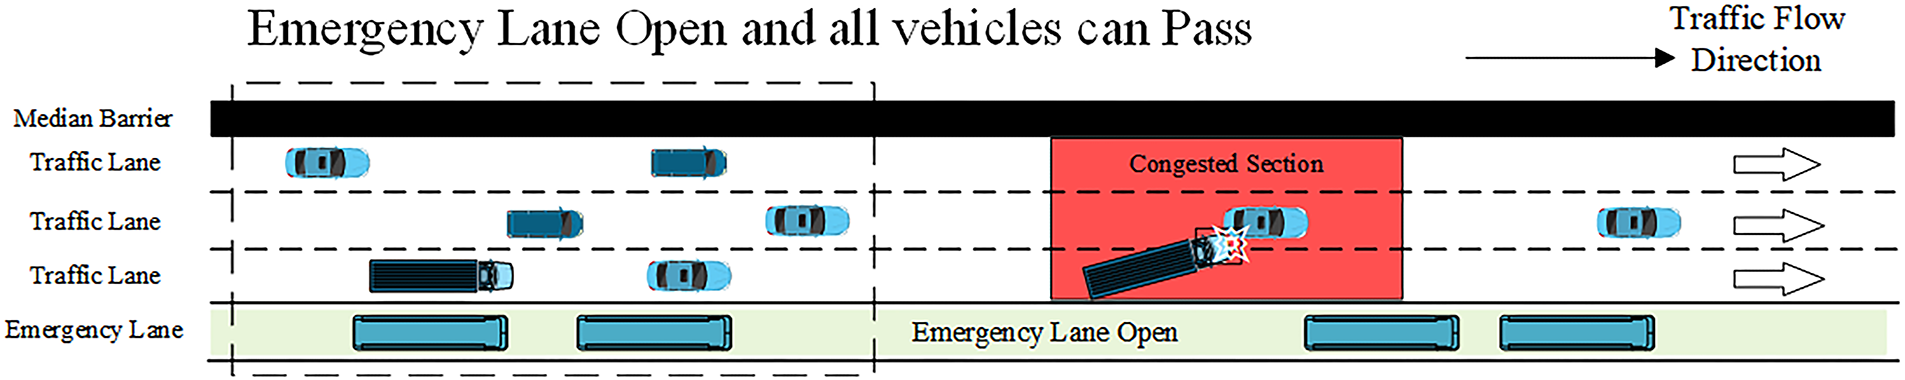
Figure 6: Action diagram
In the formula,
Table 2 summarizes the aforementioned action decision space defined for different traffic congestion states. For each congestion state, the corresponding control measures are specified, including the implementation of variable speed limits and differentiated emergency lane opening strategies.
(4) State Transition Probability
The transition probability matrix defining the likelihood of a system shifting from its current state to another state at a given moment is generally represented as
In the equation,
(5) Reward Function
This study defines the reward function as the reward
where
When modeling using a Markov decision process, the value iteration algorithm enables rapid convergence [24]. The core of the solution lies in maximizing the expected total reward of the system, achieved through iterative updates of the expected total reward using the Bellman equation.
In this study, for
where
(1) Bellman Equation
Based on the optimal policy, the Bellman equation is applied to the above model. Using the value iteration algorithm, the value function is iteratively updated. If the current policy is optimal, the system’s expected total reward is denoted as
In this equation, the discount factor
Decision-makers obtain reward payments according to the above steps. In the solution process, the system’s expected total profit
In the equation, V∗ represents total profit that calculate the expected total profit of the system and maximize it; P represents the state transition probability; r denotes the reward function; mi indicates the action space.
(2) Solution Steps
As shown in Fig. 7, it illustrates the model solution.
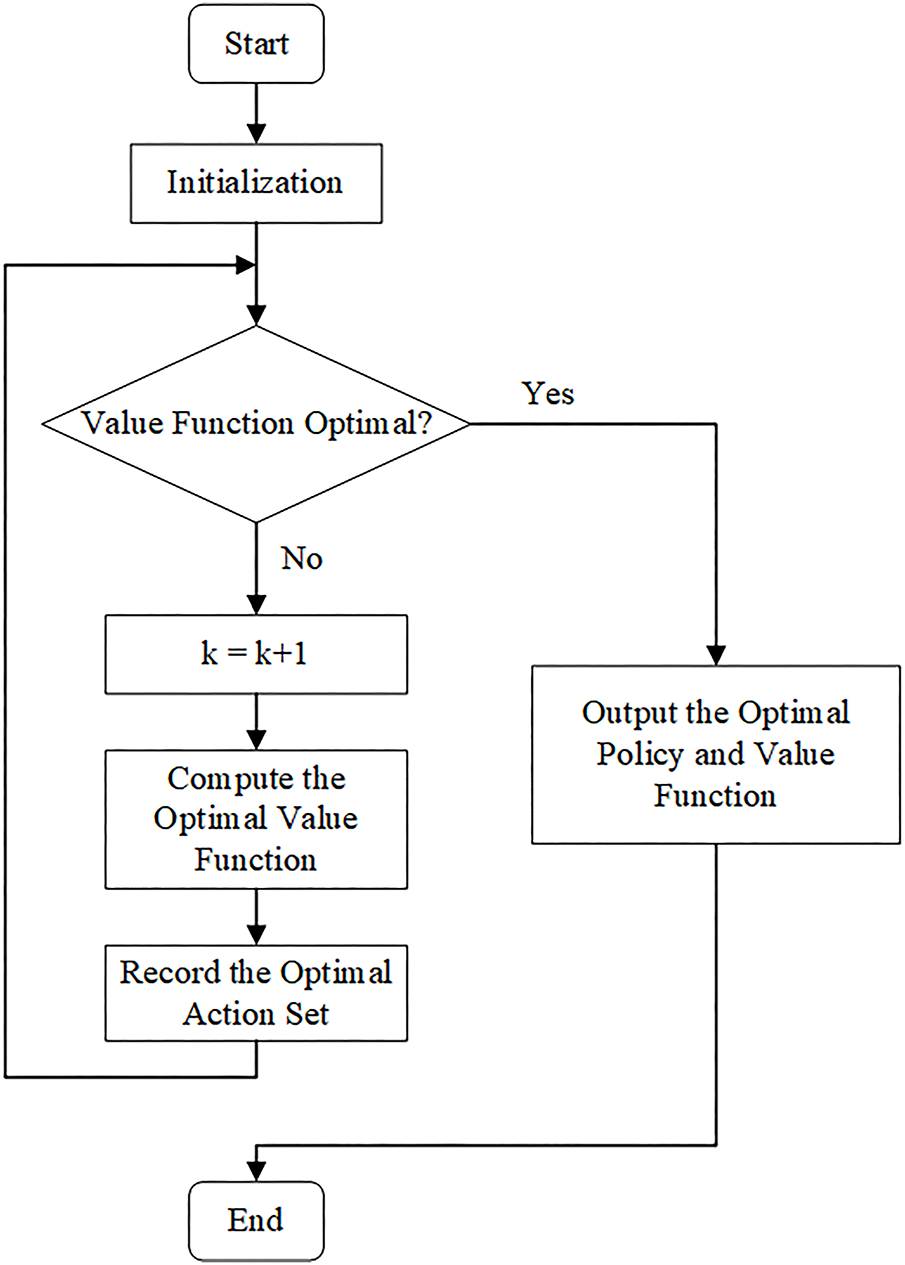
Figure 7: Solution procedure diagram.
Step 1: For
Step 2: If
Step 3: For all
Calculate the expected total profit of the system and maximize it. In the equation, In the equation,
And record the action set that maximizes the total reward as:
Find the argument that maximizes the function and define
For any fixed
Step 4: Return to Step 2.
This study selected the section from Guoxiang to Changtai on Shanghai’s Huchang Freeway. A single-vehicle accident simulation scenario was established for both the innermost and outermost lanes of the freeway [25–27]. While, our study focused on the single-vehicle accidents, without weather conditions, driver behavior, or multiple concurrent incidents. Following the accident, the road congestion status was determined based on the aforementioned traffic congestion index to validate the opening action. The simulation is illustrated in shown in Fig. 8.
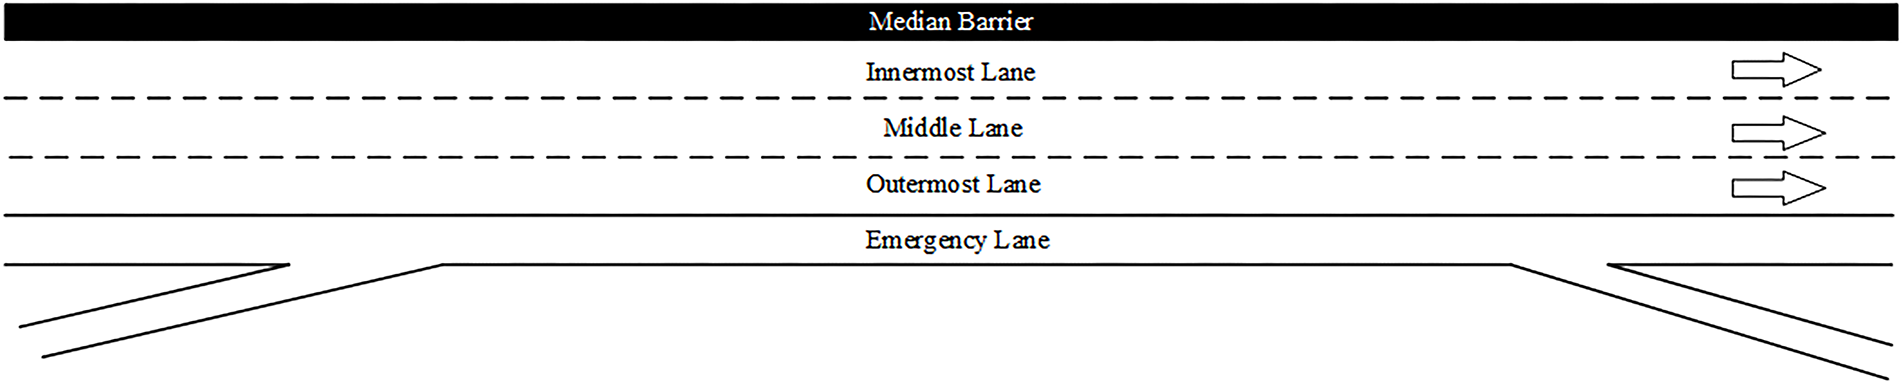
Figure 8: Simulation diagram.
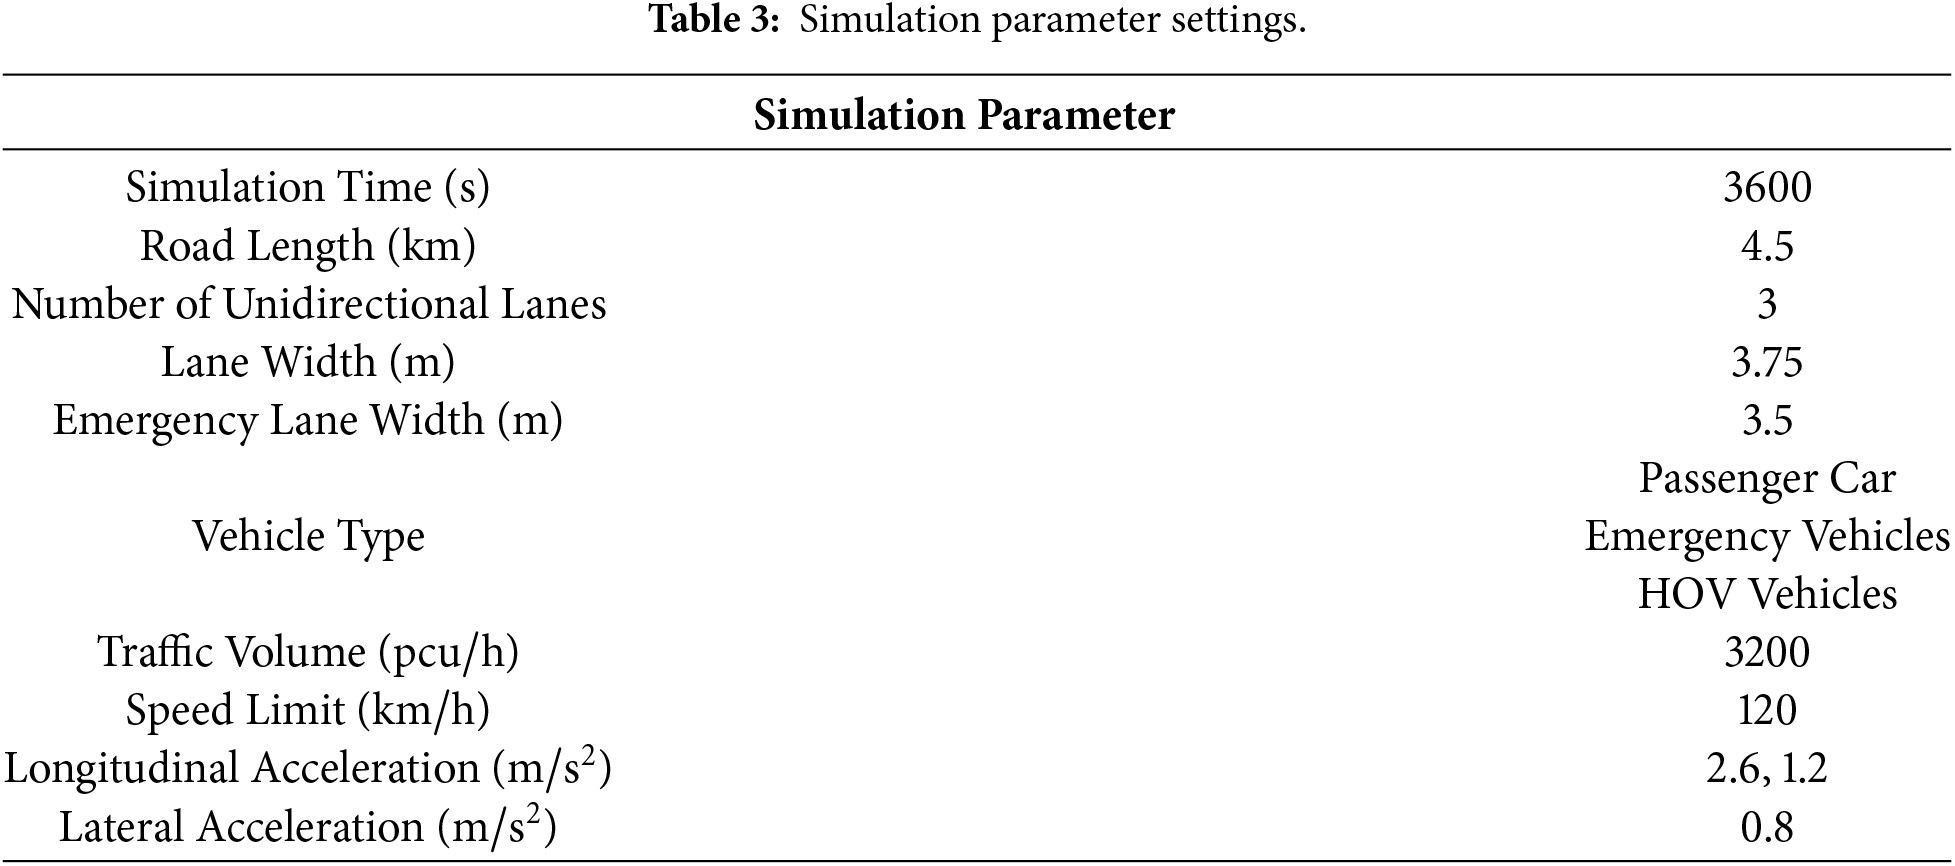
The simulation experiment utilizes SUMO, an open source and highly configurable micro-level, multi-modal traffic simulation platform. Originally developed for urban transportation analysis, SUMO is also well-suited for freeway and mixed-traffic scenarios. It supports large-scale network simulations, handles complex traffic conditions, and allows modeling of multiple transportation modes. SUMO can integrate real time traffic data to dynamically adjust and optimize simulations, provides extensive customization through scripts and plugins, and offers interfaces for Python and other programming environments to facilitate data analysis and processing. Specific parameters are listed as shown in Table 3.
Setup for single-vehicle accidents: The TraCI Python API is used to trigger accidents in real time during the simulation, accurately replicating the effects of emergency lane openings under single-lane accident conditions.
Simulation parameters: 60% passenger vehicles, 20% emergency vehicles, 20% HOV vehicles. Mainline freeway traffic volume: 3200
This study primarily investigates the conditions for opening emergency lanes in single-vehicle accident scenarios occurring on the innermost lane, as shown in Fig. 9 and outermost lane, as shown in Fig. 10 of freeways under different levels of traffic congestion [28].
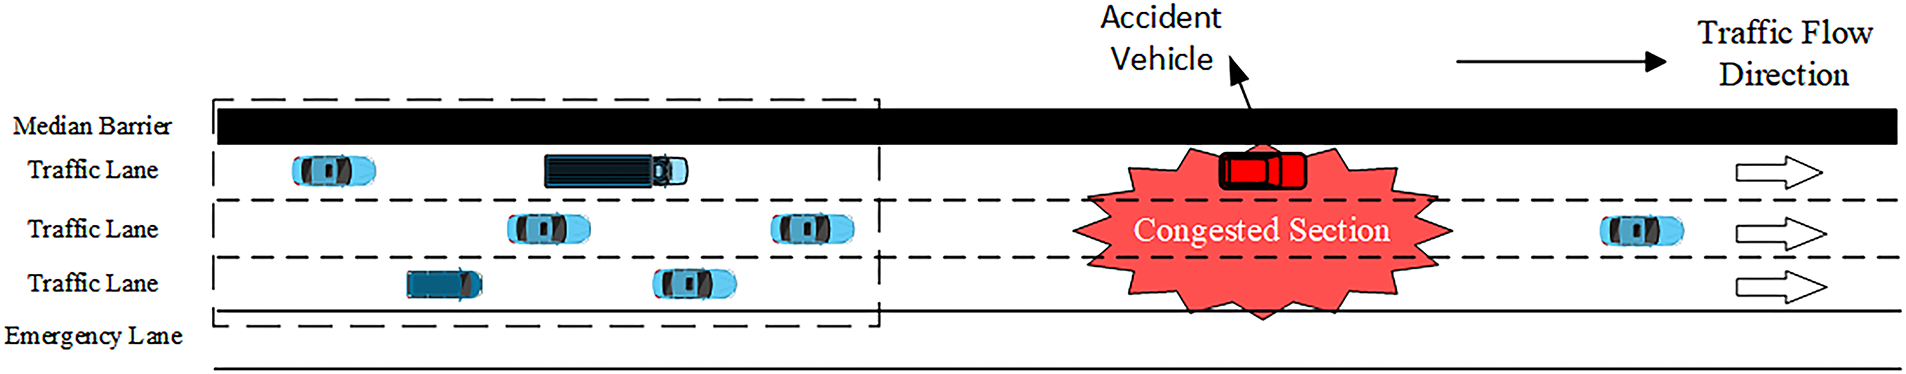
Figure 9: Single-Vehicle Accident in the Innermost Lane.
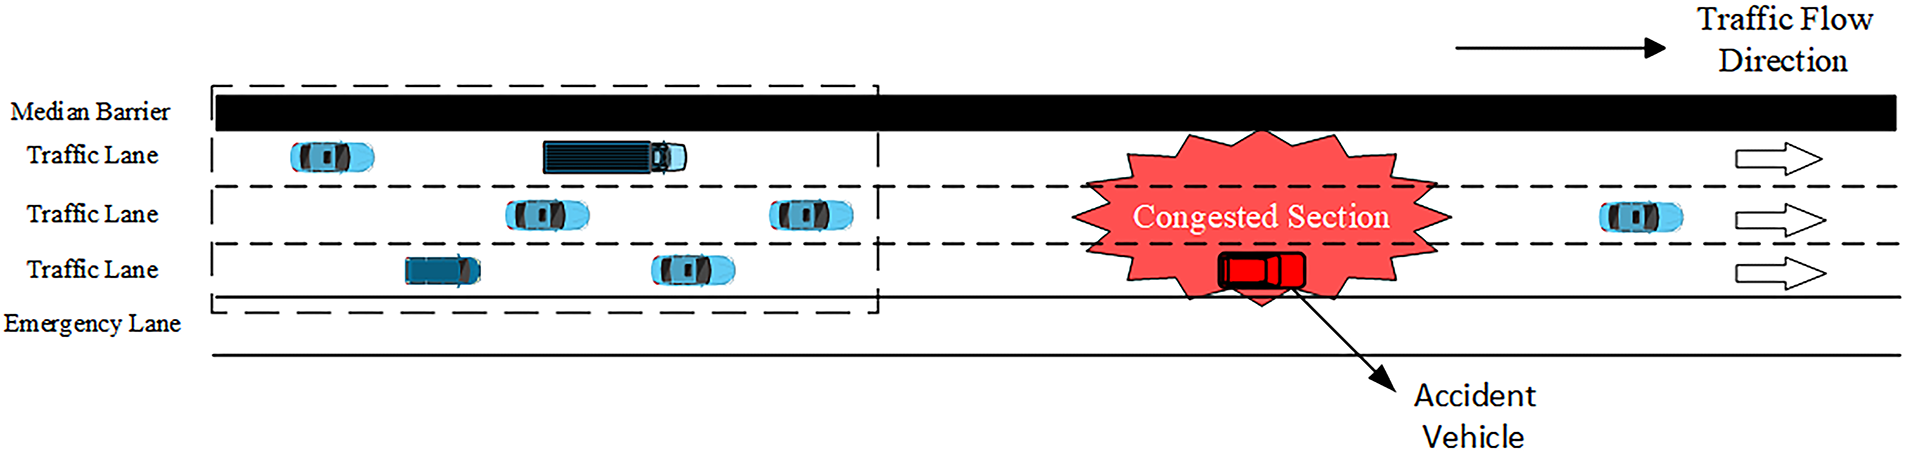
Figure 10: Single-Vehicle Accident in the Outermost Lane.
(1) Innermost Lane Accident Scenario
(2) Outermost Lane Accident Scenario
Simulation analysis was conducted for two scenarios: single-vehicle accidents in the innermost and outermost lanes of freeways. Evaluation metrics included average vehicle speed, number of vehicles passing through, and traffic congestion levels.
(1) Innermost Lane Accident
Following the accident, traffic congestion remained largely unimpeded. A “variable speed limit” strategy was implemented. After 74
The simulation results are shown in Fig. 11. Since the accident occurred in the fast lane, traffic speed decreased significantly post-accident. Around 600
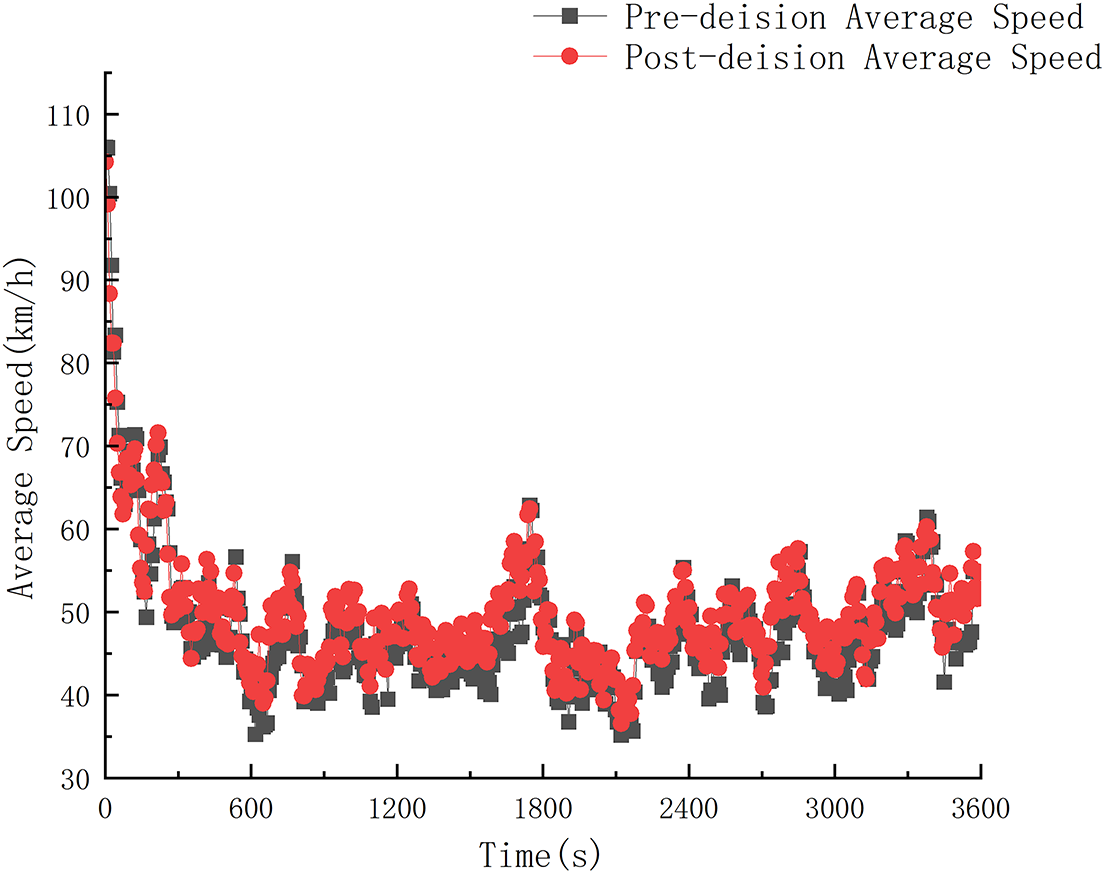
Figure 11: Average speed comparison before and after the decision.
Following the implementation of the strategy, the average speed remained lower than before the decision, leading to a temporary increase in the number of vehicles passing at 65
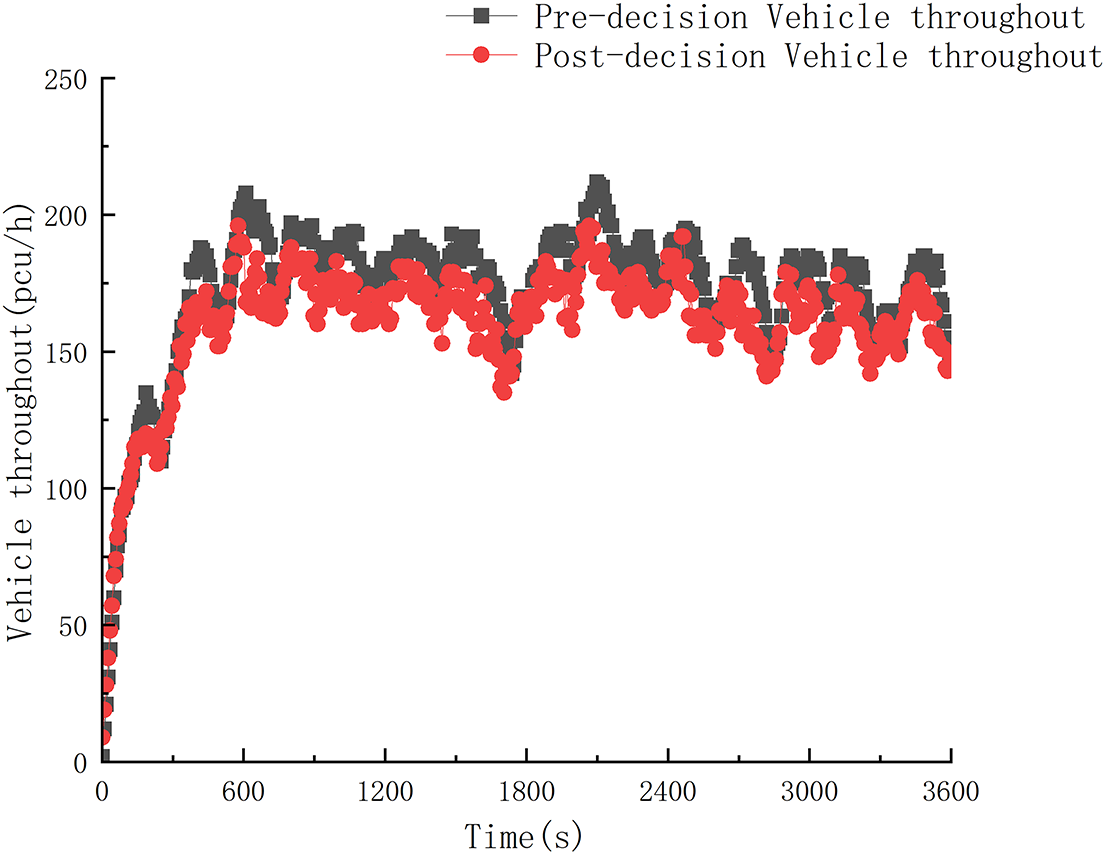
Figure 12: Comparison of vehicle count before and after the decision.
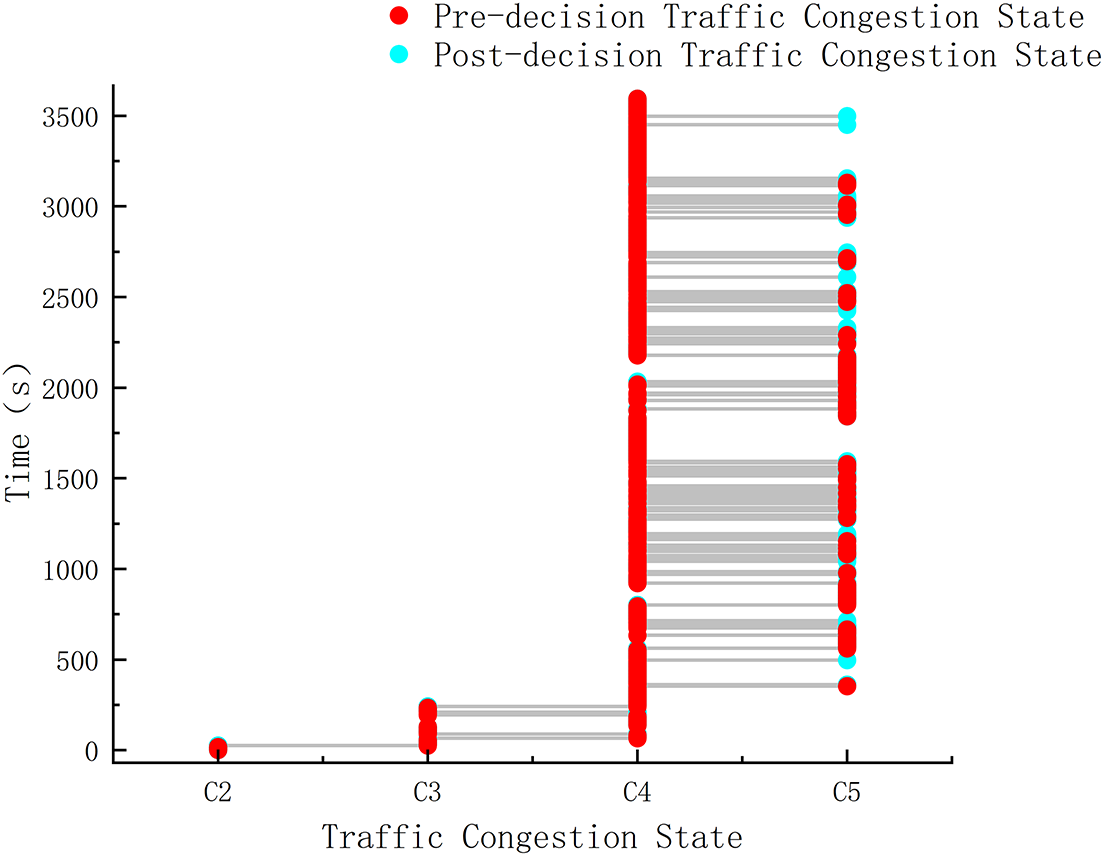
Figure 13: Comparison of traffic congestion before and after the decision.
Throughout the simulation, average speed increased by 10.81%, while the number of vehicles passing decreased by 8.79%. This outcome occurred because the overall traffic flow slowed following the accident, and the opening of the emergency lane effectively increased the number of available lanes, functioning as a “flow relief mechanism”. However, this also extended the time interval between vehicles passing through the detection cross-section, thereby reducing the total vehicle throughput.
(2) Outermost Lane Accident
After the accident occurred, traffic flow was initially stable due to the implementation of the “variable speed limit” strategy. However, by the 26
Simulation results indicate that during this period, average speed (Fig. 14), vehicle throughput (Fig. 15), and congestion levels (Fig. 16) fluctuated. This was because the accident in the outermost lane minimally impacted the innermost express lane and middle lanes. As shown, speeds only significantly decreased after 1200
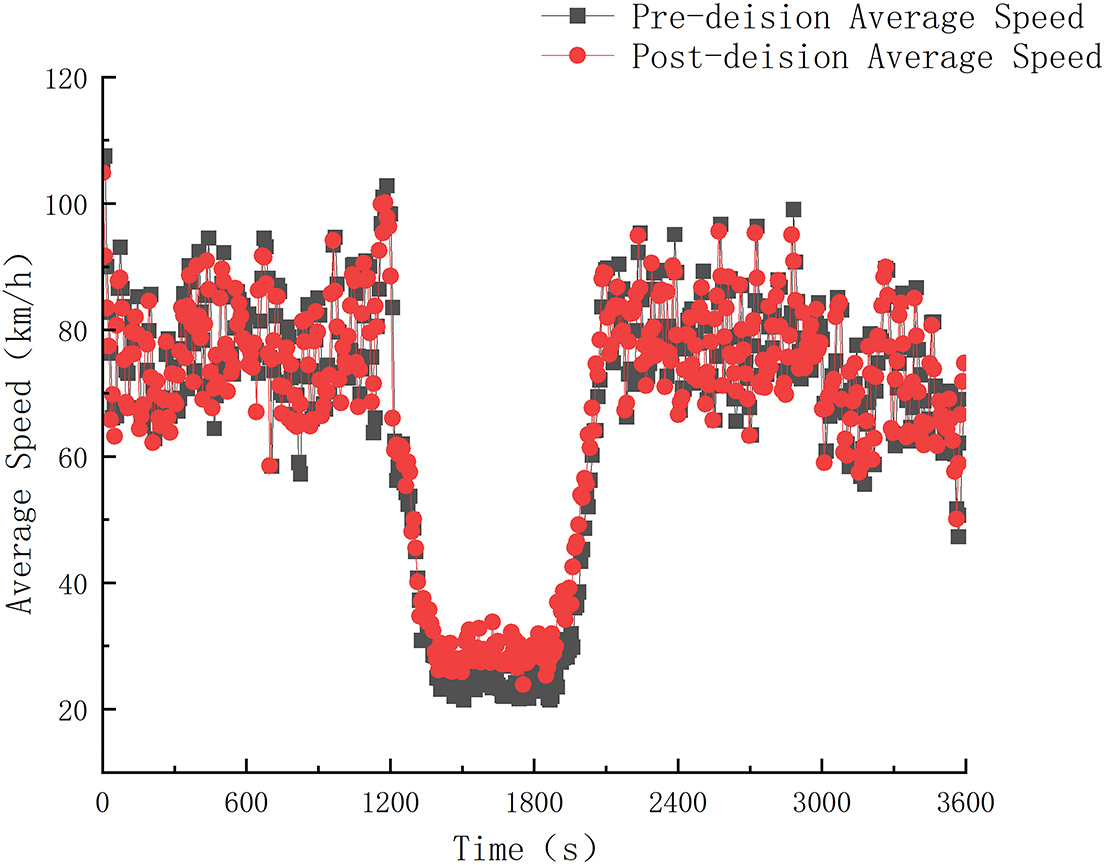
Figure 14: Average speed comparison before and after the decision.
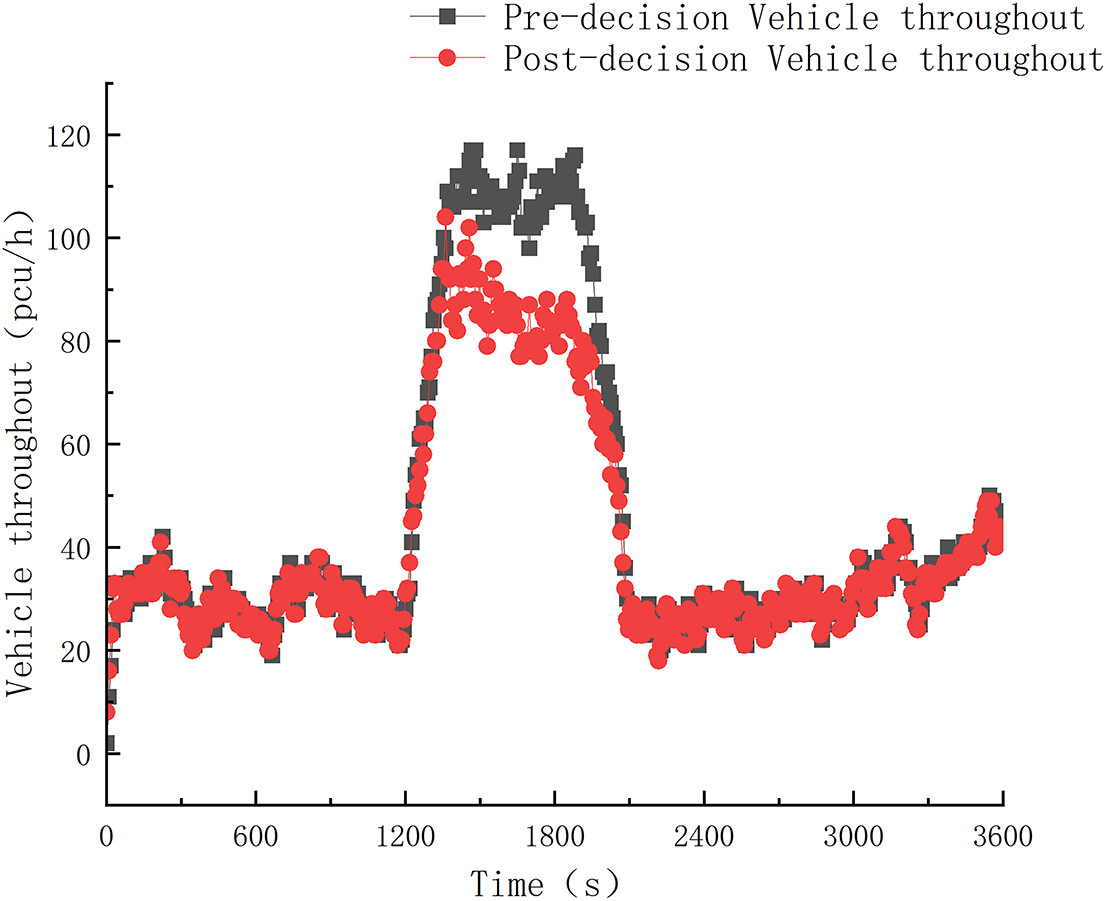
Figure 15: Comparison of vehicle count before and after the decision.
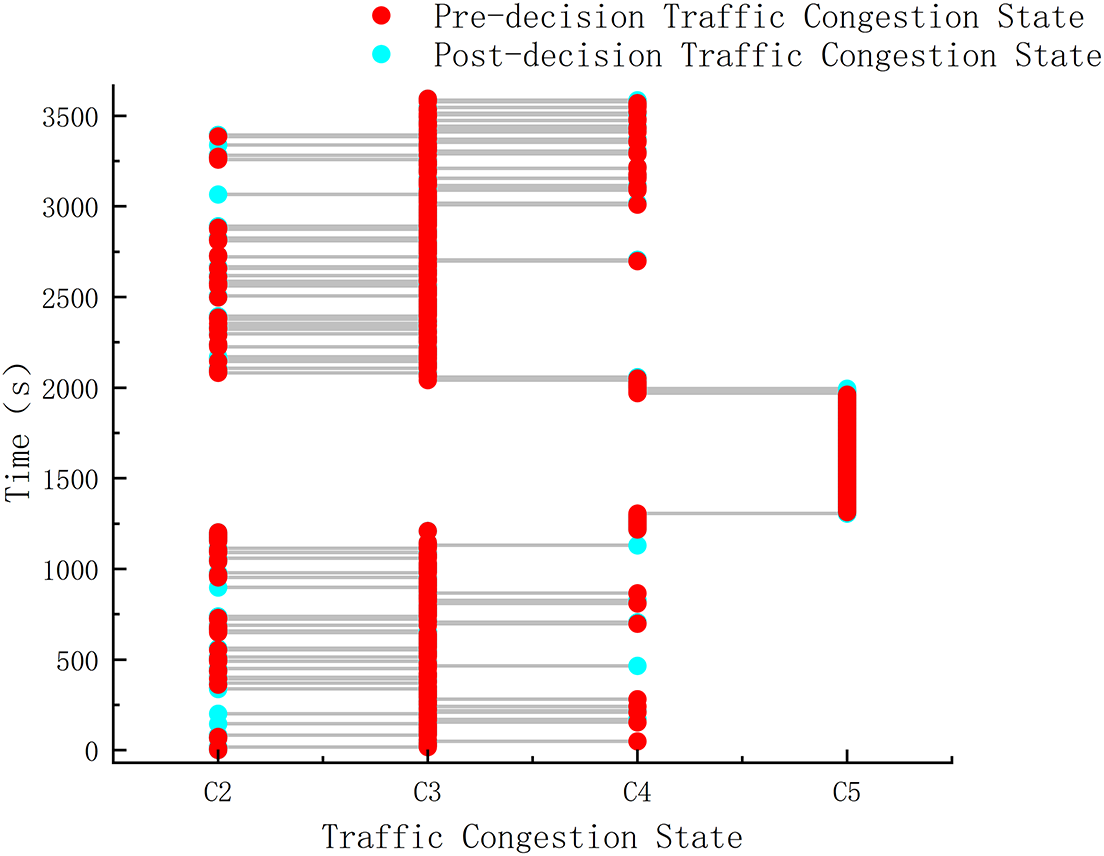
Figure 16: Comparison of traffic congestion before and after the decision.
The emergency lane opening strategy is not a “one-size-fits-all” solution. During severe congestion, opening the lane to all vehicles can rapidly alleviate gridlock; however, during moderate congestion, opening it exclusively to HOV vehicles proves more effective for speed improvement. This reveals the “state dependency” of traffic management, where strategies must dynamically adapt to the current congestion level.
Overall, the case study demonstrates that the effectiveness of emergency lane opening strategies is highly dependent on both traffic congestion states and accident locations. Simulation results show that prioritizing variable speed limits in the early stage of accidents helps stabilize traffic flow, while differentiated emergency lane opening strategies become more effective as congestion intensifies.
This study addresses freeway congestion under accident conditions by simulating incidents in both the innermost and outermost lanes. Considering traffic congestion levels, variable speed limits, dynamic emergency lane openings, and vehicle type differences, we developed an emergency lane opening strategy model based on an improved Markov Decision Process (MDP).
(1) The effectiveness of emergency lane opening varies by lane position. Throughout the innermost lane simulation, average speed increased by 10.81% and vehicle throughput decreased by 8.79%. Throughout the outermost lane simulation, average speed increased by 5.47% and vehicle throughput decreased by 3.13%.
(2) Throughout the simulation cycle, the proposed emergency lane opening strategy model was applied. Dynamic strategy selection significantly enhances decision-making precision and timeliness. During the initial accident phase, “variable speed limits” were prioritized to control flow rates. Once traffic conditions stabilized, “emergency lane openings” were classified and implemented based on actual conditions to restore traffic capacity. This approach proved highly sensitive, particularly when the “accident location” occurred on the innermost road.
(3) This study integrates variable speed limits, vehicle type differentiation, and emergency lane opening strategies into a MDP framework, overcoming the limitations of traditional single-control-variable approaches.
Besides, it proposes a unified Markov decision framework that integrates variable speed limits and emergency lane opening as coordinated actions, moving beyond traditional single-measure or sequential control approaches. Vehicle-type–differentiated actions and a comprehensive reward function incorporating congestion, operational, and safety factors further enhance the realism and applicability of the model. As a result, the proposed framework offers a more adaptive decision-making paradigm for emergency lane management under accident conditions.
Furthermore, this study’s novelty has two core aspects:
It develops an integrated decision-making mechanism within a unified Markov Decision Process (MDP) framework, jointly modeling variable speed limits and emergency lane opening as coordinated controls. Additionally, the framework captures state-dependent strategy differences tied to accident lane locations, enabling differentiated opening decisions for innermost and outermost lane accidents.
Additionally, our study focused on the single-vehicle accidents under controlled conditions, without driver behavior, or multiple concurrent incidents. These factors will be addressed in future research.
Acknowledgement: This research was funded by Shanghai Pujiang Programme [23PJC075], National Natural Science Foundation of China [72501184], Shanghai Planning Office of Philosophy and Social Sciences [2023EGL005]. The authors thank the these supports.
Funding Statement: This research was funded by Shanghai Pujiang Programme grant number [23PJC075], National Natural Science Foundation of China grant number [72501184], Shanghai Philosophy and Social Science Planning Youth Project grant number [2023EGL005]. The APC was funded by Shanghai Municipal Human Resources and Social Security Bureau, National Natural Science Foundation of China, and Shanghai Planning Office of Philosophyand Social Sciences.
Author Contributions: Conceptualization, Jiao Yao; methodology, Pujie Wang; software, Pujie Wang; validation, Pujie Wang and Tianyi Zhang; formal analysis, Pujie Wang; investigation, Pujie Wang and Chenke Zhu; resources, Pujie Wang; data curation, Pujie Wang; writing—original draft preparation, Pujie Wang; writing—review and editing, Jiao Yao; visualization, Tianyi Zhang; supervision, Jiao Yao; project administration, Chenqiang Zhu; funding acquisition, Chenqiang Zhu. All authors reviewed and approved the final version of the manuscript.
Availability of Data and Materials: Not applicable.
Ethics Approval: Not applicable.
Conflicts of Interest: The authors declare no conflicts of interest.
References
1. Yuan T, Alasiri F, Ioannou PA. Selection of the speed command distance for improved performance of a rule-based VSL and lane change control. IEEE Trans Intell Transp Syst. 2022;23(10):19348–57. doi:10.1109/TITS.2022.3157516. [Google Scholar] [CrossRef]
2. Malekzadeh M, Naderi M, Jin F, Bogenberger K, Wang Y, Papageorgiou M. A comprehensive review of tidal traffic flow control: from conventional lane reversal to emerging internal boundary control. Results Eng. 2025;27(12):106198. doi:10.1016/j.rineng.2025.106198. [Google Scholar] [CrossRef]
3. Avelar R, Park ES, Ashraf S, Dixon K, Li M, Dadashova B. Developing crash modification factors for variable speed limits. Washington, DC, USA: Federal Highway Administration, Office of Safety Research and Development; 2021. Report No.: HWA-HRT-21-053. [Google Scholar]
4. Zhang L, Ding H, Feng Z, Wang L, Di Y, Zheng X, et al. Variable speed limit control strategy considering traffic flow lane assignment in mixed-vehicle driving environment. Phys A Stat Mech Appl. 2024;656(12):130216. doi:10.1016/j.physa.2024.130216. [Google Scholar] [CrossRef]
5. Wu Y, Tan H, Qin L, Ran B. Differential variable speed limits control for freeway recurrent bottlenecks via deep actor-critic algorithm. Transp Res Part C Emerg Technol. 2020;117(4):102649. doi:10.1016/j.trc.2020.102649. [Google Scholar] [CrossRef]
6. Grumert EF, Tapani A, Ma X. Characteristics of variable speed limit systems. Eur Transp Res Rev. 2018;10(2):21. doi:10.1186/s12544-018-0294-8. [Google Scholar] [CrossRef]
7. Yang Y, Liu Q, Shi YJ. Study on decision model of dynamic hard shoulder running for highways with saturated traffic volume. Highw Eng. 2022;47(3):172–6. (In Chinese). doi:10.19782/j.cnki.1674-0610.2022.03.027. [Google Scholar] [CrossRef]
8. Binjaku K, Pasquale C, Meçe EK, Sacone S. Freeway traffic modeling by physics-regularized Gaussian processes. IEEE Open J Intell Transp Syst. 2025;6(6):116–30. doi:10.1109/OJITS.2025.3532796. [Google Scholar] [CrossRef]
9. Yuan F, Wang X, Chen Z. Assessing the impact of ride-sourcing vehicles on HOV-lane efficacy and management strategies. Transp Policy. 2024;150(2):35–52. doi:10.1016/j.tranpol.2024.02.017. [Google Scholar] [CrossRef]
10. Naseri A, Estelaji F, Samani A, Omidifar R, Zahedi R, Yousefi H. Simulating the performance of HOV lanes for optimal urban traffic management. Transp Res Interdiscip Perspect. 2024;23(1):101010. doi:10.1016/j.trip.2023.101010. [Google Scholar] [CrossRef]
11. Li Z, Zhu X, Liu X, Qu X. Model-based predictive variable speed limit control on multi-lane freeways with a line of connected automated vehicles. In: 2019 IEEE Intelligent Transportation Systems Conference (ITSC); 2019 Oct 27–30; Auckland, New Zealand. p. 1989–94. doi:10.1109/ITSC.2019.8917471. [Google Scholar] [CrossRef]
12. Zhang CB, Zhou B, Jiang Z, Xia YX. Variable speed limits for freeway based on vehicle-class specific control. J Wuhan Univ Technol Transp Sci Eng. 2015;39(6):1125–9,34. (In Chinese). [Google Scholar]
13. Tang JJ, Hu LP, Li MY, Zhang X. Optimization of highway emergency lane control based on Kriging genetic algorithm. J Syst Simul. 2024;36(5):1165–78. (In Chinese). doi:10.16182/j.issn1004731x.joss.23-0090. [Google Scholar] [CrossRef]
14. Jenior P, Schroeder B, Dowling R, Geistefeldt J, Hale D. Decision support framework and parameters for dynamic part-time shoulder use: considerations for opening freeway shoulders for travel as a traffic management strategy. Washington, DC, USA: Federal Highway Administration; 2019. Report No.: FHWA-HOP-19-029. [Google Scholar]
15. Liu Q, Ding F, Zhang Z, Yang Y. Analysis of traffic operation characteristics of highways under emergency lane opening conditions. J China Foreign Highw. 2022;42(4):252–7. [Google Scholar]
16. Lu R, Ma M, Wang Y, Lu J, Liang S. Dynamic areas strategy design for variable speed limiting at fixed freeway bottlenecks. Phys A Stat Mech Appl. 2023;615(4):128572. doi:10.1016/j.physa.2023.128572. [Google Scholar] [CrossRef]
17. Choi J, Tay R, Kim S, Jeong S, Kim J, Heo TY. Safety effects of freeway hard shoulder running. Appl Sci. 2019;9(17):3614. doi:10.3390/app9173614. [Google Scholar] [CrossRef]
18. Kononov J, Hersey S, Reeves D, Allery BK. Relationship between freeway flow parameters and safety and its implications for hard shoulder running. Transp Res Rec J Transp Res Board. 2012;2280(1):10–7. doi:10.3141/2280-02. [Google Scholar] [CrossRef]
19. Wang C, Zhang J, Xu L, Li L, Ran B. A new solution for freeway congestion: cooperative speed limit control using distributed reinforcement learning. IEEE Access. 2019;7:41947–57. doi:10.1109/ACCESS.2019.2904619. [Google Scholar] [CrossRef]
20. Li Y, Zhang S, Pan Y, Zhou B, Peng Y. Exploring the stability and capacity characteristics of mixed traffic flow with autonomous and human-driven vehicles considering aggressive driving. J Adv Transp. 2023;2023(1):2578690. doi:10.1155/2023/2578690. [Google Scholar] [CrossRef]
21. Papageorgiou M, Kosmatopoulos E, Papamichail I. Effects of variable speed limits on motorway traffic flow. Transp Res Rec J Transp Res Board. 2008;2047(1):37–48. doi:10.3141/2047-05. [Google Scholar] [PubMed] [CrossRef]
22. Hellinga B, Mandelzys M. Impact of driver compliance on the safety and operational impacts of freeway variable speed limit systems. J Transp Eng. 2011;137(4):260–8. doi:10.1061/(asce)te.1943-5436.0000214. [Google Scholar] [PubMed] [CrossRef]
23. Lan R, Yang S, Lou E, Li H. Applicability analysis and application research of variable speed limit strategy on highways. In: Proceedings of 2024 2nd International Conference on SmartRail, Traffic, and Transportation Engineering; 2024 Oct 25–27; Chongqing, China. Singapore: Springer; 2025. p. 46–60. doi:10.1007/978-981-96-7441-1_5. [Google Scholar] [CrossRef]
24. Terefe MB, Lee H, Heo N, Fox GC, Oh S. Energy-efficient multisite offloading policy using Markov decision process for mobile cloud computing. Pervasive Mob Comput. 2016;27(11):75–89. doi:10.1016/j.pmcj.2015.10.008. [Google Scholar] [CrossRef]
25. Yao Z, Ma Z, Wang J, Wu Y, Jiang C. Connected vehicle-based simulation of variable speed limit effects on highway mixed traffic flow. Phys A Stat Mech Appl. 2026;685:131272. doi:10.1016/j.physa.2026.131272. [Google Scholar] [CrossRef]
26. Lu QC, Liu L, Gao Y, Meng X, Li J, Hu Z. Variable speed limit control strategies in low CAV penetration scenarios. Transp A Transp Sci. 2025;27(6):1–36. doi:10.1080/23249935.2025.2582055. [Google Scholar] [CrossRef]
27. Gu Y, Zhang H, Han LD, Jia X, Lee DJ. Evaluating safety effects of variable speed limit systems via joint modeling. Accid Anal Prev. 2025;223(2):108247. doi:10.1016/j.aap.2025.108247. [Google Scholar] [PubMed] [CrossRef]
28. Yao J, Yang CY, Yang YY, Li JJ, Zhu XX. Cooperative lane change guidance strategy in freeway traffic accident area based on safety potential field theory. China Saf Sci J. 2024;34(7):71–82. (In Chinese). doi:10.16265/j.cnki.issn1003-3033.2024.07.0069. [Google Scholar] [CrossRef]
Cite This Article
 Copyright © 2026 The Author(s). Published by Tech Science Press.
This work is licensed under a Creative Commons Attribution 4.0 International License , which permits unrestricted use, distribution, and reproduction in any medium, provided the original work is properly cited.
 Downloads
 Citation Tools