
 Submit a Paper
 Propose a Special lssue
 Open Access
ARTICLE

Health Status Assessment of Unmanned Aerial Vehicle Engine Based on AHP Enhancement and Multimodal Fusion
1 Shijiazhuang Campus of Army Engineering University of PLA, Shijiazhuang, China
2 Shijiazhuang Flying College of PLAAF, Shijiazhuang, China
* Corresponding Author: Zhonghua Cheng. Email:
Computers, Materials & Continua 2026, 87(3), 44 https://doi.org/10.32604/cmc.2026.077392
Received 08 December 2025; Accepted 20 January 2026; Issue published 09 April 2026
 View Full Text
 Download PDF
Abstract
With the growing deployment of unmanned aerial vehicles (UAVs), reliable engine health state assessment (HSA) requires methods that are interpretable, auditable, and transferable under noisy data and varying operating conditions. This paper proposes an AHP-enhanced, data-driven HSA framework that builds a unified health vector from four indicators—remaining useful life (RUL) health, absolute state, relative degradation, and condition health. Indicator weights are derived using AHP with consistency checking, and the resulting continuous health index is mapped through nonlinear stretching and four-level thresholds to produce actionable health grades. Experiments on the NASA CMAPSS benchmark (FD001) evaluate conventional machine-learning models (e.g., XGBoost, SVM, Random Forest, MLP, Logistic) and temporal deep models (CNN-LSTM, Keras DNN). Results show that injecting AHP indicators consistently improves classification performance across models; in particular, AHP-CNN-LSTM achieves 0.92 accuracy and 0.924 Macro-F1, outperforming the CNN-LSTM baseline (0.88/0.872). SHAP-based analysis further supports the contribution of key indicators/features to separating adjacent degradation levels. Additional experiments on FD002–FD004 demonstrate the framework’s applicability under multi-operating-condition settings, providing practical guidance for UAV engine prognostics and health management.Keywords
As the penetration rate of unmanned aerial vehicles (UAVs) continues to rise in low altitude scenarios such as logistics distribution, infrastructure inspection, environmental monitoring, and emergency rescue, the reliability of power systems has been upgraded from a “performance indicator” to a key constraint of “public safety and economic efficiency” [1]. Small turbofan and turbojet engines operate in highly non-stationary and noisy environments. Aerothermal coupling, abrupt operating changes, and latent component degradation jointly hinder the construction of stable, auditable, and transferable HSA systems [2]. The current mainstream approach can be roughly divided into two categories: one is end-to-end deep temporal models, such as CNN-LSTM (Convolutional Neural Network Long Short Term Memory), Transformer self attention models, Keras DNN (Keras Deep Neural Network), which can automatically extract degradation trajectories from the original sequence under large sample conditions [3], but may suffer from insufficient interpretability and difficulty in engineering threshold solidification when the sample size is limited or the distribution drifts; Another type is traditional machine learning methods represented by XGBoost (eXtreme Gradient Boosting), SVM (Support Vector Machine), MLP (Multi Layer Perceptron), etc., which have high inference efficiency and strong controllability [4], but lack a unified health index and cross scene alignment mechanism. How to form a closed loop between “interpretable engineering metrics” and “powerful predictive models” is the core question that this article attempts to answer [5].
To address these issues, this article introduce AHP-based hierarchical indicators to explicitly encode domain knowledge, enabling a compact, interpretable, and transferable health representation that connects engineering decision-making with predictive models. A hybrid paradigm combining Analytic Hierarchy Process (AHP) and data-driven learning has been proposed: with Remaining Useful Life (RUL) as the main axis, a hierarchical structure is constructed around four sub indicators: RUL health, absolute state, relative degradation, and working condition health. Weight vectors are obtained through pairwise comparison matrices and consistency checks (
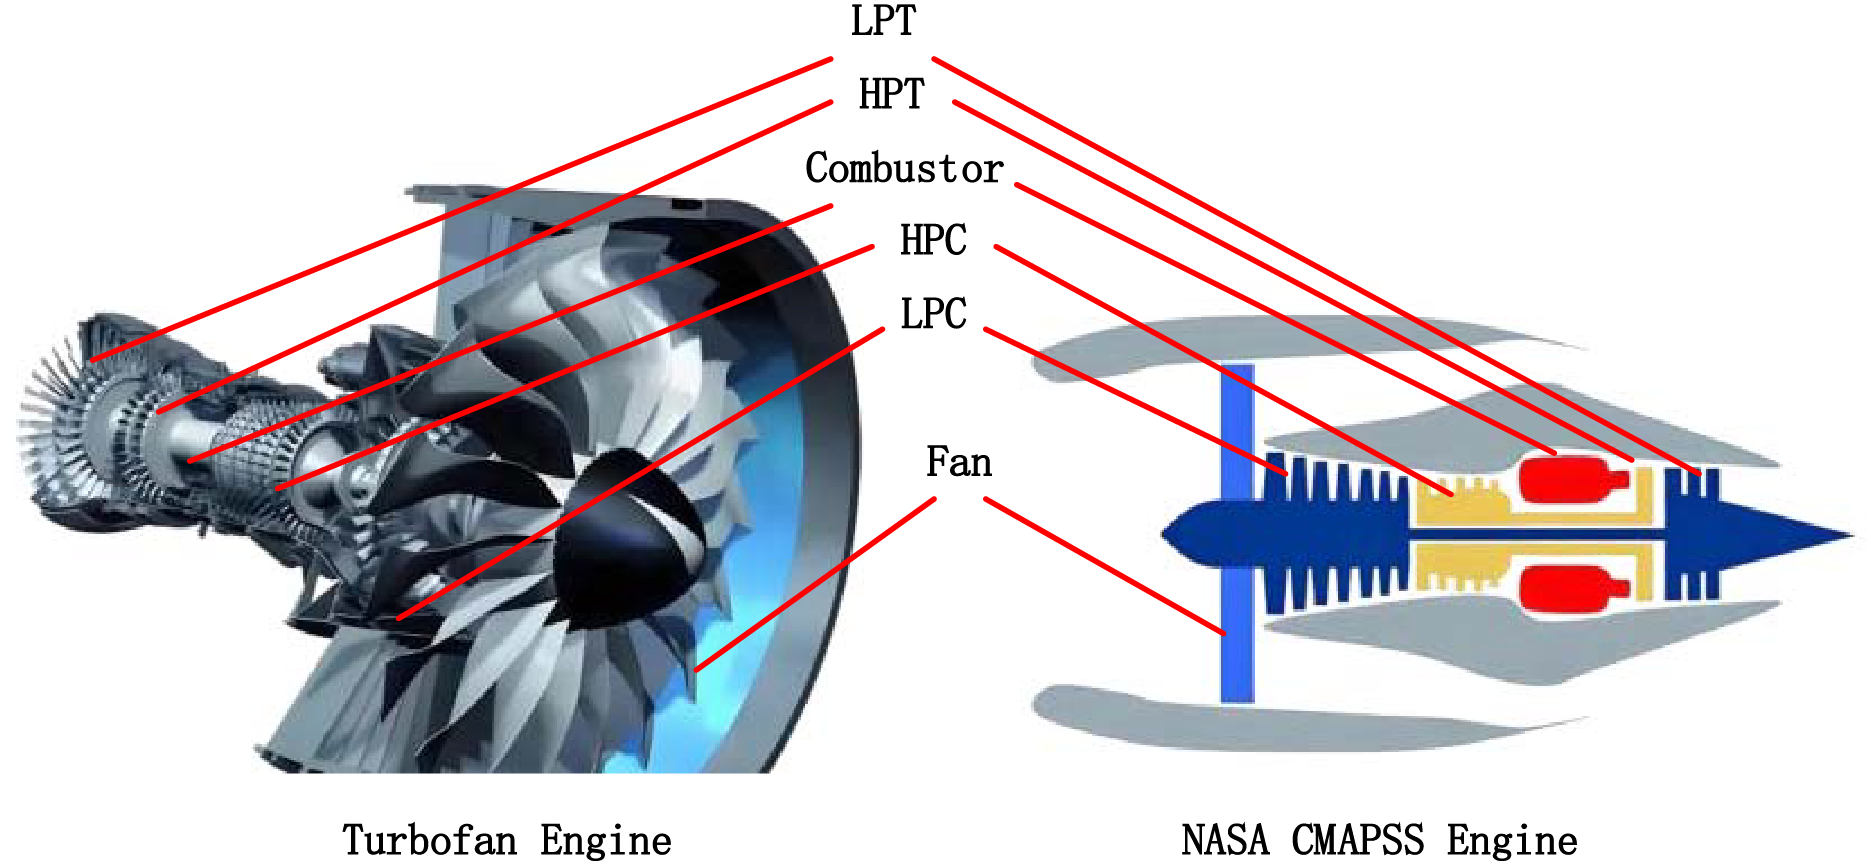
Figure 1: Structural mapping diagram of drone turbofan engine and NASA CMAPSS simulation engine.
In terms of experimental results, the AHP index as a “structured expression of domain knowledge” has produced stable and significant gains on traditional learners: The AHP indicators consistently improve the performance of traditional models, yielding accuracy gains of 5–15 percentage points across Logistic, XGBoost, SVM, MLP, and Random Forest; The original sequence driven CNN-LSTM showed a high accuracy of 0.88 on FD001 from the beginning, and when combined with the AHP method, AHP-CNN-LSTM achieved the highest accuracy of 0.92, demonstrating the advantage of end-to-end representation. It should be emphasized that AHP and deep models are not in opposition: the former provides an interpretable and auditable unified health index, while the latter provides strong trajectory modeling capabilities. The two complement each other in the “cloud edge dual channel” engineering system—the edge side uses AHP + lightweight models for online grading and threshold alarms, and the cloud side uses deep backbones for traceability arbitration and model updates [6]. The research framework and ideas of this article are shown in Fig. 2.
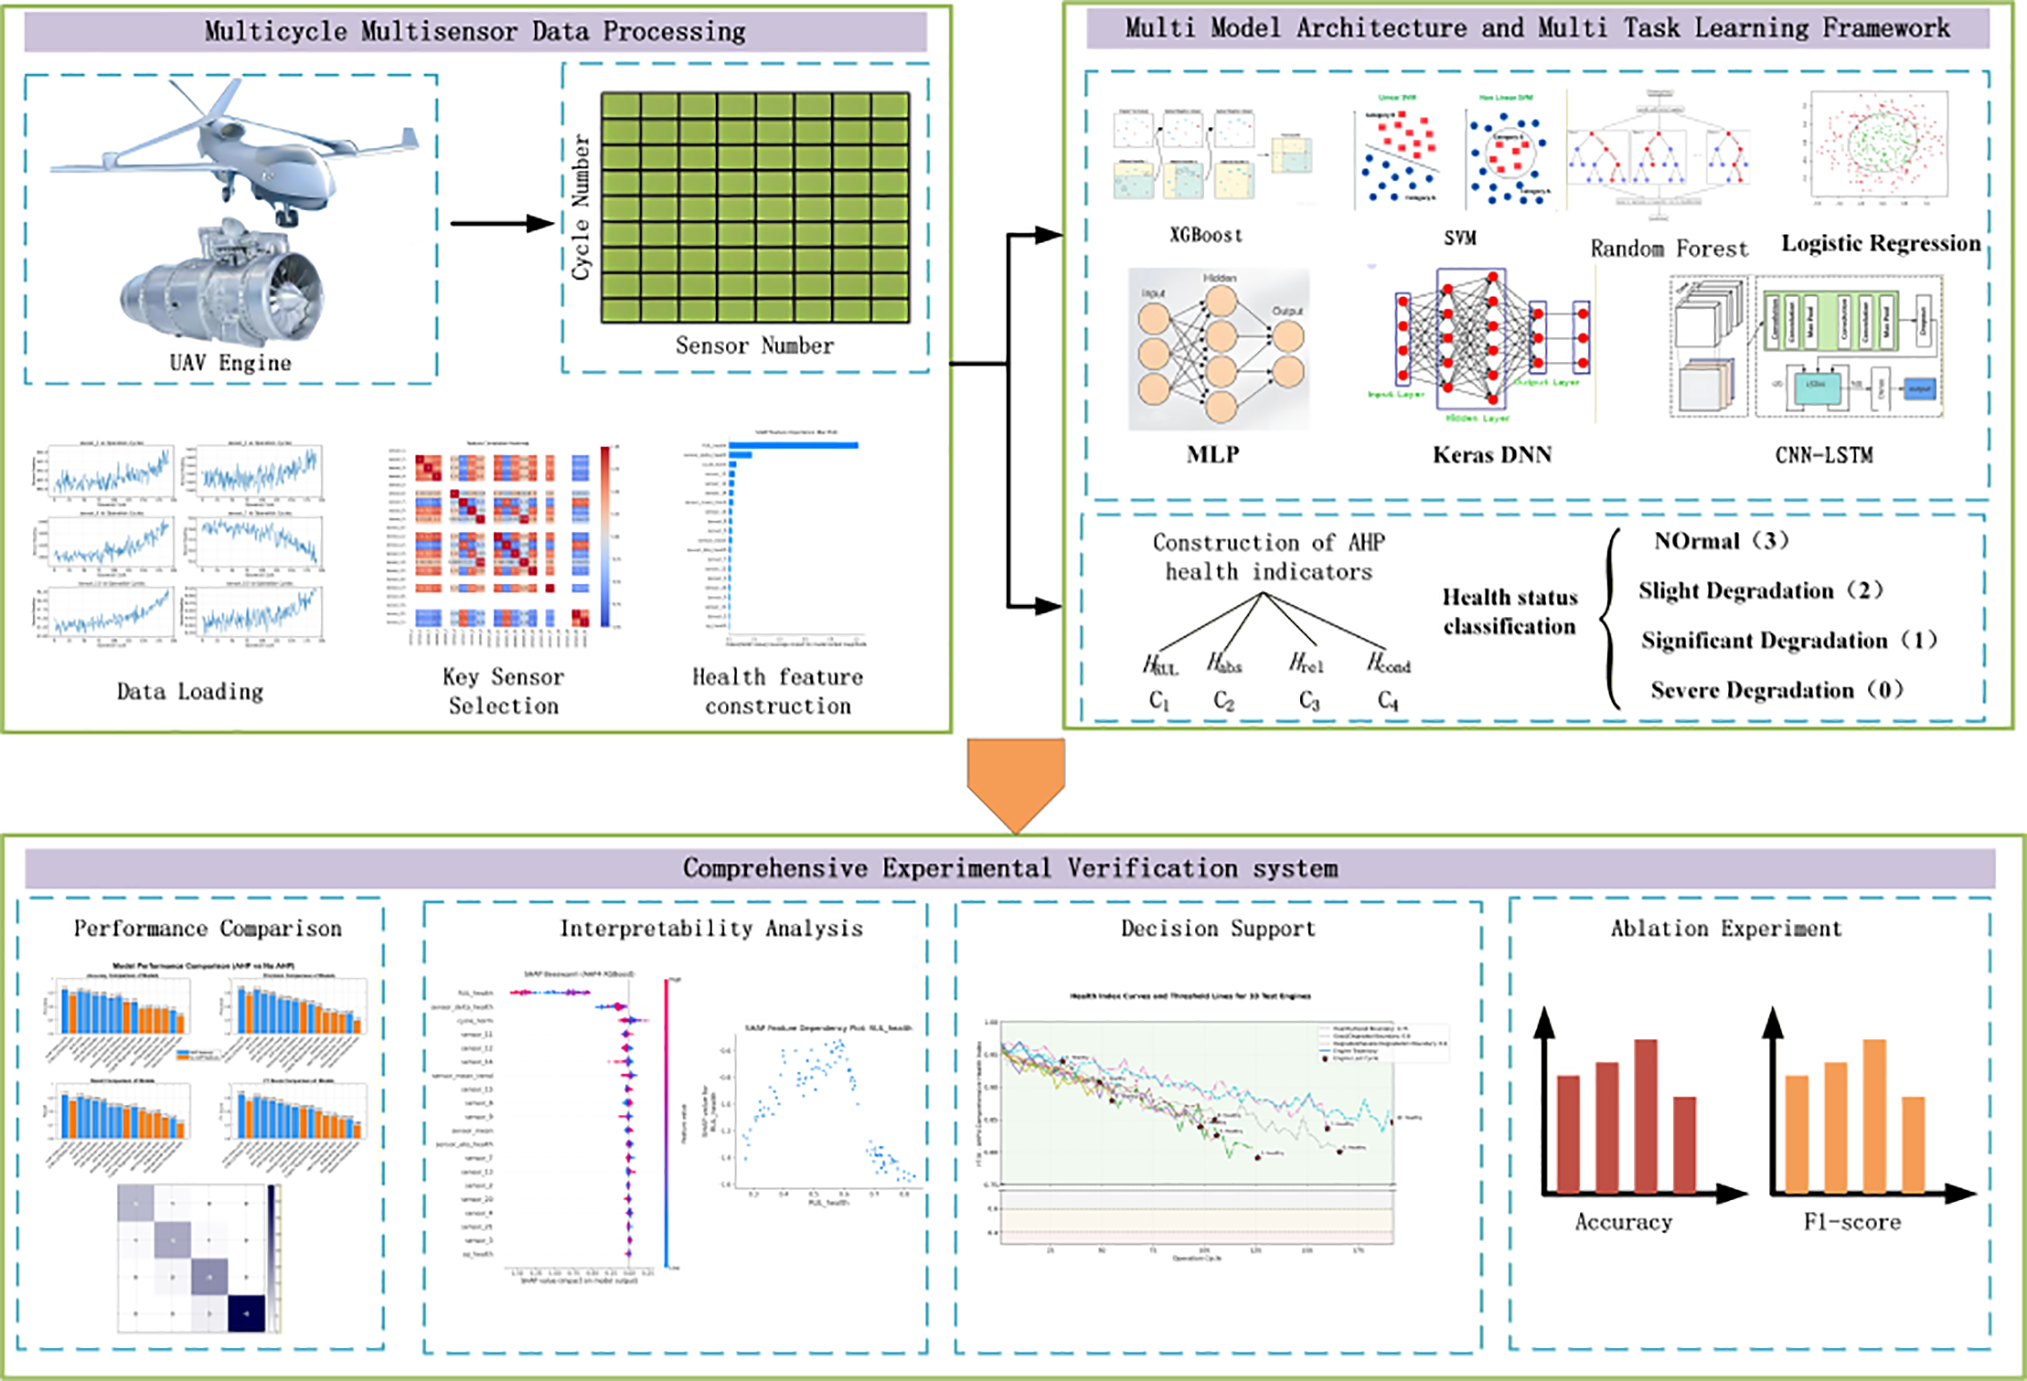
Figure 2: Framework diagram of research ideas.
In summary, the contributions of this work are threefold: ① Comprehensive framework: This article propose a systematic health assessment framework that integrates AHP hierarchical indicators, nonlinear stretching, four-level threshold solidification, and SHAP interpretability, forming a closed loop from engineering metrics to predictive models. ② Differentiation from existing work: Unlike previous AHP-HI or CMAPSS approaches, our method explicitly incorporates consistency-constrained weights, multi-dimensional health vectors, and threshold governance to ensure actionable and interpretable health states. ③ Validation and scalability: The method is verified through rigorous statistical tests, cross-domain adaptation, and multi-operating condition experiments, demonstrating both robustness and engineering applicability.
The AHP enhancement method designed consists of three closely integrated modules: unified health index design, interpretable weight solving, and nonlinear stretching grading mechanism [7].
Firstly, design four sub indicators at the indicator level. Firstly, RUL health: To normalize RUL to the “health domain” of
Among them,
Among them,
Fourthly, working condition health
At the weight level, the pairwise comparison matrix
When
At the hierarchical level, define an “engineering-friendly” nonlinear stretching
Among them,
The experimental data comes from the FD001 sub dataset of NASA CMAPSS, which is characterized by single operating condition and single fault, making it easy to separate operating condition interference and observe the pure effects of indicators and models. Extract samples using sliding windows with engine units as the granularity division: window length L = 30, step size s = 1, and labels aligned to the end of the window. The choice of L = 30 and s = 1 balances the trade-off between temporal resolution and computational cost, ensuring sufficient information for degradation trajectory modeling while maintaining responsive detection. Sensitivity analysis across different datasets shows that L = 30 consistently provides stable performance. Split the data in the train_FD001 sub dataset into training data and validation data in a ratio of 8:2. All normalization, stretching, and threshold fitting are learned on the training set and frozen to the validation/testing set to prevent information leakage. In terms of robust preprocessing, median/IQR Z-score is used to weaken the influence of outliers; Combining variance, mutual information, and correlation in feature selection while retaining channels with high known information content in the business (such as sensor_11 and sensor_14), as shown in Fig. 3.
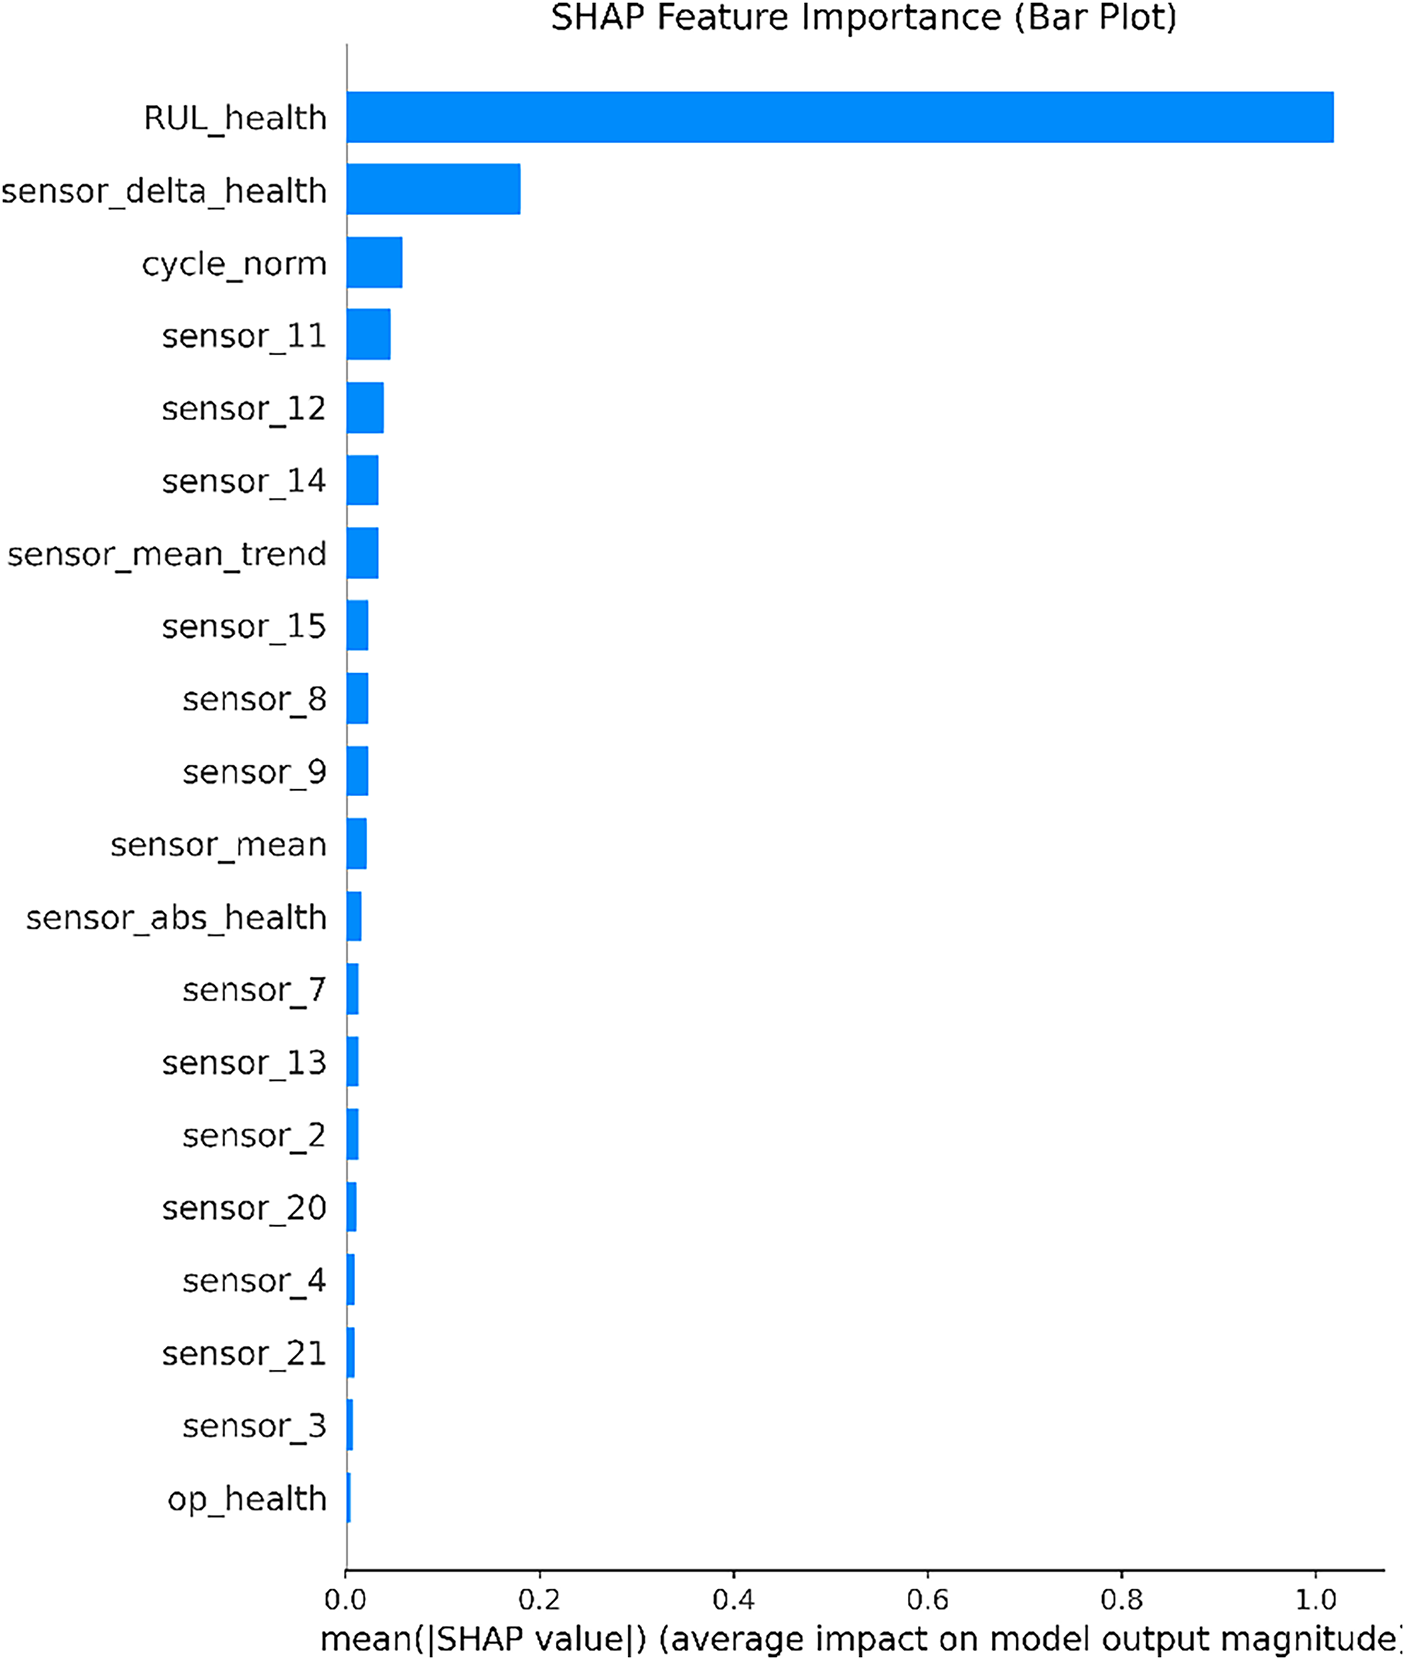
Figure 3: SHAP value feature importance map of sensors.
In addition, in order to further reduce the feature dimension from a statistical perspective, this paper conducted Lasso path analysis on the RUL regression model on the standardized feature matrix, as shown in Fig. 4. The horizontal axis in the figure represents
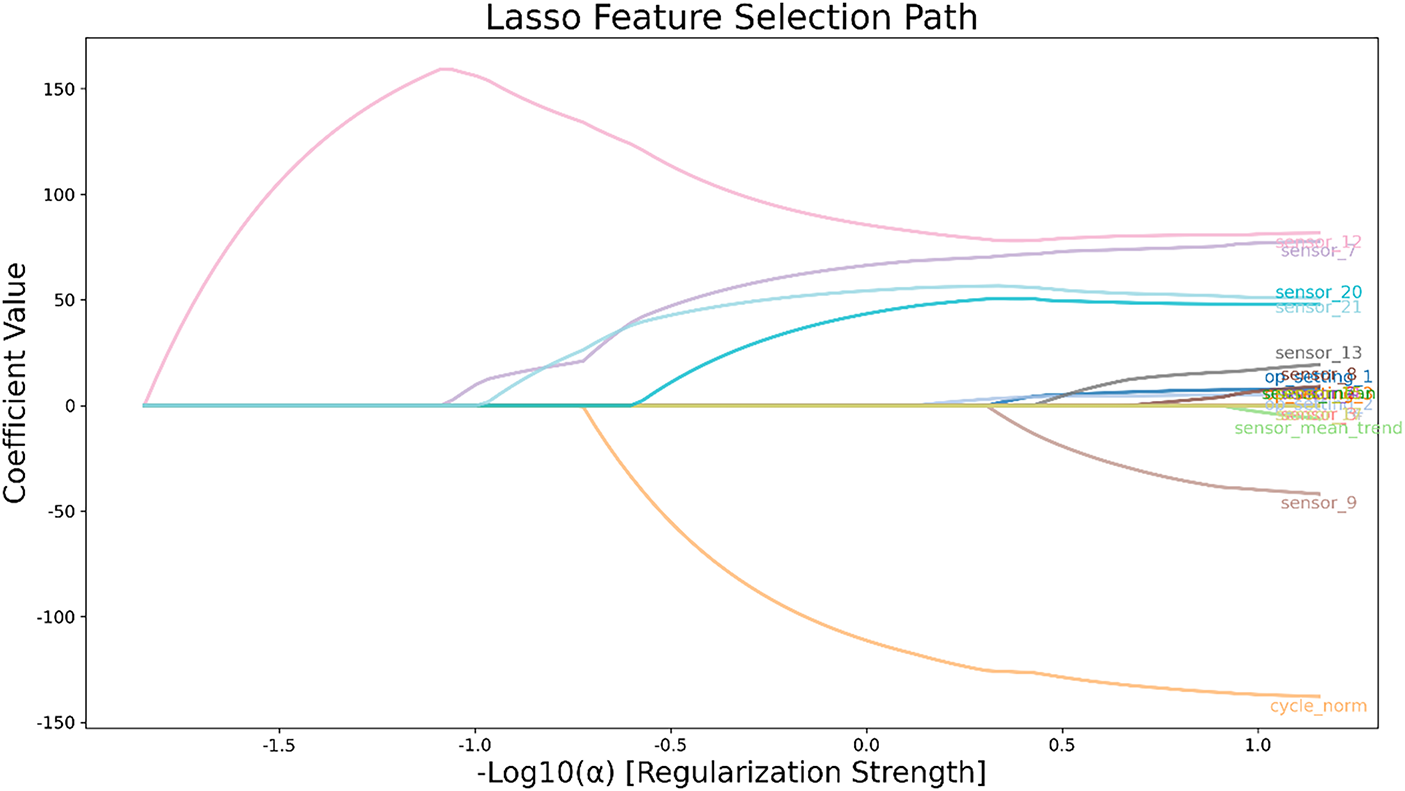
Figure 4: Lasso feature selection path diagram.
The model system includes both traditional learners (XGBoost, SVM, Random Forest, MLP, Logistic) and deep time series models (CNN-LSTM, Keras DNN, and AHP-CNN-LSTM and AHP Keras DNN injected with AHP indicators as exogenous channels). The hyperparameters of traditional learners are obtained through small-scale grid or Bayesian search [10]: for example, XGBoost has 300 trees, 3 depths, and a learning rate of 0.05 colsample_bytree 0.8; SVM uses RBF kernel to search for
4 Experimental Results and Analysis
To verify the effectiveness of the three piece set of “Unified Health Index AHP Weight Nonlinear Stretching Grading” in the health assessment of unmanned aerial vehicle engines, a systematic experiment was conducted around the FD001 sub dataset, covering four levels: regression (RUL prediction), classification (four level health status recognition), interpretability (SHAP), and decision support.
4.1 RUL Regression: Consistency Validation Driven by AHP Sub Indicators with RUL as the Main Axis
Firstly, multiple regressors are used to estimate RUL points, in order to verify whether the indicator system centered around RUL is consistent with the data-driven model [12]. The regression results are summarized in Table 1. The basic version of XGBoost achieves RMSE = 26.24, MAE = 18.98,
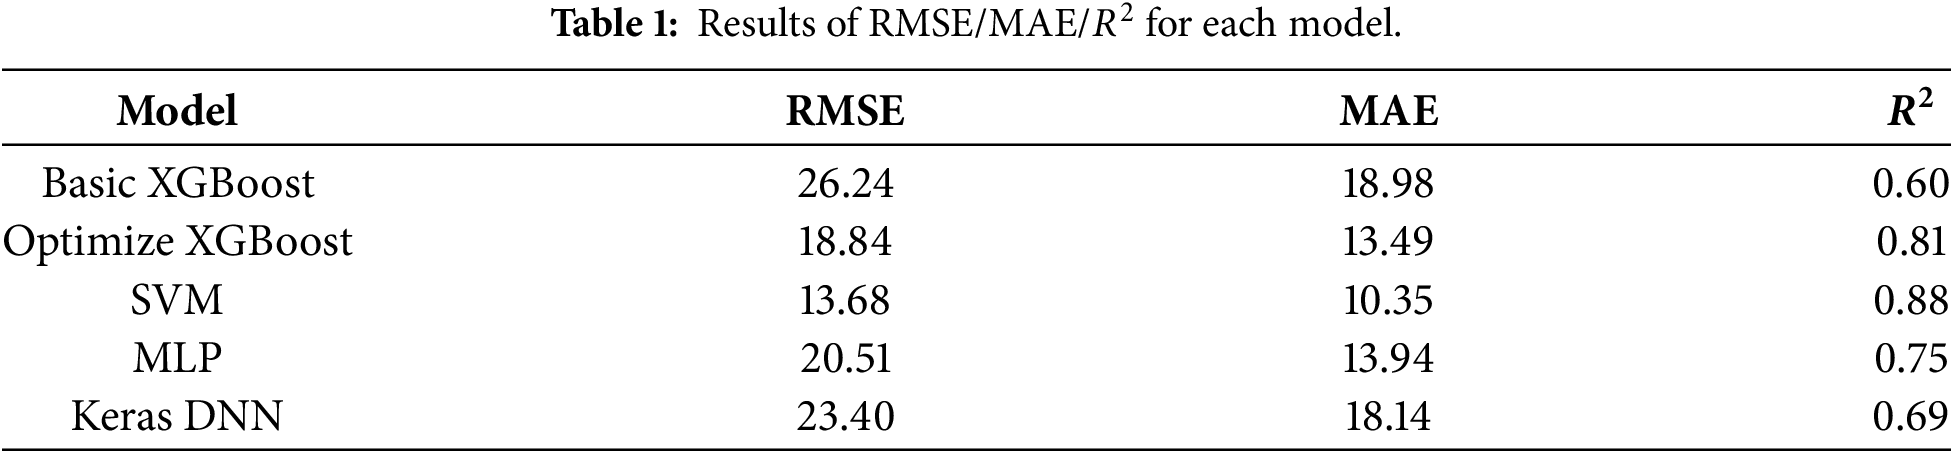
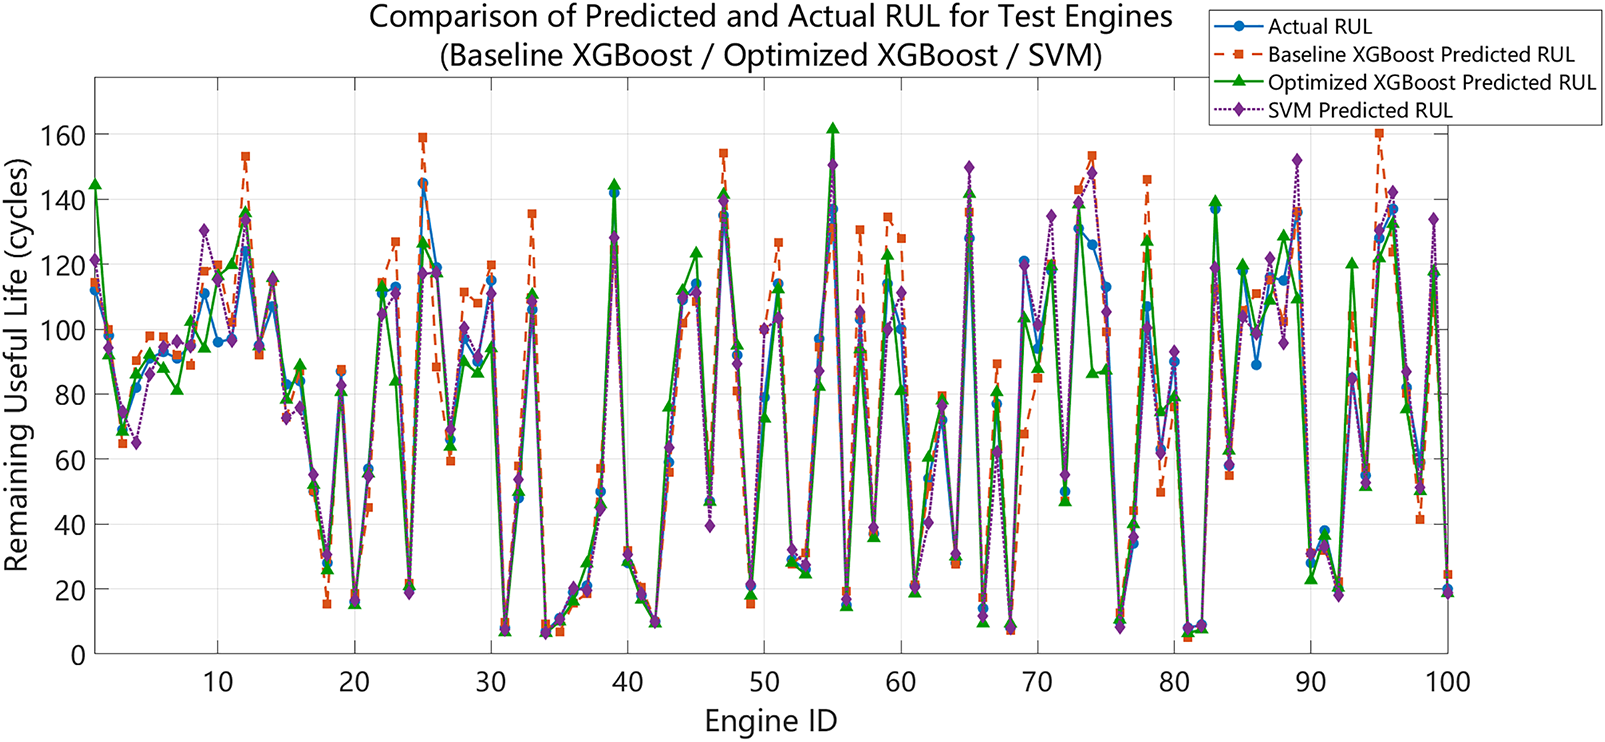
Figure 5: Comparison between RUL predicted by basic XGBoost/optimized XGBoost/SVM and real RUL.
The MLP regression shows RMSE = 20.51, MAE = 13.94,
Although this paragraph belongs to the regression task, its significance lies in laying the engineering intuition and statistical evidence that “RUL is the main axis”: the improvement of RUL accuracy will directly push up
4.2 Four-Level Health Classification Performance
In the classification task, compare three sets of schemes: ① without AHP (using raw/statistical features directly), ② AHP features (
(1) No baseline capability of AHP. The accuracy of Logistic, Random Forest, SVM, MLP, XGBoost, and Keras DNN are approximately 0.78, 0.73, 0.79, 0.78, 0.78, and 0.83, respectively. In terms of class level details, SVM has a higher recall for “obvious degradation”, while Logistic and MLP have good accuracy for “severe degradation”, but “slight degradation “ classes are usually prone to errors (F1 mostly ranges from 0.52 to 0.64). As shown in Fig. 6.
(2) The injection gain of AHP indicators. After incorporating the four indicator AHP features, the accuracy of Logistic, Random Forest, SVM, MLP, XGBoost, and Keras DNN was improved to 0.83, 0.88, 0.91, 0.88, 0.87, and 0.86. Among them, both AHP-Random Forest and AHP-MLP reached 0.88, and the boundary recognition of “slight degradation/obvious degradation” was significantly improved (F1 of slight degradation class increased from 0.45 to 0.78~0.83). This phenomenon supports the original intention of this article’s design:
(3) The upper limit performance and complementarity of deep sequences. Under the same sliding window and segmentation settings, CNN-LSTM (without injecting AHP) achieved an accuracy of 0.88, and the class level accuracy and recall were balanced and high among the four classes, demonstrating the powerful ability of end-to-end representation learning in temporal degradation mode modeling [14]. When AHP-CNN-LSTM is introduced, the accuracy improves to 0.92, indicating that injecting AHP features significantly improves performance, especially in the detailed partitioning of health states. The AHP-CNN-LSTM model method is used to evaluate the health status of the test set engine, as shown in Fig. 7. It should be noted that simple feature concatenation may not fully leverage its advantages, therefore, future improvements should focus more on fine-grained processing in the “attention fusion” module (such as gated fusion and feature alignment loss) [15] to better utilize exogenous health channel information.
(4) The AHP-Stacking model fuses the outputs of base learners (i.e., traditional classifiers such as Logistic Regression, Random Forest, SVM, XGBoost, etc.) through StackingClassifier. In the process of model fusion, logistic regression was used as the final fusion model (Meta learner), which integrates the output results of the base learners through the prediction probability (predictsproba) method to obtain the final health status classification result. In this way, the model can effectively combine the advantages of various base learners, thereby improving classification performance. In the experiment, the accuracy of the AHP-Stacking model reached 0.90, which showed significant performance improvement compared to basic models that did not use AHP features (such as SVM, XGBoost, etc.), especially in the boundary recognition of “slight degradation” and “obvious degradation”. This indicates that the introduction of AHP features effectively improves the classification accuracy of the model, especially in the identification of intermediate health states.
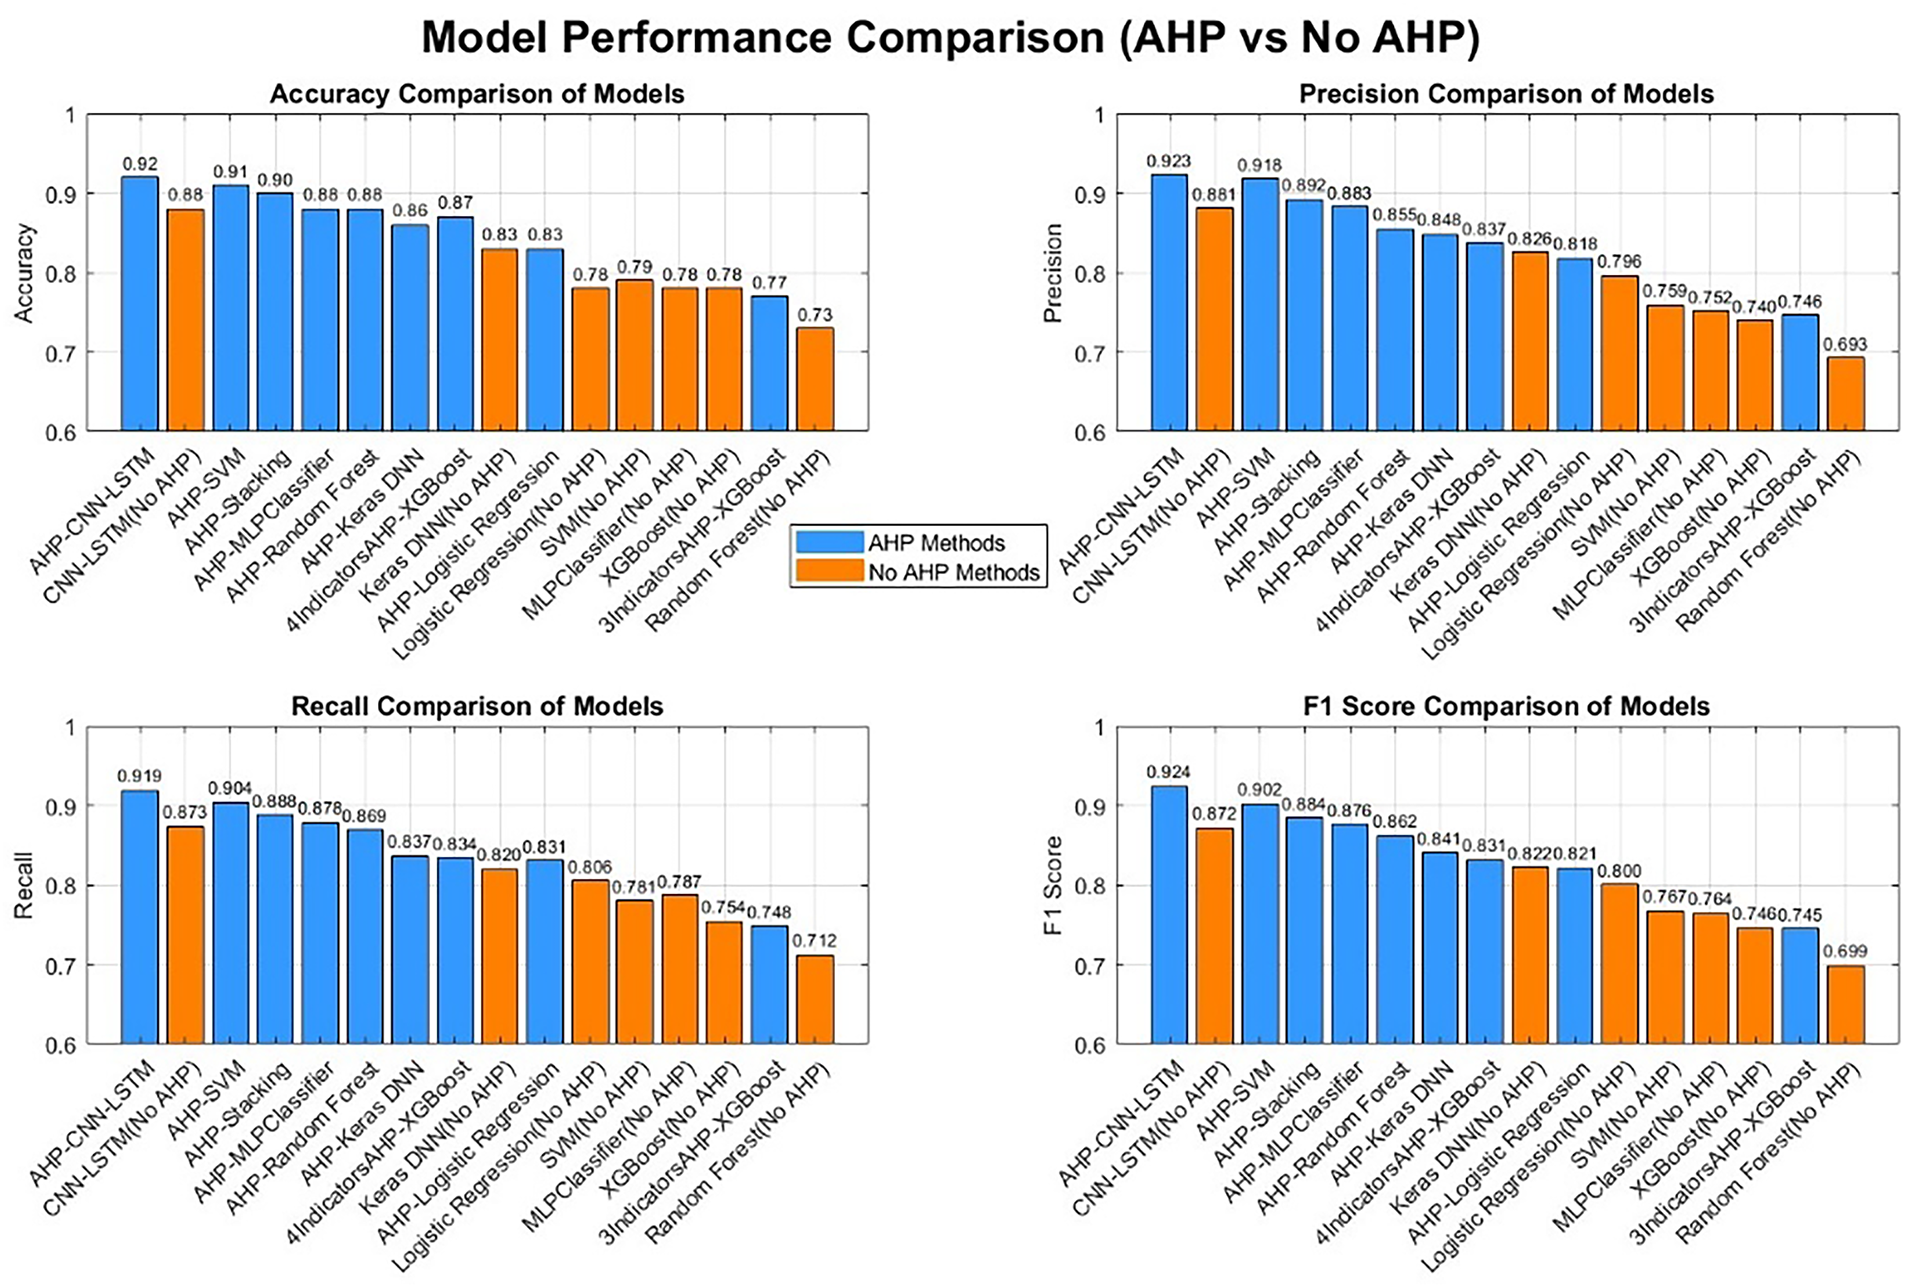
Figure 6: Performance comparison analysis of models.
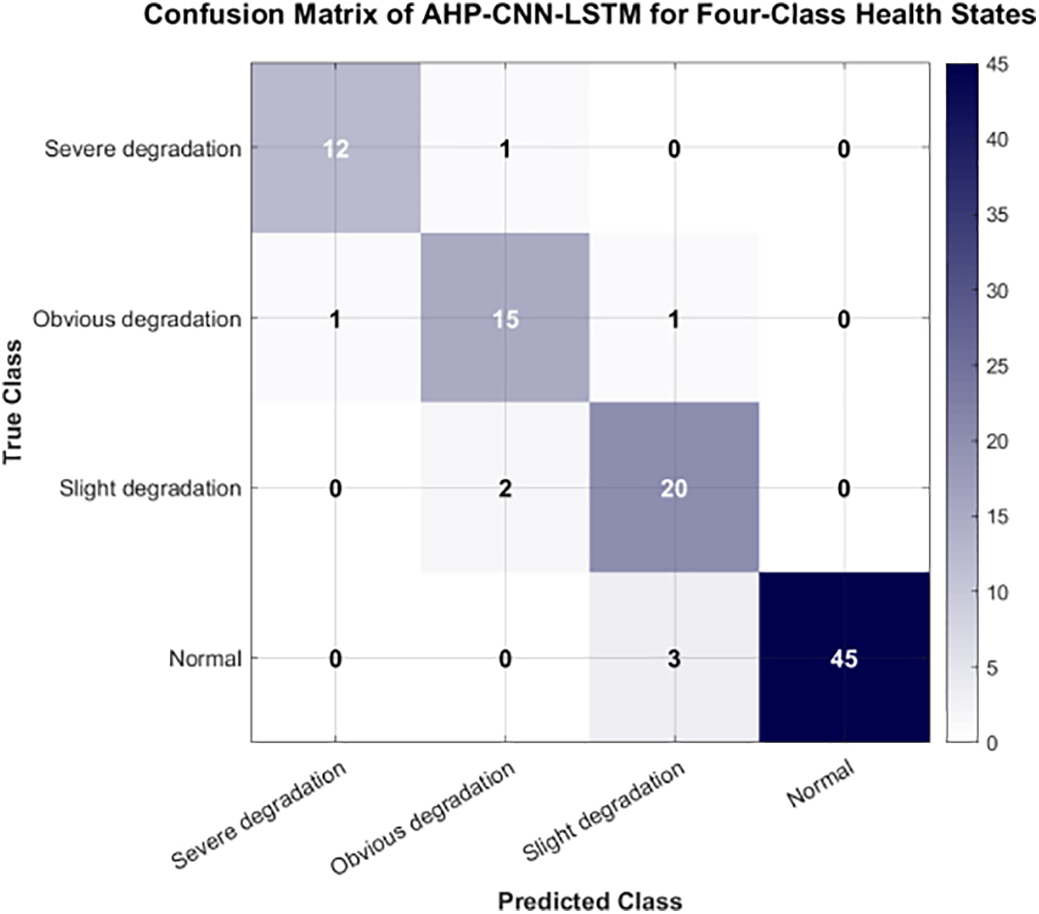
Figure 7: Confusion matrix of AHP-CNN-LSTM evaluation of engine health status.
4.3 SHAP Interpretability: Causal Clues from Indicators to Decisions
Conduct SHAP analysis on the “Four Index AHP + XGBoost” to verify the contribution path of indicators in model decision-making. The results show that when
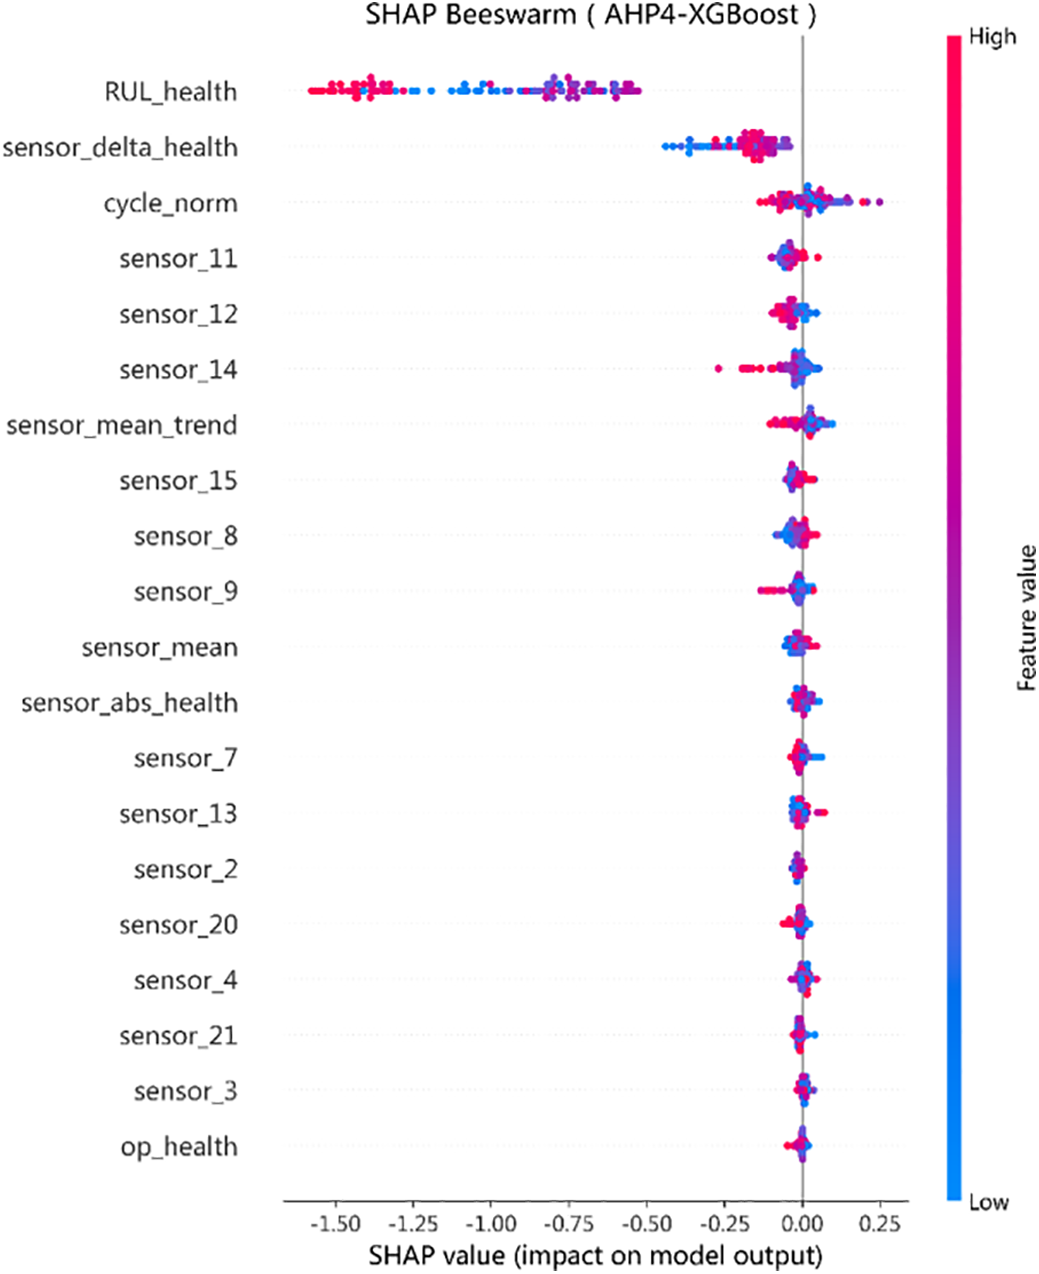
Figure 8: Bee colony diagram of the influence of features on model prediction.
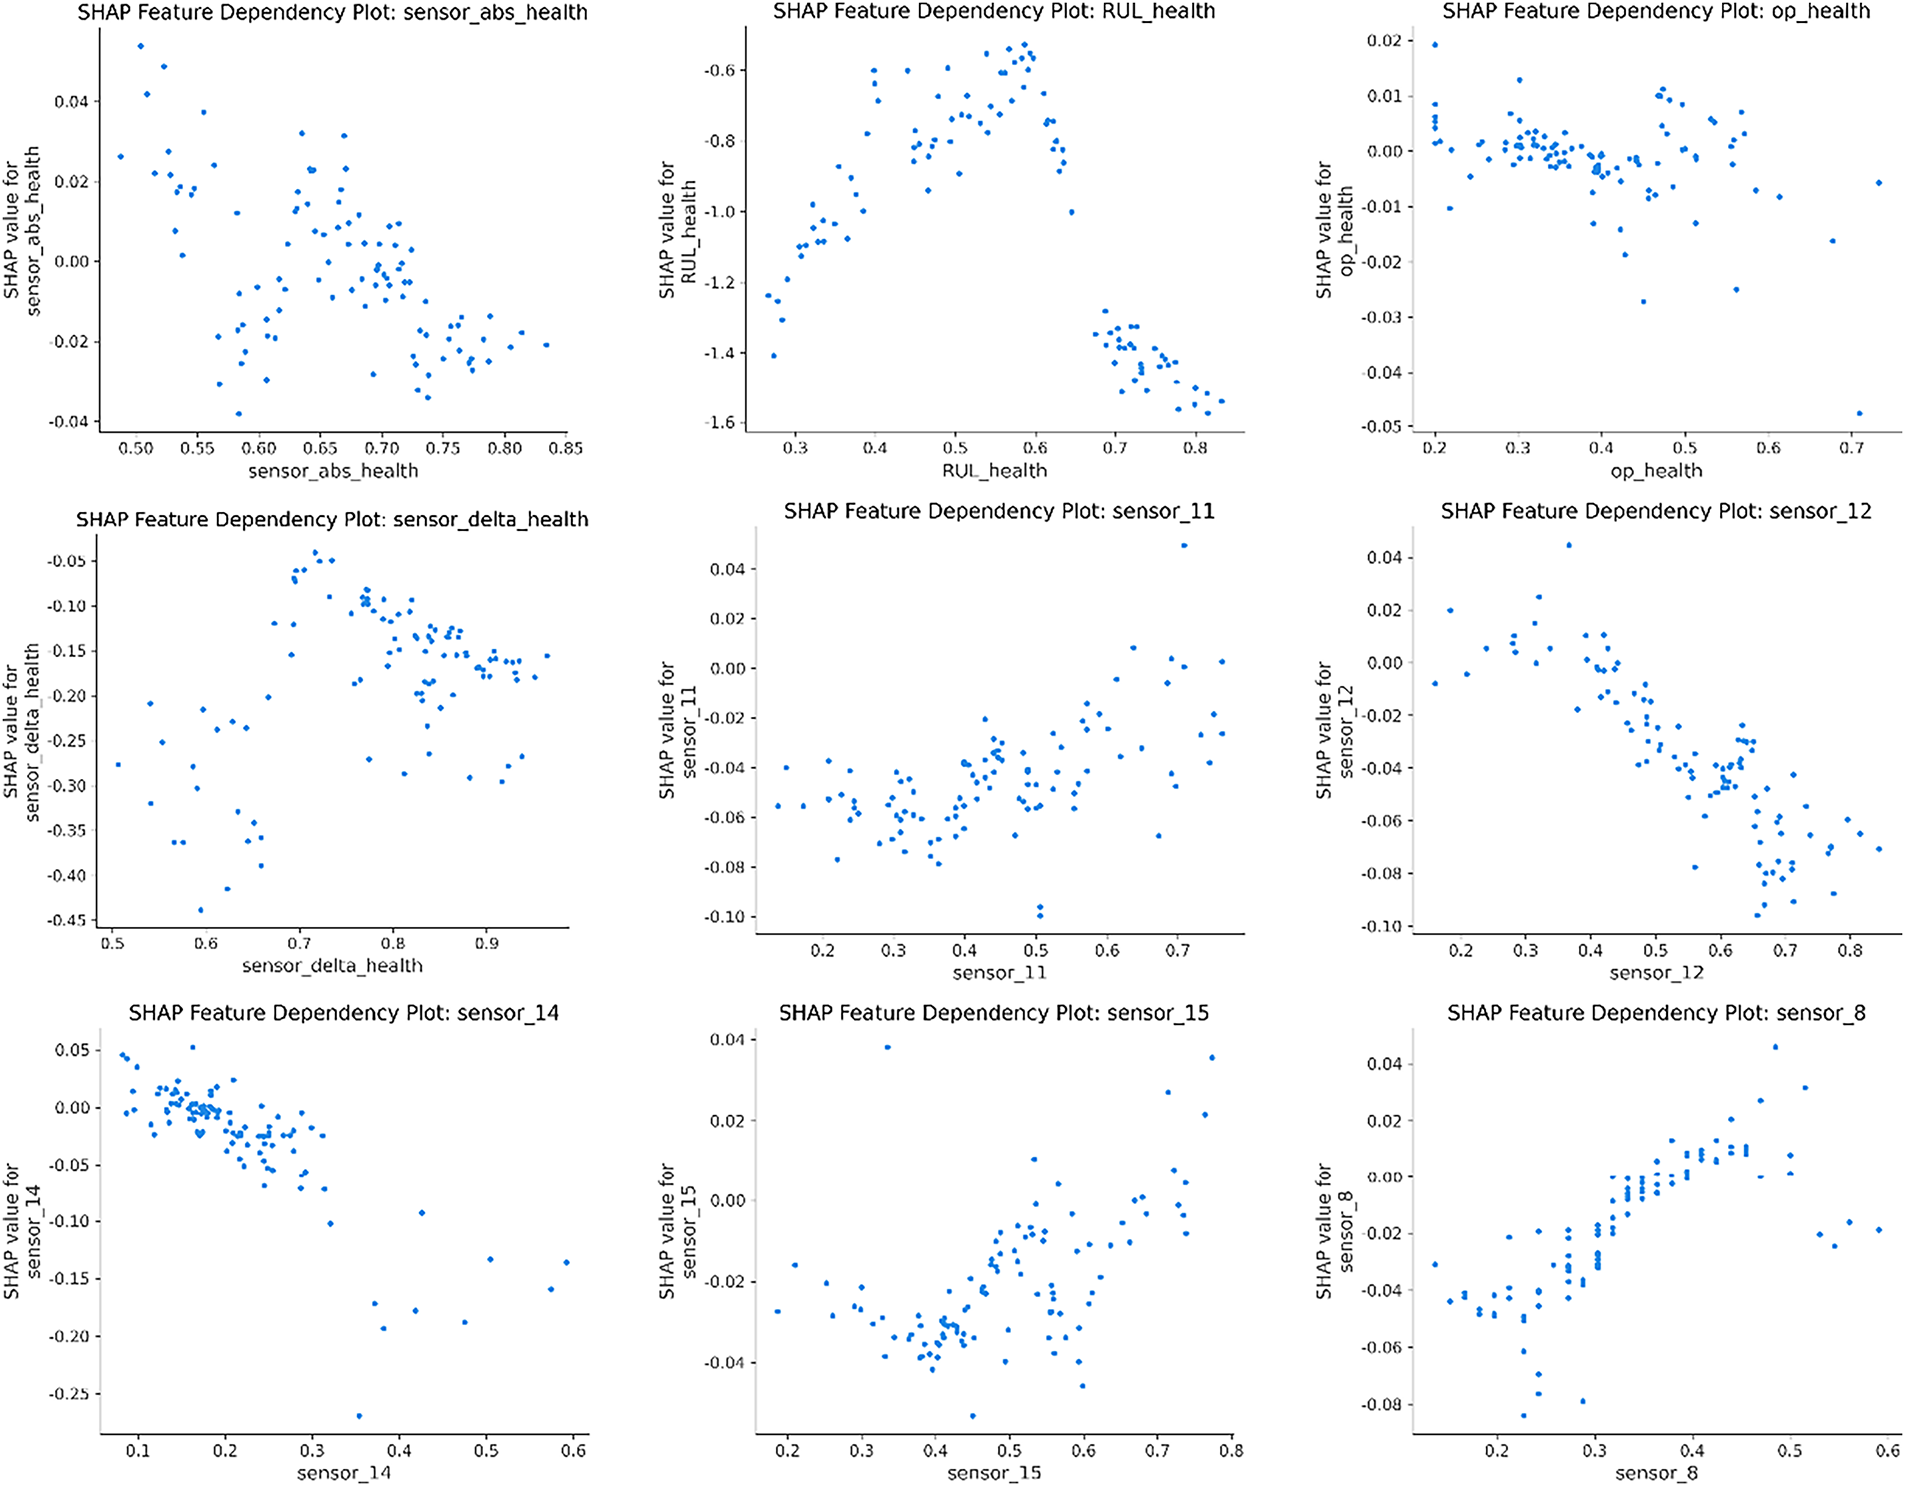
Figure 9: Feature interaction dependency graph.
4.4 Decision Support: Lowering Health Index to “What to Do”
In order to truly implement health assessment into maintenance strategies, the study mapped
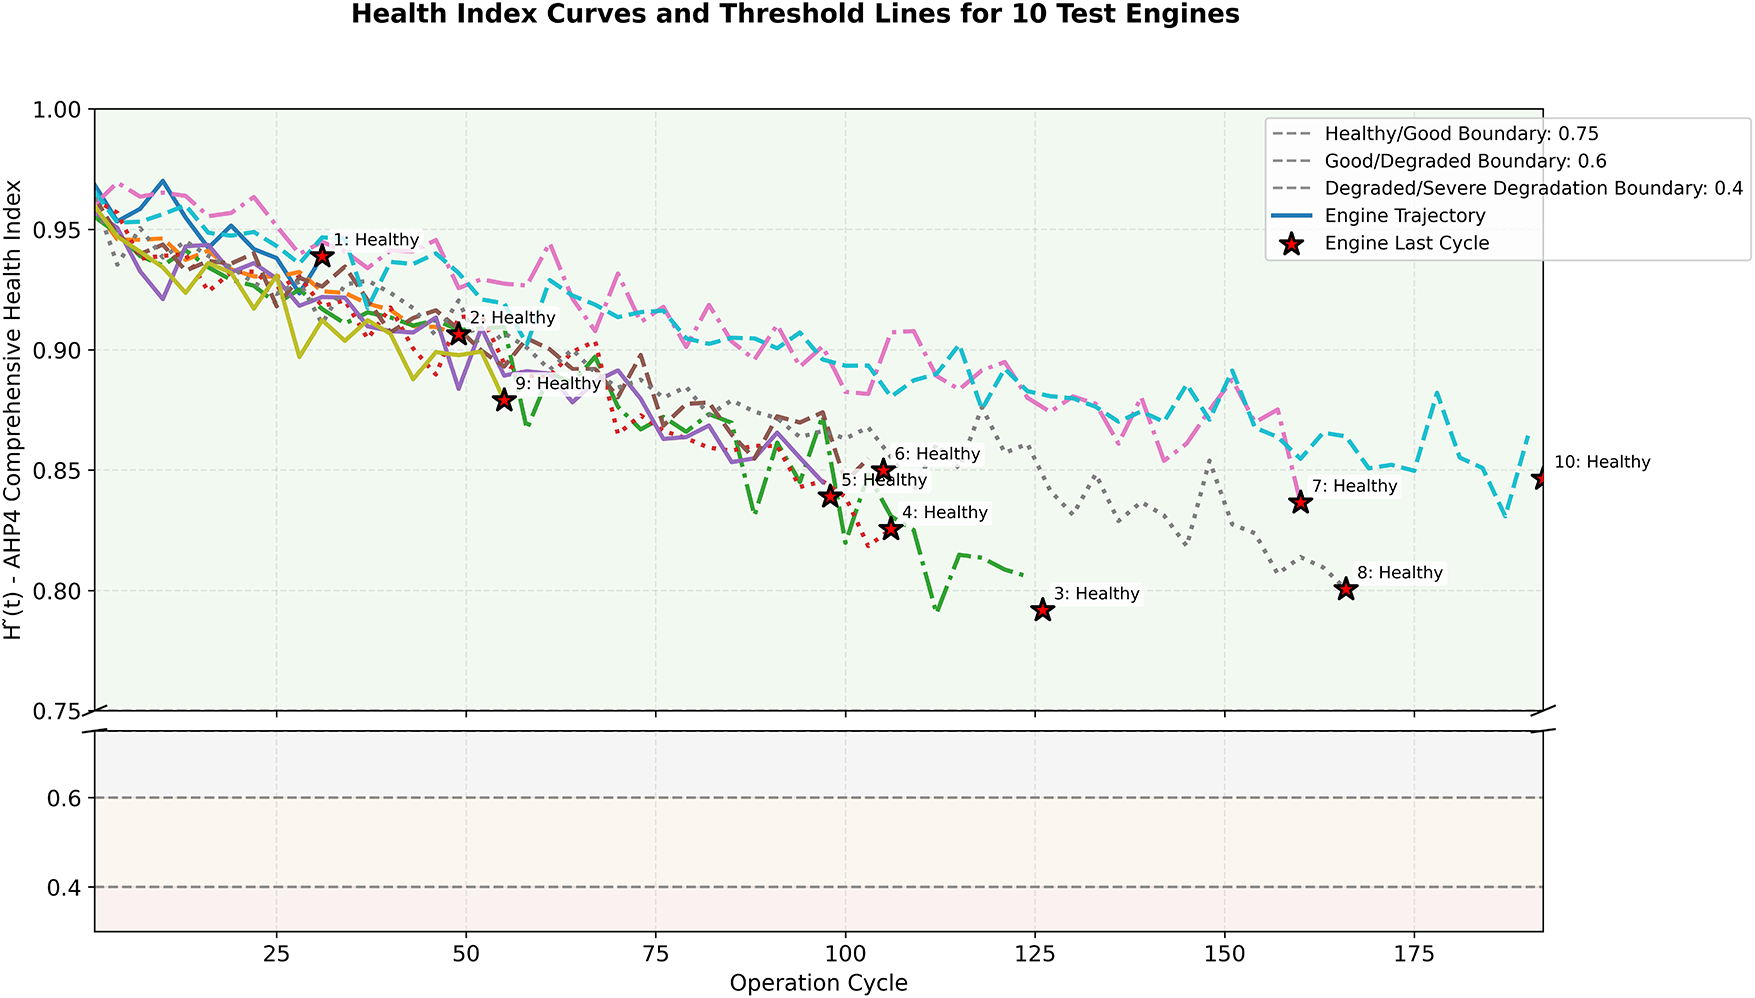
Figure 10:
4.5 Melting and Stability: Why “Four Indicators + Stretching + Threshold” are Indispensable
In order to quantify the necessity of each component, three ablation groups were studied: ① removal of
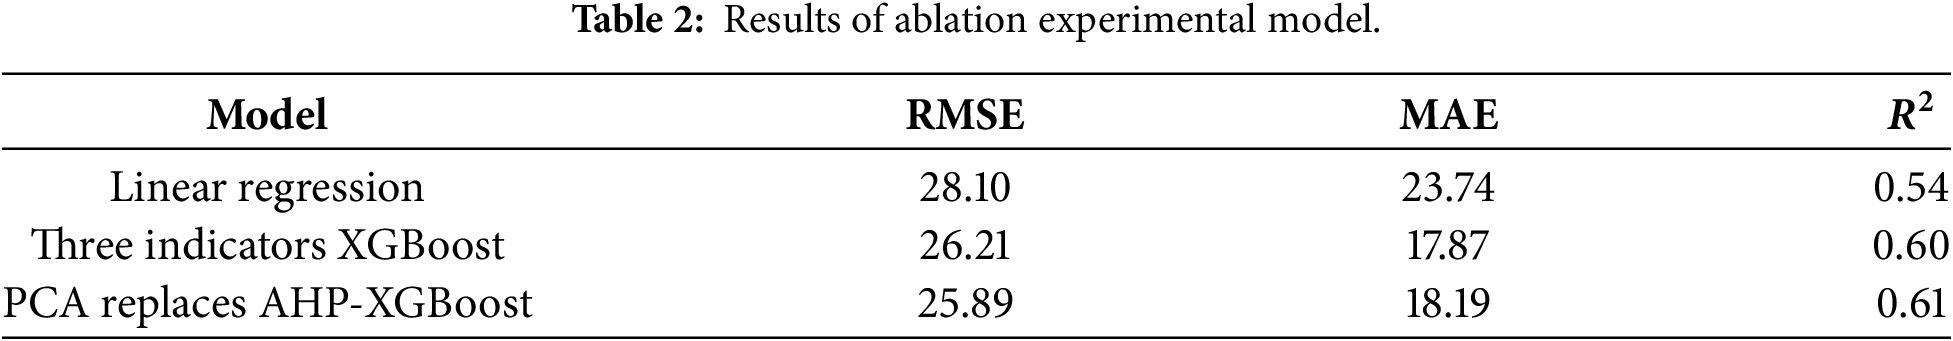
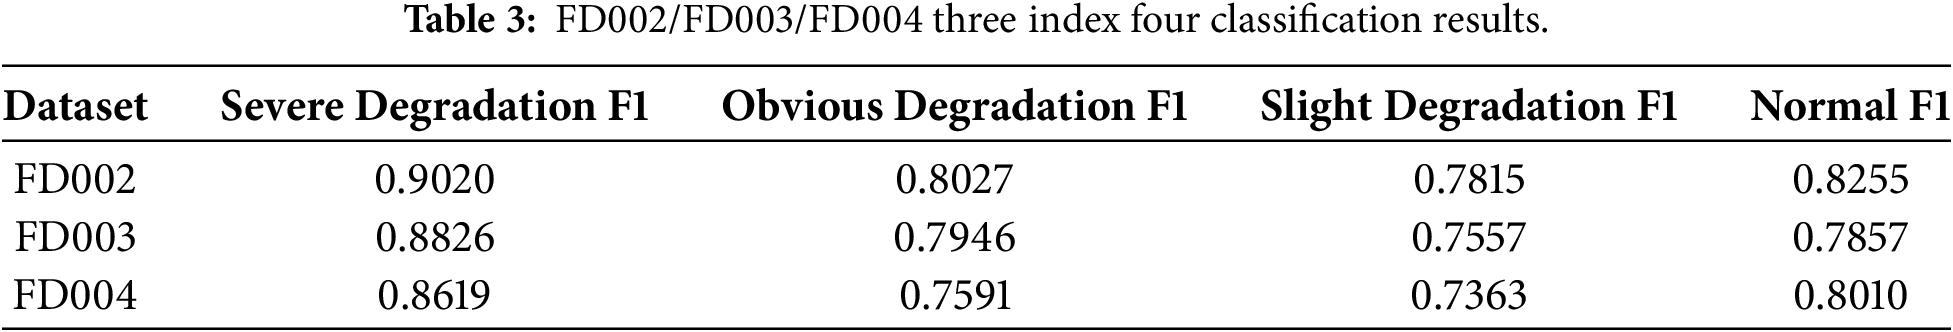
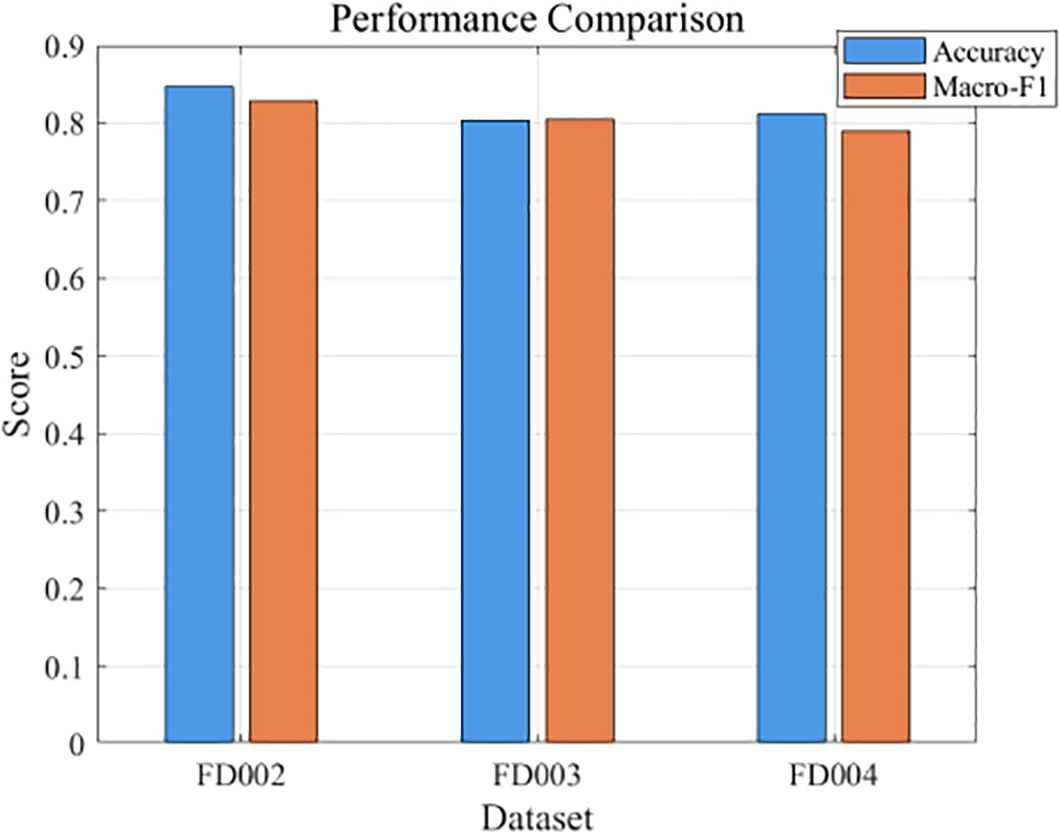
Figure 11: Accuracy and Macro-F1 of the three indicators on the FD002-FD004 dataset.
In addition to FD001, the proposed AHP-CNN-LSTM model was evaluated on FD002–FD004 datasets to assess its generalization ability under multiple operating conditions. As shown in Table 3 and Fig. 11, the model achieved accuracies of 0.85, 0.80, and 0.81, and corresponding Macro-F1 scores of 0.8279, 0.8047, and 0.7896 for FD002, FD003, and FD004, respectively. Compared with FD001 (Accuracy = 0.92, Macro-F1 ≈ 0.924), the performance decreases slightly for FD002–FD004, mainly due to increased variability and complexity in operating conditions. Despite this, the model maintains relatively stable discriminative capability across the different datasets, demonstrating its practical applicability and robustness for UAV engine health assessment under multi-condition and multi-fault scenarios. This result supports the proposed framework’s cross-domain transferability and engineering deployment potential.
4.6 Statistical Testing and Uncertainty: Not Only “High”, but Also “Stable”
To further examine whether the proposed multi-stage framework is necessary beyond architectural complexity, this article first compares it with representative end-to-end sequence models, using CNN-LSTM as a strong baseline. The end-to-end CNN-LSTM directly maps raw sensor sequences to health states without explicit indicator construction or weighting. Although it achieves competitive overall accuracy, its predictions are observed to be less stable near critical health boundaries, particularly between slight degradation and obvious degradation. In contrast, the proposed AHP-based multi-stage framework exhibits more consistent decision behavior in these intermediate regions, suggesting that explicit indicator construction plays an important role in stabilizing health state transitions rather than merely improving global metrics.
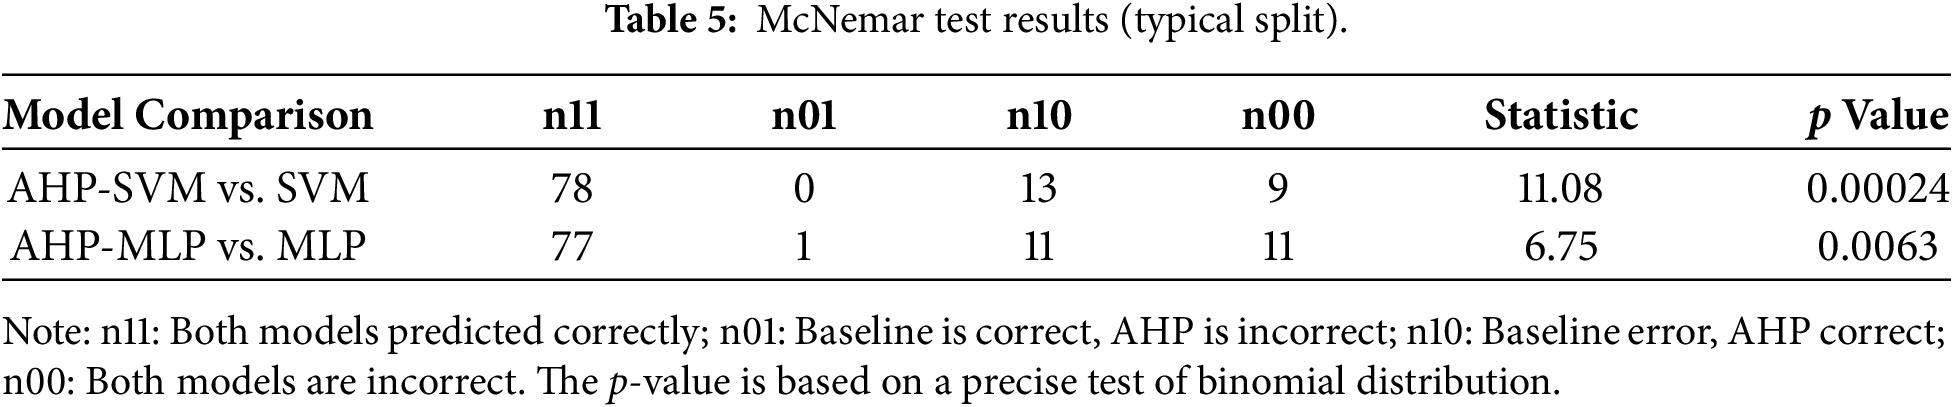
To quantitatively verify the robustness of the AHP health indicators under uncertainty, this study further conducts statistical testing based on ablation experiments. Specifically, five independent repeated experiments are performed on SVM/MLP and their AHP-enhanced versions under a fixed train/test split. The differences in Accuracy and Macro-F1 are bootstrapped 1000 times to estimate 95% confidence intervals. Boot-strap analysis and McNemar paired tests are conducted on the final split, and the results are summarized in Tables 4 and 5.
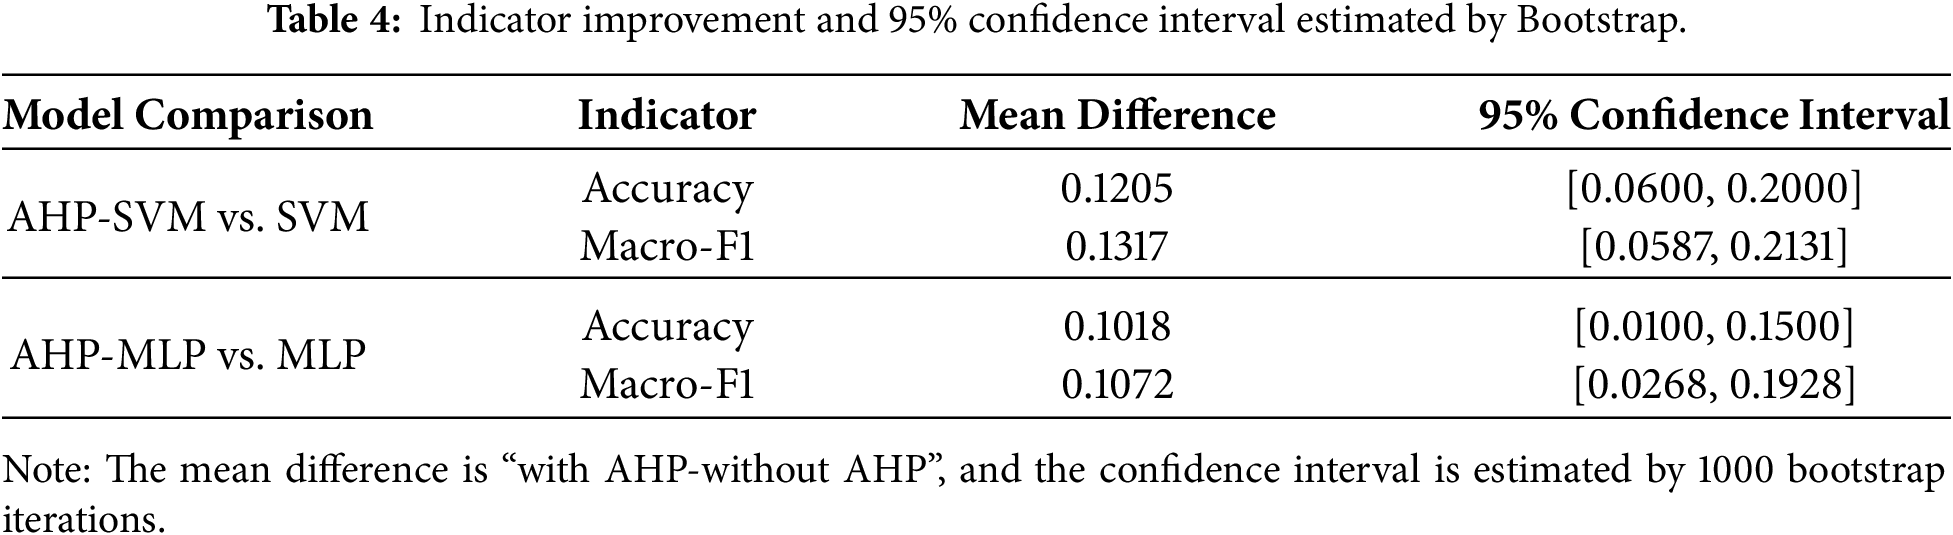
As shown in Table 4, both Accuracy and Macro-F1 exhibit confidence intervals entirely above zero for the comparisons between AHP-SVM and SVM, as well as AHP-MLP and MLP. In particular, AHP-SVM achieves an average Macro-F1 improvement of 0.13 (95% CI [0.06, 0.21]), while AHP-MLP shows a gain of approximately 0.11, indicating that the performance improvement introduced by AHP is statistically stable under sampling uncertainty.
Further McNemar test results, reported in Table 5, provide sample-level evidence. For SVM, AHP-SVM corrects 13 erroneous samples compared to the baseline while introducing almost no new errors (n01 = 0), yielding a p-value of 0.00024. For MLP, the number of corrected errors (n10 = 11) is also substantially higher than newly introduced errors (n01 = 1), with a p-value of 0.0063. These results confirm that the observed improvements are statistically significant and not caused by random fluctuations.
Overall, the results indicate that AHP does not simply induce a global shift in predictions. Instead, it mainly reorders samples and widens the separation near key degradation boundaries, particularly between slight degradation and obvious degradation. This behavior explains why the proposed multi-stage framework provides more stable and interpretable health assessment results than both simple baselines and end-to-end sequence models, especially in boundary-sensitive engineering scenarios.
Experimental result analysis: This section verifies the effectiveness and robustness of the AHP method in health status assessment through ablation experiments, Bootstrap confidence intervals, and McNemar tests. The ablation experiment shows that removing the operating condition indicators or using PCA instead of AHP sub indicators significantly affects the performance of the model, while AHP-SVM and AHP-MLP show stable improvements on multiple datasets, especially in the accuracy of the “slight degradation/obvious degradation” boundary. Bootstrap analysis and McNemar test further demonstrate the stability of the AHP method under uncertainty and provide higher accuracy at the sample by sample level.
5 Scalability and Generalization: Roadmap from FD001 to FD002-FD004
The single condition and single fault characteristics of FD001 enable the experiment to test the methodology in a “pure scenario”; The real challenge lies in multiple operating conditions/multiple fault scenarios (FD002-FD004). To this end, the experiment reserved two extension sites for “working condition health
5.1 The Construction and Detachment Mechanism of Working Condition Health
On multi condition data, first perform Gaussian mixture or spectral clustering on the operating settings (speed, pressure, temperature, etc.) to obtain condition cluster
When
5.2 Domain Adaptation and Deployment-Aware Consistency Regularization of AHP Weights
The core of AHP lies in the weight vector
From an engineering deployment perspective, the proposed framework explicitly separates edge-side and cloud-side responsibilities. On the edge side, fixed or slowly updated AHP weights combined with lightweight classifiers are used for real-time health grading and alarm triggering, enabling low-latency operation under limited computational resources. On the cloud side, deep models are responsible for weight adaptation, gating function
To further reduce deployment overhead on resource-constrained UAV platforms, practical optimization strategies such as sensor sparsification, model distillation, and quantization can be applied to the edge models without altering the overall assessment logic. This edge–cloud collaborative design ensures that the multistage health assessment framework remains computationally feasible while preserving interpretability, adaptability, and engineering reliability.
5.3 Cross Domain Evaluation Agenda and Migration Metrics
To avoid the trap of “better tuning on a dataset”, a unified process was adopted on FD002-FD004: unified sliding window, unified preprocessing, unified testing, and reporting of cross domain distribution drift measurement:
Combined with cost sensitive benefits (including downtime/false positives/false negatives costs). The experiment will focus on whether the boundary of “slight degradation/obvious degradation” is more stable after AHP adaptation, whether false positives are significantly reduced, and whether overall benefits are improved.
This paper proposes and systematically validates an interpretable, computable, and deployable health state assessment framework for UAV engines. Using the remaining useful life (RUL) as the main axis, we construct a four-indicator health vector (RUL health, absolute state, relative degradation, and condition health). The indicator weights are obtained via AHP with a consistency check, and the health index is mapped into an engineering-friendly range through nonlinear stretching (piecewise-linear plus power mapping). Finally, a four-level threshold set is used to translate the continuous index into actionable health grades.
Large-scale comparisons show that the AHP-based indicators steadily improve the accuracy of conventional learners to 0.83–0.90, with AHP-SVM reaching 0.90. When AHP indicators are injected into temporal deep models, AHP-CNN-LSTM achieves an upper-bound accuracy of 0.92, demonstrating the complementary strengths of interpretable indicators and sequence representation learning. Moreover, SHAP analysis provides consistent evidence for the decision mechanism: the high-score region is mainly driven by RUL, while the medium-to-low region is jointly influenced by relative degradation and absolute deviation, supporting the rationality of the indicator design.
More importantly, the proposed framework is naturally extensible to multi-operating-condition and multi-fault scenarios. We outline a cloud–edge collaborative deployment strategy to support resource-constrained UAV systems: lightweight AHP-based classifiers can run on the edge for real-time evaluation and alarm triggering, while the cloud side handles model updates, threshold recalibration, and continual learning. Domain adaptation can be further facilitated via AHP’s differentiable consistency regularization and soft weight gating [20]. To reduce edge-side computational burden, we also consider practical optimizations such as sensor sparsification, model distillation, and quantization, while maintaining competitive accuracy [21].
Future work will focus on three directions: (i) incorporating physical priors (e.g., thermal/aerodynamic coupling) into the aggregation of health indicators, (ii) cost-sensitive threshold learning under different missions and risk levels, and (iii) cross-domain incremental learning with drift monitoring for new operating conditions and platforms. Overall, tighter integration of interpretable knowledge structures and deep representation models is expected to provide both trustworthy health grades for engineers and actionable maintenance decisions for real-world UAV deployments.
Acknowledgement: Not applicable.
Funding Statement: This research was funded by scientific research projects under Grants JY2024B011.
Author Contributions: The authors confirm contribution to the paper as follows: Conceptualization, Kexin Jiang, Zhonghua Cheng; methodology, Yong Fan; software, Liang Wen; validation, Zhigang Xie; formal analysis, Enzhi Dong; investigation, Bo Zhu; resources, Enzhi Dong; data curation, Bo Zhu; writing—original draft preparation, Kexin Jiang; writing—review and editing, Yong Fan, Liang Wen, Zhonghua Cheng; visualization, Zhigang Xie; supervision, Zhonghua Cheng; project administration, Zhonghua Cheng. All authors reviewed and approved the final version of the manuscript.
Availability of Data and Materials: Data available on request from the authors. The data that support the findings of this study are available from the corresponding author, Zhonghua Cheng, upon reasonable request.
Ethics Approval: Not applicable.
Conflicts of Interest: The authors declare no conflicts of interest.
References
1. Corcau JI, Dinca L, Cucu AA, Condrea D. Drone electric propulsion system with hybrid power source. Drones. 2025;9(4):301. doi:10.3390/drones9040301. [Google Scholar] [CrossRef]
2. Abousada W. Design technology research of aircraft engine health management (EHM) technologies. Adv Aerosp Sci Technol. 2021;6(1):9–23. doi:10.4236/aast.2021.61002. [Google Scholar] [CrossRef]
3. Cao X, Shi K. A health status identification method for rotating machinery based on multimodal joint representation learning and a residual neural network. Appl Sci. 2025;15(7):4049. doi:10.3390/app15074049. [Google Scholar] [CrossRef]
4. De Giorgi MG, Menga N, Mothakani A, Ficarella A. A data-driven approach for health status assessment and remaining useful life prediction of aero-engine. J Phys: Conf Ser. 2023;2526(1):012071. doi:10.1088/1742-6596/2526/1/012071. [Google Scholar] [CrossRef]
5. Shan N, Xu X, Bao X, Xu C, Cui F, Xu W. Health status prediction for nonstationary systems based on feature decoupling of time series. IEEE Trans Instrum Meas. 2025;74(4):3526911. doi:10.1109/TIM.2025.3550624. [Google Scholar] [CrossRef]
6. Szrama S, Lodygowski T. Turbofan engine health status prediction with artificial neural network. Aviat. 2024;28(4):225–34. doi:10.3846/aviation.2024.22554. [Google Scholar] [CrossRef]
7. Duan Y, Cao X, Zhao J, Xu X. Health indicator construction and status assessment of rotating machinery by spatio-temporal fusion of multi-domain mixed features. Measurement. 2022;205(5):112170. doi:10.1016/j.measurement.2022.112170. [Google Scholar] [CrossRef]
8. Szrama S, Lodygowski T. Aircraft engine remaining useful life prediction using neural networks and real-life engine operational data. Adv Eng Softw. 2024;192(11):103645. doi:10.1016/j.advengsoft.2024.103645. [Google Scholar] [CrossRef]
9. Zhou L, Wang H. An adaptive multi-scale feature fusion and adaptive mixture-of-experts multi-task model for industrial equipment health status assessment and remaining useful life prediction. Reliab Eng Syst Saf. 2024;248:110190. doi:10.1016/j.ress.2024.110190. [Google Scholar] [CrossRef]
10. Wang F, Tang S, Li L, Sun X, Yu C, Si X. Remaining useful life prediction of aero-engines based on random-coefficient regression model considering random failure threshold. J Syst Eng Electron. 2023;34(2):530–42. doi:10.23919/JSEE.2023.000042. [Google Scholar] [CrossRef]
11. García Nieto PJ, García-Gonzalo E, Sánchez Lasheras F, de Cos Juez FJ. Hybrid PSO-SVM-based method for forecasting of the remaining useful life for aircraft engines and evaluation of its reliability. Reliab Eng Syst Saf. 2015;138(7):219–31. doi:10.1016/j.ress.2015.02.001. [Google Scholar] [CrossRef]
12. Szrama S. Turbofan engine health status prediction with neural network pattern recognition and automated feature engineering. Aircr Eng Aerosp Technol. 2024;96(11):19–26. doi:10.1108/aeat-04-2024-0111. [Google Scholar] [CrossRef]
13. Wan A, Zhang H, Chen T, Al-Bukhaiti K, Wang W, Wang J, et al. Aeroengine life prediction and status evaluation based on sequential multitask learning and health indicators. IEEE Trans Reliab. 2025;74(3):3833–46. doi:10.1109/TR.2025.3535716. [Google Scholar] [CrossRef]
14. Jose A, Shrivastava S. An analytical examination of the performance assessment of CNN-LSTM architectures for state-of-health evaluation of lithium-ion batteries. Results Eng. 2025;27(1):105825. doi:10.1016/j.rineng.2025.105825. [Google Scholar] [CrossRef]
15. Zhang Y, Xin Y, Liu ZW, Chi M, Ma G. Health status assessment and remaining useful life prediction of aero-engine based on BiGRU and MMoE. Reliab Eng Syst Saf. 2022;220(2):108263. doi:10.1016/j.ress.2021.108263. [Google Scholar] [CrossRef]
16. Zhang W. An explainable artificial intelligence framework for analyzing health degradation of aero-engines. Artif Intell Robot Res. 2025;14(1):1–13. doi:10.12677/airr.2025.141001. [Google Scholar] [CrossRef]
17. Wang L, Zhao X, Pham H. Novel formulations and metaheuristic algorithms for predictive maintenance of aircraft engines with remaining useful life prediction. Reliab Eng Syst Saf. 2025;261(3):111064. doi:10.1016/j.ress.2025.111064. [Google Scholar] [CrossRef]
18. Szrama S. Engine health status prediction based on oil analysis with augmented machine learning algorithms. Tribol Ind. 2024;46(4):624–38. doi:10.24874/ti.1736.08.24.09. [Google Scholar] [CrossRef]
19. Rahim MA, Rahman MM, Islam MS, Muzahid AJM, Rahman MA, Ramasamy D. Deep learning-based vehicular engine health monitoring system utilising a hybrid convolutional neural network/bidirectional gated recurrent unit. Expert Syst Appl. 2024;257(3):125080. doi:10.1016/j.eswa.2024.125080. [Google Scholar] [CrossRef]
20. Musa G, Alrashed M, Muhammad NM. Development of big data lean optimisation using different control mode for Gas Turbine engine health monitoring. Energy Rep. 2021;7(5):4872–81. doi:10.1016/j.egyr.2021.07.071. [Google Scholar] [CrossRef]
21. Liu Z, Zhang C, Dong E, Wang R, Li S, Han Y. Research progress and development trend of prognostics and health management key technologies for equipment diesel engine. Processes. 2023;11(7):1972. doi:10.3390/pr11071972. [Google Scholar] [CrossRef]
Cite This Article
 Copyright © 2026 The Author(s). Published by Tech Science Press.
This work is licensed under a Creative Commons Attribution 4.0 International License , which permits unrestricted use, distribution, and reproduction in any medium, provided the original work is properly cited.
 Downloads
 Citation Tools