
 Submit a Paper
 Propose a Special lssue
 Open Access
ARTICLE

A Robust Design Method for Low-Pressure Die Casting Process Based on Surrogate Models
1 School of Mechanical and Vehicle Engineering, Chongqing Jiaotong University, Chongqing, China
2 Materials Bigdata and Applications Division, Materials Academy Jitri, Suzhou, China
* Corresponding Authors: Zhenfei Zhan. Email: ; Yutong Yang. Email:
Computers, Materials & Continua 2026, 87(3), 36 https://doi.org/10.32604/cmc.2026.077966
Received 20 December 2025; Accepted 28 February 2026; Issue published 09 April 2026
 View Full Text
 Download PDF
Abstract
The batch-to-batch variability in low-pressure die casting (LPDC), caused by inherent process parameter fluctuations, poses a significant challenge to consistent quality. However, traditional single-point optimization methods ignore parameter fluctuations. This study presents a robust design framework to overcome this limitation. First, an integrated simulation workflow was established by coupling ProCAST casting simulation with Abaqus finite element analysis to predict shrinkage pore volume and load-bearing capacity (LBC). Subsequently, a dataset was constructed from the integrated simulations, and then served to develop a surrogate model using the Extreme Gradient Boosting algorithm. Finally, robust process windows were derived via an inverse search employing the swarm intelligence algorithm. The framework is implemented with a case study on A356 aluminum-alloy wheel casting. The results showed that the surrogate model for defect regression and LBC prediction has high prediction accuracy. SHapley Additive exPlanations analysis identified the interfacial heat-transfer coefficient and half-mold temperature as the dominant factors. Three optimization algorithms, Bayesian-optimized Particle Swarm Optimization (BO-PSO), Bayesian-optimized Genetic Algorithm (BO-GA), and Logistic-Chaos Sparrow Search Algorithm (LCSSA) were evaluated. LCSSA consistently identifies robust process windows satisfying both defect-control and LBC requirements across all target levels, whereas BO-PSO exhibits premature convergence at higher targets and BO-GA yields dispersed solutions with insufficient robustness. The proposed framework provides a systematic methodology for robust process-window design in LPDC applications.Keywords
Cast aluminum alloys, valued for high specific strength, formability, and mature manufacturability, are widely used in automotive and aerospace structures (e.g., engine blocks, chassis members, and tail assemblies), with low-pressure die casting (LPDC) serving as a key route for high-performance, complex components [1–4]. However, LPDC is intrinsically a multiphysics process [5,6]; variations in equipment condition, operator practice, and ambient parameters perturb process variables (e.g., pouring and mold temperatures) [7,8], altering solidification behavior and cooling rates, and ultimately inducing batch-to-batch variability in mechanical properties and service performance [8,9]. To address this challenge, a robust process-parameter design approach is required that quantitatively links process parameters to defect formation and mechanical response, thereby enabling the identification of robust parameter windows that maintain consistent performance under realistic process fluctuations.
Performance variability in cast aluminum-alloy structural components primarily stems from fluctuations in process parameters that alter local cooling conditions, producing spatially non-uniform defects and microstructures [10]. Product performance is especially sensitive to casting defects, which are governed by both total porosity and the maximum size of individual defects; when porosity or defect-size thresholds are exceeded, the casting is typically rejected [11–13]. Microstructural metrics such as secondary dendrite arm spacing also influence mechanical response, with their evolution controlled by the cooling rate [14–16]. Because the cooling rate is highly sensitive to pouring temperature, mold temperature, and the interfacial heat-transfer coefficient, it is necessary to quantify the relationships among process parameters, cooling behavior, defect formation and microstructural evolution, and mechanical properties. Data-driven predictive models must then be established to enable reliable performance evaluation under process fluctuations [17,18].
In parallel, optimization of casting process parameters has been widely explored through design-of-experiments (DOE)-based Taguchi studies and simulation-assisted approaches, which have contributed to quality improvement and defect control [19]. Taguchi methods have been successfully applied to identify influential variables and optimal settings across various casting processes. For example, Karthik et al. [20] applied a Taguchi L9 orthogonal array to squeeze casting of AA2219 and achieved improvements in hardness and density; Pattnaik et al. [21] achieved multi-objective optimization of linear shrinkage, surface roughness, and penetration in investment casting; and Kuo et al. [22] identified mold-cavity temperature as the principal driver of tensile strength in vacuum casting of acrylonitrile butadiene styrene (ABS).In the context of LPDC, simulation-assisted approaches have also been adopted. Wang et al. [23] employed ProCAST simulations to optimize ZL205A castings, demonstrating that increased packing pressure suppresses shrinkage porosity. Dong et al. [24] integrated process modeling with shop-floor trials for A356 wheel hubs, achieving defect suppression and improved mechanical properties through optimized holding and cooling schedules. However, these traditional approaches face inherent limitations. DOE-based methods rely on discrete experimental designs with limited sampling of the parameter space, while simulation-assisted optimization requires computationally intensive modeling efforts. Consequently, both approaches exhibit limited global-search efficiency and struggle to systematically explore the full process-parameter space, particularly for robust design applications involving process fluctuations.
In response to the limitations of traditional approaches, machine learning (ML)-based intelligent modeling and data-driven optimization have been increasingly explored in casting [25]. Wu et al. [26] developed a multi-stage process parameter optimization framework for high-pressure die casting (HPDC) oil-circuit boards: a multiple linear regression (MLR) surrogate was trained on computer-aided engineering (CAE) simulation data to map process parameters to porosity, and a particle swarm optimization (PSO) algorithm then performed global search, outperforming the Taguchi baseline in reducing shrinkage porosity. Gupta et al. [27] combined a fuzzy-logic model (FLM) built from a Taguchi L18 design with a genetic algorithm (GA) to optimize A380 pressure die-casting parameters; using the FLM as the GA fitness function effectively lowered defect rates and improved process stability relative to Taguchi alone. Tian et al. [28] addressed warpage of DD6 superalloy turbine-blade platforms using a hybrid strategy combining a back-propagation neural network (BPNN) and a GA. The parameter–deformation relationship was learned from simulation data by the BPNN, and the global search was performed by the GA, resulting in notable suppression of platform warpage and improved dimensional accuracy.
A common challenge in surrogate-based optimization is the requirement for sufficiently large training datasets to ensure reliable predictions across diverse operating conditions. However, the aforementioned works are based on relatively small simulation or experimental samples, which may compromise surrogate model accuracy and limit out-of-domain generalization. To address small-sample issues, ensemble learning methods have been explored to improve prediction accuracy and robustness [29]. In addition to single-objective optimization, multiple quality indicators have been predicted by hybrid neural networks trained on ProCAST data, and GA-based multi-objective optimization for defect-free thin-wall casting has been enabled [30]. In parallel, Yang et al. [31] integrated multi-attribute decision making (MADM) with the Taguchi method for A356 sand casting, computing a comprehensive quality score using several MADM schemes to determine the optimal process-parameter combination. Despite these advances, whether in single-objective or multi-objective optimization frameworks, existing studies predominantly yield a single “optimal” point, representing the ideal solution under nominal conditions. However, process parameters are susceptible to inherent fluctuations in actual factory production, which may cause the identified optimal point to deviate from its theoretical performance, thereby compromising casting quality and process stability. Although some robust-optimization studies account for process-parameter fluctuations in casting performance [32], it is still difficult to identify and delineate the multidimensional feasible-solution region in complex process spaces. To address the challenges above, this study proposes a data-driven intelligent optimization framework that integrates machine-learning-based surrogate models with enhanced swarm-intelligence algorithms. The framework shifts the traditional “search-for-optimum” approach toward a “search-for-boundary” strategy, enabling the identification of robust multidimensional process windows. Taking the low-pressure die casting of A356 aluminum-alloy wheels as a case study, numerical simulations were first performed under various process-parameter combinations to obtain data on maximum shrinkage-pore volume and load-bearing capacity (LBC). Based on these data, a defect-regression model and an LBC prediction model were constructed. Subsequently, three swarm-intelligence algorithms were employed to identify parameter sets that simultaneously achieve defect control and meet mechanical-performance requirements: Bayesian-optimized Particle Swarm Optimization (BO-PSO), Bayesian-optimized Genetic Algorithm (BO-GA), and Logistic-Chaos Sparrow Search Algorithm (LCSSA). By synthesizing the solution distributions produced by different algorithms and applying interquartile-range filtering, a robust multidimensional process window balancing mechanical strength and casting quality was determined.
Firstly, an integrated simulation workflow was employed to predict the distribution of casting defects and the LBC of wheels. To obtain a representative dataset, upper-mold temperature, left and right half-mold temperatures, bottom-mold temperature, and interfacial heat transfer coefficient (IHTC) were selected as key process parameters, and a full-factorial DOE comprising 81 simulation groups was conducted. Casting simulations were conducted in ProCAST to obtain critical indicators, such as solidification time, maximum shrinkage-pore volume, and total porosity volume. Cases with excessive total porosity volume were excluded from further analysis, while cases with acceptable porosity levels were further evaluated based on maximum shrinkage-pore volume to assess suitability for structural simulation. Cases satisfying both screening criteria were subsequently mapped into an Abaqus FE model to perform static structural analysis, thereby yielding the corresponding LBC data.
Secondly, based on the simulation dataset obtained above, two surrogate models were developed. For all simulation cases, a defect-regression model was first established to predict the maximum shrinkage-pore volume from ProCAST simulation data, and qualification was subsequently determined according to relevant standards based on the predicted shrinkage-pore volume. Only the qualified cases that met the standards were mapped into Abaqus FE models to perform structural analysis, and based on these mechanical simulation results, an LBC-prediction surrogate model was developed to efficiently evaluate the structural load-bearing performance.
Thirdly, an inverse optimization framework was developed to identify robust process-parameter windows that satisfy both load-bearing capacity and defect criteria. A load-bearing capacity threshold was first established in the LBC prediction model. Subsequently, three swarm-intelligence algorithms were introduced for inverse search: BO-PSO, BO-GA, and LCSSA. Each algorithm was employed to generate candidate parameter sets that satisfied the load-bearing performance threshold. The process-parameter sets obtained from different algorithms were then evaluated using the defect-regression model to exclude combinations with predicted shrinkage-pore volume exceeding the defect threshold. To mitigate the influence of outliers and algorithm-specific search bias, box-plot analysis was performed on the parameter distributions, and the interquartile range (IQR, 25th–75th percentile) was selected as the final optimized process window.
Finally, verification simulations using ProCAST and Abaqus were conducted to evaluate whether the optimized process windows obtained by each algorithm satisfied both the defect and LBC criteria. Based on these results, the comparative performance of the algorithms was assessed and the robust multidimensional process window was determined. The overall technical route of this study is illustrated in Fig. 1.
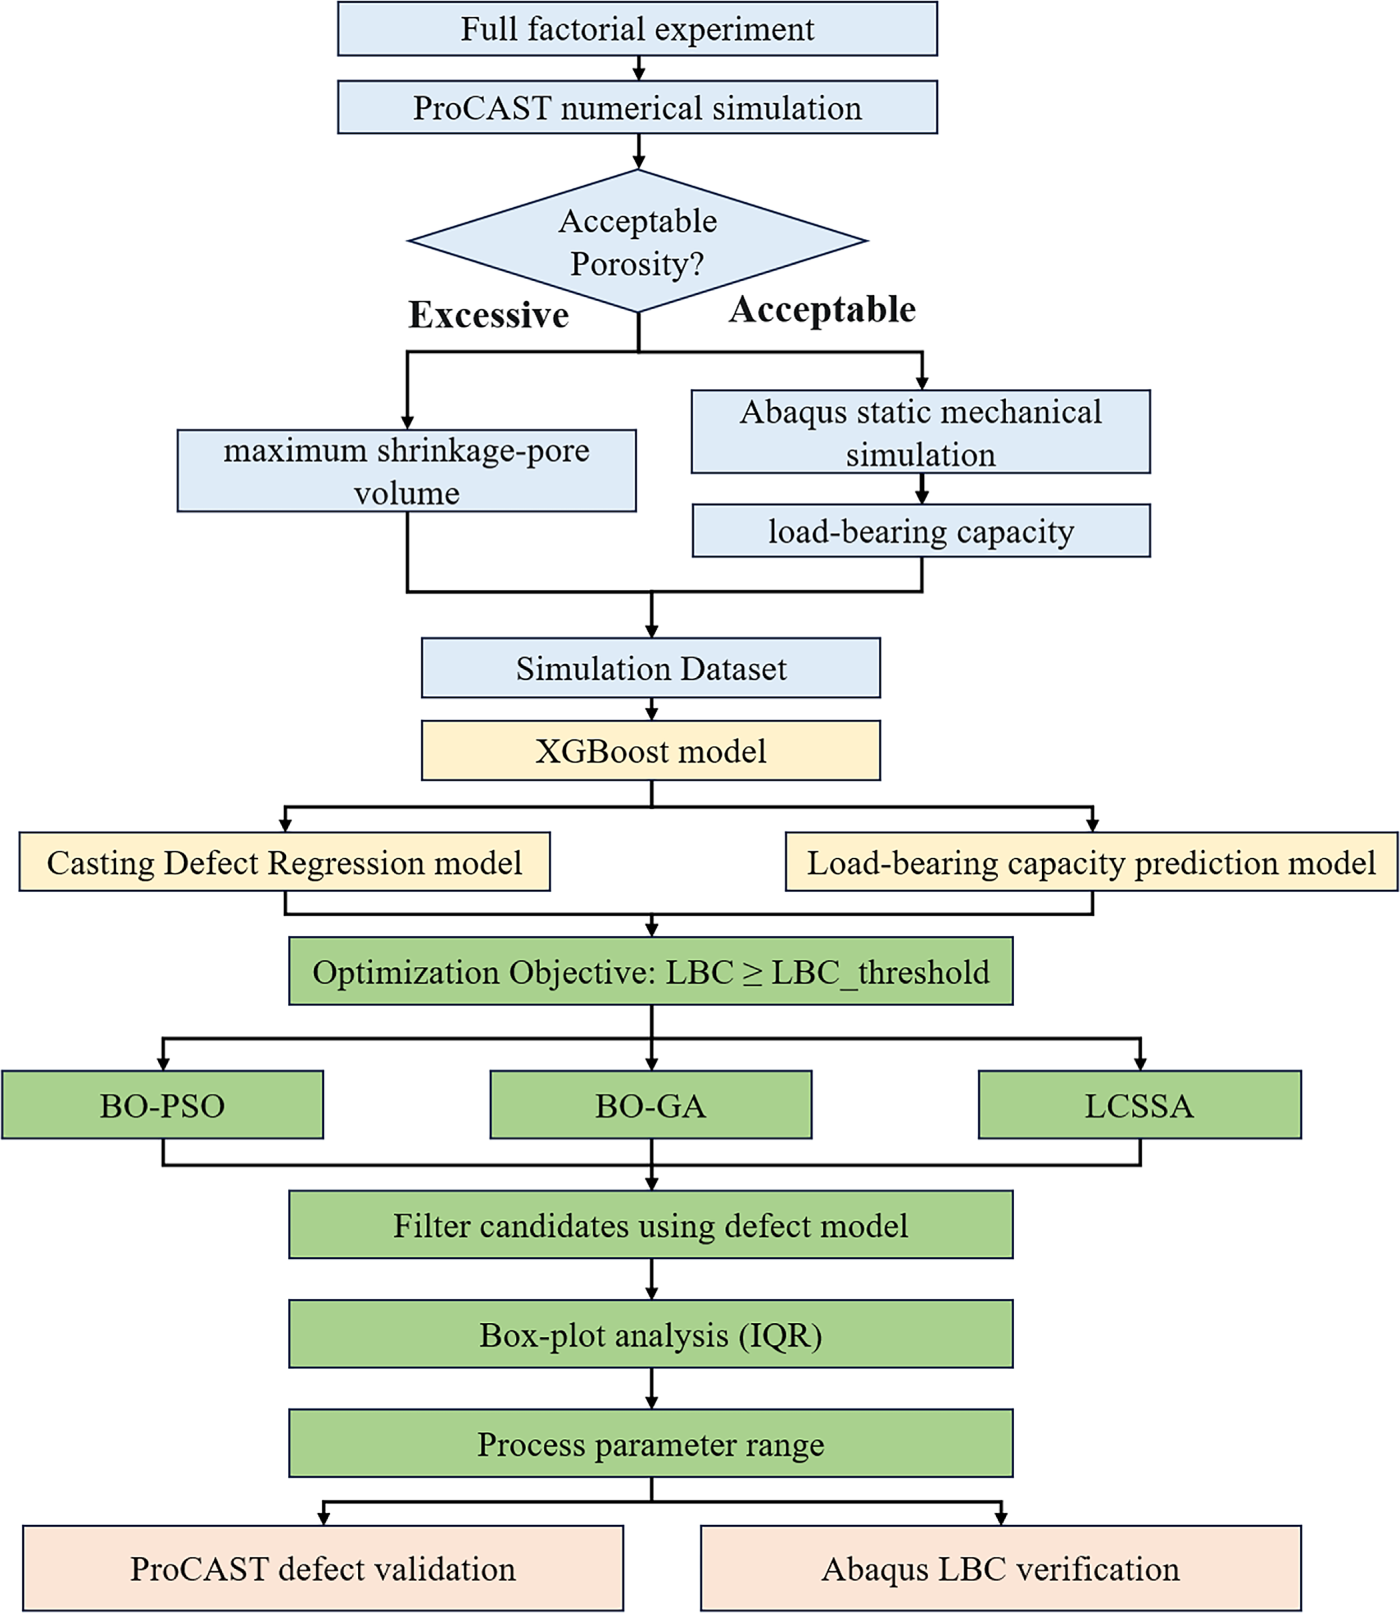
Figure 1: Technical route diagram.
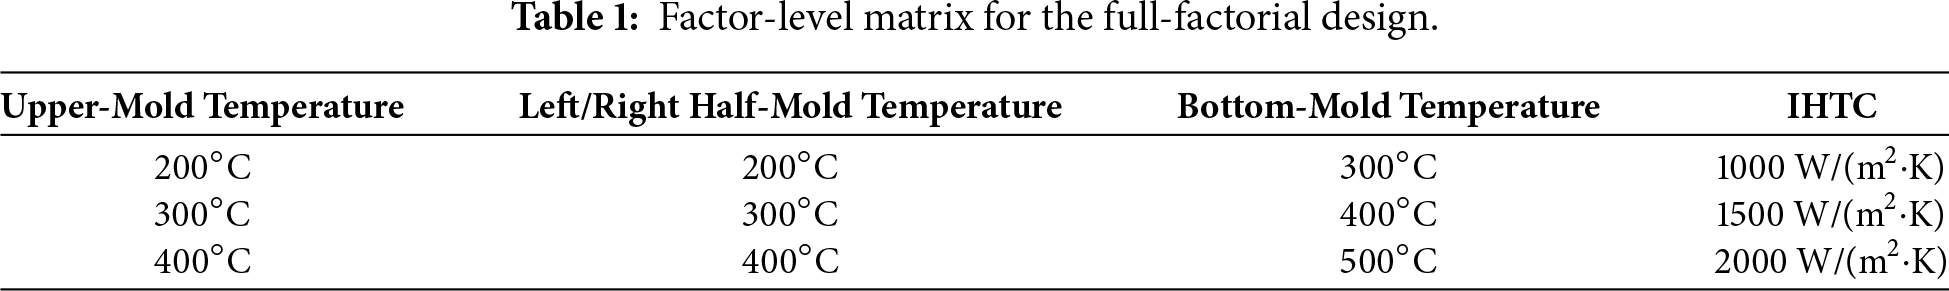
In the experimental design, the pouring temperature was fixed at 710°C and not treated as a decision variable. Four factors were used: upper-mold temperature, left and right half-mold temperature, bottom-mold temperature, and IHTC between the cavity and melt. A full-factorial DOE with three levels per factor (Table 1) yielded 81 simulation runs.
2.2.2 LPDC Simulation of an Aluminum-Alloy Wheel
The 3D model of the wheel casting is shown in Fig. 2. The overall structure comprises the rim, rim edge, rim seat, and spokes, with a wheel diameter of 416 mm. The model’s total volume is 2,126,303.67 mm3. Based on the casting geometry and dimensions, the corresponding LPDC die was designed. The 3D die model, shown in Fig. 3, consists of the top die, left and right-side dies, bottom die, and the riser tube.
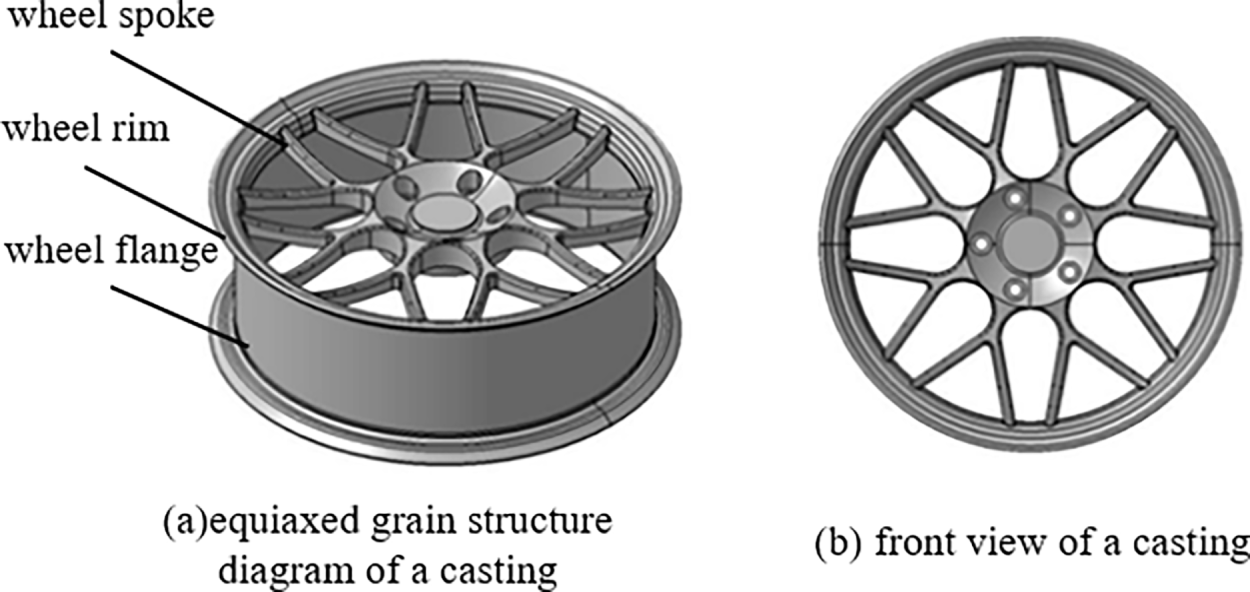
Figure 2: 3D model of the die-cast wheel.
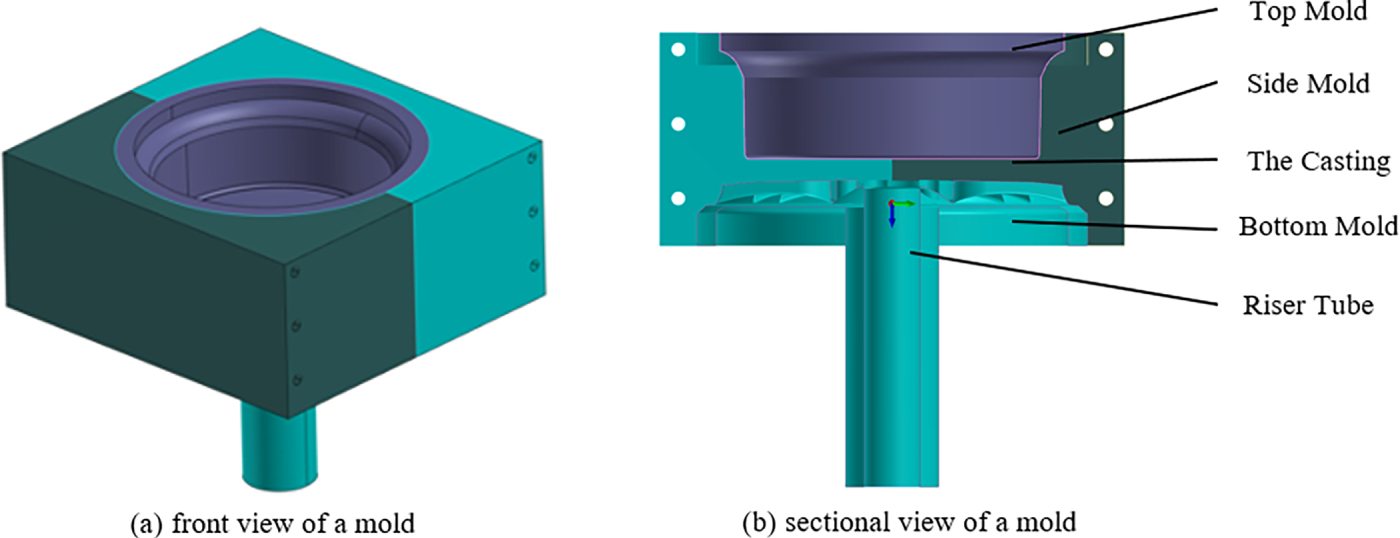
Figure 3: 3D model of the LPDC die.
In the ProCAST numerical simulation, the gravity direction was defined, heat-transfer boundary conditions were applied between the casting and the mold, and filling pressure was imposed at the inlet to simulate the filling and solidification behavior during the LPDC process. After the simulation, the post-processing module of ProCAST was used to extract information on shrinkage porosity formed during solidification, including the total porosity volume and the maximum shrinkage-pore volume. Fig. 4 illustrates typical simulation results. These parameters quantitatively characterize the internal quality and solidification-defect features of the wheel under different process conditions, providing essential input data for constructing the subsequent defect-regression model and performing process optimization.
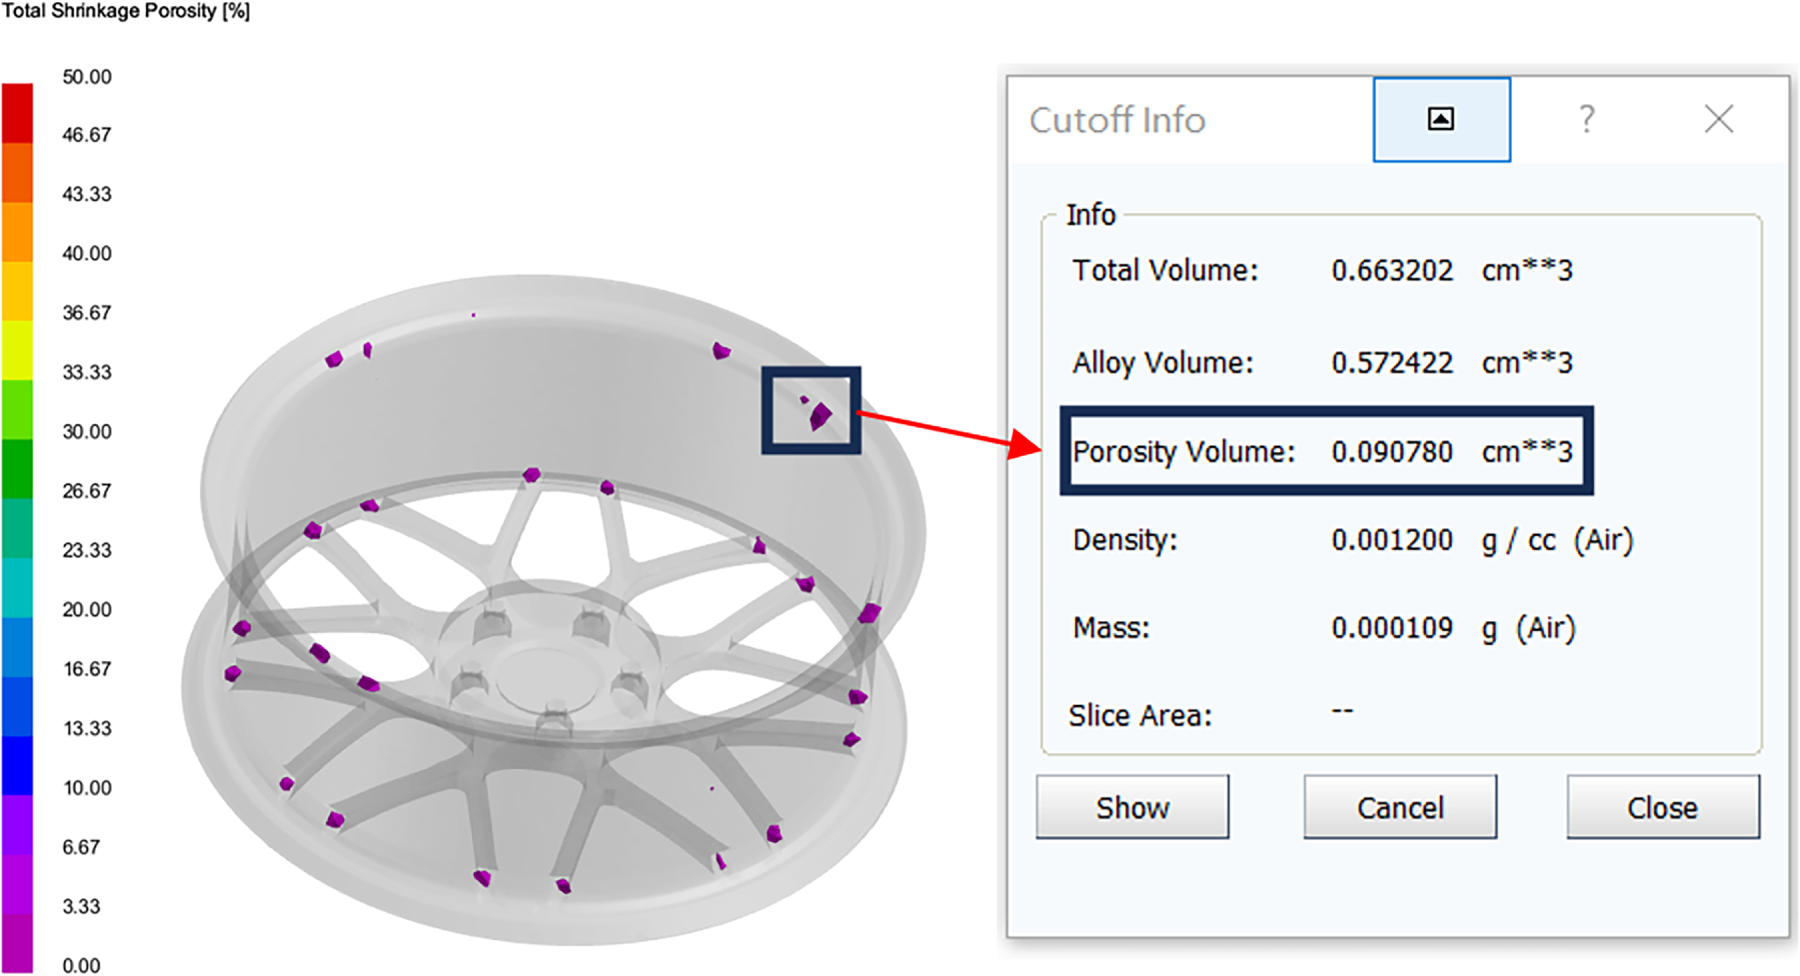
Figure 4: Extraction of maximum shrinkage-pore volume.
2.2.3 Static FE Analysis of the Wheel
Analysis of the casting simulation results revealed that, although the total porosity rate of all process-parameter combinations was below 1%, generally considered acceptable in casting practice, some cases still exhibited large individual shrinkage pores that act as stress concentrators and exert a significant influence on the mechanical performance and service reliability of the casting. Considering that acceptance criteria for porosity defects vary significantly across different casting applications, a threshold of maximum shrinkage-pore volume of 0.25 cm3 was established based on engineering judgment and the structural safety requirements of automotive wheels. Cases meeting this criterion were subjected to subsequent static structural simulations in Abaqus FE models, while cases exceeding this threshold were excluded.
Because ProCAST and Abaqus employ incompatible mesh systems, a data-mapping procedure was established to transfer solidification-based material properties. First, for simulation cases that passed defect screening, the solidification-time data at ProCAST nodes were extracted. Based on the empirical solidification-time–yield-strength relationship [33], each node’s solidification time was converted into the corresponding yield-strength value. Since Abaqus assigns material properties element-wise rather than node-wise, a nearest-neighbor interpolation algorithm was employed to map ProCAST node coordinates to Abaqus element-centroid coordinates. Through this mapping, each FE element in the Abaqus model was assigned the corresponding spatially varying yield strength, thereby establishing a wheel model with non-uniform mechanical properties. The detailed data-mapping procedure is illustrated in Fig. 5.
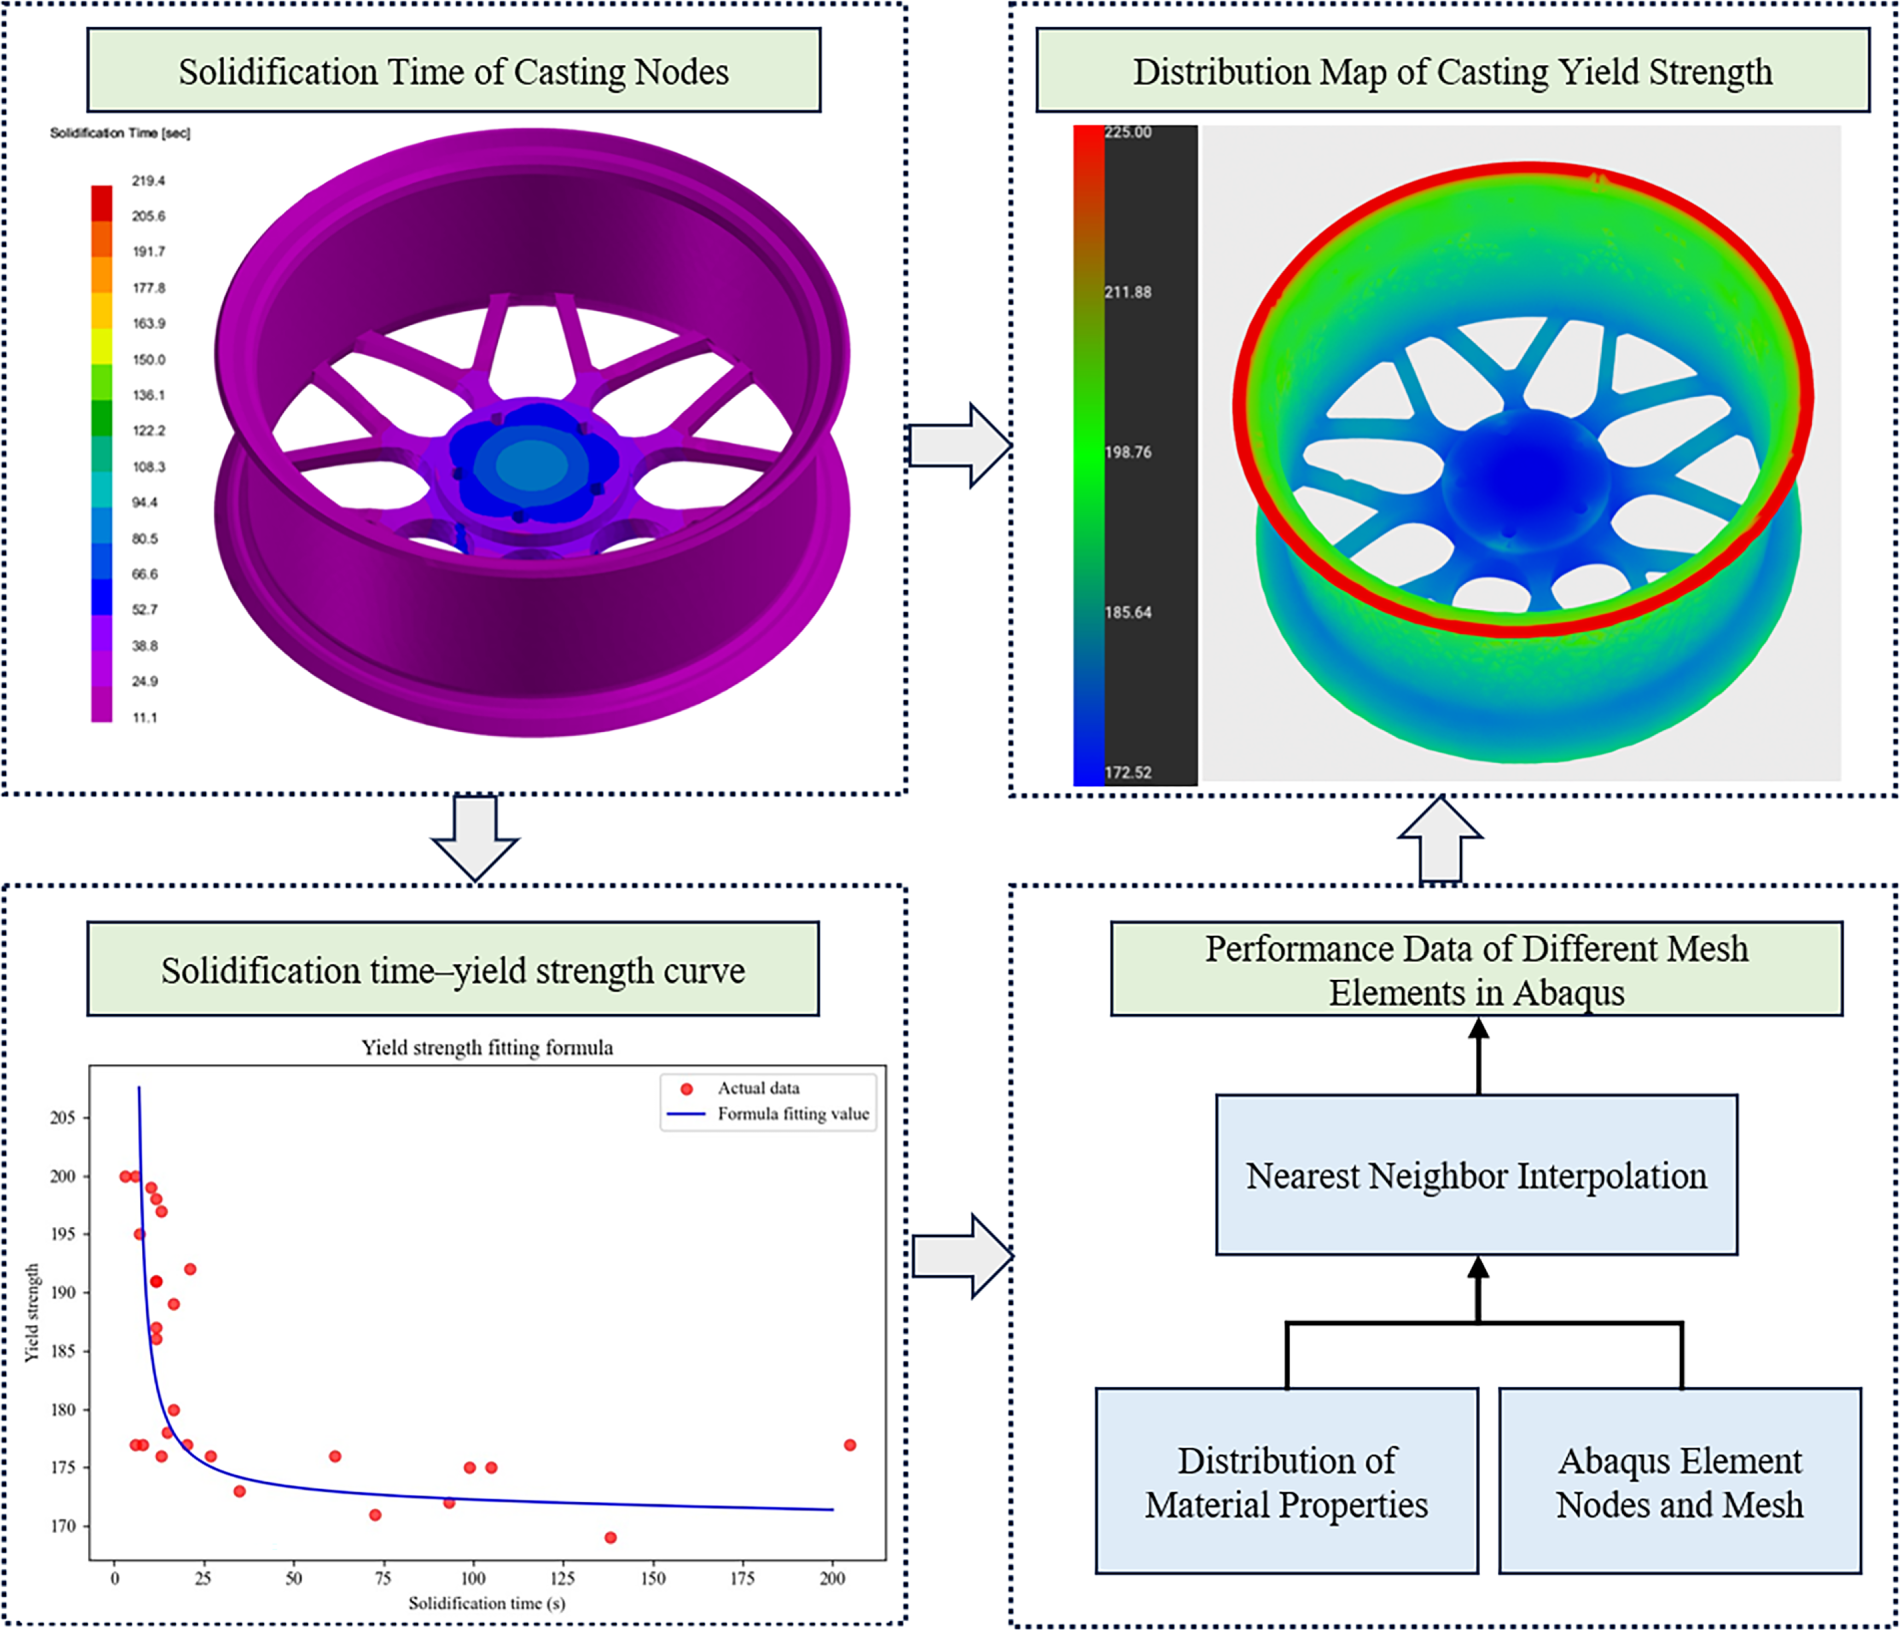
Figure 5: Material-property mapping workflow.
After completing the property assignment, static FE simulations were conducted to determine the load-bearing capacity of the wheel. During the simulation, the wheel was supported by a rigid foundation at the rim to represent actual boundary conditions, and a vertical load was applied at the hub center. The load was incrementally increased while monitoring the von Mises equivalent stress distribution throughout the entire wheel structure. The load was incrementally increased until the equivalent stress anywhere in the structure first reached the corresponding local yield strength, at which point the applied load was recorded as the ultimate LBC. The simulation setup is shown in Fig. 6a, while Fig. 6b illustrates the resulting stress distribution.
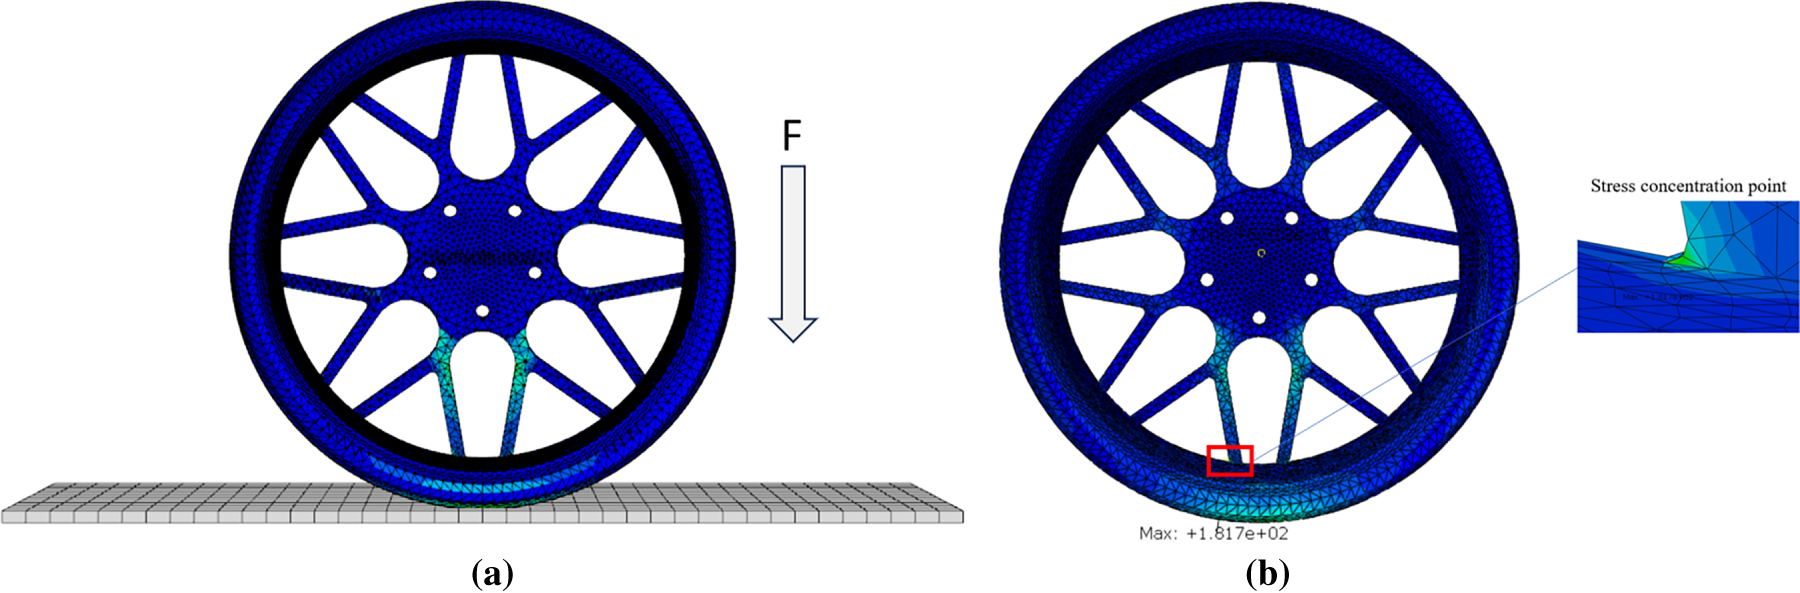
Figure 6: (a) Static FE simulation schematic; (b) stress concentration points of the wheel.
2.3 Surrogate Model Construction
2.3.1 Dataset Statistical Analysis
Prior to surrogate model development, exploratory data analysis was performed to examine the distribution characteristics and interdependencies within the dataset. A total of 81 numerical simulation cases were conducted, among which 19 cases exhibited excessively large individual shrinkage pores and were classified as unqualified. The distribution of maximum shrinkage-pore volume is presented in Fig. 7a. The histogram reveals a right-skewed distribution, with the majority of data concentrated in the range of 0.05–0.5 cm3. A few cases exhibit substantially larger shrinkage-pore volumes reaching approximately 1.4 cm3; these outliers correspond to mold temperature combinations that deviate significantly from practical production settings, resulting in severely disrupted solidification sequences and inadequate feeding. The distribution of load-bearing capacity is shown in Fig. 7b. The histogram, overlaid with a kernel density estimation (KDE) curve, demonstrates that the LBC values are distributed within the range of 10,500–11,100 N and follow an approximately normal distribution. The peak frequency occurs around 10,600–10,700 N, with the distribution exhibiting a slight right tail extending toward higher capacity values. No extreme outliers with disproportionately large deviations were identified, confirming the reliability and consistency of the simulation data for subsequent surrogate model development.
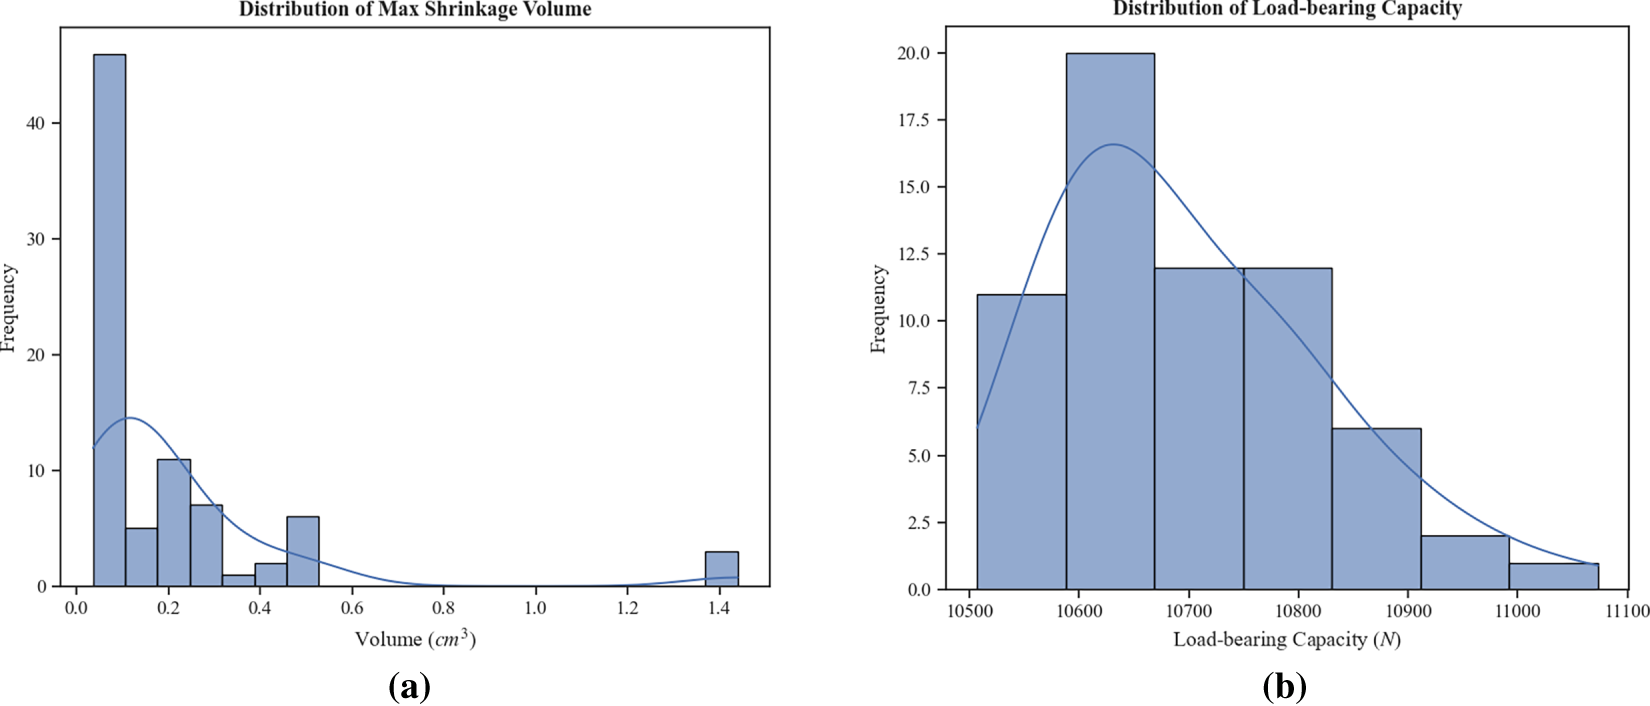
Figure 7: Distribution characteristics of target variables: (a) Maximum shrinkage-pore volume; (b) Load-bearing capacity.
To quantify the linear relationships among process parameters and target variables, Pearson correlation coefficient heatmaps were constructed for both the defect dataset and the load-bearing capacity dataset (Fig. 8). It should be noted that the Pearson correlation coefficient measures only linear relationships between variables, assuming that as an input parameter increases, the output changes proportionally. However, the actual relationships between process parameters and casting outcomes may involve complex nonlinear interactions. This limitation is precisely why XGBoost, a nonlinear ensemble learning algorithm, was employed for surrogate model development to capture these higher-order effects.
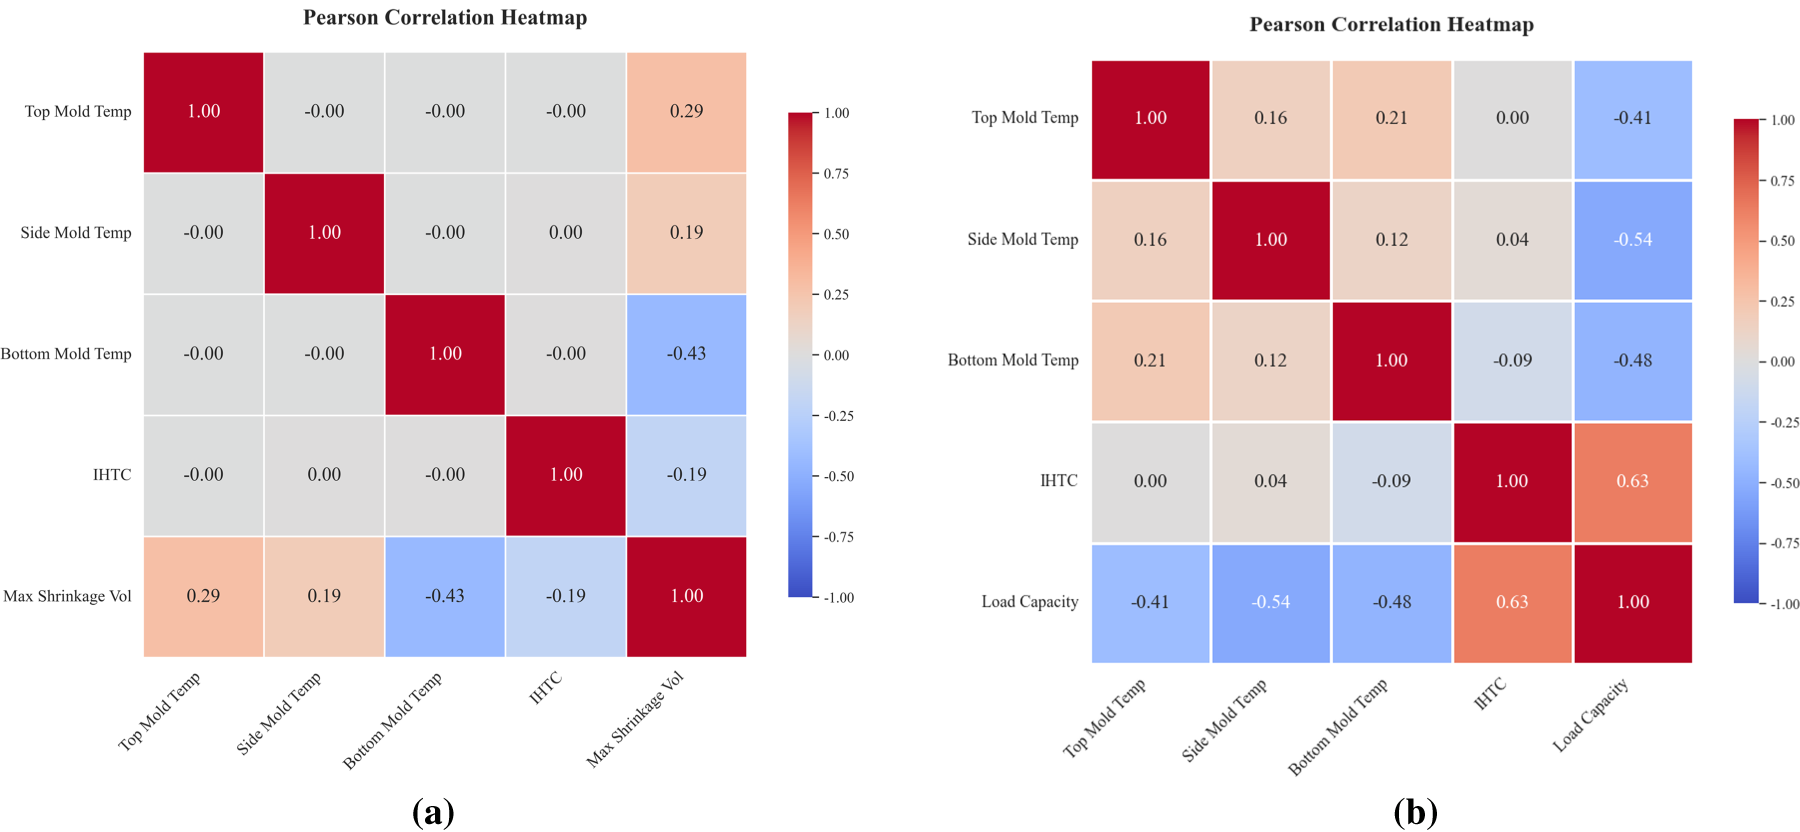
Figure 8: Pearson correlation coefficient heatmaps: (a) Defect dataset; (b) Load-bearing capacity dataset.
2.3.2 XGBoost-Based Casting Defect Regression Model
To enable rapid identification of shrinkage defects during the casting process, a defect-regression model was developed based on the numerical simulation dataset. The model inputs consisted of four key process parameters: upper-mold temperature, left and right half-mold temperatures, bottom-mold temperature, and IHTC. Additionally, a set of derived features was constructed based on physical reasoning to characterize mold-temperature distribution, including global mean temperature, thermal non-uniformity indices, directional spatial gradients, and dimensionless temperature ratios. Specifically, global mean temperature represents the overall thermal balance of the mold system; thermal non-uniformity indices comprise the standard deviation and range of mold temperatures across different zones; directional spatial gradients quantify the temperature differences between upper and lower molds; and dimensionless temperature ratios characterize the relative thermal relationships among mold components. The output was the maximum single shrinkage-pore volume, which served as the primary indicator for defect assessment. The Extreme Gradient Boosting (XGBoost) algorithm was employed to establish the regression model. Hyperparameters (including max_depth, learning_rate, n_estimators, subsample, and colsample_bytree) were first optimized via grid search, and the optimized model was then fitted to predict the maximum shrinkage-pore volume. Fivefold cross-validation was adopted to evaluate generalization performance. The overall technical workflow of the defect-regression model is illustrated in Fig. 9.
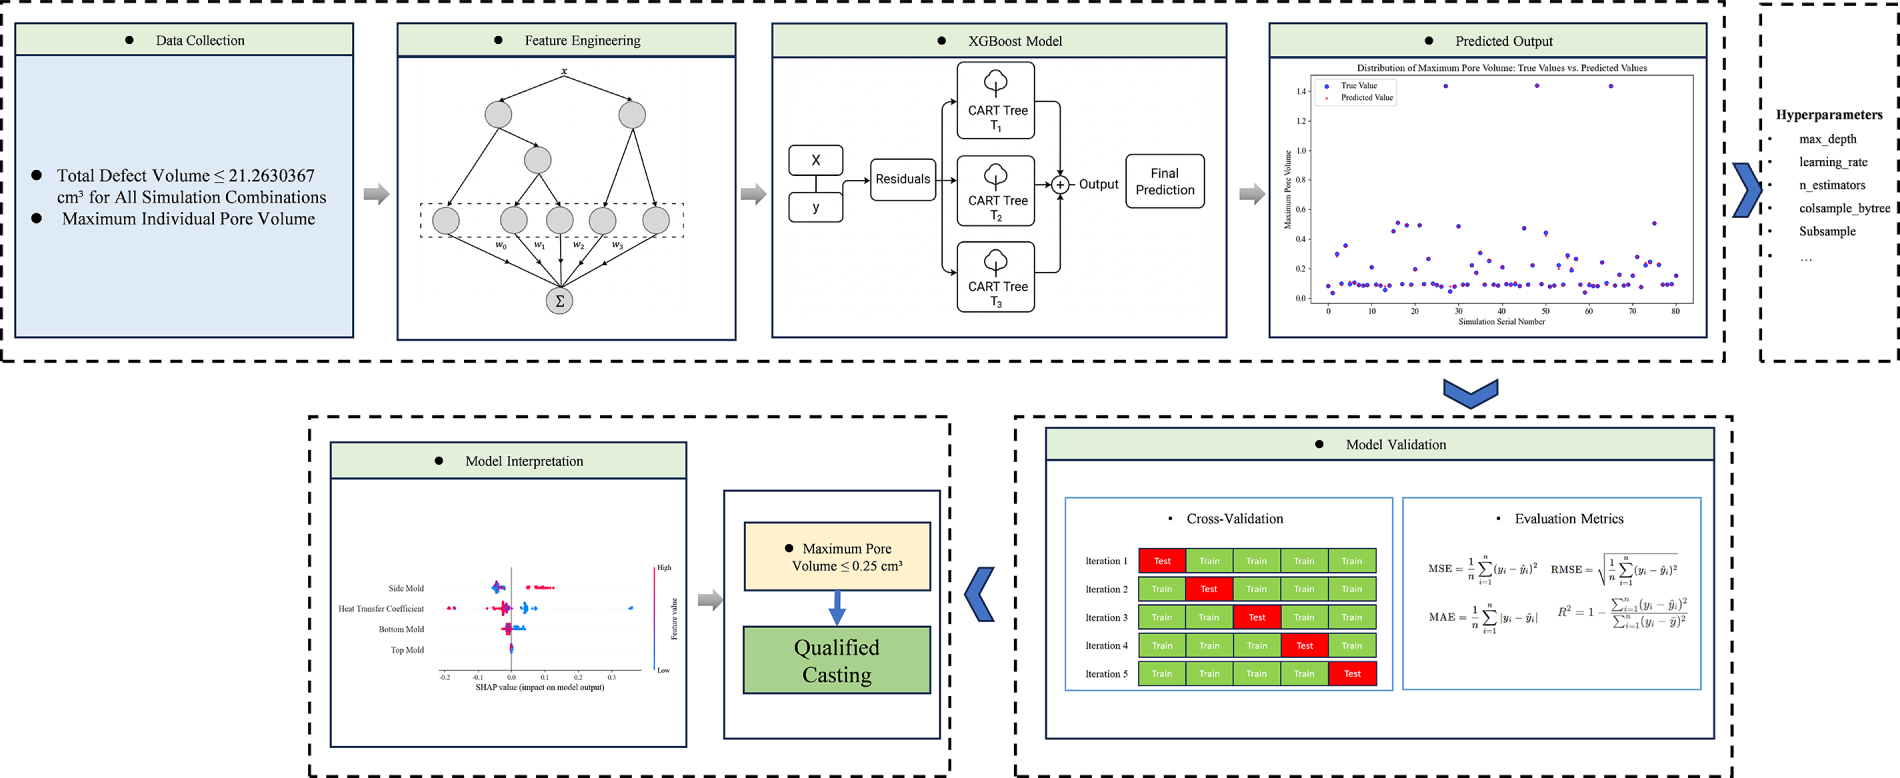
Figure 9: Technical workflow of the defect regression model.
2.3.3 XGBoost-Based Load-Bearing Capacity Prediction Model
The construction procedure of the LBC prediction model follows the same framework as the defect-regression model described above, with the primary difference lying in the target variable and input dataset. The model inputs consist of the same process parameters and derived temperature features, while the output is the LBC. Since cases with predicted shrinkage-pore volume exceeding the threshold are excluded from mechanical simulations, the LBC model is trained exclusively on simulation data from process-parameter sets that pass the defect screening. The model training procedure, including XGBoost algorithm, grid search hyperparameter optimization, and fivefold cross-validation, remains consistent with the defect-regression model. The detailed technical workflow is shown in Fig. 10.
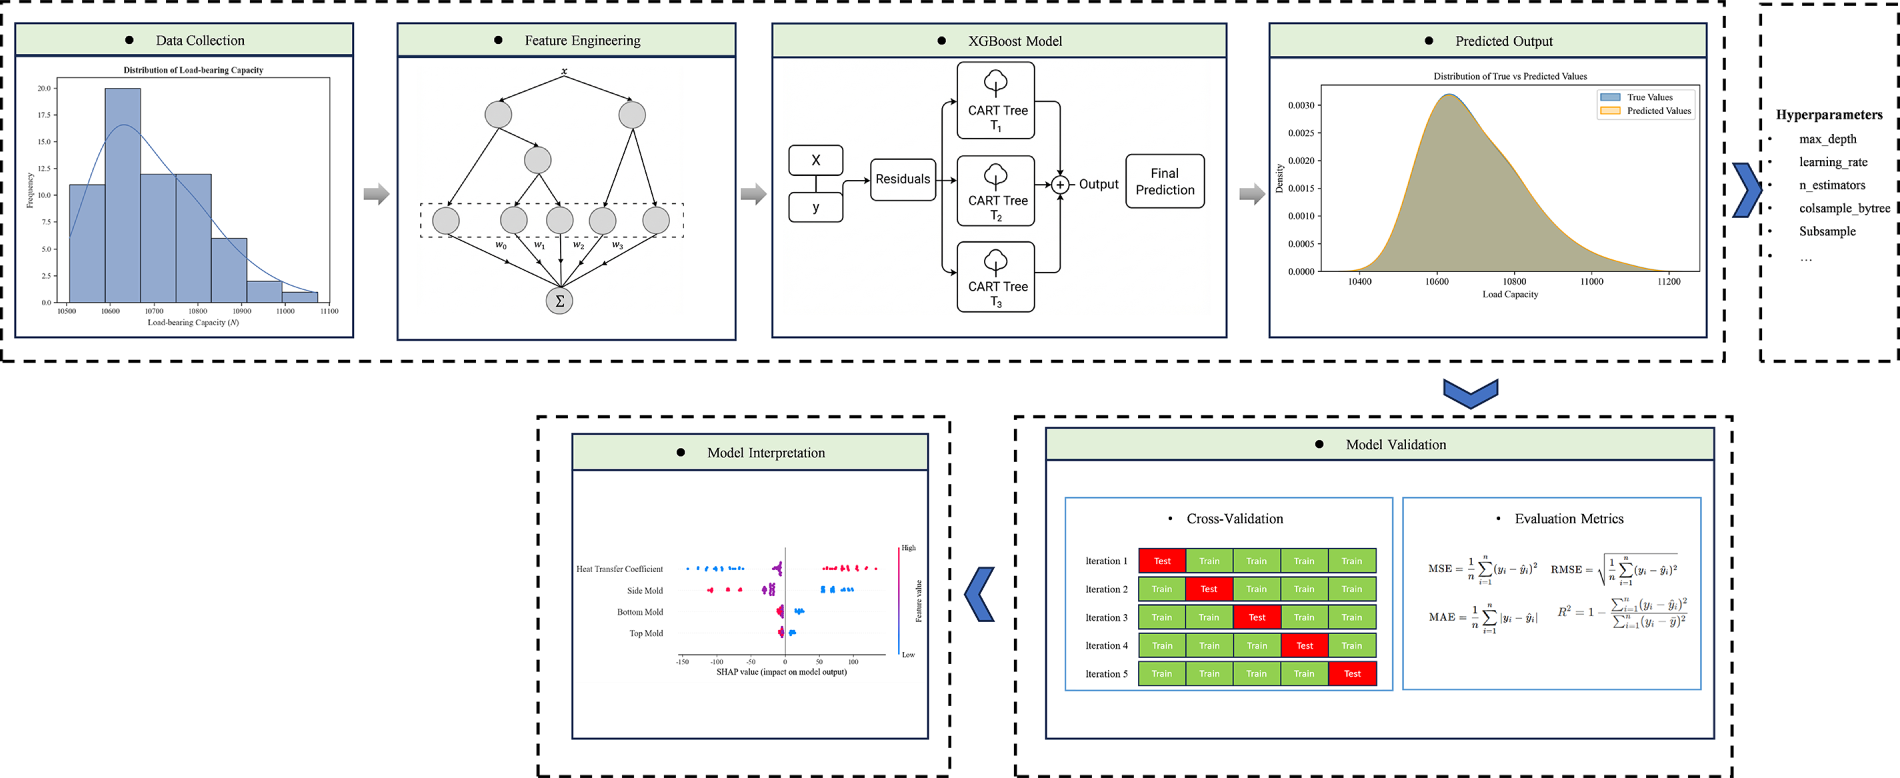
Figure 10: Technical workflow of the load-bearing capacity prediction model.
2.3.4 Model Evaluation Metrics and Interpretability
Firstly, fivefold cross-validation was adopted to assess generalization. The respective dataset for each model was partitioned into five folds, with four folds used for training and one for testing in rotation. Performance metrics were calculated as the mean and standard deviation across the five test folds. Secondly, the coefficient of determination (R2), mean squared error (MSE), root mean squared error (RMSE), and mean absolute error (MAE) were employed to quantify prediction accuracy and error dispersion. Predicted vs observed scatter plots and residual distributions were also examined to assess residual patterns and outlier sensitivity. Finally, interpretability was provided via SHAP applied to the trained XGBoost models, yielding global feature rankings and dependence profiles that elucidate how process variables influence the predicted maximum shrinkage-pore volume and LBC.
PSO is a population-based stochastic optimizer that searches for the global optimum by simulating information sharing and cooperative exploration among individuals in a swarm [34]. Each particle moves in a D-dimensional search space with a velocity and position updated by its personal best and the swarm’s global best. The update rules are:
In the above equations:
In particular, BO was introduced to tune the hyperparameters of the PSO algorithm. The BO algorithm constructs a probabilistic model of past evaluation results and dynamically recommends optimal hyperparameter combinations, thereby enhancing the global exploration capability of the search process while maintaining a fast convergence rate.
GA does not rely on gradient information of the objective function; hence it exhibits strong robustness and broad applicability to non-linear, non-differentiable, and highly multimodal optimization problems. Its basic workflow can be summarized as starting from a randomly initialized population of candidate solutions and iteratively performing selection, crossover, and mutation to generate a new population with higher fitness, until a termination criterion is satisfied [35]. Here is a concise, formal description of the GA iteration:
In the equations:
To enhance the performance of GA, Bayesian Optimization was employed to tune three hyperparameters—population size, crossover probability, and mutation probability.BO builds a probabilistic model of past evaluations and dynamically recommends near-optimal hyperparameter configurations, thereby improving global exploration while maintaining fast convergence.
LCSSA is a swarm-intelligence optimizer inspired by sparrows’ foraging and anti-predation behaviors. To overcome the tendency of the standard SSA to fall into local optima due to purely random initialization, LCSSA employs a logistic chaotic map to generate the initial population. This strategy markedly enhances population diversity and improves the quality of initial solutions, thereby strengthening global search capability and accelerating convergence [36].
In LCSSA, a high-quality initial population is first generated using a logistic chaotic map. The iterative mapping is
where:
Based on the chaotic sequence, the initial position of each sparrow (i.e., each candidate solution) in the population is generated by the following formula, ensuring a more uniform distribution over the search space:
where:
During the algorithm’s iterations, the discoverers are responsible for seeking food and providing the search direction for the entire swarm. Their position updates depend on the assessment of environmental safety, and the update equations are given as follows:
In the equations:
Joiners (followers) forage by following the discoverers, and their position-update strategy depends on their fitness. Joiners with poorer fitness (i.e., “hungrier” individuals) tend to fly to other regions to search for food, thereby enhancing exploration. Their position update equations are given as follows:
In the equations:
Scouts monitor the foraging area and issue alarms when danger is detected. Sparrows at the edge of the population are more susceptible to attack, whereas those near the center tend to move closer to companions to mitigate risk. Their position update equations are given as follows:
In the equations:
3.1 Casting Simulation Results
This section simulates the wheel casting process under different process-parameter conditions and compares the filling/solidification evolution and the defect distribution for two representative settings: Parameter Set 1: top/left–right half/bottom mold temperatures = 200°C/300°C/400°C, IHTC = 1000 W/(m2·K). Parameter Set 2: top/left–right half/bottom mold temperatures = 400°C/400°C/300°C, IHTC = 1000 W/(m2·K). The two cases are used to contrast filling stability, solidification paths, and the resulting shrinkage-porosity distribution.
3.1.1 Filling and Solidification Analysis
To examine the influence of process parameters on wheel casting, the solidification behavior of Parameter Set 1 and Set 2 was compared (Fig. 11). The results indicate that mold-temperature distribution markedly affects both filling flow and the solidification path. For Set 1, after the melt enters through the gate, it fills the runner and spoke regions, then merges along the outer rim. The filling exhibits relatively uniform flow patterns. Following filling, the casting solidifies in a progressive sequence from outside to inside and from top to bottom: the rim regions solidify first, and the final solidification zones localize near the spoke roots and the central hub. This sequential solidification promotes effective feeding, reducing shrinkage porosity formation. For Set 2, although filling remains stable, the solidification behavior differs significantly. The higher upper-mold and half-mold temperatures combined with a lower bottom-mold temperature generate a non-uniform thermal field: the bottom region solidifies prematurely, while the upper region cools more slowly. The solidification front thus propagates from bottom to top and from outside to inside simultaneously. This disrupts the feeding path, creating isolated liquid pockets in the upper central region, which increases shrinkage porosity, significantly affecting internal quality and structural integrity.
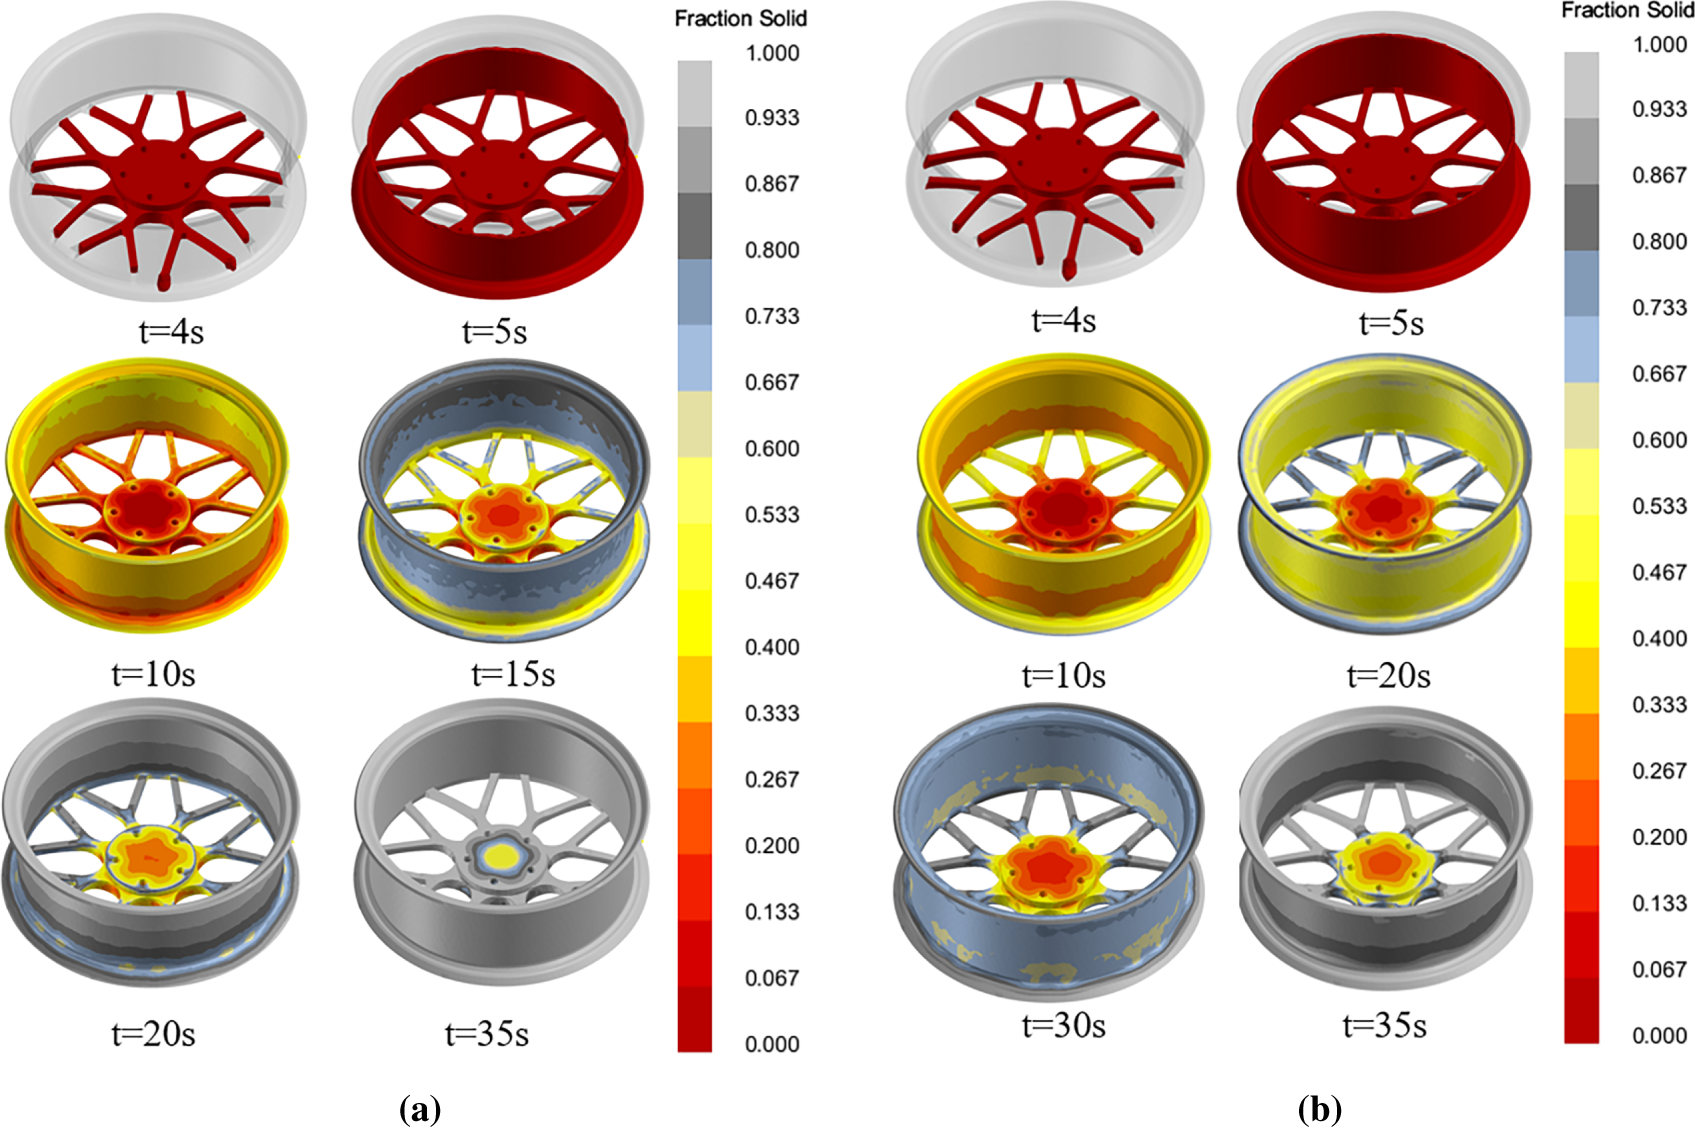
Figure 11: (a) Solidification process of casting—parameter Set 1; (b) solidification process of casting—parameter Set 2.
3.1.2 Analysis of Casting Defect Behavior
As shown in Fig. 12a, Parameter Set 1 produces few and very small shrinkage pores, mostly scattered in local hot-spot regions such as the junctions between the spokes and the rim. The defects are dispersed rather than forming continuous or concentrated large pores. Quantitatively, the total shrinkage-porosity volume is 5.81 cm3, and the maximum single-pore volume is only 0.0888 cm3. This indicates that, under this process configuration, solidification follows an orderly outside-to-inside and top-to-bottom sequence, so most of the volumetric shrinkage is effectively fed. Only minor micro-shrinkage appears in secondary hot spots where geometry is complex and heat transfer is limited. Such small, dispersed defects have a limited impact on overall mechanical performance, suggesting that Set 1 can yield dense microstructure and stable, qualified wheel castings. In contrast, as shown in Fig. 12b, Parameter Set 2 predicts significantly more numerous and much larger shrinkage pores with high spatial concentration. The defects are mainly located in the connection region between the spokes and the hub center, coinciding with the isolated liquid pocket identified in the solidification analysis. Quantitatively, the total defect volume reaches 10.48 cm3, and—more critically—the maximum single-pore volume is as large as 1.44 cm3. Such large, clustered defects markedly degrade internal density and can act as fatigue crack initiators, severely compromising load-bearing capacity and service safety. The root cause is the non-optimal mold-temperature distribution, which disrupts sequential solidification: feeding channels at the bottom close prematurely, leaving the upper-central region insufficiently fed at the end of solidification.
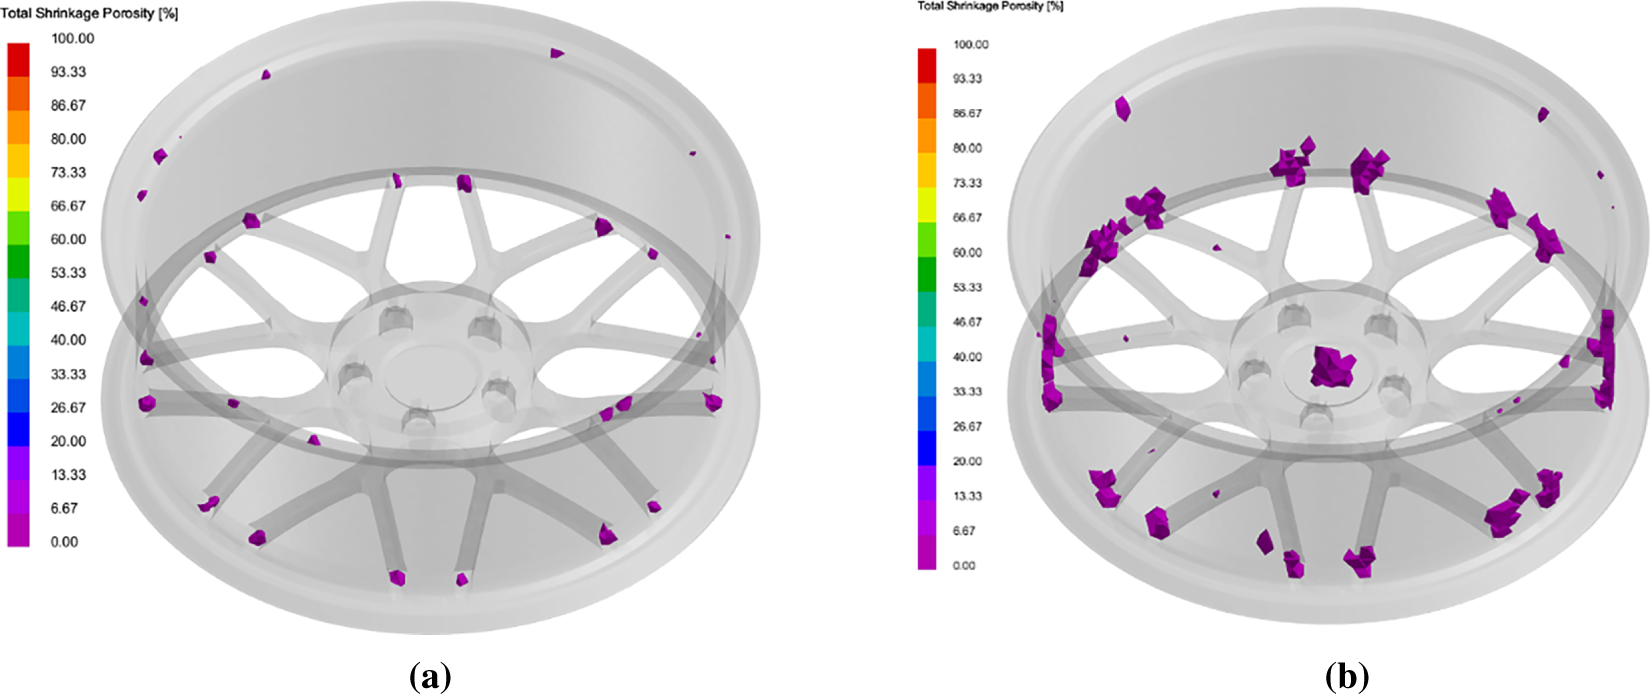
Figure 12: (a) Casting defect distribution—Parameter Set 1; (b) Casting defect distribution—Parameter Set 2.
3.2 Static Structural Simulation Results
Based on the casting-simulation results, the yield strength of Set 1 exhibits a reasonable graded distribution (Fig. 13a), ranging from 174–222 MPa. The outer rim attains the highest strength due to its thin wall and rapid cooling, which produce a fine dendritic structure; the spokes and inner rim show intermediate strength; and the hub mounting face, being a thick section and the last-to-solidify region, shows the lowest yield strength with coarser grains but relatively better toughness—favorable for bearing mounting and torsional loads. In contrast, Set 2 (Fig. 13b) yields an overall lower and more uniform strength distribution, with a maximum of only 186 MPa. This primarily stems from suboptimal mold-temperature settings that slow the cooling rate, preventing fine-grain strengthening. Meanwhile, macroscopic shrinkage at the spoke–hub junction induces stress concentration, leading to a pronounced reduction in the actual load-bearing capacity.
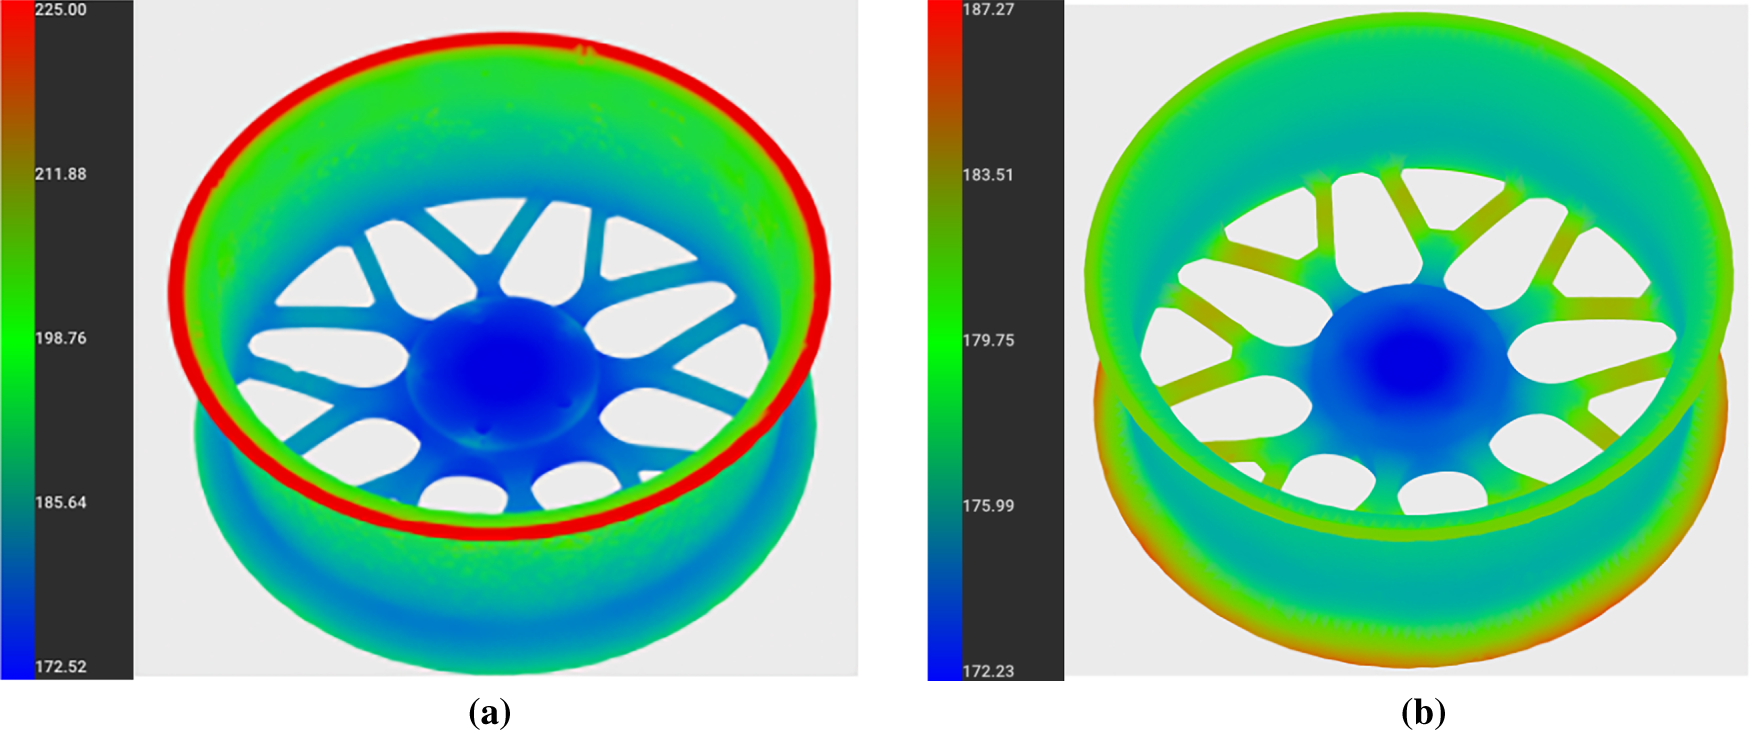
Figure 13: (a) 3D visualization of casting yield-strength distribution—Parameter Set 1; (b) 3D visualization of casting yield-strength distribution—Parameter Set 2.
Using the yield-strength cloud of Set 1 as the element-wise material property input, a static FE analysis was performed. Fig. 14 shows the von Mises equivalent stress under a vertical load. The failure criterion in this analysis is whether the local stress exceeds the local yield strength. This choice reflects the fact that the wheel, as a load-bearing component, is governed by its weakest links/stress concentration sites; local overloading may trigger crack initiation or structural damage, compromising the overall load-carrying function. Under the present loading, stresses concentrate mainly at the rim–spoke junctions and thin-wall zones along the outer rim. The local peak stress reaches 184.2 MPa, which exceeds the yield strength at that location. The material there enters plastic deformation, leading to local stiffness degradation and irreversible strain. These high-stress hot spots are likely to initiate local plastic yielding or fatigue cracks under further loading or long-term cyclic service, becoming the incipient sites of structural failure.
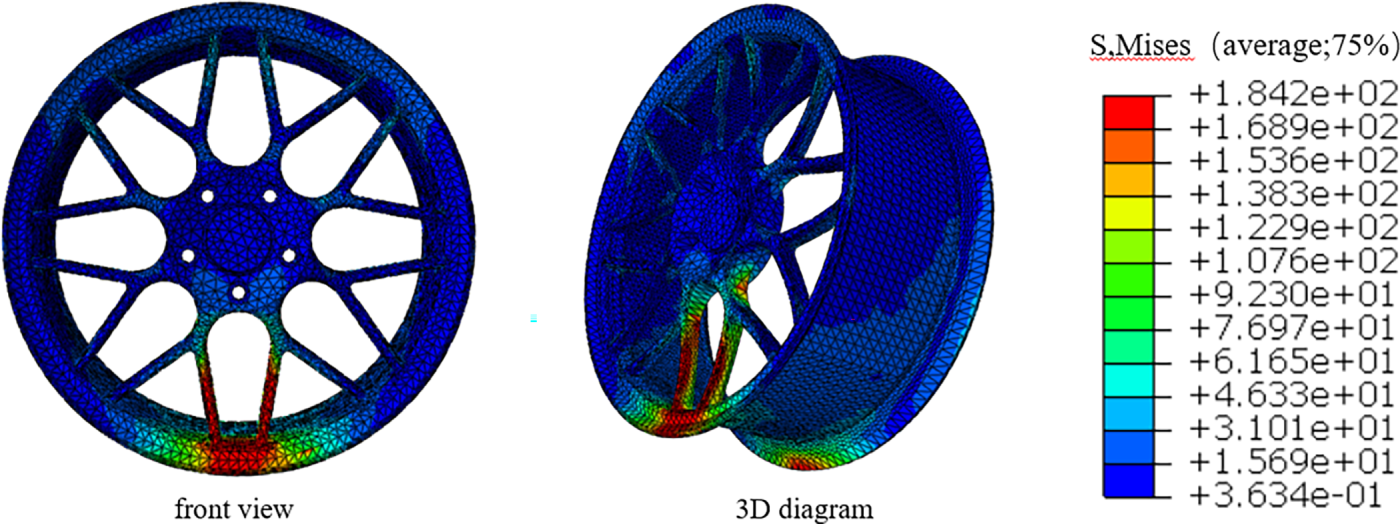
Figure 14: Static strength stress distribution of the wheel.
3.3 Results and Interpretation of the Surrogate Models
Building on the above casting and static FE simulations, a comprehensive dataset was constructed that includes key process parameters, shrinkage-pore volumes, and LBC. XGBoost was employed to develop two models: a defect- regression model and a LBC prediction model.
3.3.1 Results and Interpretation of the Defect Regression Model
As shown in Fig. 15, fivefold cross-validation results before and after hyperparameter tuning indicate that the optimized XGBoost model outperforms the baseline across all evaluation metrics. Specifically, R2 shows improvement, while MSE, RMSE, and MAE decrease, confirming that hyperparameter optimization effectively enhances both fitting accuracy and model stability. Fig. 16 presents a parity plot comparing the optimized model predictions with the ProCAST simulation results. The majority of data points cluster closely around the ideal y = x line, demonstrating strong agreement between predicted and simulated values across the entire data range. To evaluate classification performance, predicted shrinkage-pore volumes were mapped to pass/fail labels based on the qualification criterion. As illustrated in the confusion matrix (Fig. 17), the optimized model achieved 100% classification accuracy, correctly identifying 62 qualified samples and 19 non-qualified samples without any misclassification.
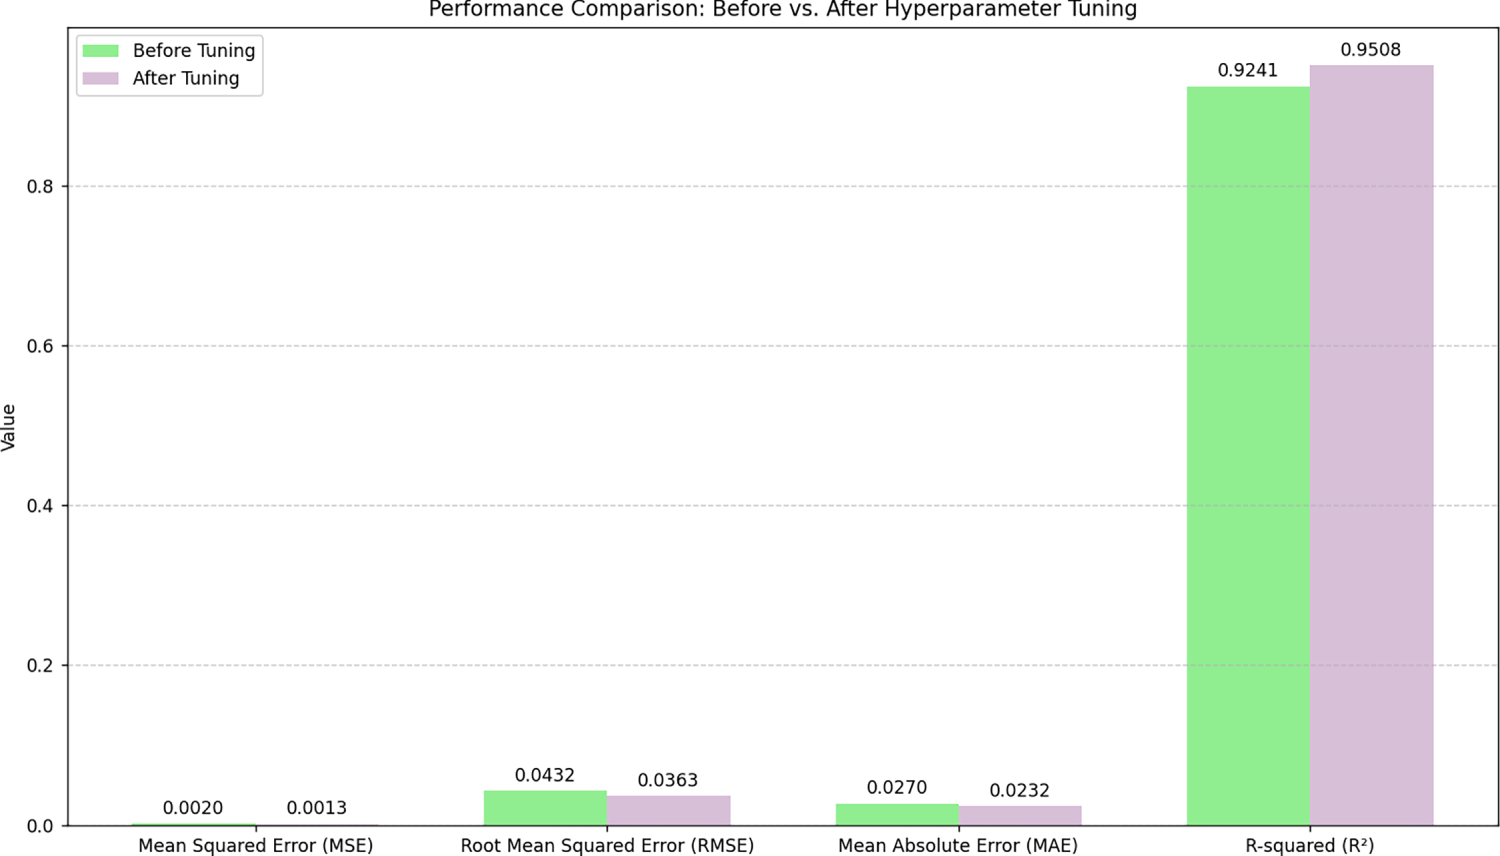
Figure 15: Comparison of evaluation metrics before and after hyperparameter tuning.
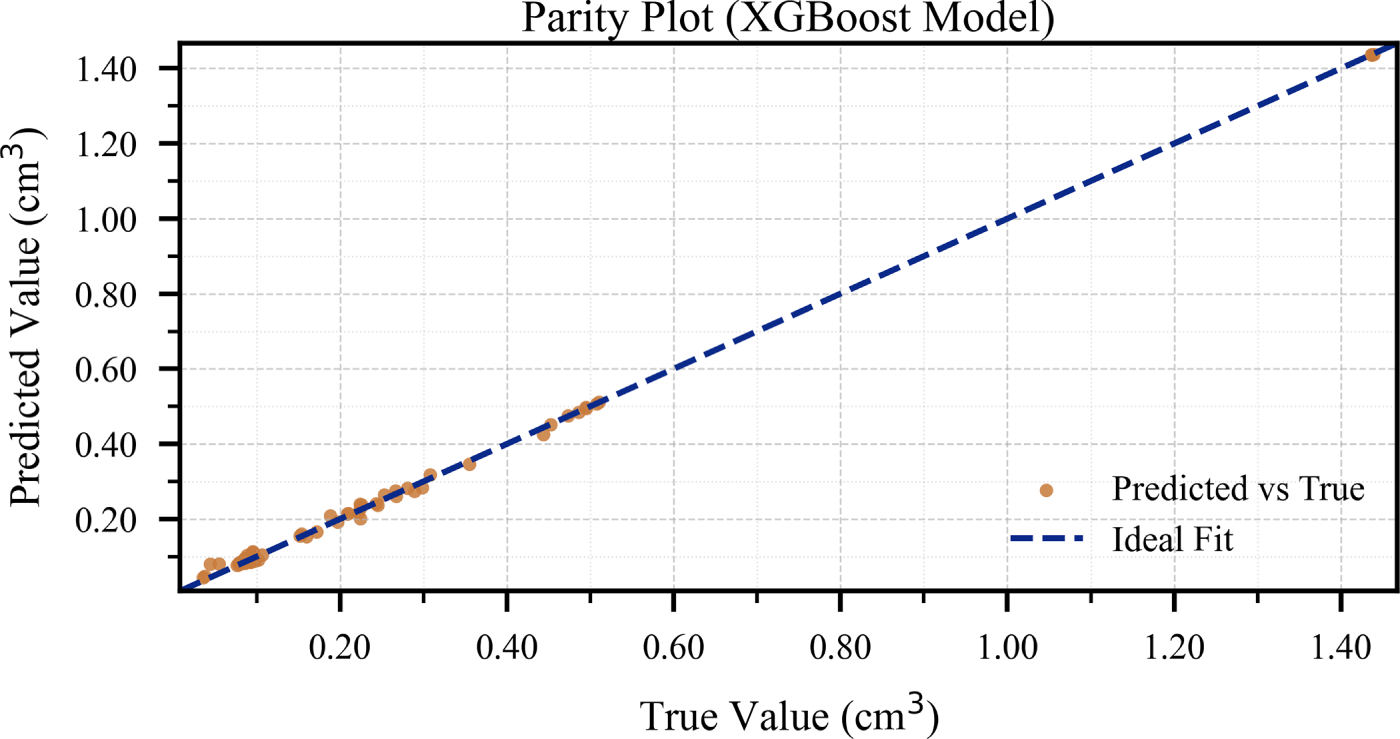
Figure 16: Predicted vs. training values comparison.
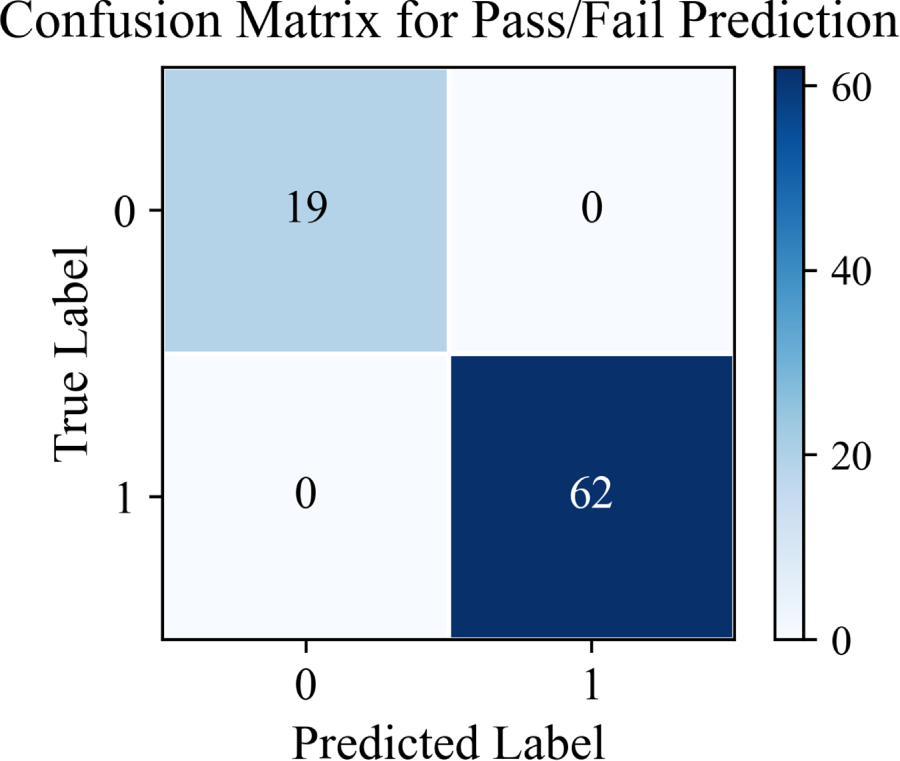
Figure 17: Wheel qualification decision chart.
SHAP analysis was applied to the optimized XGBoost model to quantify each feature’s contribution to the predicted shrinkage-pore volume (Fig. 18). The results indicate that side-mold temperature and IHTC exert the most pronounced influence on model output, followed by bottom-mold temperature, while top-mold temperature shows minimal impact. For side-mold temperature, higher values correspond to positive SHAP values, suggesting that elevated side-mold temperatures increase shrinkage-pore volume. This can be attributed to the reduced temperature gradient between mold and melt, which slows the solidification rate and hinders the formation of effective feeding channels. For IHTC, the SHAP distribution indicates that both high and moderate values contribute to negative SHAP outputs, demonstrating a suppressive effect on shrinkage-pore formation; only at extremely low IHTC values do positive SHAP contributions appear, suggesting that insufficient interfacial heat transfer promotes defect formation. For bottom-mold temperature, higher values correspond to negative SHAP values, indicating that elevated bottom-mold temperatures reduce shrinkage-pore volume. This may be attributed to improved melt fluidity and feeding efficiency in the bottom region, facilitating compensation of volumetric shrinkage during solidification. Top-mold temperature demonstrates the least influence on shrinkage-pore volume among all process parameters. Overall, these findings confirm that side-mold temperature and IHTC are the primary factors governing shrinkage formation, directly reflecting the dominant role of solidification heat-transfer conditions in defect evolution.
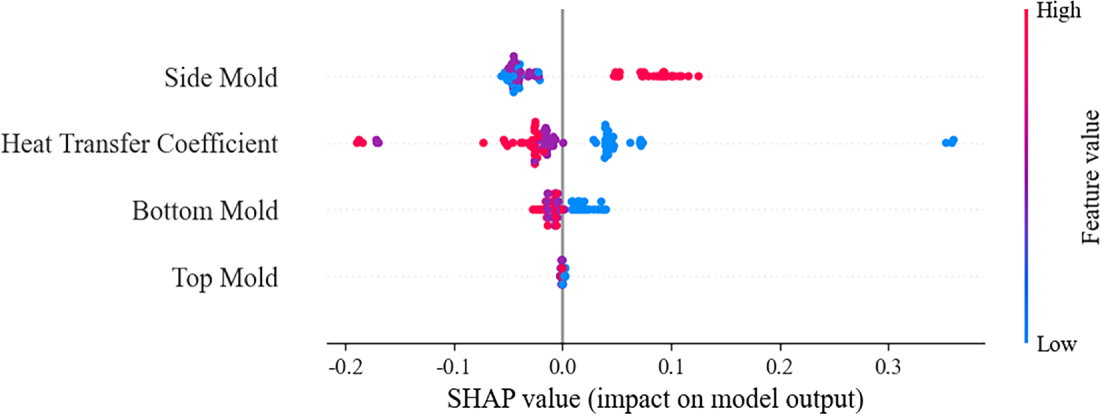
Figure 18: SHAP feature-importance analysis of the defect model.
3.3.2 Results and Interpretation of the Load-Bearing Capacity Prediction Model
As shown in Fig. 19, comparison of fivefold cross-validation before and after hyperparameter tuning indicates that the optimized XGBoost LBC model markedly outperforms the baseline across all metrics; in particular, R2 improves from 0.9159 to 0.9761. Fig. 20 plots the optimized model’s predictions against the ground-truth load-bearing capacity, where the vast majority of points lie tightly along the ideal line (y = x) with minimal deviation. These results demonstrate that the model accurately captures the non-linear mapping between input process parameters and structural response across the entire data range, exhibiting excellent generalization and stability.
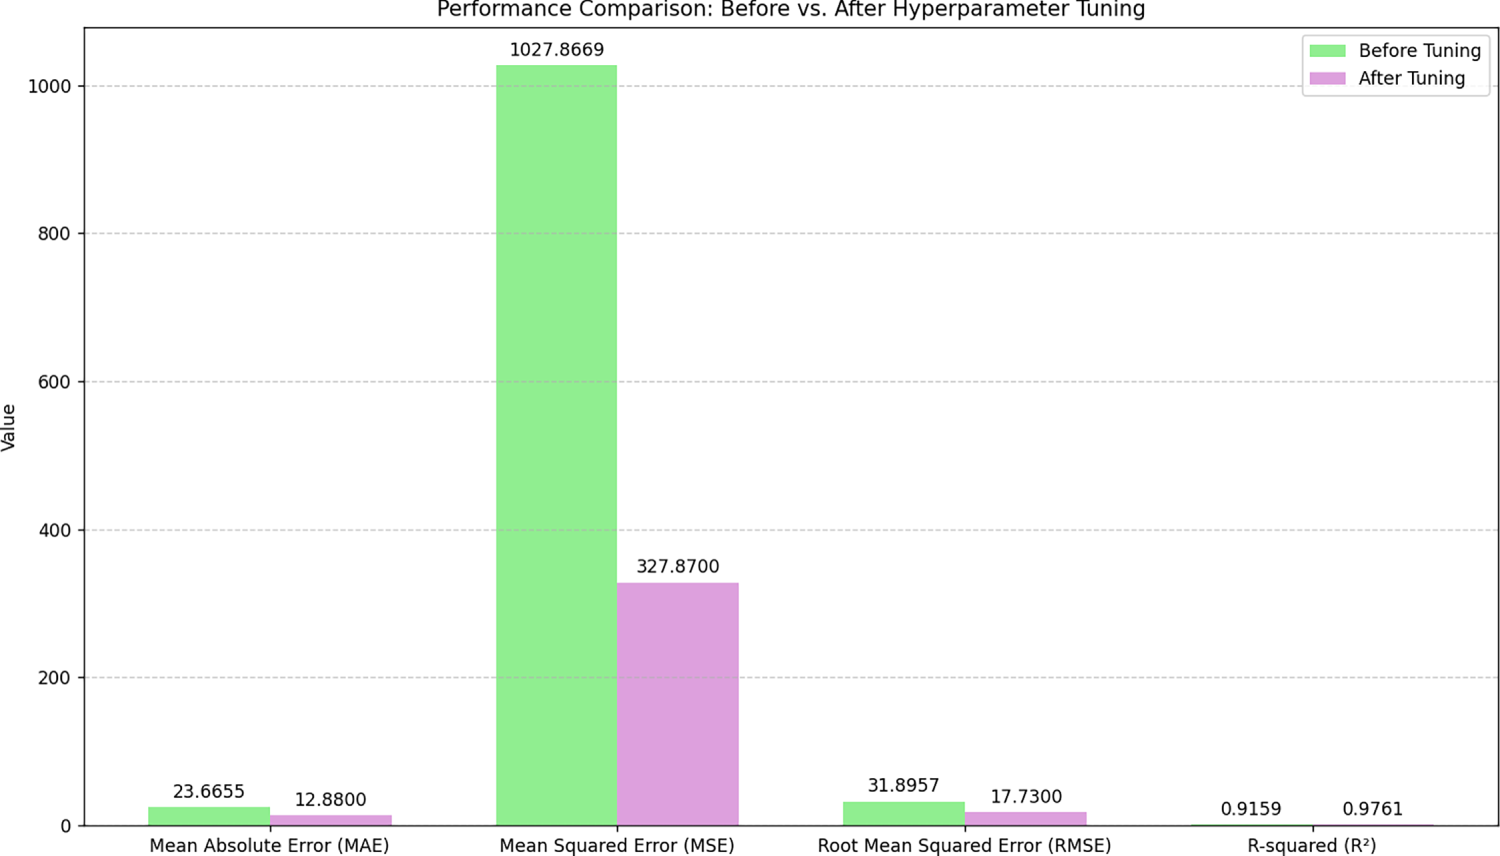
Figure 19: Comparison of evaluation metrics before and after hyperparameter tuning.
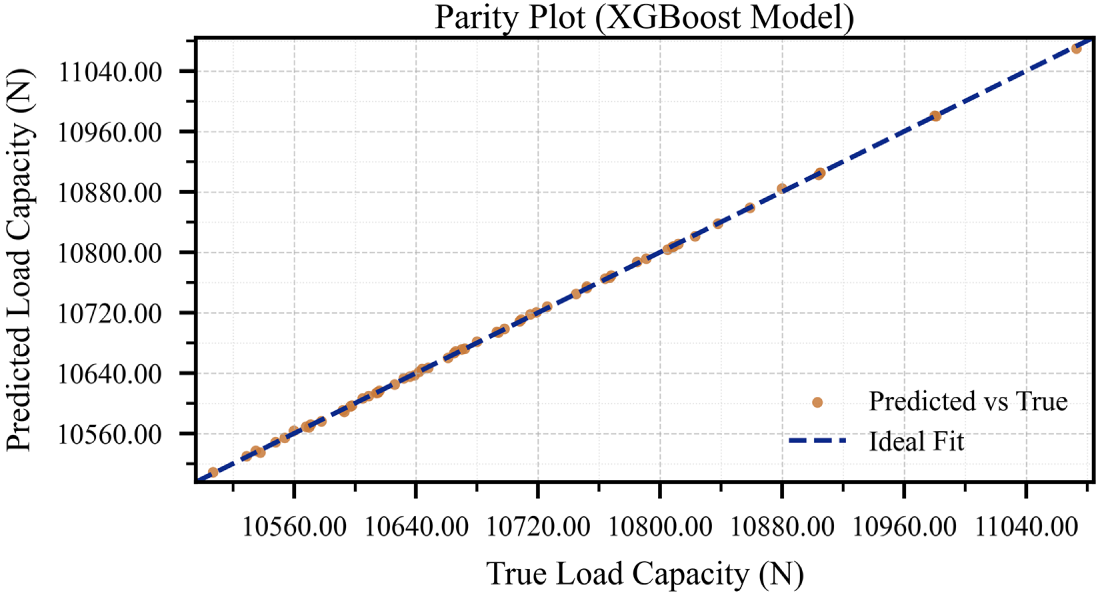
Figure 20: Predicted vs. training values comparison.
To further identify the key factors governing load-bearing capacity prediction, SHAP analysis was performed on the optimized model (Fig. 21). The results indicate that IHTC and side-mold temperature exert the strongest influence on LBC, followed by bottom-mold temperature, while top-mold temperature shows minimal impact. For IHTC, higher values correspond to positive SHAP values, while lower values correspond to negative SHAP values. This indicates that elevated IHTC enhances LBC, which can be attributed to accelerated heat extraction promoting finer microstructure and improved mechanical properties. For side-mold temperature, lower values correspond to positive SHAP values, whereas higher values are associated with negative SHAP values, suggesting that reduced side-mold temperatures favor higher LBC. This may result from faster solidification rates at lower mold temperatures, leading to refined grain structures and enhanced strength in the spoke regions. Bottom-mold and top-mold temperatures exhibit relatively minor influence, with their SHAP values concentrated near zero. Overall, these findings are consistent with the physics of LPDC: interfacial heat-transfer conditions and mold temperatures directly govern solidification rate and microstructural evolution, ultimately determining the wheel’s load-bearing capacity.
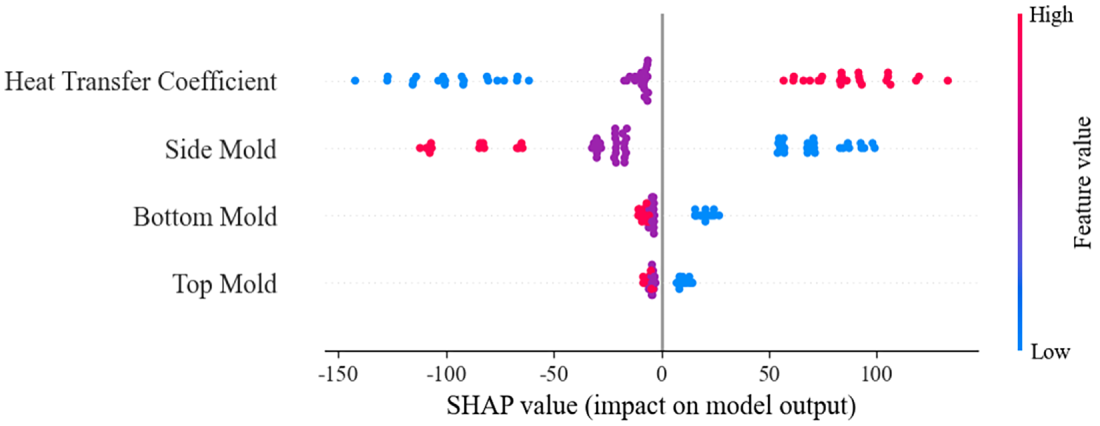
Figure 21: SHAP feature-importance analysis of the LBC model.
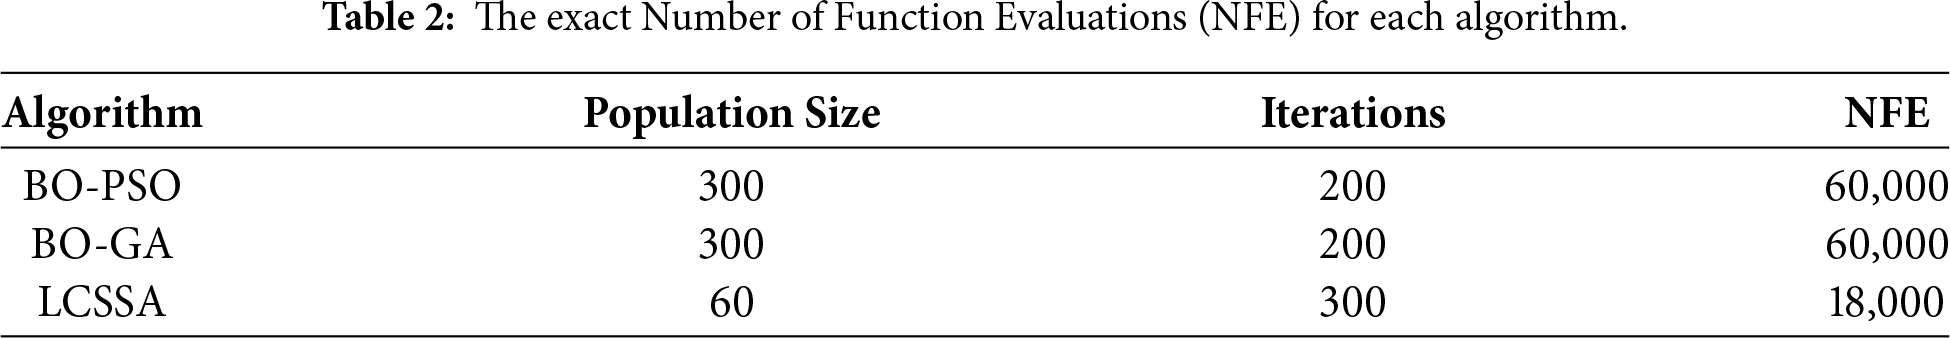
Before presenting the optimization results, the computational cost and experimental procedure of each algorithm are summarized to ensure a fair and statistically valid comparison. The Number of Function Evaluations (NFE) for BO-PSO, BO-GA, and LCSSA are 60,000, 60,000, and 18,000, respectively (Table 2. The exact Number of Function Evaluations (NFE) for each algorithm). Notably, LCSSA required only approximately 30% of the computational budget used by the other two algorithms. Since the XGBoost surrogate model has negligible computational cost per evaluation, the total computation time is primarily determined by the NFE. To account for the stochastic nature of swarm intelligence algorithms, each algorithm was executed 10 times with different random seeds. From the 10 independent runs, the run that yielded the largest number of feasible solutions was selected for presentation. This selection criterion was applied consistently across all three algorithms to ensure fairness, as the number of feasible solutions best reflects an algorithm’s global search capability within the proposed “search-for-boundary” framework.
To systematically evaluate the search performance of the three intelligent optimizers, comparative analyses were conducted under three LBC threshold targets (10,800, 10,847, and 10,894 N). Prior to visualization, all candidate solutions were screened by the defect-classification model, and only those meeting the structural safety criterion were retained for statistics and display. The feasible solutions returned by each optimizer were then visualized to provide an intuitive view of the search characteristics and solution-set distribution under different targets. The LBC distribution plots characterize the number of feasible solutions and their convergence trends, reflecting the global search ability and result stability of each algorithm. Since all optimized solutions exhibit some dispersion in the parameter space, directly using the entire set to delineate a process window would be susceptible to extreme values and random outliers, which is undesirable for reproducible process guidance. Therefore, this study adopts the interquartile range (Q25–Q75) as a representative robust parameter window, effectively removing outliers and boundary solutions and emphasizing the most representative core of the solution set, thereby mitigating search noise and prediction variability.
3.4.1 BO-PSO Optimization Results
Fig. 22 shows the predicted LBC distributions obtained by BO-PSO under different target constraints. As the target load increases, both the overall distribution of solutions and the convergence trend change markedly. At 10,800 N, the algorithm yields a larger number of feasible solutions, with predictions clustering around approximately 10,825 N; the curve is smooth with small fluctuations, indicating rapid convergence and high search stability. When the target is raised to 10,847 N, the number of feasible solutions decreases significantly, and predictions concentrate quickly in the high-capacity range, exhibiting a typical focused-convergence pattern. This reflects a shrinking search scope, reduced global exploration, and signs of premature convergence. With a further increase to 10,894 N, no feasible solutions satisfying the constraints are found, implying insufficient adaptability and global search capability at high targets. Overall, BO-PSO demonstrates good speed and stability at low-to-moderate targets, but under stringent high targets it shows limited search range and a tendency to fall into local optima.
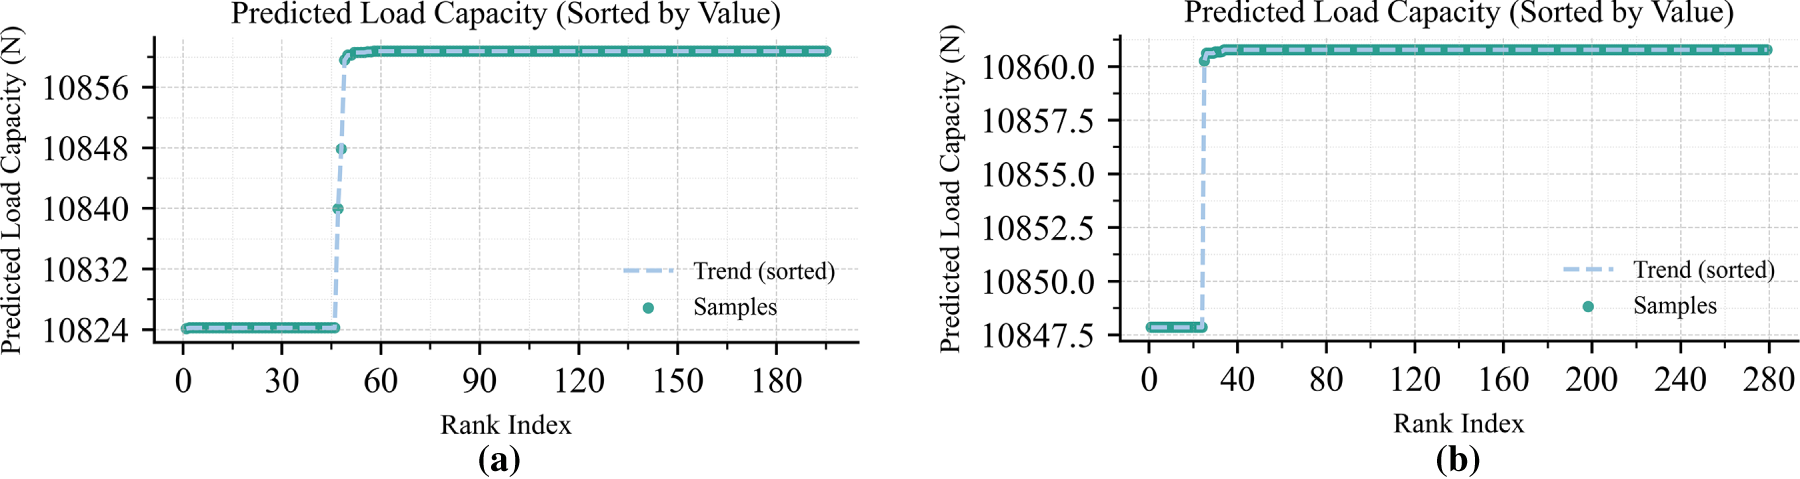
Figure 22: (a) Distribution of BO-PSO optimization results at the 10,800 N load-bearing capacity target; (b) Distribution of BO-PSO optimization results at the 10,847 N load-bearing capacity target.
3.4.2 BO-GA Optimization Results
Fig. 23 illustrates the predicted LBC distributions obtained by BO-GA under different target constraints. As the target increases, the number of feasible solutions decreases substantially, and the overall distribution evolves from smooth and continuous to distinctly stepwise. At the 10,800 N target, BO-GA yields approximately 2400 feasible solutions, with predictions ranging from 10,800 to 11,050 N and exhibiting a smooth, continuous upward trend, indicating effective global search capability and stable convergence behavior. When the target is raised to 10,847 N, the number of feasible solutions decreases to approximately 600, and the distribution exhibits a pronounced stepwise pattern with predictions ranging from 10,840 to 11,040 N, suggesting that global exploration capability is partially retained but the algorithm begins to concentrate in discrete regions. Further increasing the target to 10,894 N leads to a substantial reduction in feasible solutions, with predictions ranging from 10,894 to 11,040 N and displaying a clearly segmented stepwise pattern, indicating a compressed search space with reduced solution diversity. Overall, BO-GA demonstrates effective global search capability and solution-set continuity under low target constraints. As the target increases, the algorithm maintains the ability to identify feasible solutions; however, the solution distribution becomes increasingly discrete, and global exploration efficiency declines progressively.
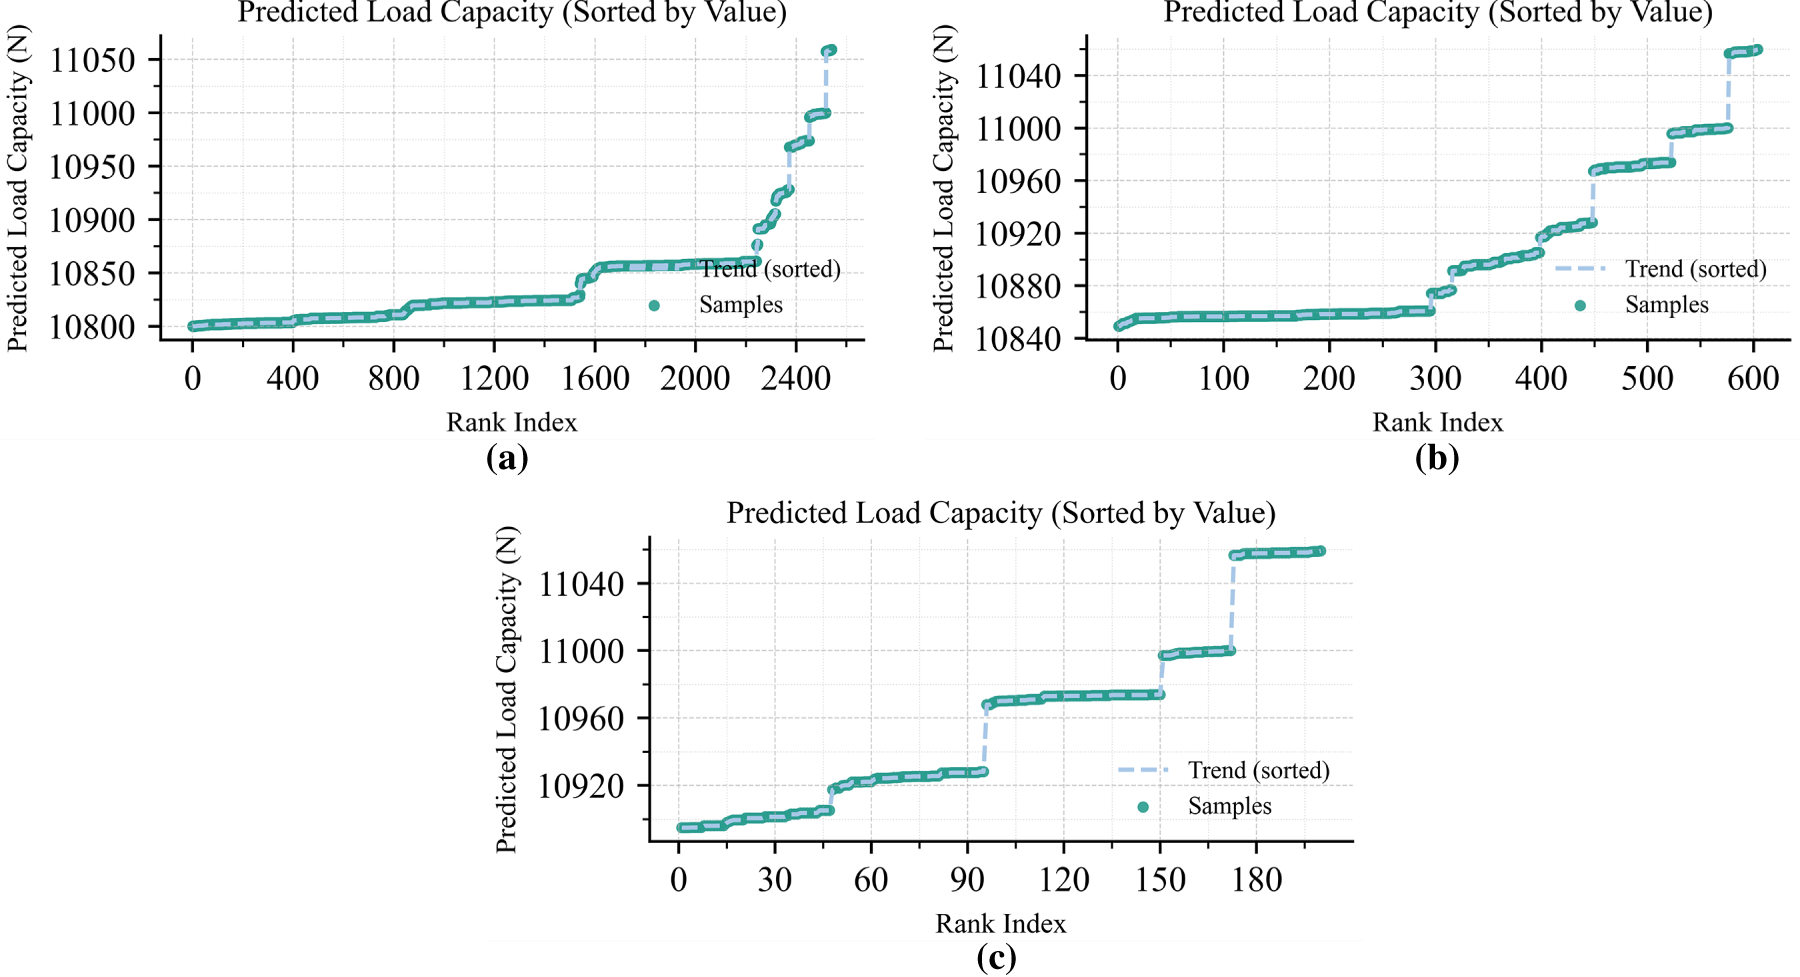
Figure 23: (a) Distribution of BO-GA optimization results at the 10,800 N load-bearing capacity target; (b) Distribution of BO-GA optimization results at the 10,847 N load-bearing capacity target; (c) Distribution of BO-GA optimization results at the 10,894 N load-bearing capacity target.
3.4.3 LCSSA Optimization Results
Fig. 24 presents the predicted LBC distributions obtained by LCSSA under different target constraints. Overall, LCSSA exhibits stable convergence and strong global search capability across all three targets, yielding substantially richer and more uniformly distributed solution sets compared with BO-PSO and BO-GA. At the 10,800 N target, LCSSA generates approximately 9000 feasible solutions, with predictions ranging from 10,800 to 11,050 N and exhibiting a smooth, continuous upward trend with minimal fluctuation, indicating effective capture of the global feasible domain. When the target is raised to 10,847 N, the algorithm yields approximately 7500 feasible solutions, with predictions ranging from 10,847 to 11,040 N. The distribution remains dense and continuous, demonstrating robust global exploration capability and stable convergence under tighter constraints. Even at the 10,894 N target, LCSSA still produces approximately 2800 feasible solutions, with predictions ranging from 10,894 to 11,040 N. Although the number of solutions decreases, the distribution maintains a relatively smooth upward trend without obvious segmentation. Compared with BO-PSO and BO-GA, LCSSA consistently preserves search diversity while progressively approaching the high-capacity region, thereby avoiding premature convergence. These results demonstrate that LCSSA exhibits superior adaptability and robustness under high-target conditions.
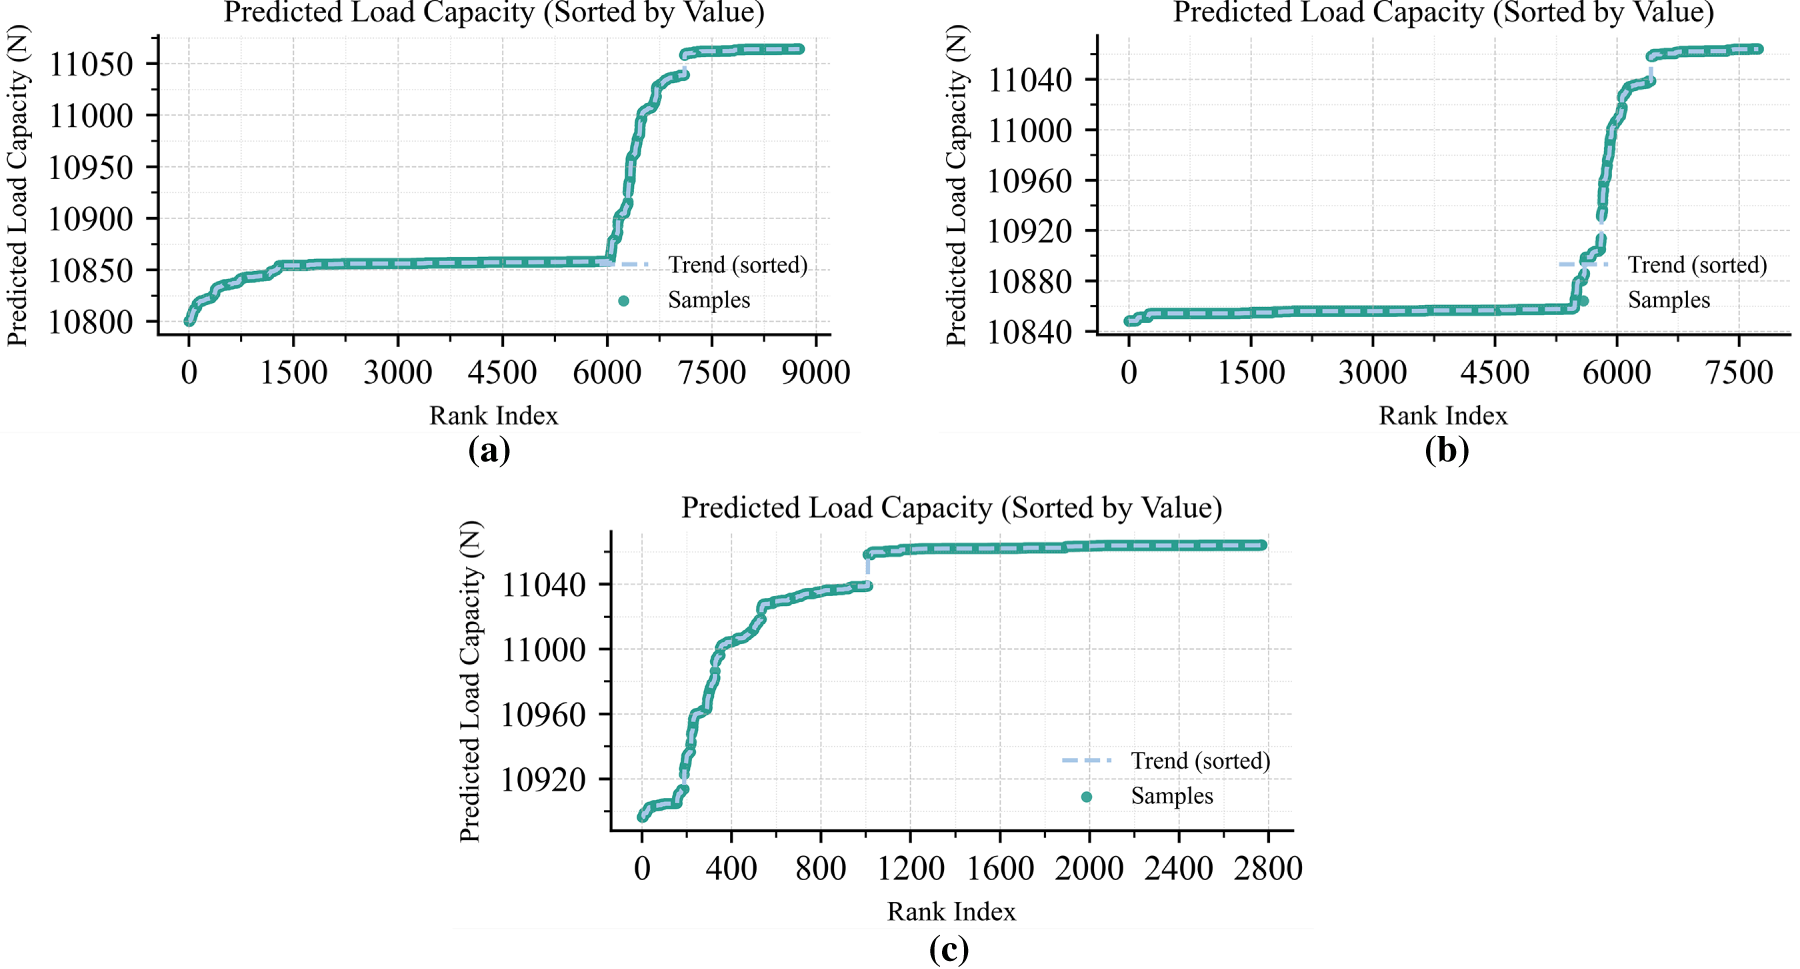
Figure 24: (a) Distribution of LCSSA optimization results at the 10,800 N load-bearing capacity target; (b) Distribution of LCSSA optimization results at the 10,847 N load-bearing capacity target; (c) Distribution of LCSSA optimization results at the 10,894 N load-bearing capacity target.
3.4.4 Validation and Comparison of the Optimization Results
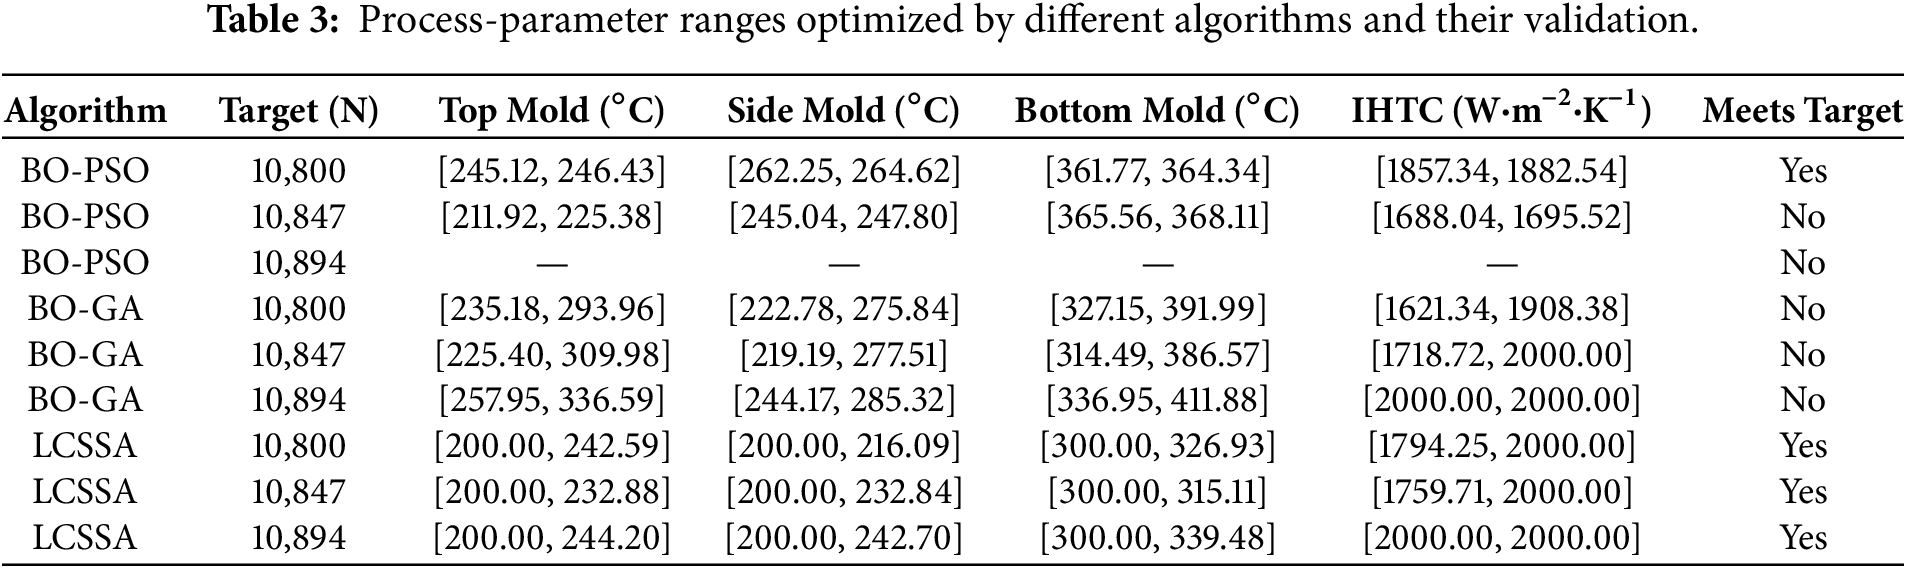
To verify the engineering validity of the robust process windows obtained by different intelligent optimizers, the optimization results from BO-PSO, BO-GA, and LCSSA under three LBC targets were analyzed using box plots. The interquartile range, with outliers removed, was extracted as the representative process-parameter range for each algorithm. Each parameter range was subsequently validated through two criteria: ProCAST simulation for defect screening and Abaqus static FE analysis for LBC evaluation. A process-parameter range was considered to meet the target only when both criteria were satisfied simultaneously. This validation procedure ensures the repeatability and engineering applicability of the comparative results. To ensure the reliability of the surrogate model predictions, a comparative verification methodology was adopted. This approach emphasizes validating simulation results not only through statistical metrics but also by cross-referencing them with physical mechanisms to ensure theoretical consistency.
Table 3 reveals pronounced differences among the three algorithms under the dual constraints of defect control and LBC requirements. BO-PSO yields a validated robust process window only at the 10,800 N target, fails to satisfy the criteria at 10,847 N, and identifies no feasible parameter range at 10,894 N. This indicates that BO-PSO achieves stable convergence at low targets but exhibits search contraction and premature convergence as the target increases, making it difficult to balance defect suppression and LBC simultaneously. BO-GA fails validation at all three targets. Although its interquartile ranges are generally wider, they show insufficient alignment with the true feasible domain, indicating that BO-GA maintains some global exploration capability but lacks robustness in achieving an effective trade-off between shrinkage control and load-bearing capacity. By contrast, LCSSA yields validated robust process windows at all three targets, with consistent and coherent parameter ranges across different LBC requirements. The reliability of these results was confirmed through a two-level validation. First, in terms of numerical validation, the high-fidelity ProCAST and Abaqus simulations were treated as “virtual ground truth”, and the optimized parameters were re-substituted into these physics-based solvers. The results demonstrate that all three LCSSA-identified process windows satisfy both defect-control and LBC criteria simultaneously. Second, in terms of mechanism consistency validation, the characteristic parameter pattern identified by LCSSA features lower and balanced top and side mold temperatures, a moderate bottom-mold temperature, and a relatively high IHTC. This combination is consistent with the Niyama criterion: higher IHTC accelerates the cooling rate and maintains open feeding channels, promoting bottom-to-top sequential solidification and thereby suppressing shrinkage defects while satisfying the LBC requirements. These results indicate that LCSSA effectively balances global exploration with stable convergence in a complex, multimodal design space, exhibiting superior robustness and engineering applicability.
In summary, under the same validation criteria, BO-PSO demonstrates rapidly declining feasibility as the target increases, BO-GA retains some global exploration capability but lacks robustness, whereas LCSSA satisfies all three targets and exhibits a clear overall advantage for achieving the dual objectives of defect control and load-bearing capacity compliance.
This study proposes a data-driven intelligent optimization framework for identifying multidimensional robust process windows in the LPDC of A356 aluminum-alloy wheels. Instead of seeking a single optimum, the framework integrates numerical simulation, ML-based surrogate modeling, and comparative swarm-intelligence optimization to delineate feasible parameter domains that consistently meet target performance in a high-dimensional space. Using simulation data from ProCAST and Abaqus, XGBoost models were developed for defect classification and LBC prediction. Process parameters were then inversely optimized via BO-PSO, BO-GA, and LCSSA. The results validate the feasibility and effectiveness of the proposed framework. The main conclusions are as follows:
(1) SHAP analyses of both the LBC prediction model and the defect regression model identify IHTC and side-mold temperature as the primary influencing factors. Higher IHTC corresponds to positive SHAP impacts on LBC and negative SHAP impacts on defect output, indicating that enhanced interfacial heat transfer improves structural capacity while suppressing shrinkage defects. In contrast, higher side-mold temperature exhibits positive SHAP impacts on defect output and negative impacts on LBC, suggesting that elevated side-mold temperature promotes defect formation and reduces load-bearing capacity. Top-mold and bottom-mold temperatures exhibit secondary, comparatively weaker effects.
(2) XGBoost-based surrogate models accurately capture the complex relationships among process parameters, defect formation, and load-bearing capacity, demonstrating high prediction accuracy and classification resolution. Compared with traditional DOE-based Taguchi methods and simulation-assisted approaches that rely on discrete experimental designs with limited sampling of the parameter space, the proposed surrogate-driven framework enables systematic exploration of the entire process-parameter space. These data-driven models serve as efficient alternatives to computationally expensive finite-element simulations, enabling rapid screening of thousands of parameter combinations. The models provide real-time prediction of casting quality and mechanical performance across the entire process-parameter space, thereby overcoming the limited global-search efficiency inherent in conventional optimization approaches and substantially accelerating process optimization and decision-making in industrial applications.
(3) In the comparative evaluation of the three intelligent optimizers, LCSSA achieved the best search breadth and solution-set quality. BO-PSO tends to prematurely converge to local optima, while BO-GA produces dispersed solutions with insufficient robustness. In contrast, LCSSA effectively avoids premature convergence through chaotic-map initialization and the coordinated discoverer–follower–scout search mechanism, yielding a richer and more uniformly distributed feasible set. Unlike existing optimization studies that predominantly yield a single “optimal” point, which may deviate from its theoretical performance under actual process fluctuations, the proposed framework shifts from a “search-for-optimum” approach toward a “search-for-boundary” strategy. The robust process windows identified by LCSSA balance defect suppression with load-bearing capacity compliance, providing multidimensional feasible-parameter domains rather than isolated optimal points. This approach enhances adaptability and robustness to the inherent process fluctuations encountered in actual factory production.
(4) Despite the ability of the proposed surrogate-driven robust design method to effectively identify multidimensional process-parameter windows that satisfy both defect control and load-bearing capacity requirements, certain limitations remain. the present study considers only process parameters as decision variables, without incorporating cooling-system structural parameters into the optimization framework. In actual production, the configuration of cooling channels (e.g., channel diameter, pitch, and distance from the mold surface) significantly affects solidification behavior and mold thermal stress. Moreover, a complex coupling and conflict relationship exists between casting solidification behavior and mold thermal stress. This isolated approach makes it difficult to achieve globally optimal performance at the system level. To address the above limitations, future research can be conducted based on the proposed methodology. Both process parameters and cooling-system structural parameters can be incorporated into a unified optimization framework to establish a process–cooling system co-optimization design method. By introducing multi-objective optimization algorithms (e.g., NSGA-II), simultaneous optimization of casting solidification time and mold thermal stress can be achieved, enabling synergistic improvement of casting quality and mold service life.
Acknowledgement: The authors gratefully acknowledge the fellow group members for their valuable discussions and support.
Funding Statement: This paper is supported by the Chongqing Jiaotong University-Yangtse Delta Advanced Material Research Institute Provincial-level Joint Graduate Student Cultivation Base (Fund JDLHPYJD2021008).
Author Contributions: The authors confirm contribution to the paper as follows: Conceptualization, Yunlang Zhan and Shiyao Huang; methodology, Yunlang Zhan, Fuhao Fan and Xilin Li; software, Yunlang Zhan; validation, Yunlang Zhan; formal analysis, Yunlang Zhan; investigation, Yunlang Zhan; data curation, Yunlang Zhan; writing—original draft preparation, Yunlang Zhan, Fuhao Fan and Xilin Li; writing—review and editing, Yunlang Zhan, Fuhao Fan, Xilin Li, Zhenfei Zhan, Yongzhi Jiang, Yutong Yang and Shiyao Huang; supervision, Zhenfei Zhan, Yongzhi Jiang, Yutong Yang and Shiyao Huang; project administration, Zhenfei Zhan, Yongzhi Jiang, Yutong Yang and Shiyao Huang; funding acquisition, Zhenfei Zhan, Yutong Yang and Shiyao Huang. All authors reviewed and approved the final version of the manuscript.
Availability of Data and Materials: The data supporting the findings of this study are available from the corresponding authors upon reasonable request.
Ethics Approval: Not applicable. This study does not involve human participants or animal subjects.
Conflicts of Interest: The authors declare no conflicts of interest.
References
1. Dursun T, Soutis C. Recent developments in advanced aircraft aluminium alloys. Mater Des. 2014;56:862–71. doi:10.1016/j.matdes.2013.12.002. [Google Scholar] [CrossRef]
2. Hirsch J. Recent development in aluminium for automotive applications. Trans Nonferr Met Soc China. 2014;24(7):1995–2002. doi:10.1016/S1003-6326(14)63305-7. [Google Scholar] [CrossRef]
3. Uyan TÇ, Otto K, Santos Silva M, Vilaça P, Armakan E. Industry 4.0 foundry data management and supervised machine learning in low-pressure die casting quality improvement. Int J Met. 2023;17(1):414–29. doi:10.1007/s40962-022-00783-z. [Google Scholar] [CrossRef]
4. Merchán M, Egizabal P, García de Cortázar M, Irazustabarrena A, Galarraga H. Development of an innovative low pressure die casting process for aluminum powertrain and structural components. Adv Eng Mater. 2019;21(6):1800105. doi:10.1002/adem.201800105. [Google Scholar] [CrossRef]
5. Mi GF, Liu XY, Wang KF, Fu HZ. Numerical simulation of low pressure die-casting aluminum wheel. China Foundry. 2009;6(1):48–52. [Google Scholar]
6. Ou J, Wei C, Cockcroft S, Maijer D, Zhu L, Lateng A, et al. Advanced process simulation of low pressure die cast A356 aluminum automotive wheels: part I, process characterization. Metals. 2020;10(5):563. doi:10.3390/met10050563. [Google Scholar] [CrossRef]
7. Shahane S, Mujumdar S, Kim N, Priya P, Aluru NR, Ferreira P, et al. Simulations of die casting with uncertainty quantification. J Manuf Sci Eng. 2019;141(4):041003. doi:10.1115/1.4042583. [Google Scholar] [CrossRef]
8. Timelli G, Caliari D, Rakhmonov J. Influence of process parameters and Sr addition on the microstructure and casting defects of LPDC A356 alloy for engine blocks. J Mater Sci Technol. 2016;32(6):515–23. doi:10.1016/j.jmst.2016.03.010. [Google Scholar] [CrossRef]
9. Vandersluis E, Bois-Brochu A, Ravindran C, Chiesa F. Mechanical properties and conductivity of low-pressure die-cast 319 aluminum prepared with hot isostatic pressing, thermal treatment, or chemical treatment. J Mater Eng Perform. 2020;29(4):2335–45. doi:10.1007/s11665-020-04743-8. [Google Scholar] [CrossRef]
10. Yang Y, Zheng J, Huang S, Yang L, Cheng X, Han W. The role of strain rate in microstructure evolution, deformation heterogeneity and cracking mode of high-pressure die-casting Al7Si0.2Mg alloy. Mater Sci Eng A. 2023;888(4):145798. doi:10.1016/j.msea.2023.145798. [Google Scholar] [CrossRef]
11. Yang YT, Huang SY, Zheng J, Yang L, Cheng XN, Chen RK, et al. Effect of porosity and α-Al(Fe/Mn)Si phase on ductility of high-pressure die-casting Al−7Si−0.2Mg alloy. Trans Nonferr Met Soc China. 2024;34(2):378–91. doi:10.1016/S1003-6326(23)66405-2. [Google Scholar] [CrossRef]
12. Couper MJ, Neeson AE, Griffiths JR. Casting defects and the fatigue behaviour of an aluminium casting alloy. Fatigue Fract Eng Mater Struct. 1990;13(3):213–27. doi:10.1111/j.1460-2695.1990.tb00594.x. [Google Scholar] [CrossRef]
13. ASTM E155-15. Standard reference radiographs for inspection of aluminum and magnesium castings. West Conshohocken, PA, USA: ASTM International; 2015 [cited 2026 Mar 5]. Available from: https://store.astm.org/e0155-15.html. [Google Scholar]
14. Gao YX, Yi JZ, Lee PD, Lindley TC. The effect of porosity on the fatigue life of cast aluminium-silicon alloys. Fatigue Fract Eng Mater Struct. 2004;27(7):559–70. doi:10.1111/j.1460-2695.2004.00780.x. [Google Scholar] [CrossRef]
15. Campbell J. Castings. Amsterdam, The Netherlands: Elsevier; 2003. [Google Scholar]
16. Yıldırım M, Özyürek D. The effects of Mg amount on the microstructure and mechanical properties of Al-Si–Mg alloys. Mater Des. 2013;51:767–74. doi:10.1016/j.matdes.2013.04.089. [Google Scholar] [CrossRef]
17. Goulart PR, Spinelli JE, Osório WR, Garcia A. Mechanical properties as a function of microstructure and solidification thermal variables of Al-Si castings. Mater Sci Eng A. 2006;421(1–2):245–53. doi:10.1016/j.msea.2006.01.050. [Google Scholar] [CrossRef]
18. Yang YT, Qiu ZY, Zheng Z, Pu LX, Chen DD, Zheng J, et al. Al-enabled properties distribution prediction for high-pressure die casting Al-Si alloy. Adv Manuf. 2024;12(3):591–602. doi:10.1007/s40436-024-00485-1. [Google Scholar] [CrossRef]
19. Doctor YN, Patil BT, Darekar AM. Review of optimization aspects for casting processes. Int J Sci Res. 2015;4(3):2364–8. [Google Scholar]
20. Karthik A, Karunanithi R, Srinivasan SA, Prashanth M. The optimization of squeeze casting process parameter for AA2219 alloy by using the Taguchi method. Mater Today Proc. 2020;27:2556–61. doi:10.1016/j.matpr.2019.10.136. [Google Scholar] [CrossRef]
21. Pattnaik S, Karunakar DB, Jha PK. Parametric optimization of the investment casting process using utility concept and Taguchi method. Proc Inst Mech Eng Part L J Mater Des Appl. 2014;228(4):288–300. doi:10.1177/1464420713487654. [Google Scholar] [CrossRef]
22. Kuo CC, Liu HA, Chang CM. Optimization of vacuum casting process parameters to enhance tensile strength of components using design of experiments approach. Int J Adv Manuf Technol. 2020;106(9):3775–85. doi:10.1007/s00170-019-04905-6. [Google Scholar] [CrossRef]
23. Wang Y, Wu S, Niu L, Xue X, Zhang J, Xiao W. Optimization of low-pressure die casting process parameters for reduction of shrinkage porosity in ZL205A alloy casting using Taguchi method. Proc Inst Mech Eng Part B J Eng Manuf. 2014;228(11):1508–14. doi:10.1177/0954405414521065. [Google Scholar] [CrossRef]
24. Dong G, Li S, Ma S, Zhang D, Bi J, Wang J, et al. Process optimization of A356 aluminum alloy wheel hub fabricated by low-pressure die casting with simulation and experimental coupling methods. J Mater Res Technol. 2023;24(1):3118–32. doi:10.1016/j.jmrt.2023.03.214. [Google Scholar] [CrossRef]
25. Pei X, Hou H, Zhao Y. A review of intelligent design and optimization of metal casting processes. Acta Metall Sin Engl Lett. 2025;38(8):1293–311. doi:10.1007/s40195-025-01891-5. [Google Scholar] [CrossRef]
26. Wu H, Yang X, Cao G, Zhao L, Yang L. Design and optimisation of die casting process for heavy-duty automatic transmission oil circuit board. Int J Cast Met Res. 2021;34(2):88–96. doi:10.1080/13640461.2021.1904673. [Google Scholar] [CrossRef]
27. Gupta AK, Kumar S, Chandna P, Bhushan G. Optimization of process parameters during pressure die casting of A380: a silicon-based aluminium alloy using GA & fuzzy methodology. Silicon. 2021;13(8):2429–43. doi:10.1007/s12633-020-00594-z. [Google Scholar] [CrossRef]
28. Tian JW, Bu K, Song JH, Tian GL, Qiu F, Zhao DQ, et al. Optimization of investment casting process parameters to reduce warpage of turbine blade platform in DD6 alloy. China Foundry. 2017;14(6):469–77. doi:10.1007/s41230-017-6063-9. [Google Scholar] [CrossRef]
29. Deng J, Wang L, Liu G, You D, Wu X, Liang J. Process parameters design of squeeze casting through SMR ensemble model and ACO. Int J Adv Manuf Technol. 2024;130(5):2687–704. doi:10.1007/s00170-023-12805-z. [Google Scholar] [CrossRef]
30. Zhang L, Wang R. An intelligent system for low-pressure die-cast process parameters optimization. Int J Adv Manuf Technol. 2013;65(1):517–24. doi:10.1007/s00170-012-4190-4. [Google Scholar] [CrossRef]
31. Yang WC, Yang JY, Kim RC, Om MS, Kim UH, Ri WS, et al. Multi-attribute optimization and influence assessment methodology of casting process parameters combined with integrated MADM and Taguchi method. Int J Adv Manuf Technol. 2023;129(1):681–95. doi:10.1007/s00170-023-12275-3. [Google Scholar] [CrossRef]
32. Martínez-Pastor J, Hernández-Ortega JJ, Zamora R. A decision support system (DSS) for the prediction and selection of optimum operational parameters in pressure die-casting processes. Materials. 2022;15(15):5309. doi:10.3390/ma15155309. [Google Scholar] [PubMed] [CrossRef]
33. Zhan Y, Li X, Pu L, Yang Y, Zhan Z, Jiang Y, et al. Surrogate-based prediction of solidification time in castings via data-driven methods. In: Proceedings of the 32nd Annual Conference of the China Society of Automotive Engineers; 2025 Oct 21–24; Chongqing, China. p. 127–35. (In Chinese). doi:10.26914/c.cnkihy.2025.063595. [Google Scholar] [CrossRef]
34. Kennedy J, Eberhart R. Particle swarm optimization. In: Proceedings of ICNN’95—International Conference on Neural Networks; 1995 Nov 27–Dec 1; Perth, WA, Australia; 1995. p. 1942–8. doi:10.1109/ICNN.1995.488968. [Google Scholar] [CrossRef]
35. Mirjalili S. Genetic algorithm. In: Evolutionary algorithms and neural networks. Cham, Switzerland: Springer; 2018. p. 43–55. doi:10.1007/978-3-319-93025-1_4. [Google Scholar] [CrossRef]
36. Deng J, Liu G, Wang L, Liu G, Wu X. Intelligent optimization design of squeeze casting process parameters based on neural network and improved sparrow search algorithm. J Ind Inf Integr. 2024;39(9):100600. doi:10.1016/j.jii.2024.100600. [Google Scholar] [CrossRef]
Cite This Article
 Copyright © 2026 The Author(s). Published by Tech Science Press.
This work is licensed under a Creative Commons Attribution 4.0 International License , which permits unrestricted use, distribution, and reproduction in any medium, provided the original work is properly cited.
 Downloads
 Citation Tools