
 Submit a Paper
 Propose a Special lssue
 Open Access
ARTICLE

Phase-Dependent Structural, Optical, and Thermodynamic Behavior of BaTiO3: Insights from First-Principles Calculations
1 Physics Department, Science Faculty, Gazi University, Ankara, Turkey
2 Department of Applied Sciences & Humanities, IIMT College of Engineering, Greater Noida, Uttar Pradesh, India
3 Department of Physics, Poornima University, Jaipur, Rajasthan, India
* Corresponding Author: Peeyush Kumar Kamlesh. Email:
Computers, Materials & Continua 2026, 87(3), 35 https://doi.org/10.32604/cmc.2026.078722
Received 06 January 2026; Accepted 26 February 2026; Issue published 09 April 2026
 View Full Text
 Download PDF
Abstract
This study examines the phase-dependent structural, electronic, optical, and thermodynamic characteristics of the cubic, tetragonal, and orthorhombic phases of BaTiO3 using DFT simulations. Lattice parameters and bulk moduli computed through structural optimizations within the GGA-PBE framework are in good agreement with existing experimental and theoretical studies. All phases exhibit negative formation energies, indicating thermodynamic stability, with the orthorhombic phase being the most stable. Electronic structure calculations reveal indirect band gaps of 2.86, 2.96, and 3.43 eV for the cubic, tetragonal, and orthorhombic phases, respectively. The density of states analysis indicates that O-p states dominate the valence band, and Ti-d states are the primary source of the conduction band. The optical properties of BaTiO3 have been evaluated using the frequency-dependent dielectric function over 0–15 eV, showing strong optical absorption in both the visible and ultraviolet regions. The optical band gap is consistent with the electronic results. The dielectric constants for all three phases of BaTiO3 are calculated to be 4.7, 4.4, and 4.5, while the refractive indices are 2.18, 2.09, and 2.12, respectively. In the infrared and visible regions (below ~3.1 eV), the refractive index exhibits relatively high, weakly dispersive behavior for all phases, indicating strong polarization and low optical losses. The thermodynamic properties of BaTiO3 were evaluated using the quasi-harmonic Debye model in the temperature range 0–1000 K and pressure range 0–30 GPa. The calculated thermodynamic parameters suggest that the bulk modulus decreases with increasing temperature but increases with increasing pressure. At very high temperatures, the heat capacity approaches the Dulong-Petit limit. This study suggests that BaTiO3 shows potential for optoelectronic and high-temperature applications.Keywords
ABO3-type perovskites are a family of ternary oxides that have shown promise for use as materials in solid oxide fuel cells [1], electrochemical devices [2], hydrogen membrane technology, actuators, and sensors [3]. The diversity of material properties, combined with the ability to adjust some of their physical characteristics, has drawn attention to these compounds. Their structure and related properties can change with temperature and pressure, leading to structural distortion and different configurations (e.g., different spin types) under different conditions [4]. To understand quantum-mechanical relationships in perovskites that are either ferroelectric and exhibit other interesting behavior, it is essential to recognize how their structural phases change. Perovskite has excellent electronic properties and can be used in diodes, transistors, integrated circuits, as well as thin-film transistors (TFT) for flat panel displays. They have also been used in applications involving Spin transport dependence and highly coupled electronic and lattice interactions [5,6]. Recently, researchers have focused on developing new catalytic and photocatalytic materials for purifying wastewater from heavy metals, dyes, and other contaminants. The last several decades have also seen significant efforts by scientists to develop stable, efficient, and cost-effective, non-toxic photocatalysts to accomplish both water splitting and environmental cleanup. Consequently, studies into the stability of ABO3 oxide photocatalysts have been of great interest.
Barium Titanate (BaTiO3), a unique ferroelectric material, is characterized by its three distinct phases, cubic, tetragonal, and ortho-rhombohedral, and its ability to transition between these phases easily [7]. It has many advanced technological applications, such as capacitors, nonlinear optics, electrical components, dielectric materials, piezoelectric devices, and energy or data storage [8–11]. Significant research has been conducted on the creation of ferroelectric nanostructures, such as nanotubes, nanowires, and nanoparticles, to improve their performance. All four crystalline structure phases of barium titanate, cubic paraelectric [12], tetragonal [7,13], ortho-rhombic [7,14], and rhombohedral [7] have been established using single-crystal X-ray diffraction and neutron diffraction techniques. The phase transitions for BaTiO3 have been defined as occurring in three sequential temperature channels: cubic to tetragonal at 403 to 396 K, tetragonal to orthorhombic at 281 to 278 K, and orthorhombic to rhombohedral at 207 to 183 K [15,16]. The pressure-induced phase transitions of BaTiO3 have also been extensively studied. Ishidate et al. [17] used experimental dielectric data to construct a Temperature-Pressure Phase Diagram of BaTiO3. They calculated the critical pressures for transitions from cubic to tetragonal, tetragonal to orthorhombic, and orthorhombic to rhombohedral at absolute zero (−273°C) to be 6.5, 6.0, and 5.4 GPa, respectively. Wang et al. [18] used a modified Landau potential to construct a hydrostatic pressure phase diagram. They determined critical pressures of 5.1, 5.8, and 6.4 GPa for the rhombohedral to orthorhombic, orthorhombic to tetragonal, and tetragonal to cubic transitions, respectively. Uludoğan et al. [19] examined the pressure-induced phase changes in BaTiO3 at 0 K, where rhombohedral to orthorhombic phase changes occurred at 5.0 GPa, orthorhombic to tetragonal occurred at 6.0 GPa, and tetragonal to cubic occurred at 7.5 GPa.
The phonon properties of the cubic phase of BaTiO3 have been studied by various first-principles calculations, but there remains a dearth of experimental spectroscopic data [20–23]. The tetragonal [24], orthorhombic [25], and rhombohedral [26] phases have been studied by Raman scattering. Theoretical studies [20,21,27,28] concerning vibrational frequencies have been performed for the tetragonal, orthorhombic [20], and rhombohedral phases [28–30], primarily focusing on phonon frequencies without delving into the origins of these phonon modes. Since analyzing phonon mode symmetries is vital for understanding the contributions of various atomic movements to vibrational modes, further comparative research on the phonon symmetries of the four phases of BaTiO3 is necessary. Additionally, Iles et al. [31] investigated the thermodynamic properties of BaTiO3 in its cubic phase using the quasi-harmonic Debye model. However, first-principles calculations have shown that the quasi-harmonic approximation provides a more accurate representation of thermodynamic properties and phase transitions for numerous materials below their melting points. Ziati and Ez-Zahraouy [32] examined the electronic, optical, and thermoelectric characteristics of Te-doped BaTiO3 in its cubic phase. Recently, Hasan et al. [33] analyzed the structural, electronic, optical, and mechanical properties of Ca-doped BaTiO3 in the cubic phase, finding it suitable for photorefractive and optoelectronic applications.
Barium titanate (BaTiO3) is a well-studied perovskite ferroelectric known for its sequence of structural phase transitions and numerous applications. Its ferroelectric properties stem from the off-center displacement of the Ti4+ ion within the oxygen octahedron, leading to spontaneous polarization and a strong coupling between its structure, electronic properties, and dielectric behavior. Because of this close relationship, BaTiO3 serves as a key model for studying ferroelectric phase transitions [34–37]. When cooled from high temperatures, BaTiO3 undergoes a sequence of phase changes: from a cubic paraelectric phase (Pm3m) to a tetragonal ferroelectric phase (P4mm) near 393 K, then to orthorhombic (Amm2) and rhombohedral (R3m) ferroelectric phases at around 278 and 183 K, respectively [34–36]. These phase transitions involve significant changes in lattice symmetry, polarization direction, and dielectric response, highlighting the role of temperature in tuning the properties of BaTiO3-based materials [37].
The microscopic origin of these phase transitions has been a subject of long-standing debate, especially regarding the roles of displacive lattice dynamics and order-disorder mechanisms. Early experimental and phenomenological studies focused on the softening of transverse optical phonon modes as the main cause of the cubic-to-tetragonal transition [37]. However, later research uncovered local polar distortions that remain even in the nominally cubic phase, indicating that local structural order significantly influences the transition mechanism [38]. This dual nature makes BaTiO3 an ideal model system for atomistic studies using first-principles methods.
Density Functional Theory (DFT) calculations have provided fundamental insight into the temperature-dependent phase behavior of BaTiO3. In particular, first-principles-based effective Hamiltonian approaches combined with Monte Carlo simulations successfully reproduced the experimentally observed phase sequence and transition temperatures, demonstrating that anharmonic lattice interactions, strain-polarization coupling, and long-range Coulomb forces collectively determine phase stability [39,40]. These studies established a quantitative link between atomic-scale interactions and macroscopic ferroelectric behavior.
In addition to temperature, the phase stability of BaTiO3 is highly sensitive to external factors, including pressure, epitaxial strain, and chemical modification. First-principles investigations have shown that hydrostatic pressure suppresses ferroelectricity and significantly alters the temperature–phase diagram of BaTiO3 [41]. Similarly, strain engineering and chemical doping have been widely employed to shift Curie temperatures, modify phase boundaries, and enhance dielectric and piezoelectric responses, thereby extending the applicability of BaTiO3-based materials in sensors, actuators, and energy-related devices [42].
Despite decades of experimental and theoretical research, a comprehensive atomistic understanding of temperature-driven phase transitions in BaTiO3 remains an active area of investigation. In this context, DFT-based approaches provide a powerful framework to analyze phase stability, electronic structure evolution, and lattice dynamics across different crystallographic phases [33,39,40]. The present study is therefore motivated by the need to clarify the energetic and structural origins of temperature-dependent phase transitions in BaTiO3 from a first-principles perspective, thereby improving the structural, mechanical, vibrational, and optical properties relevant to ferroelectric and dielectric applications.
Despite this, systematic and comparative studies of the optical and thermodynamic properties of the tetragonal and orthorhombic phases of BaTiO3 remain limited. Our objective is to address this gap in the literature regarding BaTiO3. In this study, we explored the structural, electronic, optical, and thermodynamic properties of the cubic, tetragonal, and orthorhombic phases of BaTiO3 using density-functional theory.
First-principles computations were performed using DFT with a pseudopotential plane-wave method, as implemented in the Vienna Ab-initio Simulation Package (VASP), to examine the ground state structural parameters, as well as the thermodynamic and optical characteristics of BaTiO3 in its cubic, tetragonal, and orthorhombic phases [43–45]. A plane-wave cutoff energy of 700 eV was used in the present study. Monkhorst-Pack k-point meshes of 16 × 16 × 16, 17 × 17 × 16, and 17 × 12 × 11 were used to sample the irreducible Brillouin zone of reciprocal space, giving well-converged total energies and electronic structures for the cubic, tetragonal, and orthorhombic phases, respectively [46]. Exchange-correlation effects of the electronic structure were modeled on optical response and electronic structure of BaTiO3 using the Generalized Gradient Approximation (GGA) that relies on the Perdew-Burke-Ernzerhof (PBE) set of functional [47]. To mitigate the well-known band-gap underestimation of GGA, the electronic band structure and optical properties were further analyzed using the HSE06 hybrid functional. Optimisation of all atomic positions and lattice parameters continued until interatomic forces dropped below 1 × 10⁻⁷ eV/Å and Pulay Stress dropped below 0.001 kB (1 kB = 0.1 GPa). To assess the frequency dependent dielectric matrix at the long wavelength limit, a sum-over-states technique [48] was employed, followed by the use of the sum-over-states result to assess thermophysical properties based on the Gibbs Free Energy and constant volume specific heats at a quasi-harmonic approximation [49].
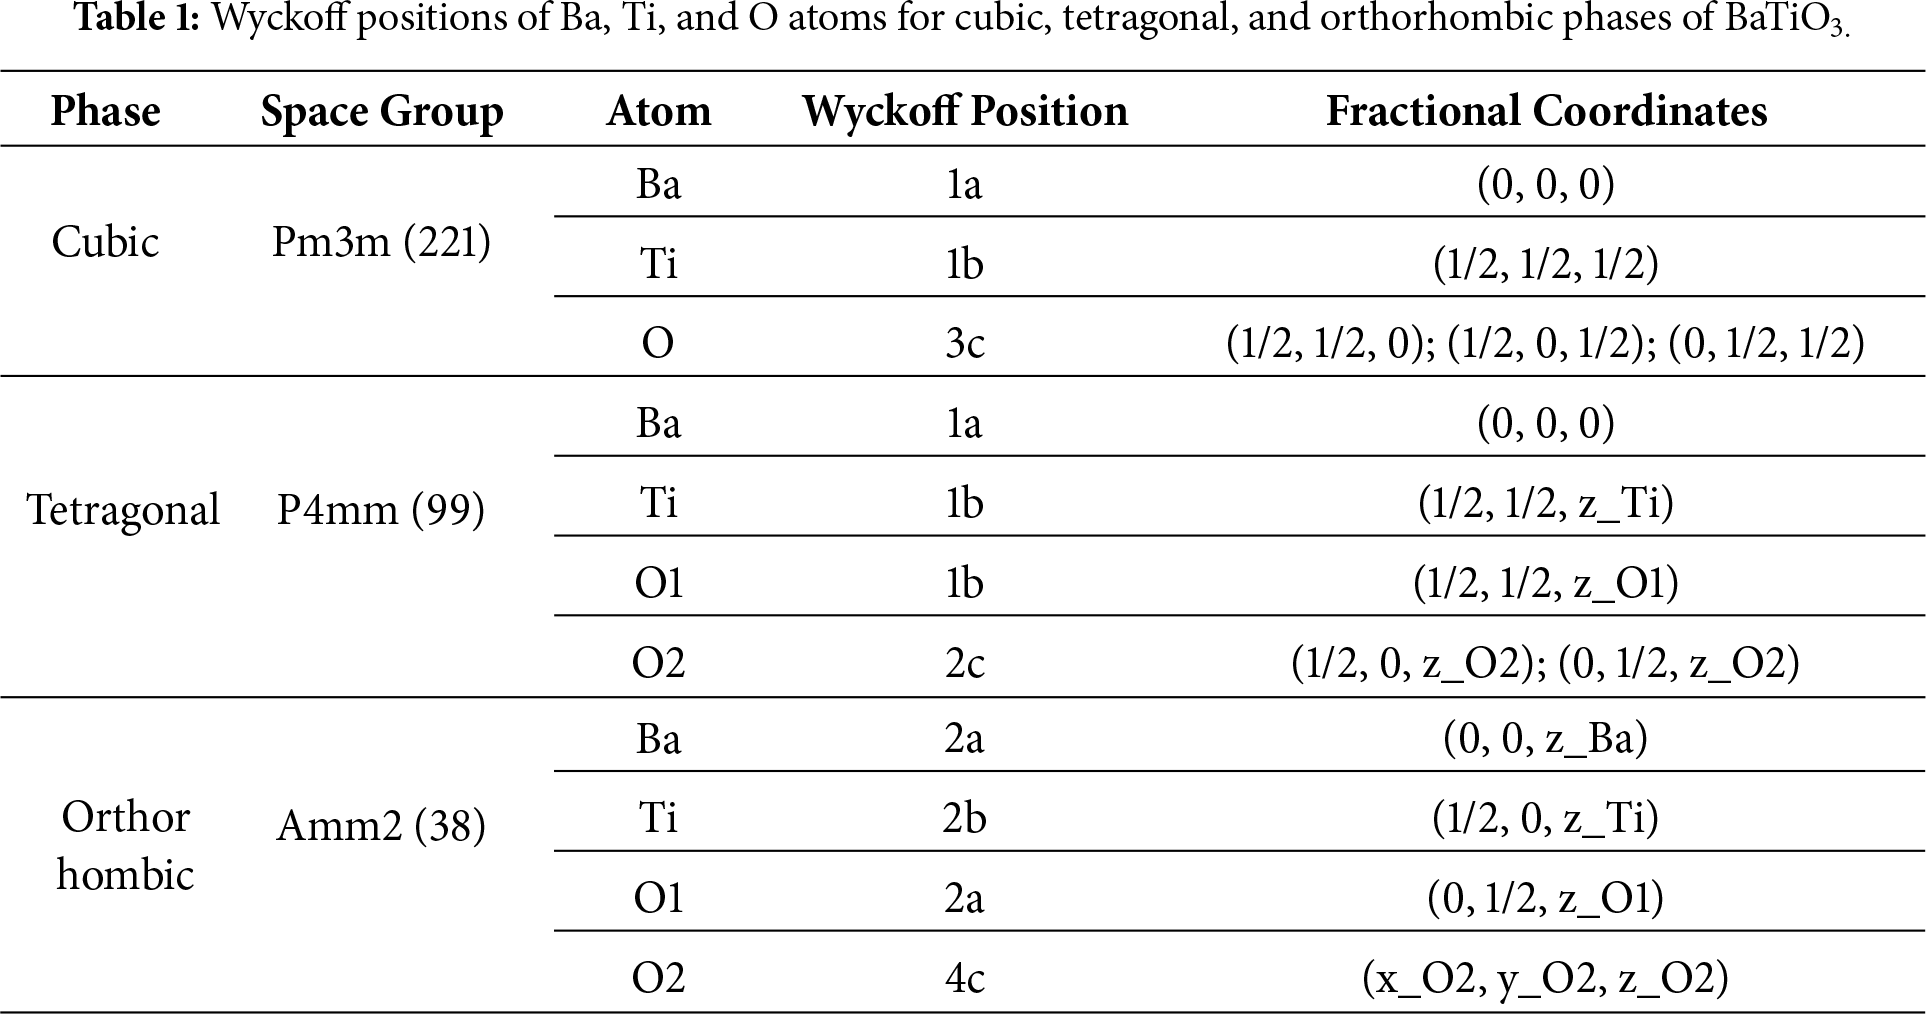
The calculated crystal structures of BaTiO3 in the cubic (Pm3m), orthorhombic (Amm2, C2v), and tetragonal (P4mm, C4v) phases are illustrated in Fig. 1. The Wyckoff positions of Ba, Ti, and O atoms for the cubic, tetragonal, and orthorhombic phases of BaTiO3 are summarized in Table 1. In the cubic Pm3m phase, all atoms occupy high-symmetry Wyckoff sites and the Ti atom remains centered within the oxygen octahedron, resulting in a nonpolar paraelectric structure. In contrast, symmetry lowering in the tetragonal (P4mm) and orthorhombic (Amm2) phases displaces the Ti atom from the octahedral center along the polar direction, giving rise to spontaneous ferroelectric polarization. These phase-dependent changes in Wyckoff positions and atomic coordinates reflect the microscopic origin of ferroelectricity in BaTiO3.
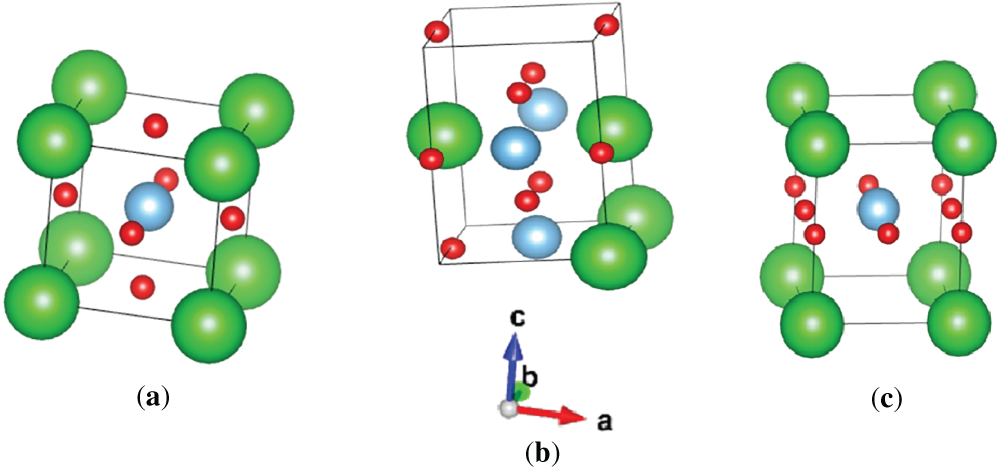
Figure 1: (a) cubic, (b) orthorhombic, and (c) tetragonal structures of BaTiO3 (green: Ba, blue: Ti, and red: O).
The structures were optimized using the GGA-PBE method to determine the ground-state structural parameters. Optimization curves for all three phases are presented in Fig. 2. These curves summarize the computed lattice parameters for the material in its cubic, orthorhombic, and tetragonal phases, along with a comparison with existing experimental and theoretical data presented in Table 2.
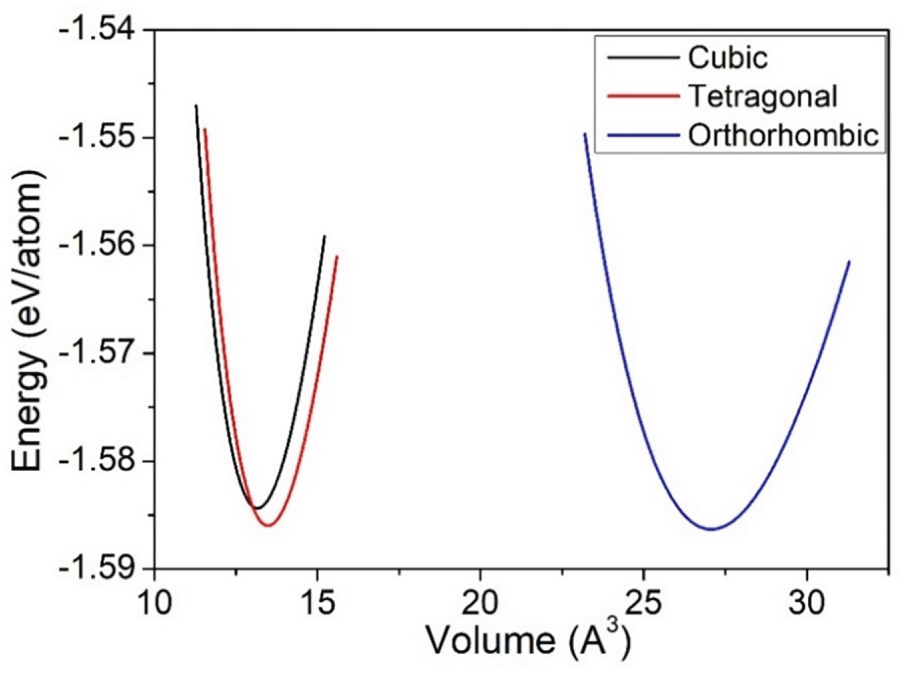
Figure 2: Energy-volume curves for cubic, orthorhombic, and tetragonal structures of BaTiO3.
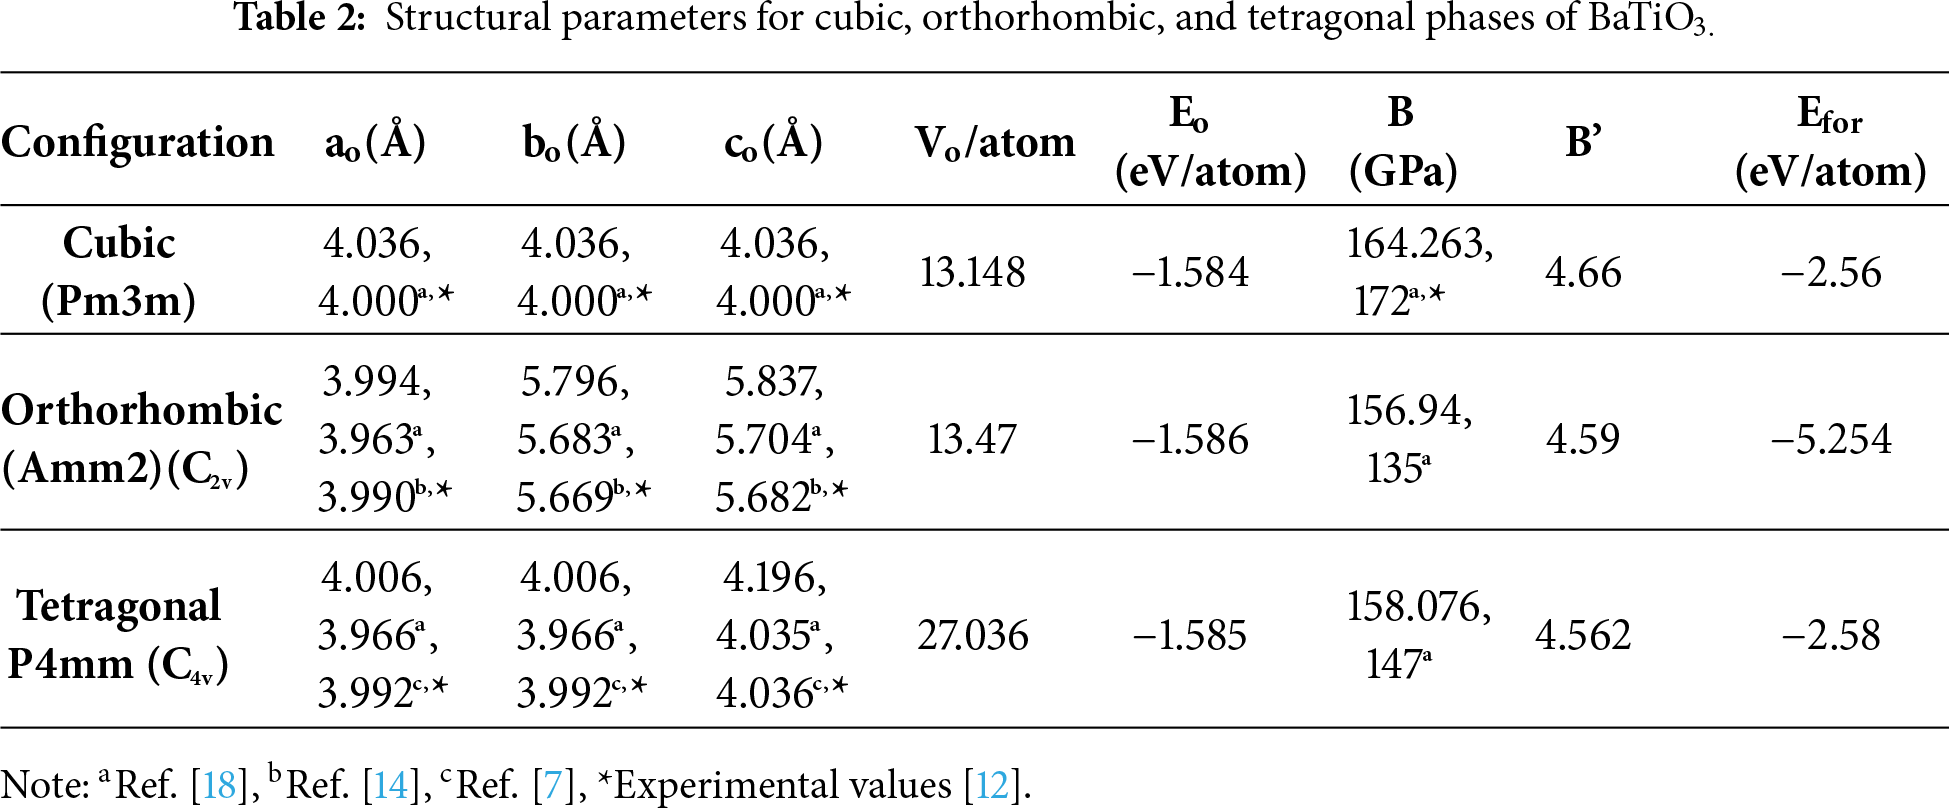
The results in Table 2 show a close agreement between the present results and the corresponding theoretical and experimental results. In addition, Table 2 indicates that the ground state energy (Eo) of the material for all three phases are negative and nearly equal to each other, indicating that there is a slight variation in the stability of the material between the three phases. The resistance to uniform compression is measured by the bulk modulus (B), which is the ratio of the change in pressure to the change in volume. Although there is a slight variation in the bulk modulus across the three phases, the larger the bulk modulus, the greater the incompressibility/greater the force required to compress the material; therefore, the results presented in Table 2 indicate that the orthorhombic phase exhibits the lowest bulk modulus, indicating that it is the most compressible phase, while the cubic phase shows the highest resistance to uniform compression. The way that the bulk modulus of BaTiO3 changes with respect to applied pressure can be seen by taking the first derivative of the bulk modulus as a function of pressure. It shows how much a material can be compressed under different levels of pressure and ultimately helps determine at what pressure it is most resistant to compaction. As shown in Table 2, the first derivative of BaTiO3’s bulk modulus (B’) has a positive value, meaning that B rises with increasing pressure and becomes less compressible at higher pressures. We also determined the formation energy (Efor) for all three phases of BaTiO3 in eV/Atom, all of which have negative values, indicating that all three phases are thermodynamically stable and can therefore be produced experimentally. The orthorhombic phase has the most negative value of Efor, which means it is the most thermodynamically stable phase of the three and thus is most likely to be produced. Although the orthorhombic phase is the most thermodynamically stable based on formation energy, it exhibits a comparatively lower bulk modulus, reflecting enhanced lattice flexibility associated with ferroelectric distortion.
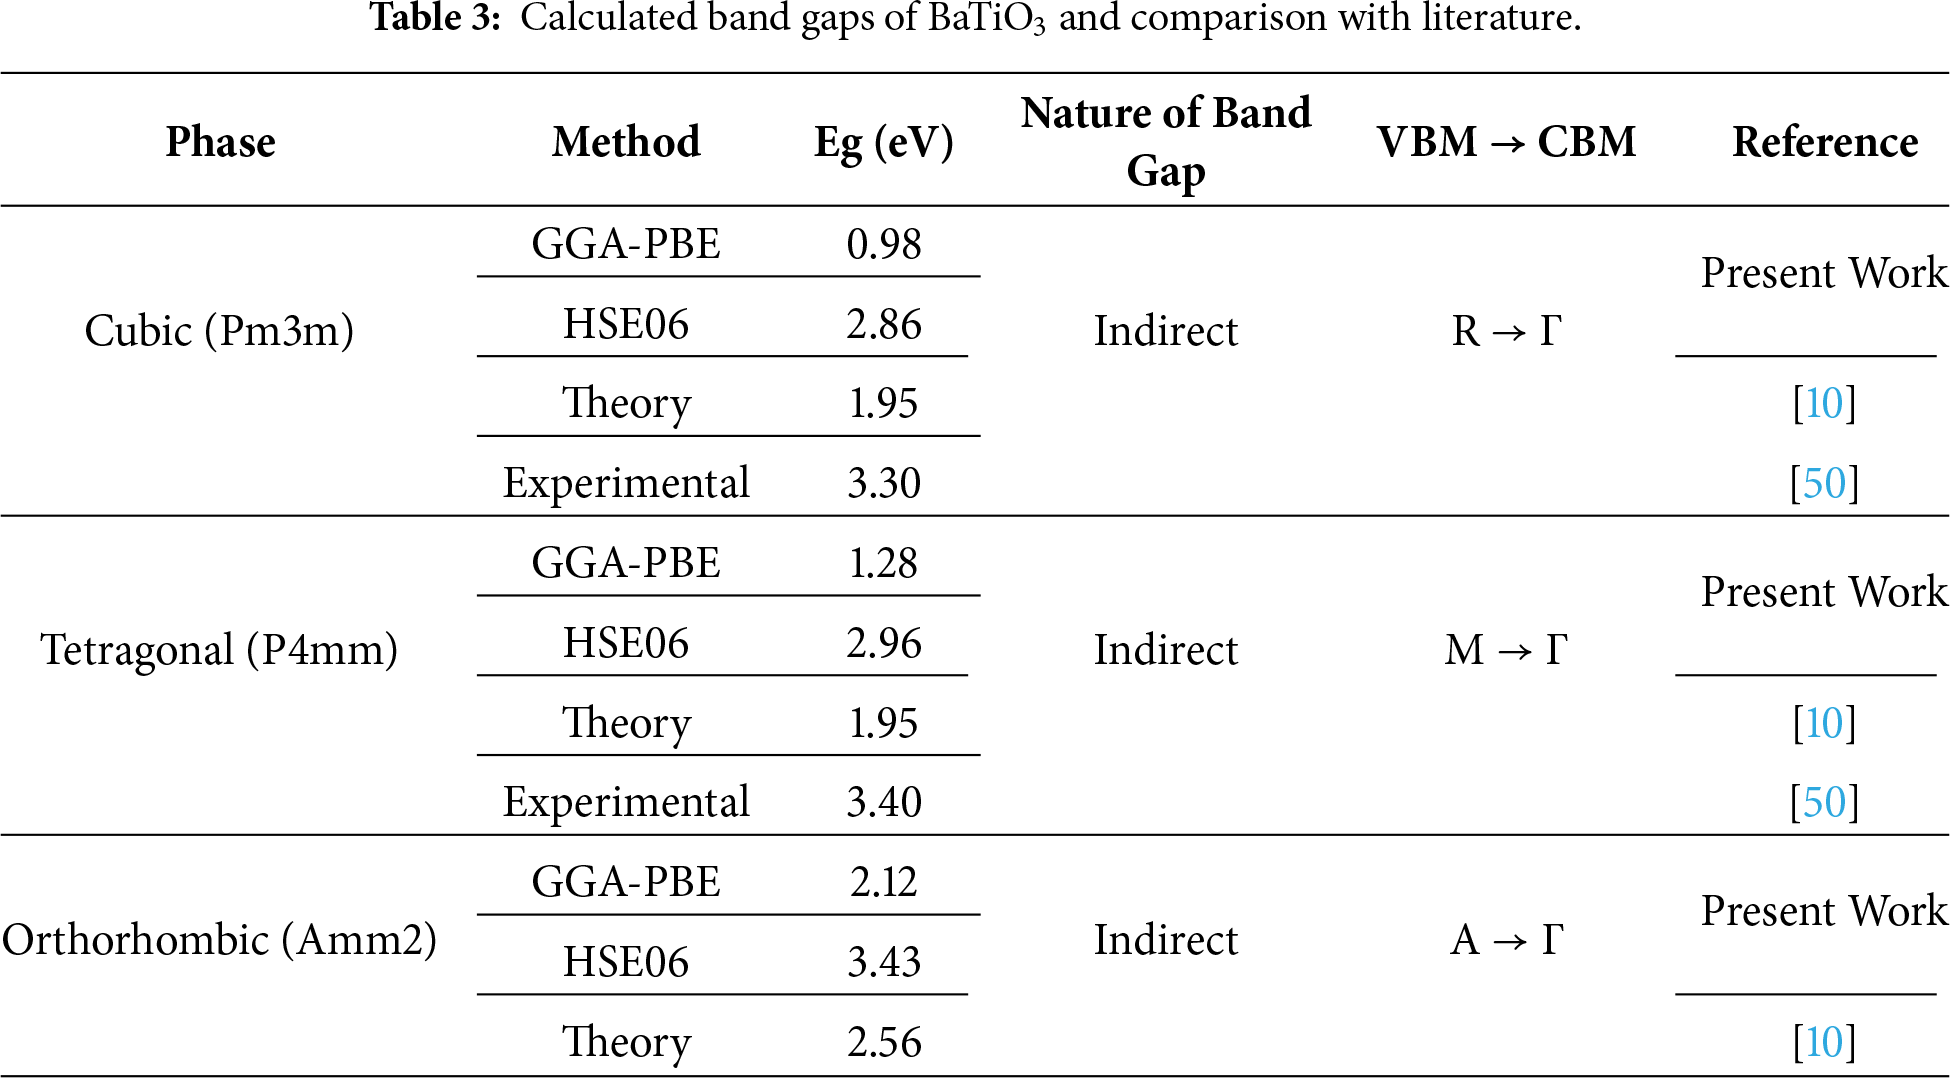
To evaluate the broad applications of the investigated material, it is critical to determine its precise band gap. To accomplish this task, a first-principles method is used to obtain accurate values of band gap and other electronic parameters. The electronic band structures and total density of states (TDOS) of BaTiO3 in its cubic, tetragonal, and orthorhombic phases were calculated using the GGA-PBE and HSE06 exchange-correlation functionals (Fig. 3). In all phases, BaTiO3 exhibits a semiconducting character with an indirect band gap, where the valence band maximum (VBM) and conduction band minimum (CBM) occur at different high-symmetry k-points. The GGA-PBE functional underestimates band gaps, while the HSE06 hybrid functional provides significantly improved agreement with experimentally reported optical band gaps (3.3 eV) [50]. A systematic increase in the band gap is observed with decreasing structural symmetry (cubic < tetragonal < orthorhombic), which can be attributed to enhanced lattice distortion and Ti off-centering in the lower-symmetry ferroelectric phases [2]. The bandgap values of the considered compound in all three phases, computed in the present study and in previous theoretical and experimental studies, are presented in Table 3.
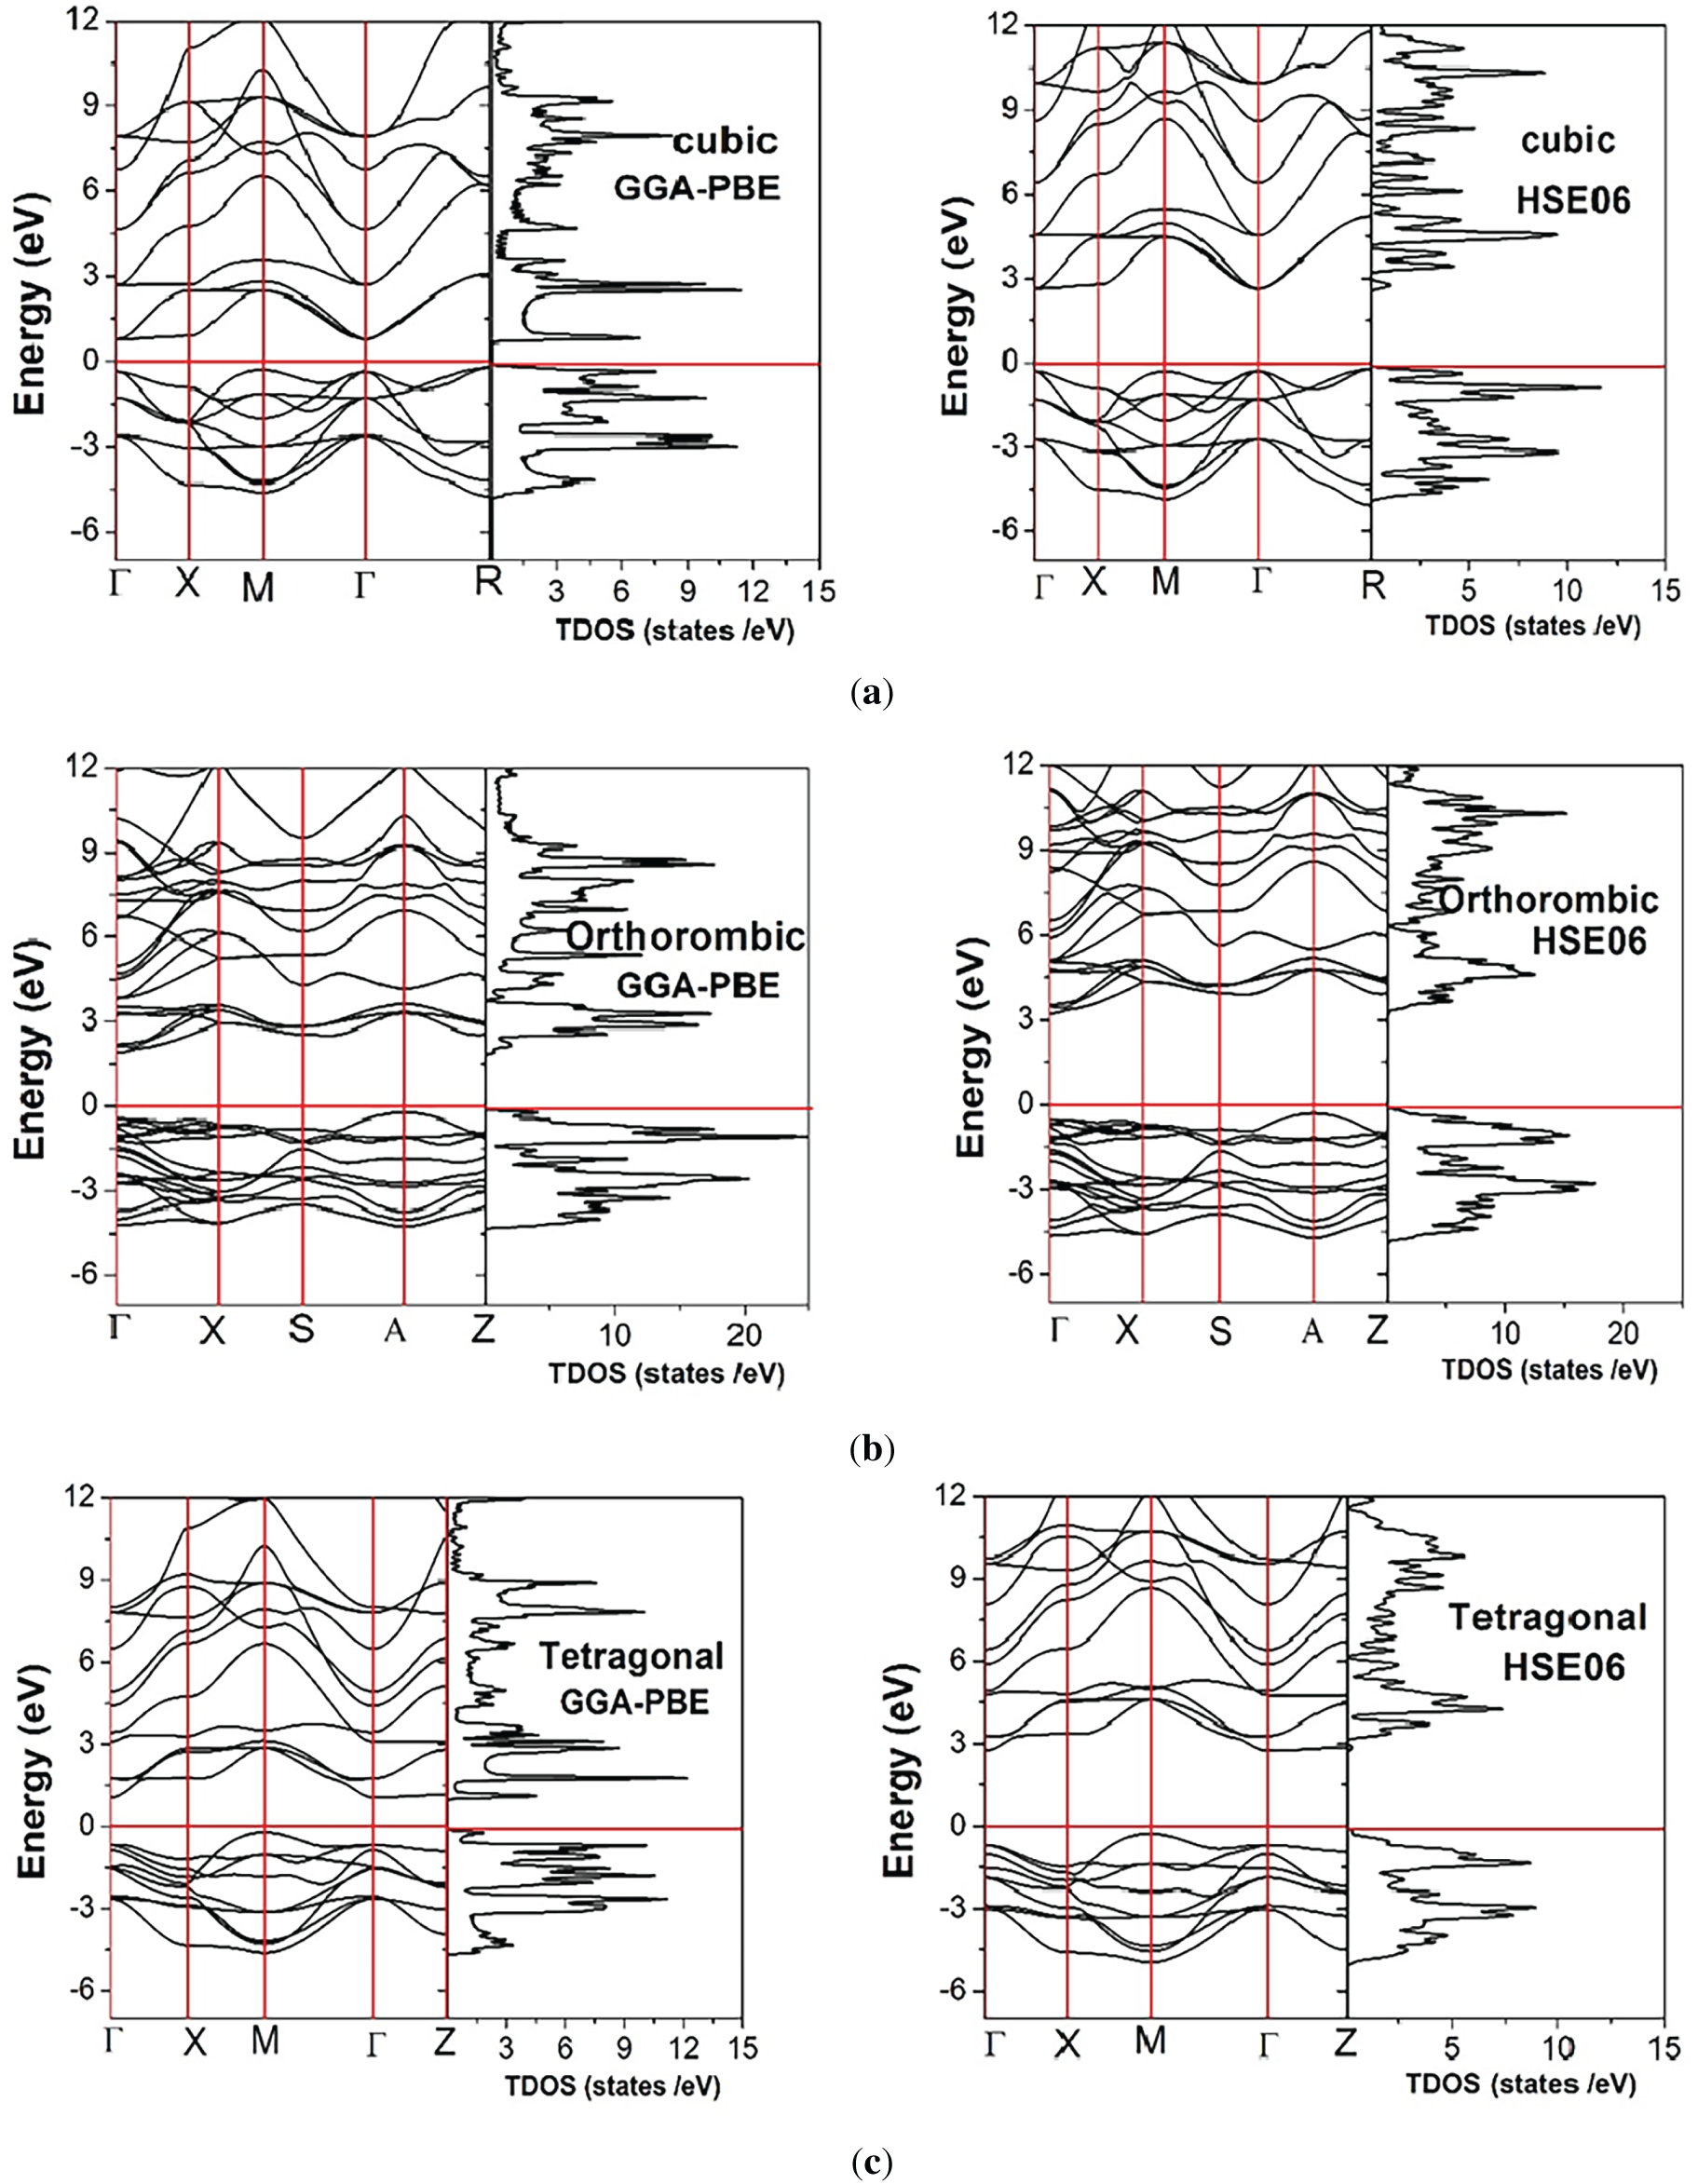
Figure 3: Electronic band structure and total density of states for (a) cubic, (b) orthorhombic, and (c) tetragonal phases of BaTiO3, using GGA-PBE and HSE06 potential functionals.
The total and projected density of states (TDOS/PDOS) of BaTiO3 in its cubic, orthorhombic, and tetragonal phases were calculated using the HSE06 hybrid functional and are shown in Fig. 4a–c. In all cases, the Fermi level (EF) is set to zero energy. A clear band gap separating the valence and conduction regions is observed for all phases, confirming the semiconducting nature of BaTiO3 and the improved gap description provided by the hybrid functional. For the cubic phase, the valence band region extending from approximately −6 eV up to the valence band maximum is predominantly composed of O-2p states, with a minor contribution from Ti-3d states near the upper valence edge. The conduction band onset is mainly governed by Ti-3d states, while Ba-derived states contribute primarily at much higher energies. This orbital distribution reflects the characteristic Ti–O covalent hybridization in perovskite oxides and is consistent with the paraelectric nature of the high-symmetry cubic structure. The absence of significant Ti-3d weight at the Fermi level further confirms the insulating character of the cubic phase. In the orthorhombic phase, a noticeable redistribution of electronic states near both the valence and conduction band edges is observed. Compared to the cubic phase, the PDOS shows enhanced splitting of the Ti-3d states in the conduction band, attributed to symmetry lowering and increased lattice distortion. The O-2p states remain dominant in the valence band; however, their bandwidth and peak structure indicate stronger anisotropy and modified Ti–O bonding. This enhanced orbital splitting contributes to the larger band gap observed in the orthorhombic phase and reflects stronger electronic localization associated with the ferroelectric distortion. For the tetragonal phase, the PDOS characteristics lie between those of the cubic and orthorhombic phases. The tetragonal distortion lifts the degeneracy of the Ti-3d orbitals, leading to moderate splitting at the conduction band edge. The O-2p dominated valence band exhibits a slightly narrower bandwidth than in the cubic phase, indicating reduced orbital overlap along the polar axis. The hybridization between Ti-3d and O-2p states near the band edges remains pronounced, underscoring the role of Ti off-centering in stabilizing the ferroelectric phase. A comparative analysis across the three phases demonstrates that the degree of Ti-3d orbital splitting and O-2p bandwidth modulation increases with decreasing crystal symmetry (cubic → tetragonal → orthorhombic). This trend directly correlates with the phase-dependent lattice distortions and Ti atom displacement from the center of the oxygen octahedron. Importantly, the HSE06 functional not only corrects the band gap underestimation inherent to GGA-based approaches but also preserves the physically meaningful orbital character and hybridization trends across different phases.
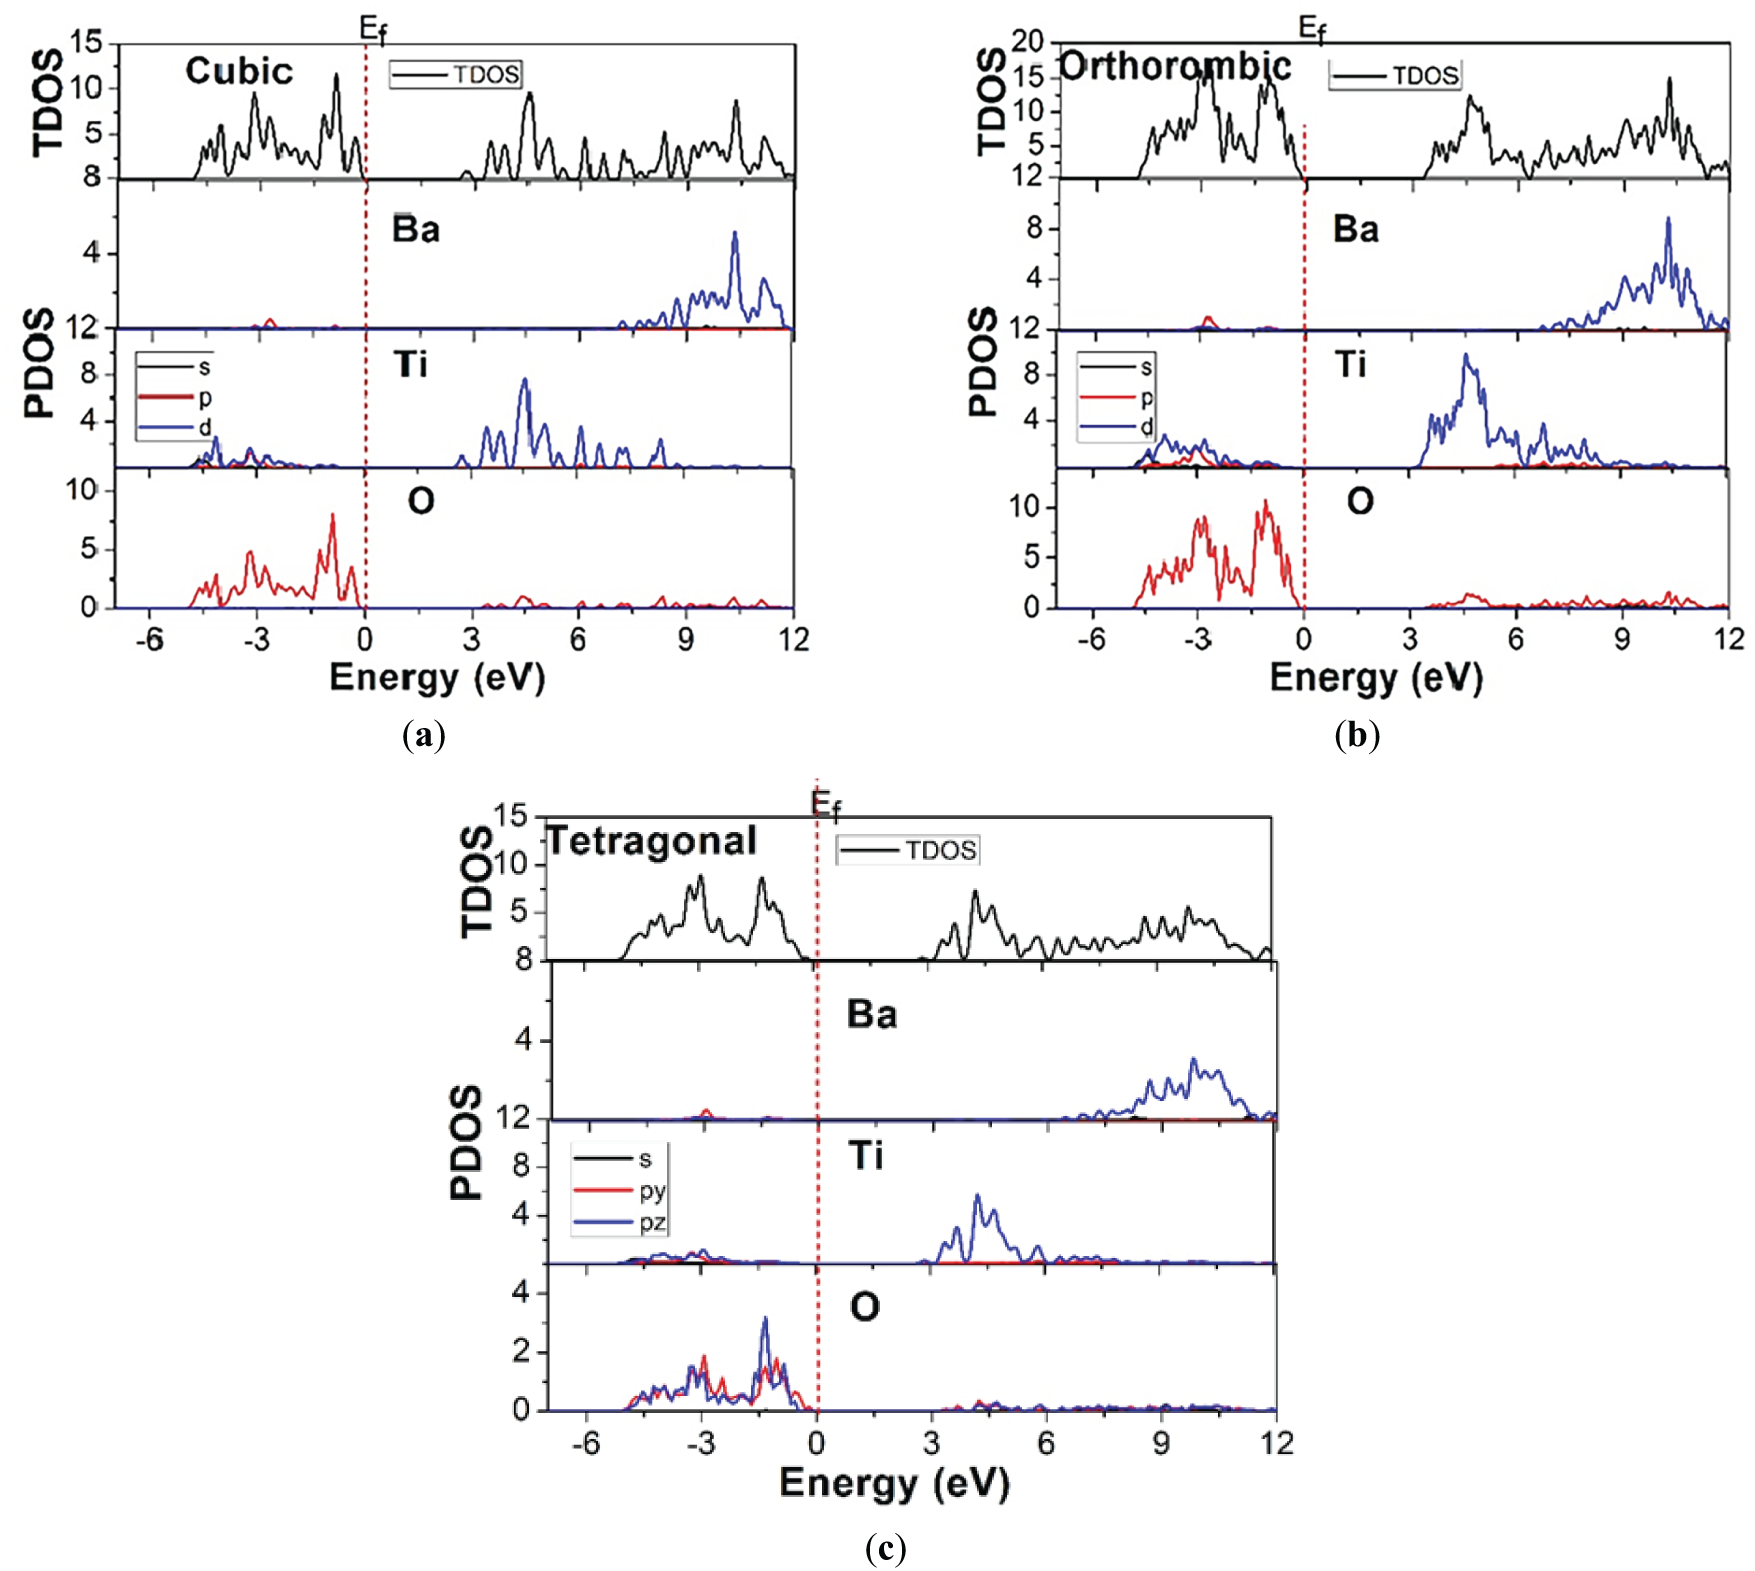
Figure 4: Total and Partial density of states for (a) cubic, (b) orthorhombic, and (c) tetragonal phases of BaTiO3.
A good understanding of the optical properties of materials is essential to determine how well optoelectronic devices perform. The transverse dielectric function describes how materials respond to linearly varying light fields and how well they store charge under an electric field. It is essential because it describes how the material responds to photon-electron interactions through momentum and energy transfer. Momentum transfer can be thought of as the movement of the interacting particles, while the energy transfer refers to a change in their corresponding energies. With respect to solar radiation and such lower energies, momentum transfer is typically very low (≈0) so that the electric dipole approximation can be used. Under this assumption, the frequency-dependent dielectric function can be formally expressed as [51]:
Eq. (1) denotes the real (R) and imaginary (Im) parts of the dielectric constants as ε1(ω) and ε2(ω), respectively. The components of the dielectric constants can be computed by examining the direct transitions between conduction band states and valence band states. The dielectric function ε(ω) indicates how polarized a material becomes in an electric field and is influenced by the density of states (DOS), the material’s electric polarizability, and the presence of free charges or ions.
As illustrated in Fig. 5a,b, the real component ε1(ω) and imaginary components ε2(ω) of the dielectric function were estimated using the HSE06 functional in the energy range of 0–15 eV. This investigation was conducted to explore the optical response of the cubic, orthorhombic, and tetragonal phases of the BaTiO3 compound. The static real part ε1 (0), i.e., the dielectric constant for all three phases of the BaTiO3 compound, is found to be 4.7, 4.4, and 4.5, respectively. The real part of the dielectric function (ε1(ω)) is responsible for the description of the dispersive behaviour and the response to polarization of the material under consideration. Within the low-energy region (IR to visible range, below ~3.1 eV), ε1(ω) manifests comparatively elevated positive values for all phases, thereby signifying robust dielectric polarization and normal dispersion. The static dielectric constant (ε1(0)) is observed to be highest for the orthorhombic phase, followed by the tetragonal and cubic phases. It indicates increased lattice distortion and enhanced polarizability in the lower-symmetry ferroelectric phases. As the photon energy increases towards the UV region, the parameter ε1(ω) gradually decreases and exhibits pronounced oscillations associated with interband electronic transitions. The crossing of ε1(ω) through zero at higher energies suggests the onset of plasma-like behaviour and reduced reflectivity in this spectral range. The imaginary part of the dielectric function, ε2(ω), directly represents optical absorption arising from interband electronic transitions. In Fig. 5b, the prominent peaks for ε2(ω) are noticed at 5.3 eV for all phases. The peaks in ε2(ω) exhibit inconsistent features in the visible and UV regions. The affirmative values of ε2(ω) signify zones of optical absorption. For all three phases, the parameter ε2(ω) remains almost negligible in the IR and across most of the visible region, thereby confirming the optical transparency of the material below the fundamental band gap. A sharp rise in ε2(ω) is observed at energies close to the optical absorption edge (~3–4 eV), corresponding to transitions from O-2p dominated valence bands to Ti-3d dominated conduction bands. The absorption onset occurs at the boundary between the visible and UV regions, consistent with BaTiO3’s wide-band-gap semiconductor nature. A comparative analysis reveals that a decrease in crystal symmetry (cubic → tetragonal → orthorhombic) results in an overall enhancement of both ε1(ω) in the low-energy region and ε2(ω) peak intensities in the UV range. This phenomenon underscores the profound interconnection between the crystal structure, ferroelectric distortion, and optical response in BaTiO3.
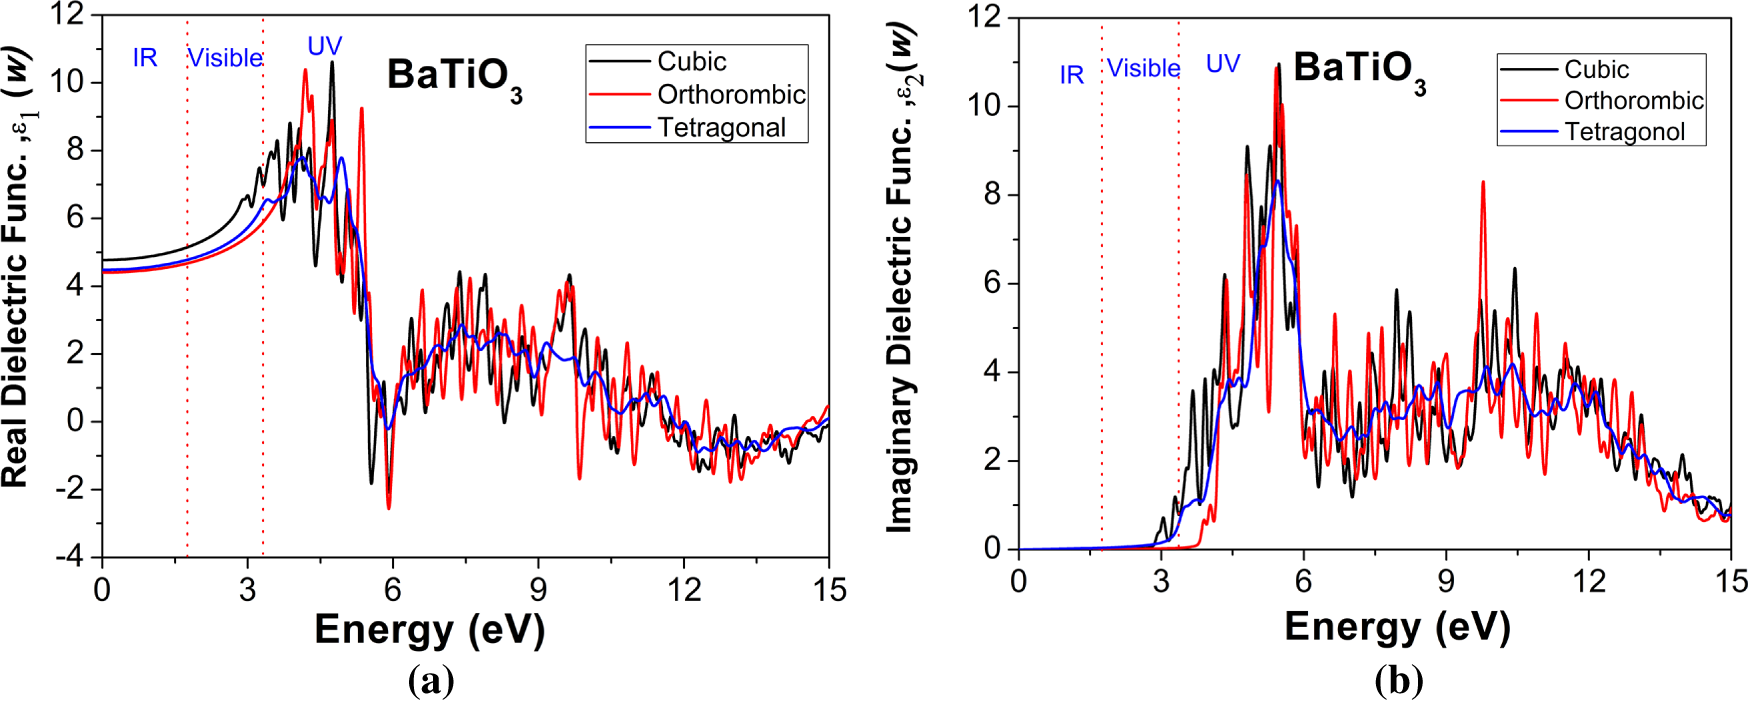
Figure 5: Variation in (a) Real and (b) Imaginary part of Dielectric function for cubic, orthorhombic, and tetragonal phases of the BaTiO3 compound with incident radiation’s energy.
The expression for the absorption coefficient α(ω) is as follows [52]:
As shown in Fig. 6a, α(ω) represents the fraction of light intensity attenuated per unit distance by a material. The absorption spectra reveal that all three phases have minimal absorption in the IR and most of the visible spectrum, confirming that BaTiO3 is optically transparent at low photon energies. A sharp rise in the absorption coefficient occurs near the visible–UV boundary (around 3–4 eV), which aligns with the fundamental optical band edge. This onset of absorption is linked to interband electronic transitions from O-2p valence bands to Ti-3d conduction bands, consistent with electronic structure and dielectric analyses. In the UV range, the absorption coefficient quickly climbs to 105–106 cm−1, indicating strong light–matter interaction and efficient photon absorption at higher energies. Notably, UV absorption varies with phase: the orthorhombic phase exhibits slightly higher absorption and more distinct peak structures than the cubic phase, while the tetragonal phase shows intermediate behavior. It suggests increased lattice distortion and stronger Ti–O orbital hybridisation in the lower-symmetry ferroelectric phases, enhancing electronic transitions and broadening absorption features.
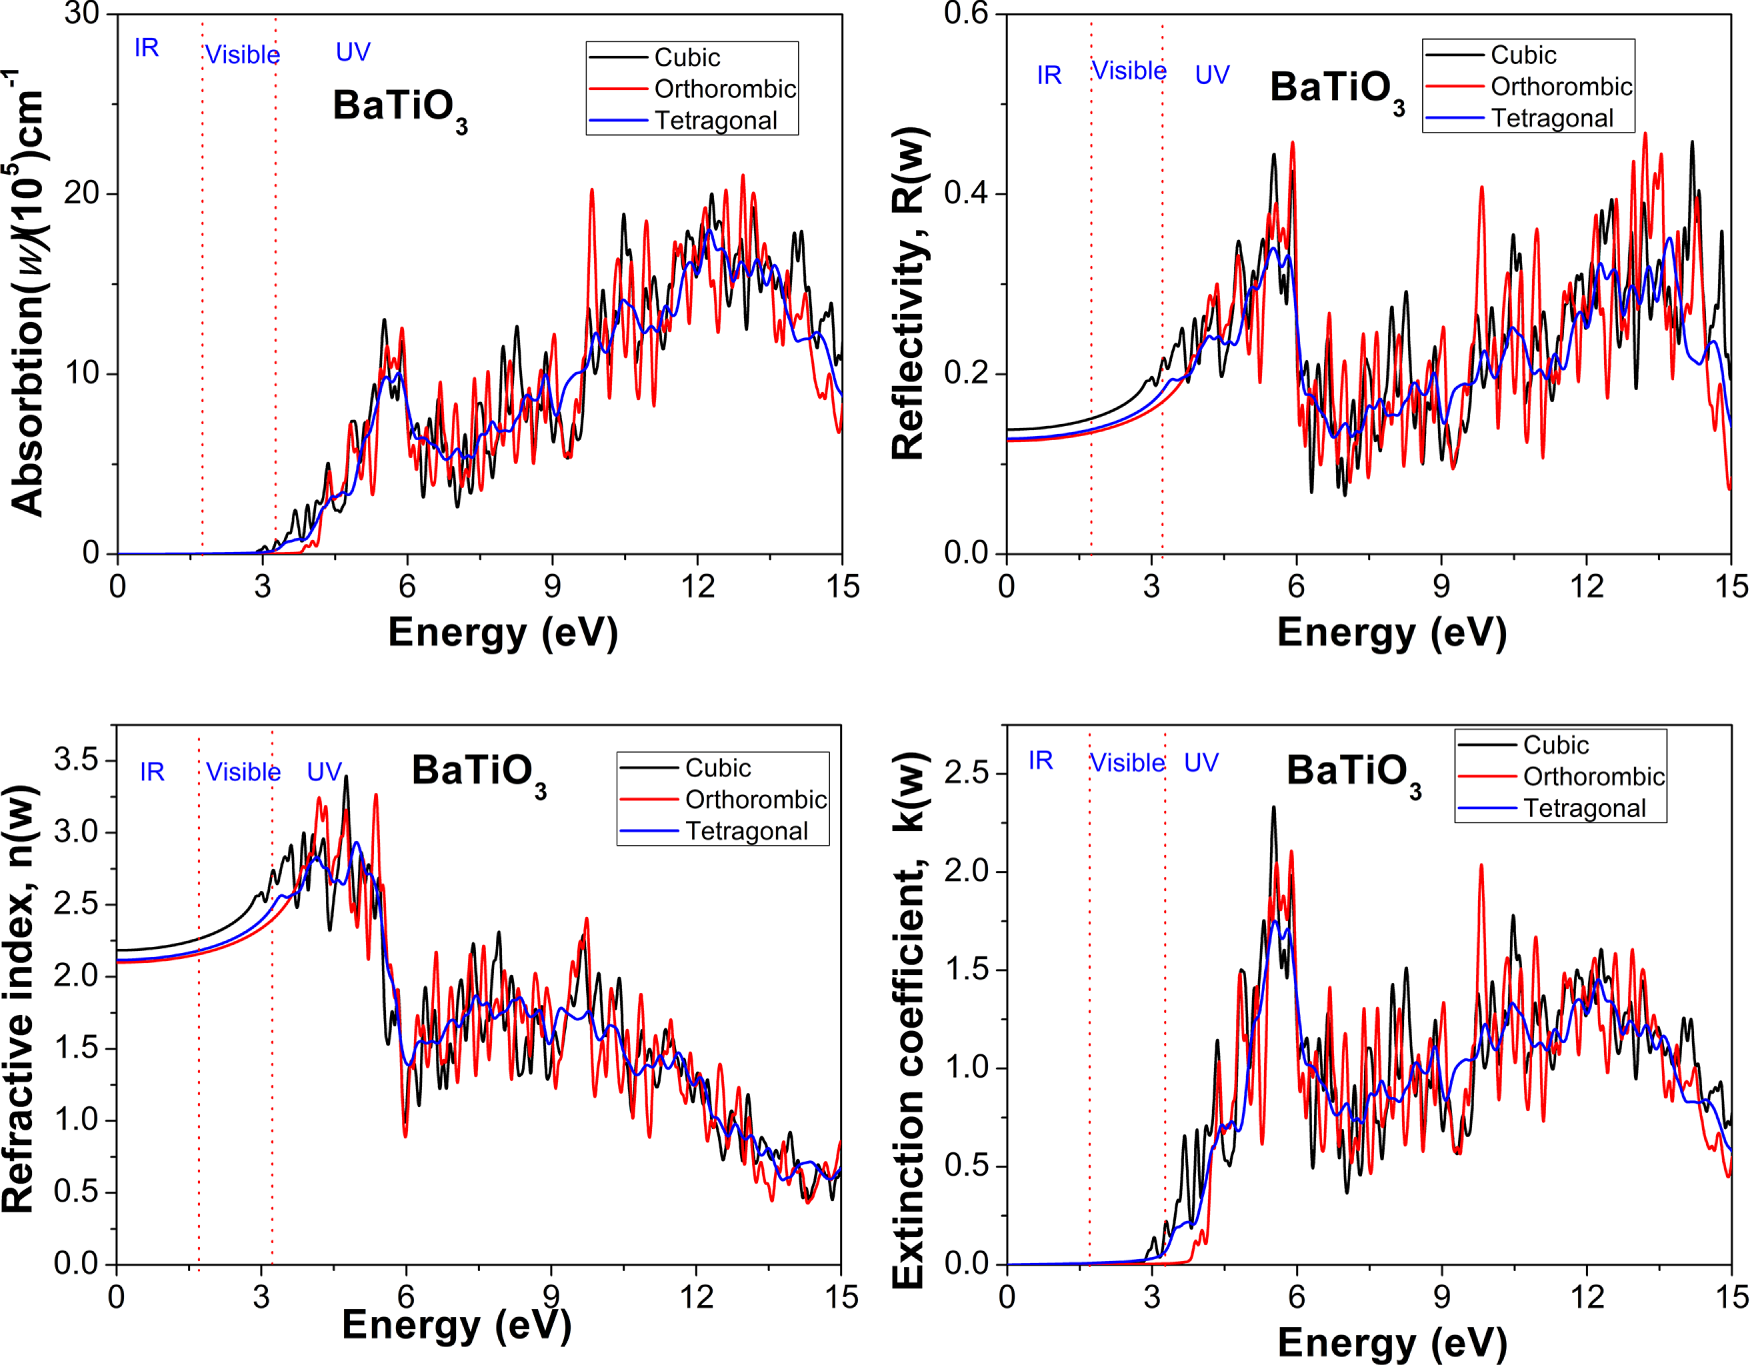
Figure 6: Spectra of (a) Absorption, (b) Reflectivity, (c) Refractive index, and (d) Extinction coefficient for cubic, orthorhombic, and tetragonal phases of BaTiO3 compound.
A compound’s reflectance and reflectivity spectra indicate whether or not it is an excellent candidate to be an ideal absorber. The reflectivity ‘R(ω)’ and refractivity spectra ‘n(ω)’, which are shown in Fig. 6b,c for the materials under study, can be analyzed to define the optical behavior of a material. These can be expressed mathematically in the following way:
where,
R(ω), the reflection coefficient, measures the quantity of electromagnetic (EM) radiation reflected from the approaching surface. Fig. 6b shows how R(ω) varies with energy. The reflectivity spectra further support these observations. In the IR and visible regions, BaTiO3 exhibits relatively low, slowly varying reflectivity, consistent with its transparency and weak absorption in these energy ranges. As the photon energy increases toward the UV region, the reflectivity rises markedly, with several peaks corresponding to strong interband transitions. Among the three phases, the orthorhombic phase exhibits the highest reflectivity peaks in the UV range, followed by the tetragonal and cubic phases, indicating stronger optical response and greater electronic polarization in the distorted ferroelectric phases. The graph shows that each phase reflects energy between 3 and 15 eV. Nevertheless, the energy reflectance steadily decreases to negligible values around 18 eV, so that the higher the energy of the electromagnetic radiation, the less efficient the material is at reflection.
Refractivity ‘n(ω)’ is another significant optical property that is described by the measurement of the refractive index, and is used to explain how long it takes the light waves to get through a material. The n(0) value of BaTiO3 for the cubic, orthorhombic, and tetragonal phases is 2.18, 2.09, and 2.12, respectively. In the IR and visible regions (below ~3.1 eV), the refractive index exhibits relatively high, slowly varying values across all phases, indicating strong polarization and low optical losses. Among the three phases, the orthorhombic phase shows the highest refractive index, followed by the tetragonal and cubic phases. This trend reflects the enhanced polarizability and stronger lattice distortion in the lower-symmetry ferroelectric phases. The elevated n(ω) values in this energy range are consistent with the large real part of the dielectric function (ε1(ω)) previously discussed.
The extinction coefficient k(ω) describes the absorbance of energy and is plotted with incident energy for the three different phases of the material BaTiO3, as indicated in Fig. 6d. The peak of k(ω) is at 4.85 eV and stronger in the visible region, indicating that the greatest amount of sunlight will be absorbed in the materials of the visible region. The extinction coefficient (k(ω)) remains nearly zero in the IR and most of the visible region, confirming the optical transparency of BaTiO3 at low energies. A sharp increase in k(ω) is observed near the absorption edge (~3–4 eV), in agreement with the rapid rise in the absorption coefficient and the imaginary part of the dielectric function (ε2(ω)). In the UV region, k(ω) exhibits several prominent peaks associated with intense interband transitions from O-2p valence states to Ti-3d conduction states. Phase-dependent differences are again evident in the UV range. The orthorhombic phase displays the largest k(ω) values and the most pronounced spectral features, indicating stronger absorption and higher optical losses at high photon energies. The tetragonal phase shows intermediate behavior, while the cubic phase exhibits comparatively weaker absorption features. These trends correlate directly with the degree of lattice distortion and Ti off-centering, which enhance orbital splitting and electronic localization in the lower-symmetry phases. Also, the correlation between k(ω) and the energy is identical to the correlation of ε2(ω) and the energy, since k(ω) is going to be used to determine how fast the material will absorb the light.
The quasi-harmonic Debye model was employed in the Gibbs2 code [49] to calculate the thermal parameters. The total energies of different primitive cells were compared to determine their macroscopic thermal behavior at different temperatures and pressures. These total energy quanta played a vital role in the computation of the thermal properties [53]. BaTiO3’s thermodynamic parameters are examined over 0–1000 K in temperature and 0–30 GPa in pressure. Figs. 7–16 illustrate the impacts of temperature and pressure on the following quantities: volume (‘V’), bulk modulus (‘B’), Debye temperature (‘θD’), Grüneisen parameter (‘γ’), thermal expansion (‘α’), and heat capacity (‘Cv’). The deviations of V/V0 with respect to pressure at distinct temperatures for the cubic, orthorhombic, and tetragonal phases of the BaTiO3 compound are shown in Fig. 7. The V/V0 ratio decreases with increasing pressure and temperature for all configurations, confirming the reliability of our computed results.
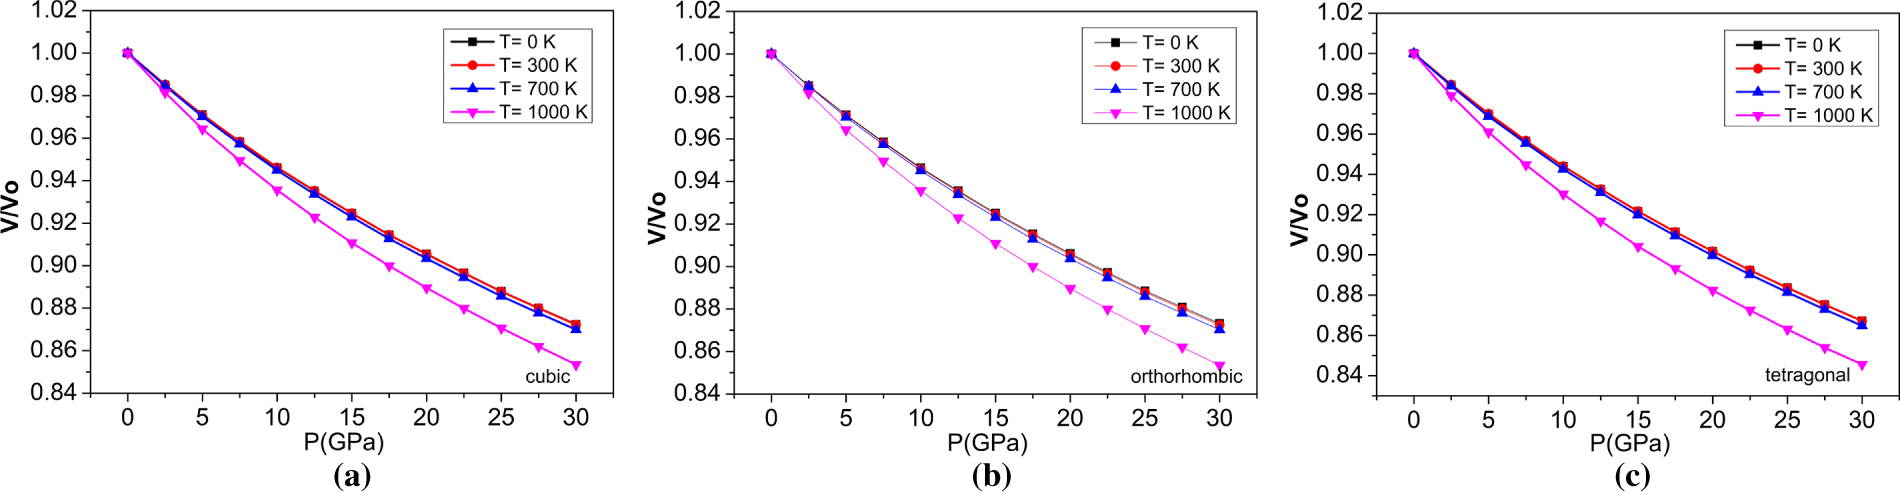
Figure 7: The variations of V/V0 with pressure at different temperatures for (a) cubic, (b) orthorhombic, and (c) tetragonal phases of the BaTiO3 compound.
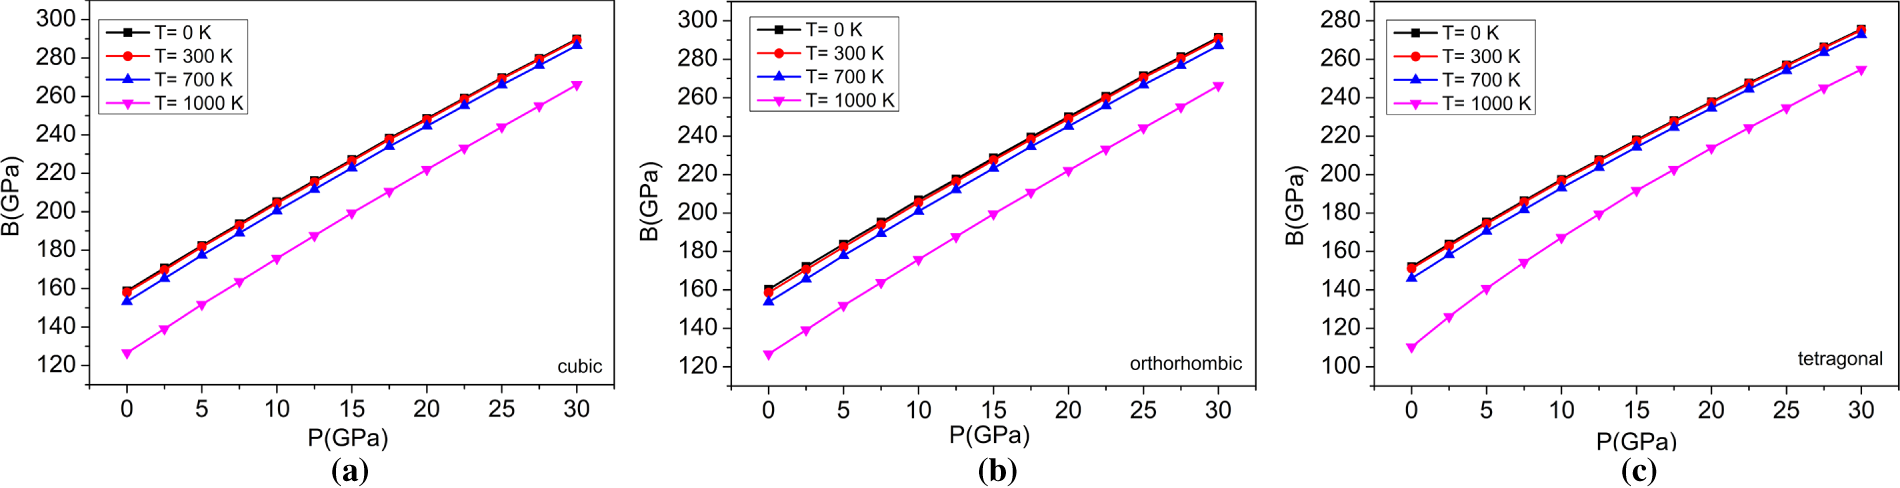
Figure 8: The variations of Bulk modulus with pressure at different temperatures for (a) cubic, (b) orthorhombic, and (c) tetragonal phases of the BaTiO3 compound.
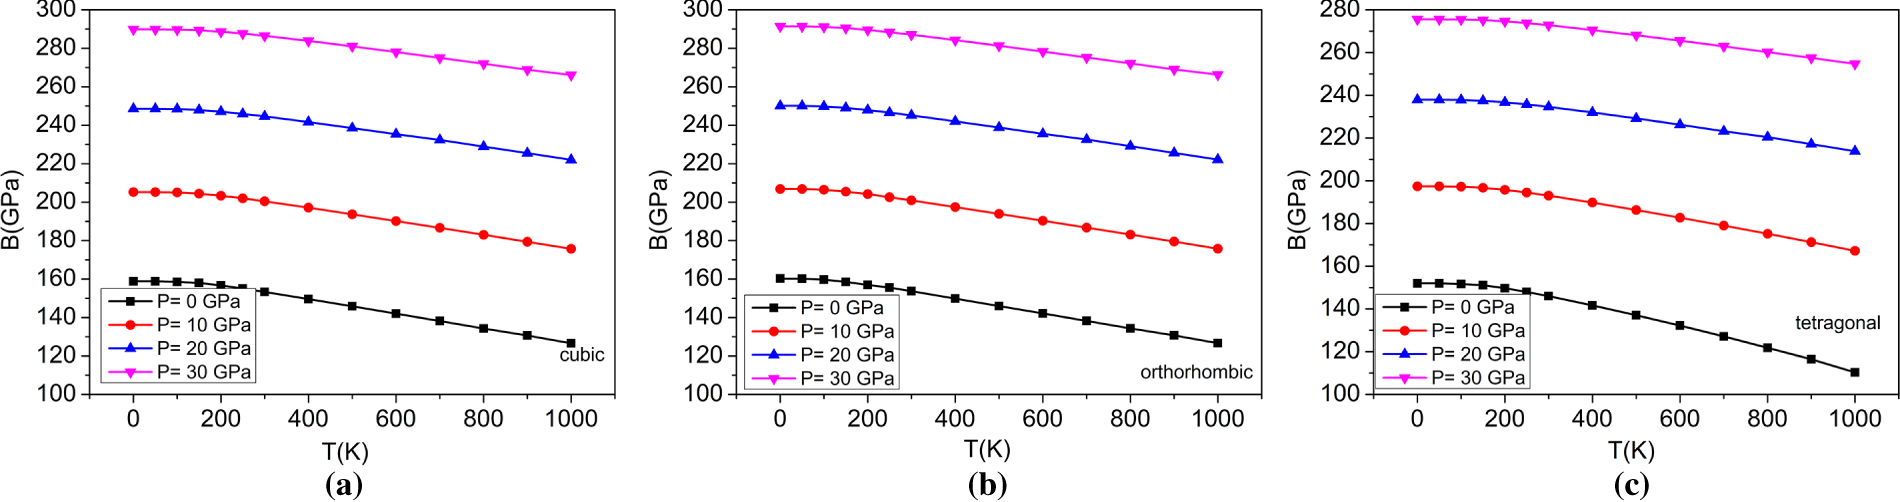
Figure 9: The variations of Bulk modulus with the temperature at different pressures for (a) cubic, (b) orthorhombic, and (c) tetragonal phases of the BaTiO3 compound.
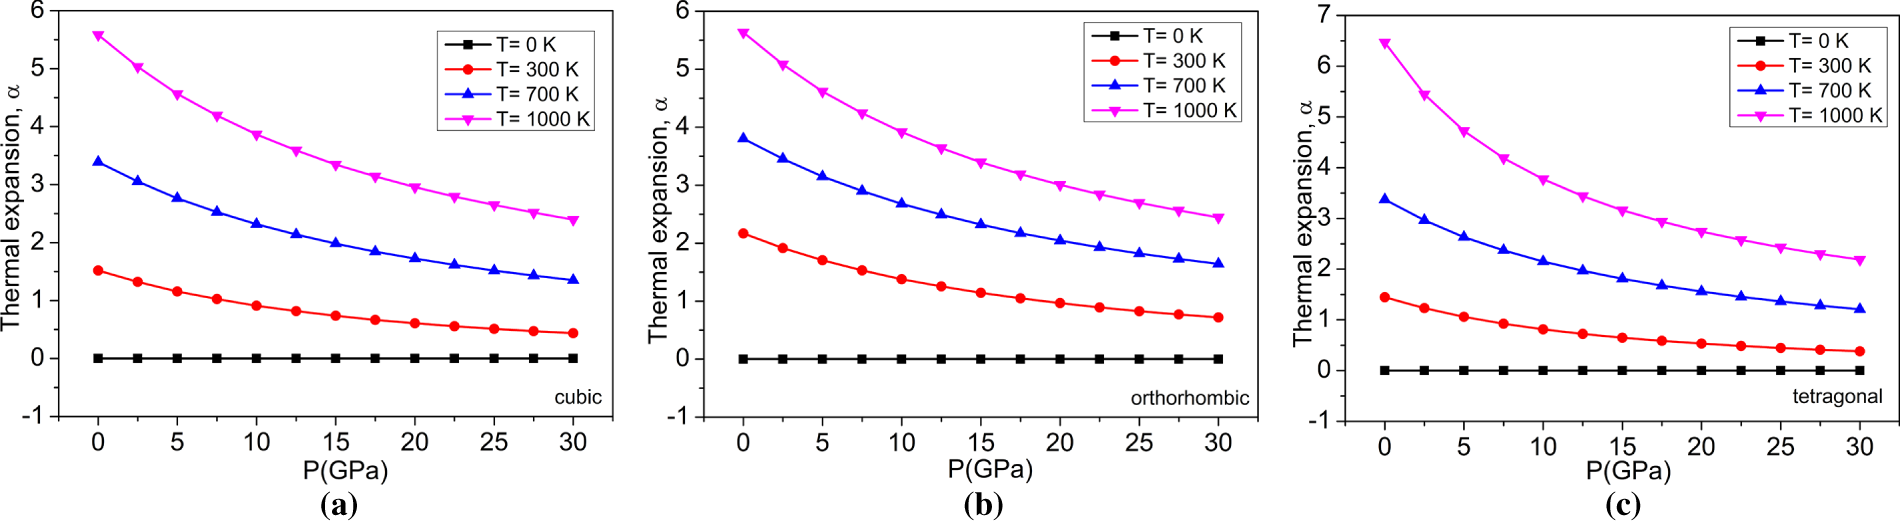
Figure 10: The variations of thermal expansion (×105 K−1) with pressure at different temperatures for (a) cubic, (b) orthorhombic, and (c) tetragonal phases of the BaTiO3 compound.
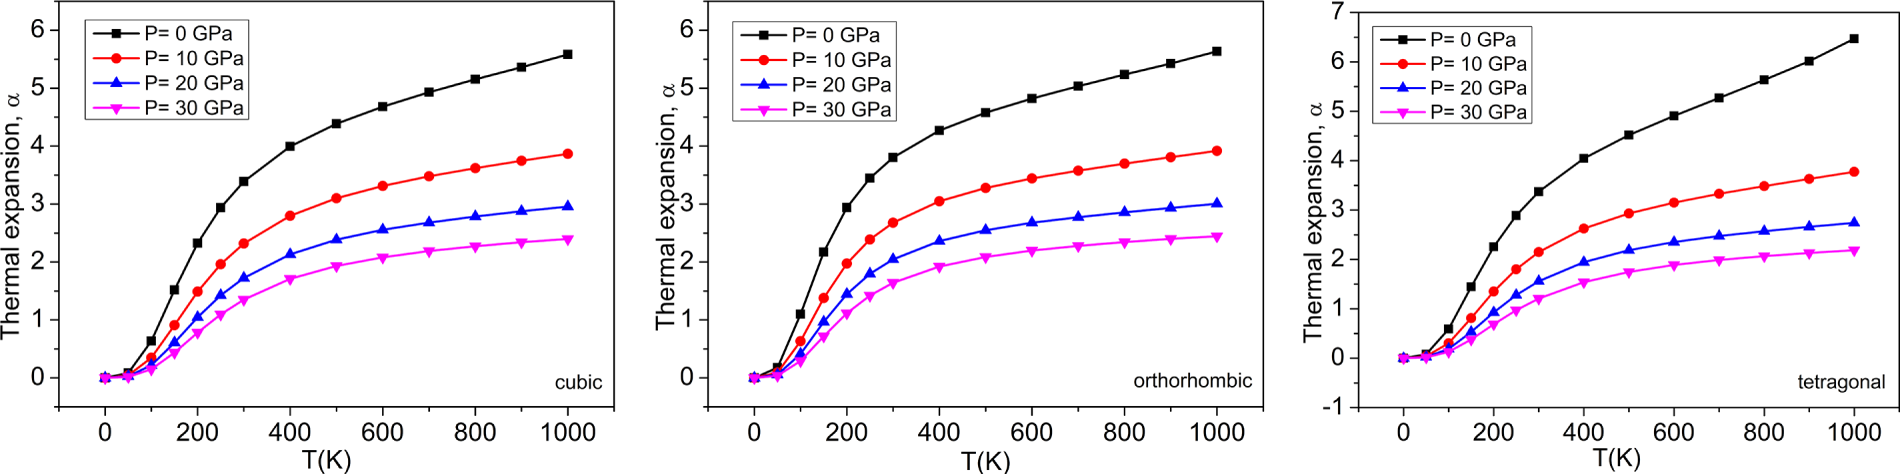
Figure 11: The variations of thermal expansion (×105 K−1) with temperatures at different pressures for (a) cubic, (b) orthorhombic, and (c) tetragonal phases of the BaTiO3 compound.
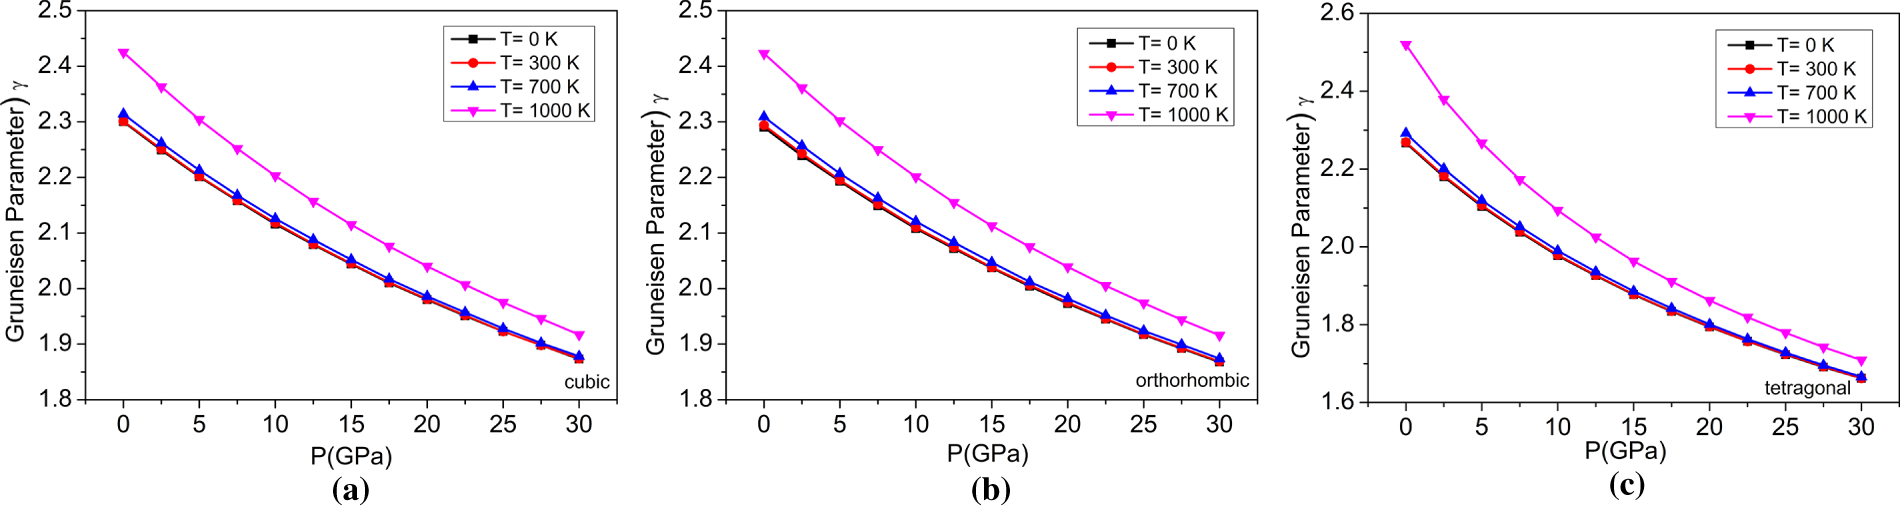
Figure 12: The variations of Grüneisen parameter with pressure at different temperatures for (a) cubic, (b) orthorhombic, and (c) tetragonal phases of the BaTiO3 compound.
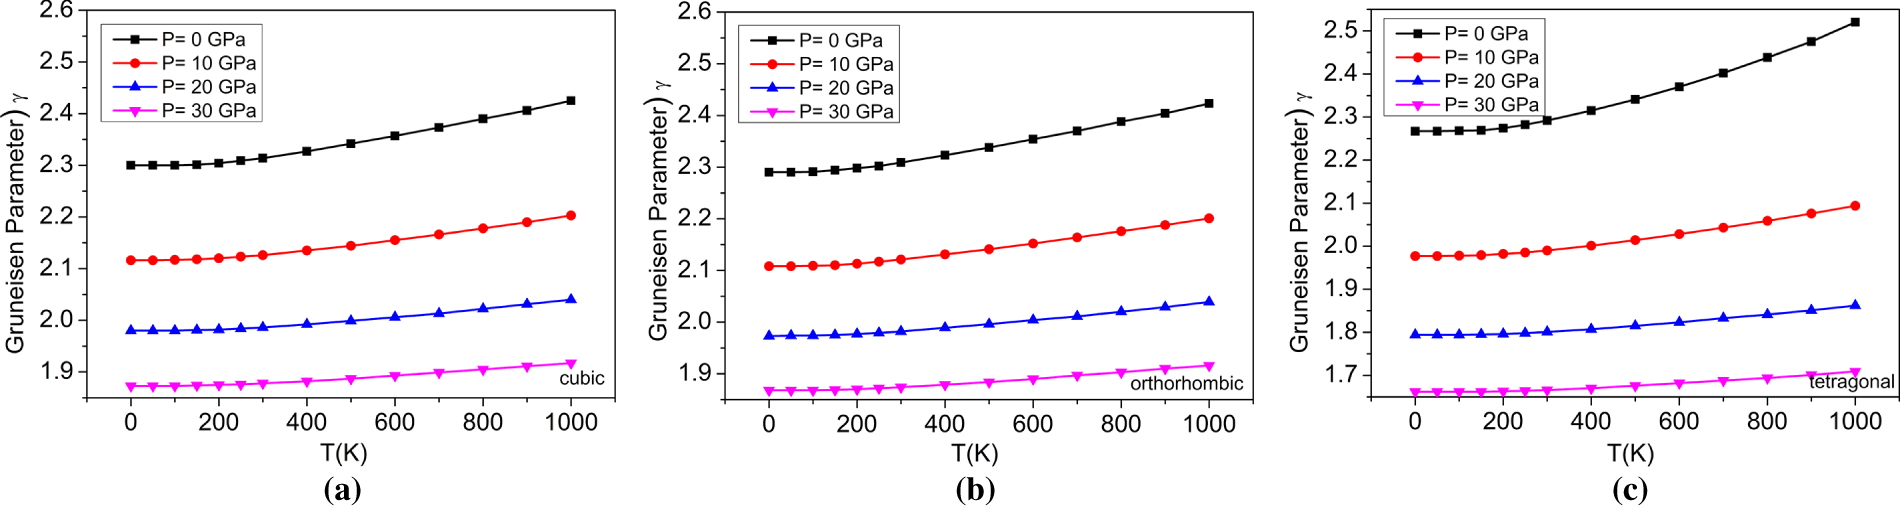
Figure 13: The variations of Grüneisen parameter with temperatures at different pressures for (a) cubic, (b) orthorhombic, and (c) tetragonal phases of the BaTiO3 compound.
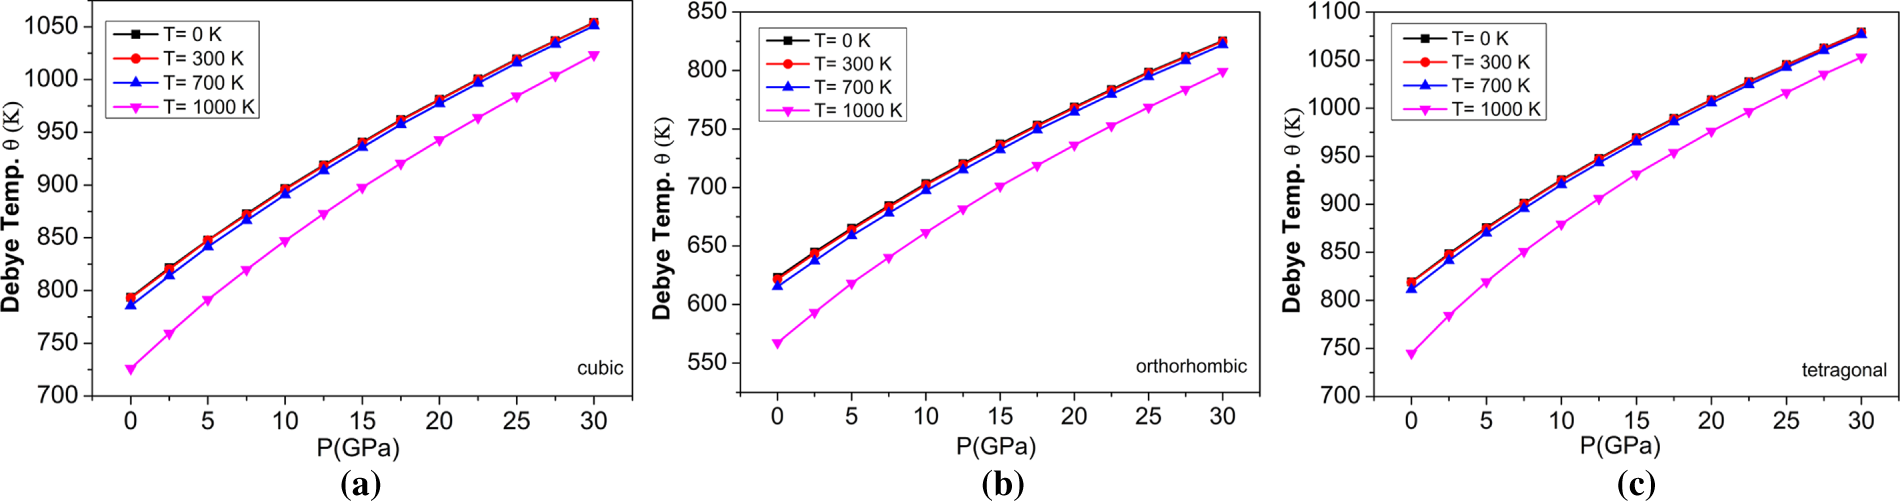
Figure 14: The variations of Debye temperature with pressure at different temperatures for (a) cubic, (b) orthorhombic, and (c) tetragonal phases of the BaTiO3 compound.
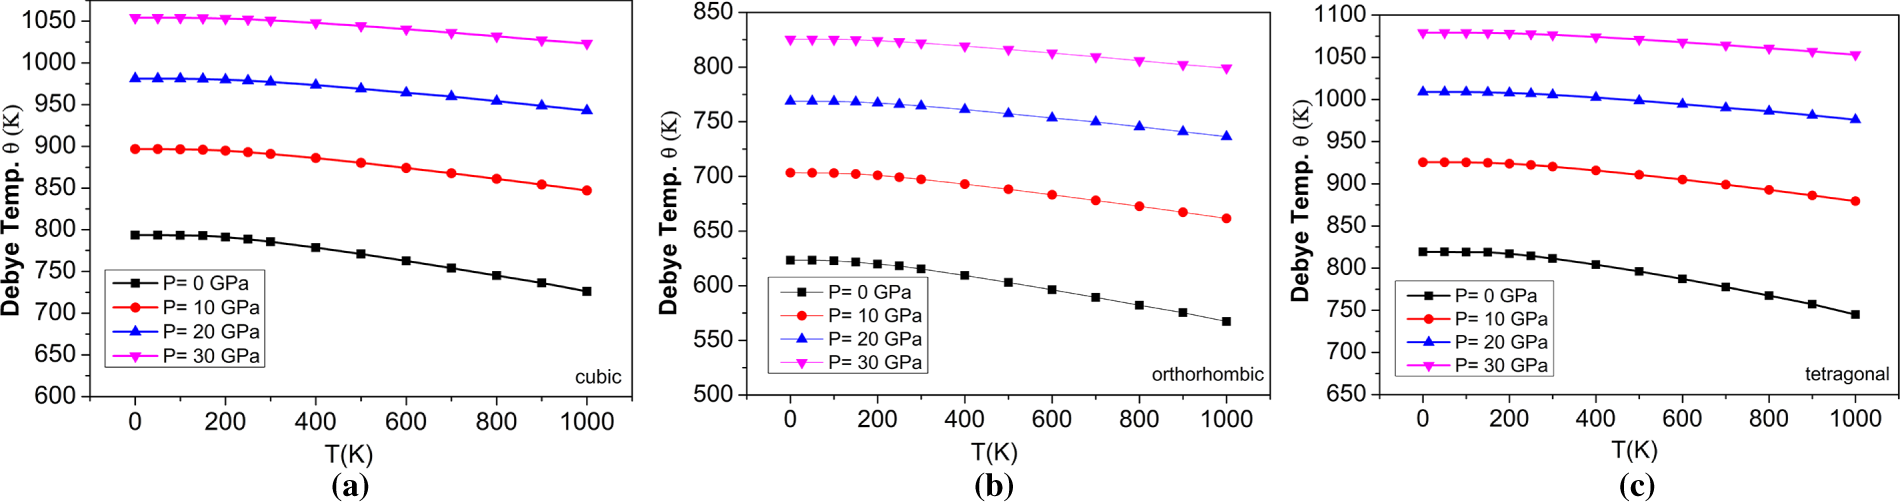
Figure 15: The variations of Debye temperature with temperatures at different pressures for (a) cubic, (b) orthorhombic, and (c) tetragonal phases of the BaTiO3 compound.
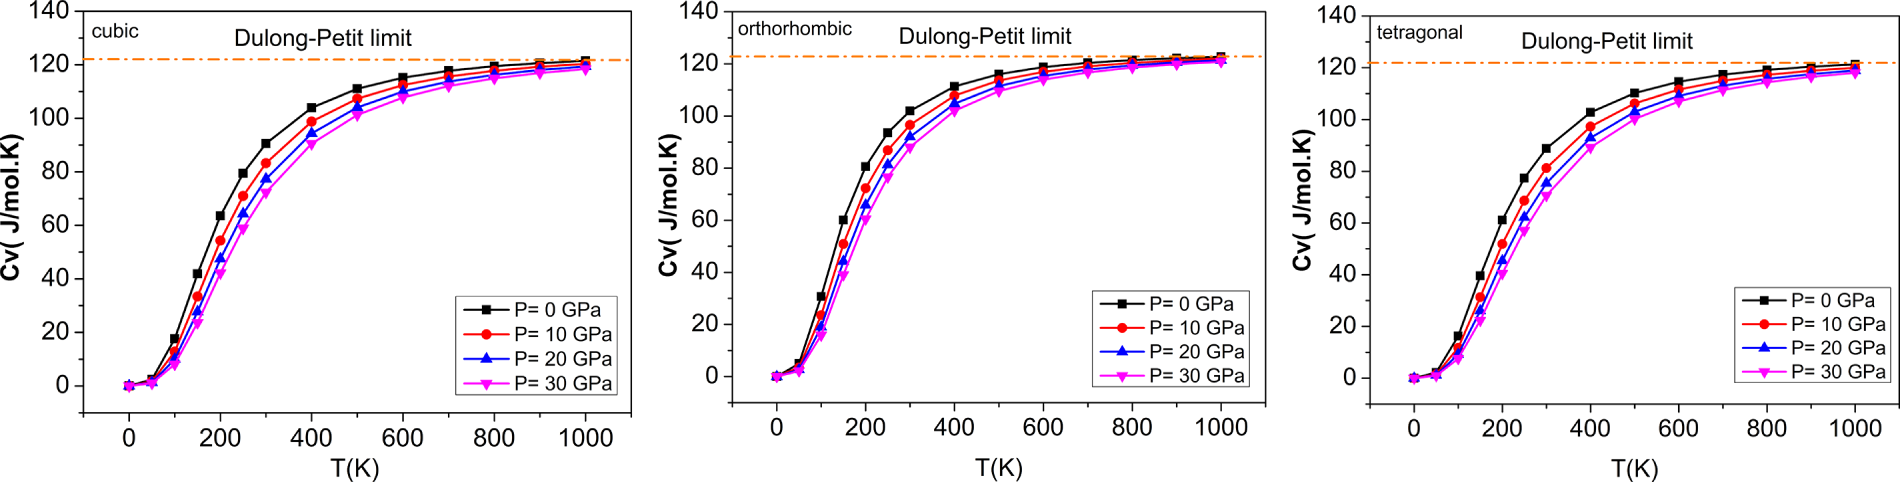
Figure 16: The variations of heat capacities with temperatures at different pressures for (a) cubic, (b) orthorhombic, and (c) tetragonal phases of the BaTiO3 compound.
The bulk modulus is another parameter that quantifies the ability of a substance to resist a uniform pressure on its volume. The obtained findings can be attributed to the following: as the temperature of a substance increases, its atoms or molecules have more kinetic energy and become less tightly packed, resulting in crystal expansion. As a result, the material becomes less rigid or more compressible, i.e., its bulk modulus decreases with increasing temperature. Conversely, the particles of a material are brought closer together when higher pressure is applied, because intermolecular forces increase resistance to changes in material volume, leading to higher rigidity and less compressibility; i.e., an increase in applied pressure increases the bulk modulus. Fig. 8 shows the variation in the bulk modulus of the three phases of BaTiO3 with temperature at the applied pressure, where the bulk modulus increases with increasing pressure and decreases with increasing temperature. The three phases of BaTiO3 have bulk moduli of 158.84, 160.23, and 151.99 GPa at 0 K and zero pressure; these values also agree with those obtained from structural optimizations (Table 2). Fig. 9 illustrates the correlation between the bulk modulus and temperature at different pressures for all three phases of BaTiO3. The graph shows that the Bulk modulus, B, which measures resistance to homogeneous compression, decreases with increasing temperature. The trend is observed in all the pressure conditions analyzed in this study. It is also noted that increasing pressure increases the Bulk modulus at a given temperature. As indicated by the calculated bulk modulus values, the orthorhombic phase is comparatively more compressible than the cubic and tetragonal phases, reflecting enhanced lattice flexibility associated with ferroelectric distortion. The way in which a material’s dimensions vary in response to temperature deviations is determined by its thermal expansion coefficient. It measures how much a material’s size changes fractionally for every unit change in temperature.
The computation of thermal expansion (×105 K−1) with pressure at different temperatures for the cubic, orthorhombic, and tetragonal phases of the BaTiO3 compound is shown in Fig. 10. At 0 K, the thermal expansion coefficient remains constant for all three phases, regardless of applied pressure, indicating that it is unaffected by pressure at absolute zero. However, as the temperature rises, the ‘α’also increases, which means that the material expands more with rising temperature. Conversely, as pressure increases, ‘α’ decreases, indicating that higher pressure reduces the rate of expansion with temperature. The deviations of thermal expansion ‘α’ (×105 K−1) concerning temperature at different pressures for cubic, orthorhombic, and tetragonal phases of the BaTiO3 compound have been shown in Fig. 11. The calculated thermal expansion values are 3.389 × 10⁻⁵ K−1, 3.803 × 10⁻⁵ K−1, and 3.372 × 10⁻⁵ K−1 for the three phases of BaTiO3 at 300 K and zero pressure. Between 0 and 200 K, the graph ascends dramatically. At 300 K, it steadily rises with a slight slope, especially at high pressures.
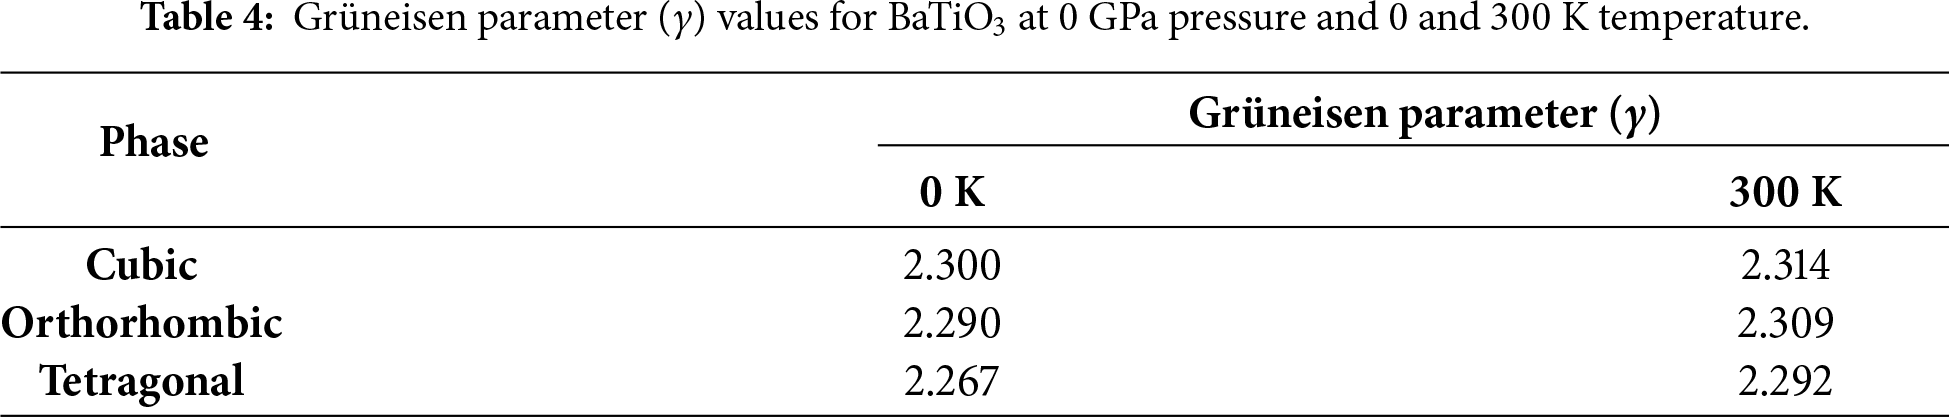
A noteworthy component that can be articulated at the macrocosmic and microcosmic levels is the Grüneisen parameter (γ). It is related to many thermal parameters in the macroscopic framework, such as heat capacity, isothermal bulk modulus, and thermal expansion coefficient (α). Still, it is also related to realizing the atom’s vibrational frequency in the microscopic framework [54]. It is a measure of how the vibrational frequencies of phonons change with the volume of the crystal. Thermal expansion and specific heat are linked through γ. As shown in Fig. 12, for the cubic, orthorhombic, and tetragonal phases of BaTiO3, a decrease is clearly observed as pressure increases in all three phases, suggesting that higher pressures reduce the sensitivity of vibrational modes to volume changes.
On the other hand, as temperature increases, γ increases, suggesting that vibrational modes of materials are more responsive to changes in temperature. The increase of both parameters is consistent across all three materials and supports the correlation with pressure and temperature. In addition, the relationship between pressure and temperature will be examined. Fig. 13 provides evidence for the relationship between the Grüneisen parameters and temperature-pressure for all three phases, with an increasing trend of Grüneisen parameter for both when temperature increases and pressure decreases. The values and comparison of the Grüneisen parameter at 0 GPa of BaTiO3 are provided in Table 4.
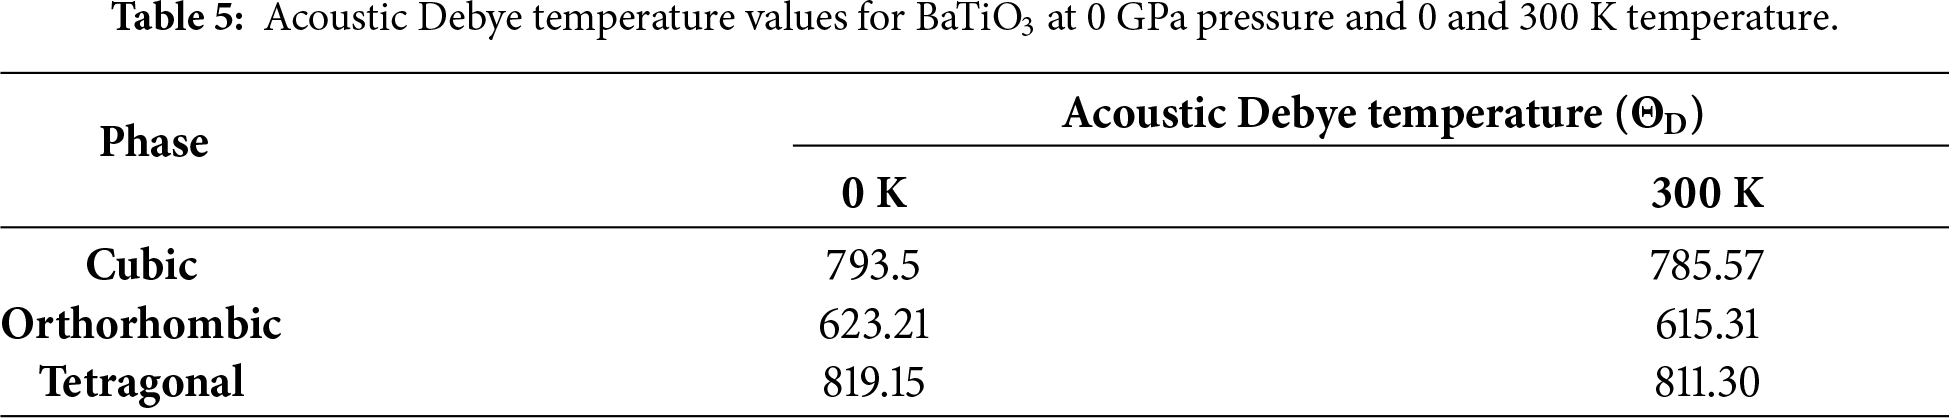
The acoustic Debye temperature (‘ΘD’) significantly influences the quasi-harmonic Debye model, which describes how the behaviour of materials depends on temperature, particularly in the context of lattice vibrations and thermal properties. The temperature-dependent ΘD value is needed to correctly model a material’s heat capacity, thermal expansion, and other thermodynamic properties over a wide range of temperatures. The variation of ΘD for temperature and pressure is shown in Fig. 14. It shows that, as pressure increases, ΘD increases, indicating that the vibrational frequencies of the lattice increase with additional pressure. In addition, ΘD decreases as the temperature increases, which shows that the vibrational frequencies of the lattice of a material decrease with increasing temperature. Thus, there is an inverse relationship between ΘD and temperature and a direct relationship between ΘD and pressure. The variation of ΘD with temperature at different applied pressures is shown in Fig. 15 and illustrated as increasing with increasing pressure and decreasing with increasing temperature, which supports the conclusion that the particles’ vibrational frequency is affected by both temperature and pressure, but in opposite manner. The ΘD for BaTiO3 at 0 GPa is shown in Table 5.
When seeking to characterize the vibrational properties of a given material for use in various contexts, it is also essential to account for the heat capacity associated with both constant pressure (Cp) and constant volume (Cv) for that particular substance. Fig. 16 illustrates the relationship between the Cp and Cv for the considered compound as a function of pressure and temperature. As shown in Fig. 16, Cv increases rapidly with temperature, below 400 K, and is proportional to T3. The increase starts to taper off at temperatures >400 K. At >400 K, Cv stabilizes and reaches the maximum limit for all phases, known as the ‘Dulong-Petit limit’. The calculated heat capacity at 300 K and 0 GPa for the three different phase states of BaTiO3 were 90.58 J/mol·K for the cubic phase, 101.97 J/mol·K for the orthorhombic phase, and 88.80 J/mol·K for the tetragonal phase. These values provide essential information on the thermal properties of a material and its thermodynamic behavior.
The thermodynamic trends obtained from the quasi-harmonic Debye model are fully consistent with the experimentally established phase stability sequence of BaTiO3. Experimentally, BaTiO3 undergoes well-known temperature-driven phase transitions from the rhombohedral/orthorhombic phase at low temperatures to the tetragonal phase at intermediate temperatures and finally to the cubic paraelectric phase at high temperatures. Our calculations reveal that the orthorhombic phase exhibits the highest bulk modulus and relatively lower thermal expansion at low temperatures, indicating enhanced lattice rigidity and thermodynamic stability in this regime. As temperature increases, the bulk modulus decreases while thermal expansion, Grüneisen parameter, and heat capacity increase, reflecting progressive lattice softening and enhanced anharmonic phonon activity. These effects are most pronounced for the tetragonal and cubic phases, consistent with their experimentally observed stabilization at elevated temperatures. Moreover, the higher Debye temperature of the cubic and tetragonal phases under pressure indicates stiffened phonon modes, which agrees with experimental observations of pressure-induced stabilization of higher-symmetry phases in BaTiO3. Although the quasi-harmonic Debye approach does not explicitly capture soft-mode ferroelectric instabilities responsible for first-order phase transitions, the smooth evolution of bulk modulus, thermal expansion, Debye temperature, and Grüneisen parameter with temperature and pressure provides a thermodynamically coherent framework that qualitatively supports the experimentally observed phase stability hierarchy. Thus, the present thermodynamic results are in good agreement with experimental phase transition trends and validate the reliability of the employed methodology within its known theoretical limits.
Anharmonic effects and phonon free energies are indeed important for a precise description of BaTiO3 phase stability, particularly close to transition temperatures. While their inclusion may shift transition points and adjust relative free energies, the overall stability trends obtained in the present quasi-harmonic Debye analysis remain physically meaningful and consistent with experimental observations.
BaTiO3 is a prototypical ferroelectric material in which soft optical phonon modes and strong anharmonic lattice dynamics drive phase transitions. Consequently, strictly harmonic or quasi-harmonic descriptions are known to be insufficient for capturing the microscopic origin of these transitions, particularly in the immediate vicinity of the orthorhombic–tetragonal and tetragonal–cubic phase boundaries. In this sense, the quasi-harmonic Debye approximation does not explicitly account for soft-mode condensation, higher-order phonon–phonon interactions, or dynamical disorder effects that dominate near critical temperatures.
Nevertheless, the quasi-harmonic Debye model remains a valid and widely used approximation for describing the global thermodynamic response of BaTiO3 over broad temperature and pressure ranges, provided that the results are interpreted away from the immediate transition region. The method incorporates volume-dependent vibrational contributions to the free energy through the Debye temperature and Grüneisen parameter, enabling a physically consistent description of macroscopic quantities such as the bulk modulus, thermal expansion, heat capacity, and Debye temperature. These quantities evolve smoothly with temperature and pressure and are not solely governed by soft optical modes.
Importantly, numerous first-principles studies have demonstrated that while explicit anharmonic phonon treatments are required to reproduce ferroelectric transition temperatures quantitatively, quasi-harmonic approaches reliably capture relative phase stiffness, compressibility trends, and pressure-induced stabilization of higher-symmetry phases in BaTiO3. In the present work, the agreement between quasi-harmonic bulk moduli and those obtained from static structural optimizations further supports the approach’s internal consistency.
The physical characteristics of BaTiO3 in the cubic, orthorhombic, and tetragonal phases were examined using the DFT. The structural optimization of the three phases of BaTiO3 is consistent with the structural data from the theoretical and experimental literature, and all three phases are experimentally feasible and thermodynamically stable, exhibiting moderate to high bulk moduli that indicate resistance to compression, with noticeable phase-dependent variations. Electronic structure analysis shows that all three structural phases of BaTiO3 behave as semiconductors and possess indirect band gaps. The optical properties of BaTiO3 verify the electronic property analysis. Their refractive indices were calculated as 2.18, 2.09, and 2.12, respectively, for the cubic, orthorhombic, and tetragonal crystal structures, within the most optimum range of 2 to 4 eV, which they would apply in optoelectronic devices. The thermodynamic analysis demonstrates that all three crystal structures behave similarly, and the pressure affects this behavior more than temperature. Thus, the analysis above provides a more detailed overview of the phase-dependent physical properties of BaTiO3 and can inform its use in many technological processes.
Acknowledgement: The numerical calculations reported in this paper were fully performed at TUBITAK ULAKBIM, High Performance and Grid Computing Center (TRUBA resources).
Funding Statement: No funding was received for this work.
Author Contributions: Yasemin O. Ciftci and İlknur K. Durukan were involved in investigation, methodology, and writing the original draft; Upasana Rani helped with writing the original draft, resources, and conceptualization; Peeyush Kumar Kamlesh did conceptualization and writing, reviewing, and editing of the original draft. All authors reviewed and approved the final version of the manuscript.
Availability of Data and Materials: The data will be available on reasonable request to the authors.
Ethics Approval: This study does not require ethical approval, as no human participants, animals, or sensitive biological material are involved.
Conflicts of Interest: The authors declare no conflicts of interest.
References
1. Humayun M, Li Z, Israr M, Khan A, Luo W, Wang C, et al. Perovskite type ABO3 oxides in photocatalysis, electrocatalysis, and solid oxide fuel cells: state of the art and future prospects. Chem Rev. 2025;125(6):3165–241. doi:10.1021/acs.chemrev.4c00553. [Google Scholar] [PubMed] [CrossRef]
2. Parwaiz S, Jennings JR, Harunsani MH, Khan MM. Recent advances in LaCoO3− based perovskite nanostructures for electrocatalytic and photocatalytic applications. Crit Rev Solid State Mater Sci. 2026;51(1):63–104. doi:10.1080/10408436.2025.2509646. [Google Scholar] [CrossRef]
3. Chander S, Tripathi SK, Kaur I. ABO3– based perovskite oxides for gas sensors: a review of recent advancement in materials, mechanisms, and strategies for real-time applications. Chem Eng J. 2025;524:169490. doi:10.1016/j.cej.2025.169490. [Google Scholar] [CrossRef]
4. Tahiri N, Dahbi S, Dani I, El Bounagui O, Ez-Zahraouy H. Magnetocaloric and thermoelectric properties of the perovskite LaMnO3 material: a DFT study and Monte Carlo technique. Phase Transit. 2021;94(11):826–34. doi:10.1080/01411594.2021.1974860. [Google Scholar] [CrossRef]
5. Jha SK, Priyadarshi PK. Structural and functional insights into ABO3 perovskites: tailoring properties for advanced technological applications. Int J Eng Sci Invent. 2024;13(10):40–4. doi:10.35629/6734-13104044. [Google Scholar] [CrossRef]
6. Hussain MK, Paudel R, Jawad kahdum B, Syrotyuk S. Optoelectronic and structural properties of bulk cubic perovskite RbTaO3 and surface (0 0 1) for optoelectronic and spintronics applications. Mater Chem Phys. 2024;327(20):129778. doi:10.1016/j.matchemphys.2024.129778. [Google Scholar] [CrossRef]
7. Kwei GH, Lawson AC, Billinge SJL, Cheong SW. Structures of the ferroelectric phases of barium titanate. J Phys Chem. 1993;97(10):2368–77. doi:10.1021/j100112a043. [Google Scholar] [CrossRef]
8. Deng C, Zhang Y, Yang D, Zhang H, Zhu M. Recent progress on barium titanate-based ferroelectrics for sensor applications. Adv Sens Res. 2024;3(6):2300168. doi:10.1002/adsr.202300168. [Google Scholar] [CrossRef]
9. Abbas Z, Hussain Mirza S, Parveen A, Aslam M, Muhammad S. Investigating the structural, electronic, optical and thermodynamic properties of ATiO3 (a = Ba, Ca, Ra) for low-cost energy applications. Opt Laser Technol. 2025;181:111828. doi:10.1016/j.optlastec.2024.111828. [Google Scholar] [CrossRef]
10. Ji Z, Wang X, Chen Y, Wang Z. Phonon entropy in the electrocaloric effect of BaTiO3: a study based on dual-phase-transition mechanisms. Appl Phys Lett. 2025;127(4):42902. doi:10.1063/5.0276505. [Google Scholar] [CrossRef]
11. Rani U, Kamlesh PK, Agarwal R, Kumari J, Verma AS. Electronic and thermo-physical properties of double antiperovskites X6SOA2 (X = Na, K and A = Cl, Br, Ia non-toxic and efficient energy storage materials. Int J Quantum Chem. 2021;121(19):e26759. doi:10.1002/qua.26759. [Google Scholar] [CrossRef]
12. Edwards JW, Speiser R, Johnston HL. Structure of barium titanate at elevated temperatures. J Am Chem Soc. 1951;73(6):2934–5. [Google Scholar]
13. de Mestral V, Bastonero L, Kotiuga M, Mladenović M, Marzari N, Luisier M. Ab initiofunctional-independent calculations of the clamped Pockels tensor of tetragonal barium titanate. Phys Rev B. 2025;111(18):184306. doi:10.1103/physrevb.111.184306. [Google Scholar] [CrossRef]
14. Shirane G, Danner H, Pepinsky R. Neutron diffraction study of orthorhombic BaTiO3. Phys Rev. 1957;105(3):856–60. doi:10.1103/physrev.105.856. [Google Scholar] [CrossRef]
15. Oliveira MC, Ribeiro RAP, Longo E, Bomio MRD, Motta FV, de Lazaro SR. Temperature dependence on phase evolution in the BaTiO3 polytypes studied using ab initio calculations. Int J Quantum Chem. 2020;120(1):e26054. doi:10.1002/qua.26054. [Google Scholar] [CrossRef]
16. Li YL, Cross LE, Chen LQ. A phenomenological thermodynamic potential for BaTiO3 single crystals. J Appl Phys. 2005;98(6):64101. doi:10.1063/1.2042528. [Google Scholar] [CrossRef]
17. Ishidate T, Abe S, Takahashi H, Môri N. Phase diagram of BaTiO3. Phys Rev Lett. 1997;78(12):2397–400. doi:10.1103/physrevlett.78.2397. [Google Scholar] [CrossRef]
18. Wang JJ, Wu PP, Ma XQ, Chen LQ. Temperature-pressure phase diagram and ferroelectric properties of BaTiO3 single crystal based on a modified Landau potential. J Appl Phys. 2010;108(11):114105. doi:10.1063/1.3504194. [Google Scholar] [CrossRef]
19. Uludoğan M, Guarin DP, Gomez ZE, Cagin T, Iii WAG. DFT studies on ferroelectric ceramics and their alloys: BaTiO3, PbTiO3, SrTiO3, AgNbO3, AgTaO3, PbxBa1-xTiO3 and SrxBa1-xTiO3. Comput Model Eng Sci. 2008;24(3):215–38. doi:10.3970/cmes.2008.024.215. [Google Scholar] [CrossRef]
20. Ehsan S, Arrigoni M, Madsen GKH, Blaha P, Tröster A. First-principles self-consistent phonon approach to the study of the vibrational properties and structural phase transition of BaTiO3. Phys Rev B. 2021;103(9):94108. doi:10.1103/physrevb.103.094108. [Google Scholar] [CrossRef]
21. Evarestov RA, Bandura AV. First-principles calculations on the four phases of BaTiO3. J Comput Chem. 2012;33(11):1123–30. doi:10.1002/jcc.22942. [Google Scholar] [PubMed] [CrossRef]
22. Masuki R, Nomoto T, Arita R, Tadano T. Ab initiostructural optimization at finite temperatures based on anharmonic phonon theory: application to the structural phase transitions of BaTiO3. Phys Rev B. 2022;106(22):224104. doi:10.1103/physrevb.106.224104. [Google Scholar] [CrossRef]
23. Zhong W, King-Smith RD, Vanderbilt D. Giant LO-TO splittings in perovskite ferroelectrics. Phys Rev Lett. 1994;72(22):3618–21. doi:10.1103/physrevlett.72.3618. [Google Scholar] [PubMed] [CrossRef]
24. Parsons JL, Rimai L. Raman spectrum of BaTiO3. Solid State Commun. 1967;5(5):423–7. doi:10.1016/0038-1098(67)90790-9. [Google Scholar] [CrossRef]
25. Laabidi K, Fontana MD, Jannot B. Underdamped soft phonon in orthorhombic BaTiO3. Solid State Commun. 1990;76(6):765–8. doi:10.1016/0038-1098(90)90623-J. [Google Scholar] [CrossRef]
26. Tenne DA, Xi XX, Li YL, Chen YL, Soukiassian LQ, Zhu A, et al. Absence of low-temperature phase transitions in epitaxial BaTiO3 thin films. Phys Rev B. 2004;69(17):174101. doi:10.1103/physrevb.69.174101. [Google Scholar] [CrossRef]
27. Sanna S, Thierfelder C, Wippermann S, Sinha TP, Schmidt WG. Barium titanate ground- and excited-state properties from first-principles calculations. Phys Rev B. 2011;83(5):54112. doi:10.1103/physrevb.83.054112. [Google Scholar] [CrossRef]
28. Hermet P, Veithen M, Ghosez P. Raman scattering intensities in BaTiO3 and PbTiO3 prototypical ferroelectrics from density functional theory. J Phys Condens Matter. 2009;21(21):215901. doi:10.1088/0953-8984/21/21/215901. [Google Scholar] [PubMed] [CrossRef]
29. Wu X, Vanderbilt D, Hamann DR. Systematic treatment of displacements, strains, and electric fields in density-functional perturbation theory. Phys Rev B. 2005;72(3):35105. doi:10.1103/physrevb.72.035105. [Google Scholar] [CrossRef]
30. Choudhury N, Walter EJ, Kolesnikov AI, Loong CK. Large phonon band gap in SrTiO3 and the vibrational signatures of ferroelectricity in ATiO3 perovskites: first-principles lattice dynamics and inelastic neutron scattering. Phys Rev B. 2008;77(13):134111. doi:10.1103/physrevb.77.134111. [Google Scholar] [CrossRef]
31. Iles N, Kellou A, Driss Khodja K, Amrani B, Lemoigno F, Bourbie D, et al. Atomistic study of structural, elastic, electronic and thermal properties of perovskites Ba(Ti, Zr, Nb)O3. Comput Mater Sci. 2007;39(4):896–902. doi:10.1016/j.commatsci.2006.10.012. [Google Scholar] [CrossRef]
32. Ziati M, Ez-Zahraouy H. Theoretical investigation of electronic, optical and thermoelectric properties of tellurium doped barium titanate (BTO) through modified Becke-Johnson exchange potential. Optik. 2021;231(16):166440. doi:10.1016/j.ijleo.2021.166440. [Google Scholar] [CrossRef]
33. Hasan Z, Rahman MA, Das DK, Rouf HK. Influence of Ca doping in structural, electronic, optical and mechanical properties of Ba1−xCaxTiO3 perovskite from first-principles investigation. Sci Rep. 2023;13(1):10487. doi:10.1038/s41598-023-36719-8. [Google Scholar] [PubMed] [CrossRef]
34. Forsbergh PW. Domain structures and phase transitions in barium titanate. Phys Rev. 1949;76(8):1187–201. doi:10.1103/physrev.76.1187. [Google Scholar] [CrossRef]
35. Forrester WF, Hinde RM. Crystal structure of barium titanate. Nature. 1945;156(3954):177. doi:10.1038/156177b0. [Google Scholar] [CrossRef]
36. Lines ME, Glass AM. Principles and applications of ferroelectrics and related materials. Oxford, UK: Clarendon Press; 1977. [Google Scholar]
37. Zhong W, Vanderbilt D, Rabe KM. Phase transitions in BaTiO3 from first principles. Phys Rev Lett. 1994;73(13):1861–4. doi:10.1103/physrevlett.73.1861. [Google Scholar] [PubMed] [CrossRef]
38. Zhong W, Vanderbilt D, Rabe K. First-principles theory of ferroelectric phase transitions for perovskites: the case of BaTiO3. Phys Rev B. 1995;52(9):6301–12. doi:10.1103/physrevb.52.6301. [Google Scholar] [PubMed] [CrossRef]
39. Zhang Q, Cagin T, Goddard WA 3rd. The ferroelectric and cubic phases in BaTiO3 ferroelectrics are also antiferroelectric. Proc Natl Acad Sci USA. 2006;103(40):14695–700. doi:10.1073/pnas.0606612103. [Google Scholar] [PubMed] [CrossRef]
40. Iñiguez J, Vanderbilt D. First-principles study of the temperature-pressure phase diagram of BaTiO3. Phys Rev Lett. 2002;89(11):115503. doi:10.1103/PhysRevLett.89.115503. [Google Scholar] [PubMed] [CrossRef]
41. Acosta M, Novak N, Rojas V, Patel S, Vaish R, Koruza J, et al. BaTiO3-based piezoelectrics: fundamentals, current status, and perspectives. Appl Phys Rev. 2017;4(4):41305. doi:10.1063/1.4990046. [Google Scholar] [CrossRef]
42. Gigli L, Veit M, Kotiuga M, Pizzi G, Marzari N, Ceriotti M. Thermodynamics and dielectric response of BaTiO3 by data-driven modeling. npj Comput Mater. 2022;8(1):209. doi:10.1038/s41524-022-00845-0. [Google Scholar] [CrossRef]
43. Kresse G, Furthmüller J. Efficient iterative schemes for ab initio total-energy calculations using a plane-wave basis set. Phys Rev B. 1996;54(16):11169–86. doi:10.1103/physrevb.54.11169. [Google Scholar] [PubMed] [CrossRef]
44. Kresse G, Furthmüller J. Efficiency of ab-initio total energy calculations for metals and semiconductors using a plane-wave basis set. Comput Mater Sci. 1996;6(1):15–50. doi:10.1016/0927-0256(96)00008-0. [Google Scholar] [CrossRef]
45. Kresse G, Hafner J. Ab initiomolecular dynamics for liquid metals. Phys Rev B. 1993;47(1):558–61. doi:10.1103/physrevb.47.558. [Google Scholar] [PubMed] [CrossRef]
46. Monkhorst HJ, Pack JD. Special points for Brillouin-zone integrations. Phys Rev B. 1976;13(12):5188–92. doi:10.1103/physrevb.13.5188. [Google Scholar] [CrossRef]
47. Perdew J, Burke K, Ernzerhof M. Generalized gradient approximation made simple. Phys Rev Lett. 1996;77(18):3865–8. doi:10.1103/PhysRevLett.77.3865. [Google Scholar] [PubMed] [CrossRef]
48. Gajdoš M, Hummer K, Kresse G, Furthmüller J, Bechstedt F. Linear optical properties in the projector-augmented wave methodology. Phys Rev B. 2006;73(4):45112. doi:10.1103/physrevb.73.045112. [Google Scholar] [CrossRef]
49. Otero-de-la-Roza A, Luaña V. Gibbs2: a new version of the quasi-harmonic model code. I. Robust treatment of the static data. Comput Phys Commun. 2011;182(8):1708–20. doi:10.1016/j.cpc.2011.04.016. [Google Scholar] [CrossRef]
50. Mukherjee S, Phuyal D, Segre CU, Das S, Karis O, Edvinsson T, et al. Structure and electronic effects from Mn and Nb co-doping for low band gap BaTiO3 ferroelectrics. J Phys Chem C. 2021;125(27):14910–23. doi:10.1021/acs.jpcc.1c02539. [Google Scholar] [CrossRef]
51. Kamlesh PK, Agrawal R, Rani U, Verma AS. Comprehensive ab-initio calculations of AlNiX (X = P, as and Sb) half-Heusler compounds: stabilities and applications as green energy resources. Mater Chem Phys. 2022;275(8):125233. doi:10.1016/j.matchemphys.2021.125233. [Google Scholar] [CrossRef]
52. Kamlesh PK, Pravesh, Kumari S, Verma AS. Effect of hybrid density functionals on half-Heusler LiZnX (X = N, P and As) semiconductors: potential materials for photovoltaic and thermoelectric applications. Phys Scr. 2020;95(9):095806. doi:10.1088/1402-4896/abab36. [Google Scholar] [CrossRef]
53. Francisco E, Blanco MA, Sanjurjo G. Atomistic simulation of SrF2 polymorphs. Phys Rev B. 2001;63(9):094107. doi:10.1103/physrevb.63.094107. [Google Scholar] [CrossRef]
54. Peng XC, Xing LL, Fang ZH. Comparing research on the pressure or volume dependence of Grüneisen parameter. Phys B Condens Matter. 2007;394(1):111–4. doi:10.1016/j.physb.2007.02.022. [Google Scholar] [CrossRef]
Cite This Article
 Copyright © 2026 The Author(s). Published by Tech Science Press.
This work is licensed under a Creative Commons Attribution 4.0 International License , which permits unrestricted use, distribution, and reproduction in any medium, provided the original work is properly cited.
 Downloads
 Citation Tools