
 Submit a Paper
 Propose a Special lssue
 Open Access
ARTICLE

Revealing the Electronic, Optical, and Thermoelectrical Properties of MgAu2F8 through DFT Calculations
1 Graduate School of Natural and Applied Sciences, Gazi University, Ankara, Türkiye
2 Department of Physics, Ankara Hacı Bayram Veli University, Ankara, Türkiye
3 Department of Physics, Gazi University, Ankara, Türkiye
* Corresponding Author: Gökay Uğur. Email:
Computers, Materials & Continua 2026, 87(3), 37 https://doi.org/10.32604/cmc.2026.079045
Received 13 January 2026; Accepted 10 March 2026; Issue published 09 April 2026
 View Full Text
 Download PDF
Abstract
Fluoride materials are renowned for their exceptional optical transparency, ionic conductivity, and chemical stability, making them indispensable in a wide range of technological applications. Despite the previous extensive research on simple metal fluorides, the complex metal fluoride family—particularly compounds with AB2F8 stoichiometry—remains largely unexplored. In this work, we present the first comprehensive density functional theory (DFT) investigation of the rare and formerly unreported MgAu2F8 complex metal fluoride, systematically revealing its electronic, optical, and thermoelectric properties under varying hydrostatic pressures. Our results reveal that MgAu2F8 undergoes a remarkable transformation from a wide-bandgap semiconductor at ambient conditions to a highly reflective, optically anisotropic, and metallic state under extreme compression. Pressure-induced band gap narrowing, enhanced optical absorption, and dramatic increases in electrical and thermal conductivities are observed, highlighting the material’s extraordinary sensitivity to external stimuli. The ability to finely tune these properties through pressure engineering positions MgAu2F8 as a promising candidate for advanced optoelectronic, thermoelectric, and pressure-sensing applications. This work not only expands the frontier of complex fluoride research but also underscores the power of DFT-based computational approaches in accelerating the discovery and design of next-generation functional materials.Keywords
Fluoride materials occupy a unique position in physics and materials science due to their exceptional optical transparency, ionic conductivity, and chemical stability [1–5]. In addition to the popular machine learning techniques [6,7], density functional theory (DFT) has proven invaluable for understanding these materials at a fundamental level, predicting new compounds, and guiding experimental research [8–10]. Therefore, DFT studies of fluorides are expected to contribute even more significantly to both basic science and technological innovation. The interaction between computational predictions and experimental validation promises continued discoveries in this important class of materials. On the other hand, the application of high pressure to fluoride compounds induces remarkable structural, electronic, and optical transformations that have been extensively investigated using DFT calculations [11–15]. Under pressure, fluorides typically undergo phase transitions from lower-coordination to higher-coordination structures, such as the well-documented B1 (NaCl-type) to B2 (CsCl-type) transition observed in many alkali and alkaline-earth fluorides [16]. DFT studies have successfully predicted these pressure-induced phase transitions, revealing significant changes in band gaps. Many fluorides exhibit band-gap narrowing, and in some cases, eventual metallization occurs at extreme pressures [17]. Moreover, DFT calculations have also been instrumental in determining equations of state, elastic constants, phonon spectra, and thermodynamic features of fluorides across a wide range of pressures [18]. Research on simple fluorides such as CaF2, MgF2, and BaF2, as well as on various transition-metal fluorides, has confirmed that pressure modifies bond lengths, coordination numbers, and electronic charge distributions [19,20]. These changes, in turn, affect optical transparency, mechanical hardness, and other functional properties of simple fluorides [21]. Furthermore, DFT investigations have the potential for superconductivity in certain fluorides under high pressure, providing valuable insights into the stability and properties of novel high-pressure phases before their experimental synthesis. Overall, computational approaches based on DFT have become essential tools for understanding and predicting the pressure-dependent behavior of fluoride materials [22–25].
Although there are numerous DFT research reports on simple metal fluorides [26–30], no work has been published yet for the complex metal fluoride AB2F8 stoichiometry where they are superior candidates for advanced applications in optoelectronics, solid-state batteries, and pressure-sensing. Therefore, this work presents the first detailed DFT analysis unreported MgAu2F8 complex metal fluoride and reveals the titled physical properties.
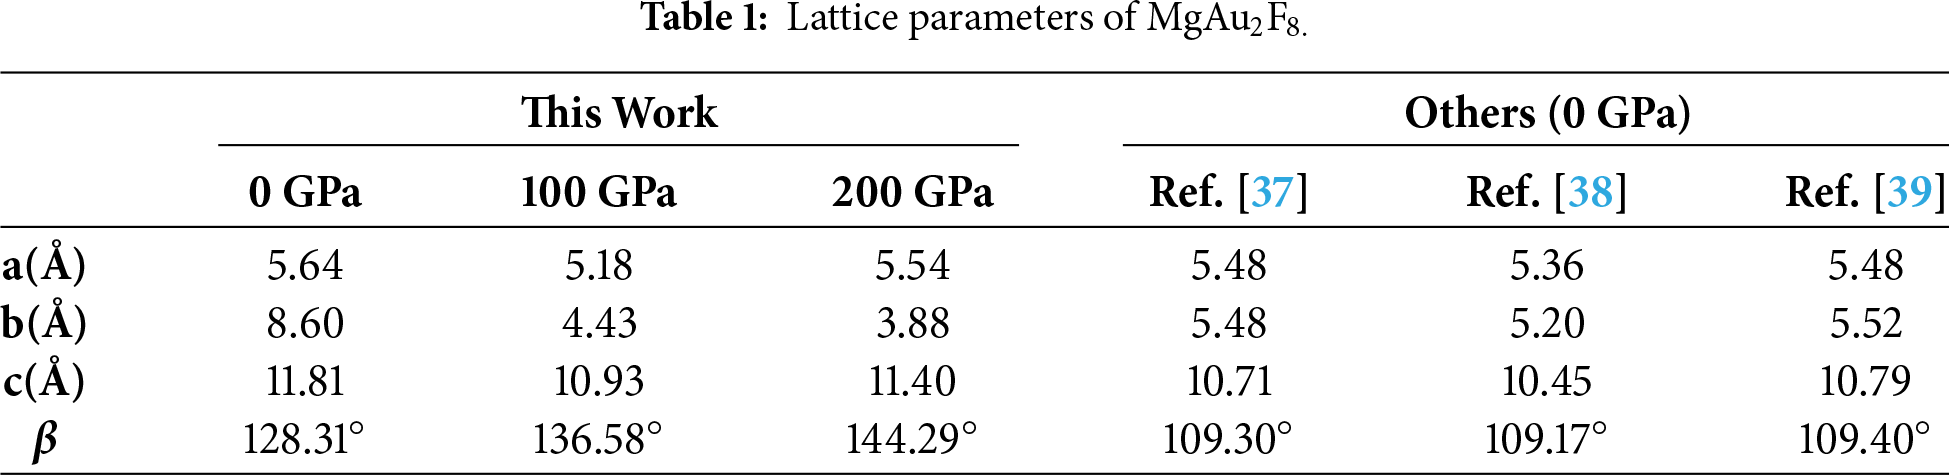
Electronic and optical calculations in this work were carried out using DFT as implemented in the first-principles CASTEP (Cambridge Serial Total Energy Package) code, which performs plane-wave total-energy calculations within a pseudopotential framework [31,32]. The bulk crystal structures of monoclinic MgAu2F8 (Fig. 1) crystallize in the P21/c space group (No. 14). The consistent lattice parameters for bulk monoclinic MgAu2F8 are also summarized in Table 1. For the exchange–correlation potential, the computationally less expensive and more rapid generalized gradient approximation (GGA) in the Perdew–Burke–Ernzerhof (PBE) form was used [33]. Structural relaxation was maintained via the Broyden–Fletcher–Goldfarb–Shanno (BFGS) optimization algorithm [34], allowing full optimization without constraints. Vanderbilt-type ultrasoft pseudopotentials were used to define the electron–ion interactions, with the following valence electronic configurations: Mg: [1s22s22p63s2], Au: [5s25p65d106s1], and F: [1s22s22p5]. Brillouin-zone integrations were carried out using a Monkhorst–Pack k-point mesh of 6 × 6 × 4 for systematic total energy convergence [35]. A plane-wave energy cutoff of 500 eV was adopted. The electronic self-consistency criterion was achieved with an energy convergence tolerance of 5 × 10⁻⁶ eV/atom. The maximum Hellmann–Feynman force per atom was 0.01 eV/Å, with the highest atomic displacements restricted to 5 × 10⁻⁴ Å and the residual stress limited to 0.02 GPa. For optical property computations, incident photon energies were counted up to 35 eV, encompassing the infrared region (<1.59 eV) and the ultraviolet gap (3–123 eV) of the electromagnetic spectrum. Through these optical calculations, the polarization vector of the incident electric field was oriented along the [100], [110] and [111] crystallographic directions. Finally, temperature-dependent thermoelectric transport properties were evaluated using the BoltzTraP2 code [36] along with the default temperatures of 300, 500, and 800 K. For this purpose, electronic structure data obtained from the CASTEP code [31,32] were utilized as input to BoltzTraP2 [36], allowing for an assessment of the potential of bulk MgAu2F8 for thermoelectric applications.
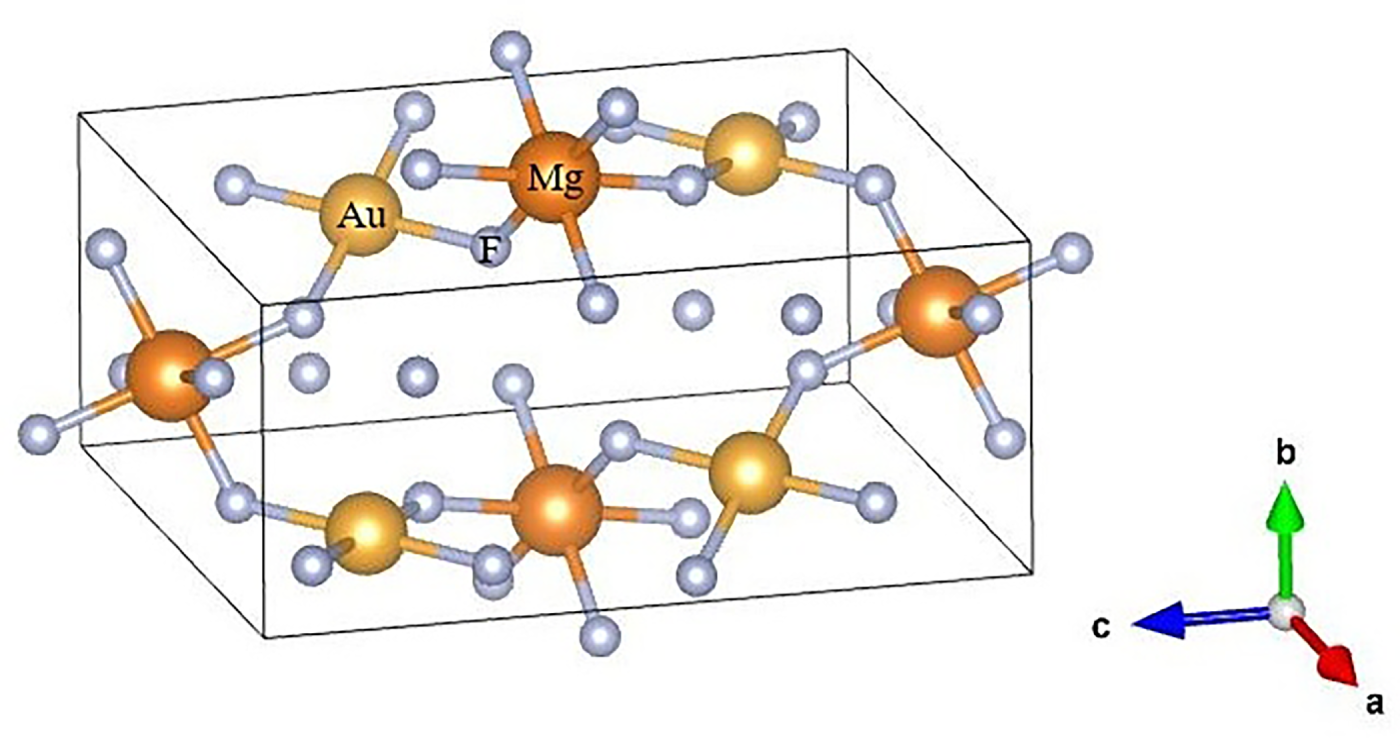
Figure 1: Crystal structure of MgAu2F8.
The electronic structure of MgAu2F8 under varying pressures (0, 100, and 200 GPa) in Fig. 2 demonstrates a clear evolution from a moderately wide-bandgap semiconductor to a nearly metallic state. At 0 GPa, the band structure reveals a direct bandgap of 1.92 eV at the B high symmetry point, with the conduction band minimum (CBM) and valence band maximum (VBM) located at different k-points as indicated by the blue dots. The valence band maximum is predominantly composed of F:2p and Au:5d states, while the conduction band minimum exhibits significant Au:6s and Mg:3s contributions where strong Au:5d and F:2p hybridization is evident in the −4 to 0 eV range, contributing to the material’s covalent character. The corresponding density of states (DOS) plot demonstrates that the states near the Fermi level (EF) are primarily contributed by d orbitals, followed by significant contributions from p orbitals. In contrast, the s orbital contributions remain minimal. Upon increasing pressure to 100 GPa, the bandgap narrows significantly to 1.14 eV, indicating an indirect nature, which suggests the material is transitioning toward higher conductivity. The CBM and VBM move closer in energy, reducing the separation between occupied and unoccupied states, as shown in the band structure. The DOS plot shows enhanced density near the Fermi energy level (EF), particularly from d and p states, indicating increased overlap and electronic delocalization as the pressure compresses the atomic structure. At 200 GPa, the former semiconductor indirect bandgap at 0 GPa with 1.92 eV further reduces to 0.38 eV, implying that MgAu2F8 is on the verge of metallization. The band structure illustrates flatter bands nearby EF, suggesting increased effective mass and lower mobility of charge carriers. The DOS plots close to EF become noticeably more populated, especially with d and p state contributions, while the total DOS intensity around EF increases substantially. This result signifies a significant pressure-dependent tuning of electronic properties in MgAu2F8, potentially enabling its application in pressure-sensitive electronic or optoelectronic devices.
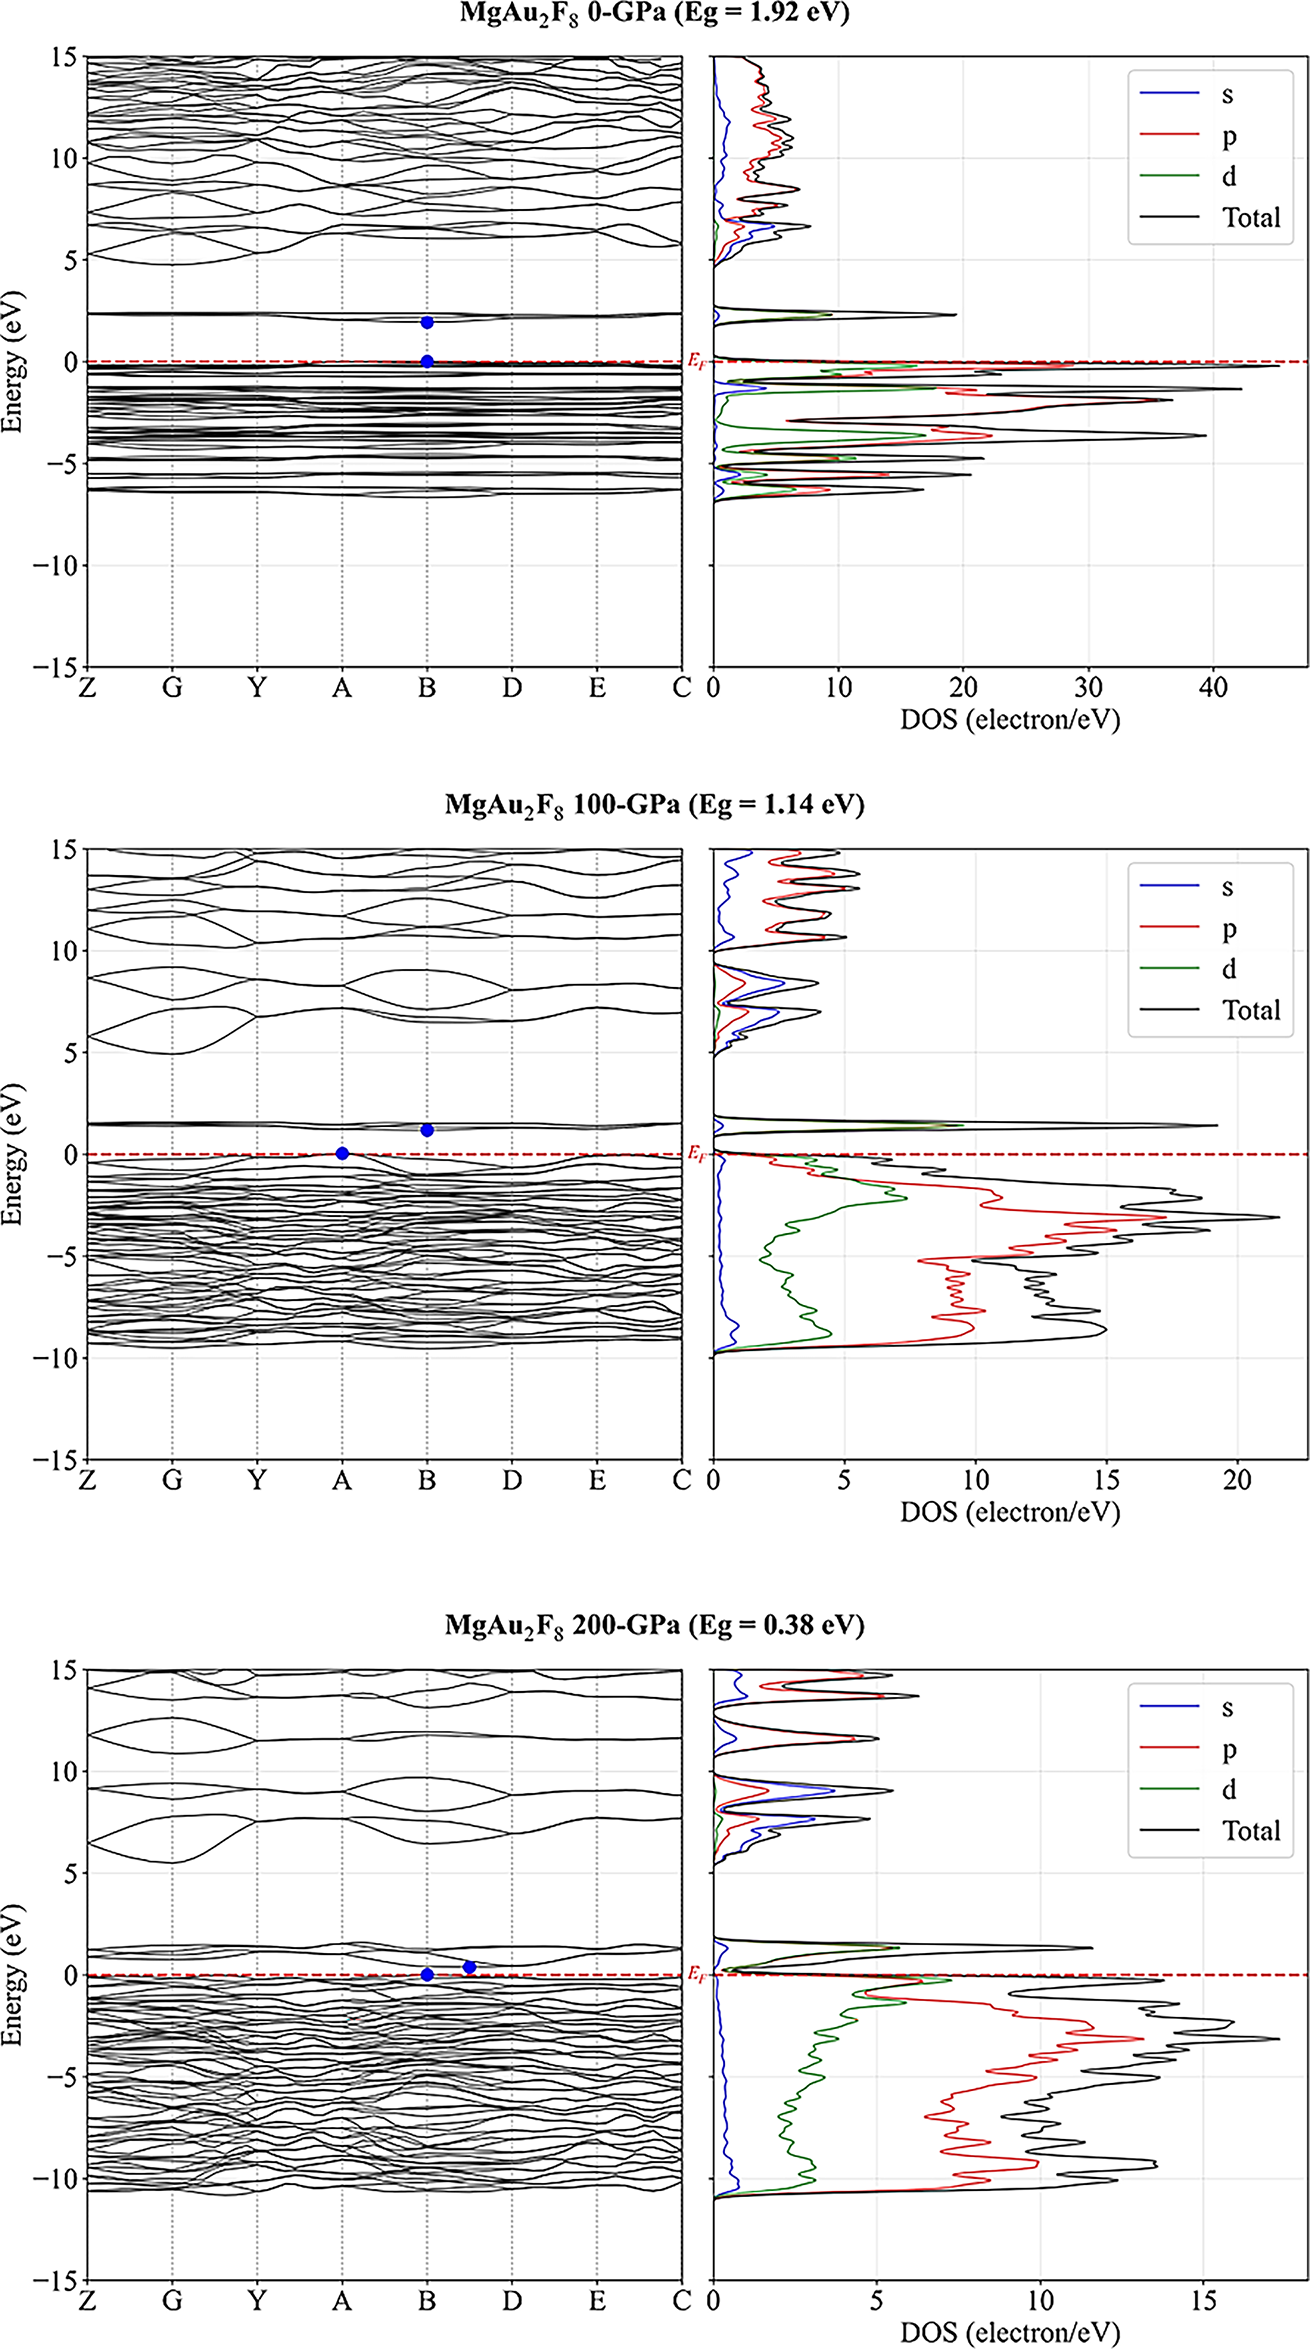
Figure 2: Pressure dependent electronic band structure with partial and total density of states of MgAu2F8.
The optical properties of materials, including their absorption, reflectivity, and refractive index, play a crucial role in understanding and designing advanced photonic and electronic devices. Within the framework of Density Functional Theory (DFT), these properties can be accurately derived using the Kramers-Kronig relations [40–43], which establish a direct connection between the real and imaginary parts of the complex dielectric function. By computing the imaginary part of the dielectric function from interband electronic transitions—accessible through DFT calculations—the real part can subsequently be obtained via the Kramers-Kronig transformation [44,45]. This approach enables a comprehensive and ab initio description of a material’s optical response across a wide frequency range, offering essential insights into its electronic structure and interaction with electromagnetic radiation. The reflectivity plots in Fig. 3 vividly illustrate the anisotropic reflectivity, R(ω), of MgAu2F8 as a function of photon energy, for three distinct crystallographic directions ([100], [110], [111]) and under varying hydrostatic pressures (0, 100, and 200 GPa). A clear and compelling trend is the substantial increase in overall reflectivity with increasing pressure, particularly in the lower energy regions. At ambient pressure (0 GPa), the material generally exhibits low reflectivity, with a prominent peak for the [100] direction around 5.5 eV. In the visible light spectrum (approximately 1.6–3.1 eV, indicated by the shaded bands), R(ω) is relatively low (below 0.1), suggesting that MgAu2F8 might be transparent or weakly reflective in this range. As pressure is applied, both to 100 GPa and subsequently to 200 GPa, the reflectivity increases dramatically, and the primary optical features (peaks) shift to lower energies. At 200 GPa, the reflectivity in the visible region becomes exceptionally high, often exceeding 0.3 to 0.4, particularly for the [100], [110], and [111] directions, implying a transition towards a highly reflective or metallic state. Throughout all pressure conditions, the material demonstrates significant optical anisotropy, with R(ω) varying considerably depending on the crystallographic orientation, showcasing a direction-dependent response to incident light that is further modulated by external pressure.
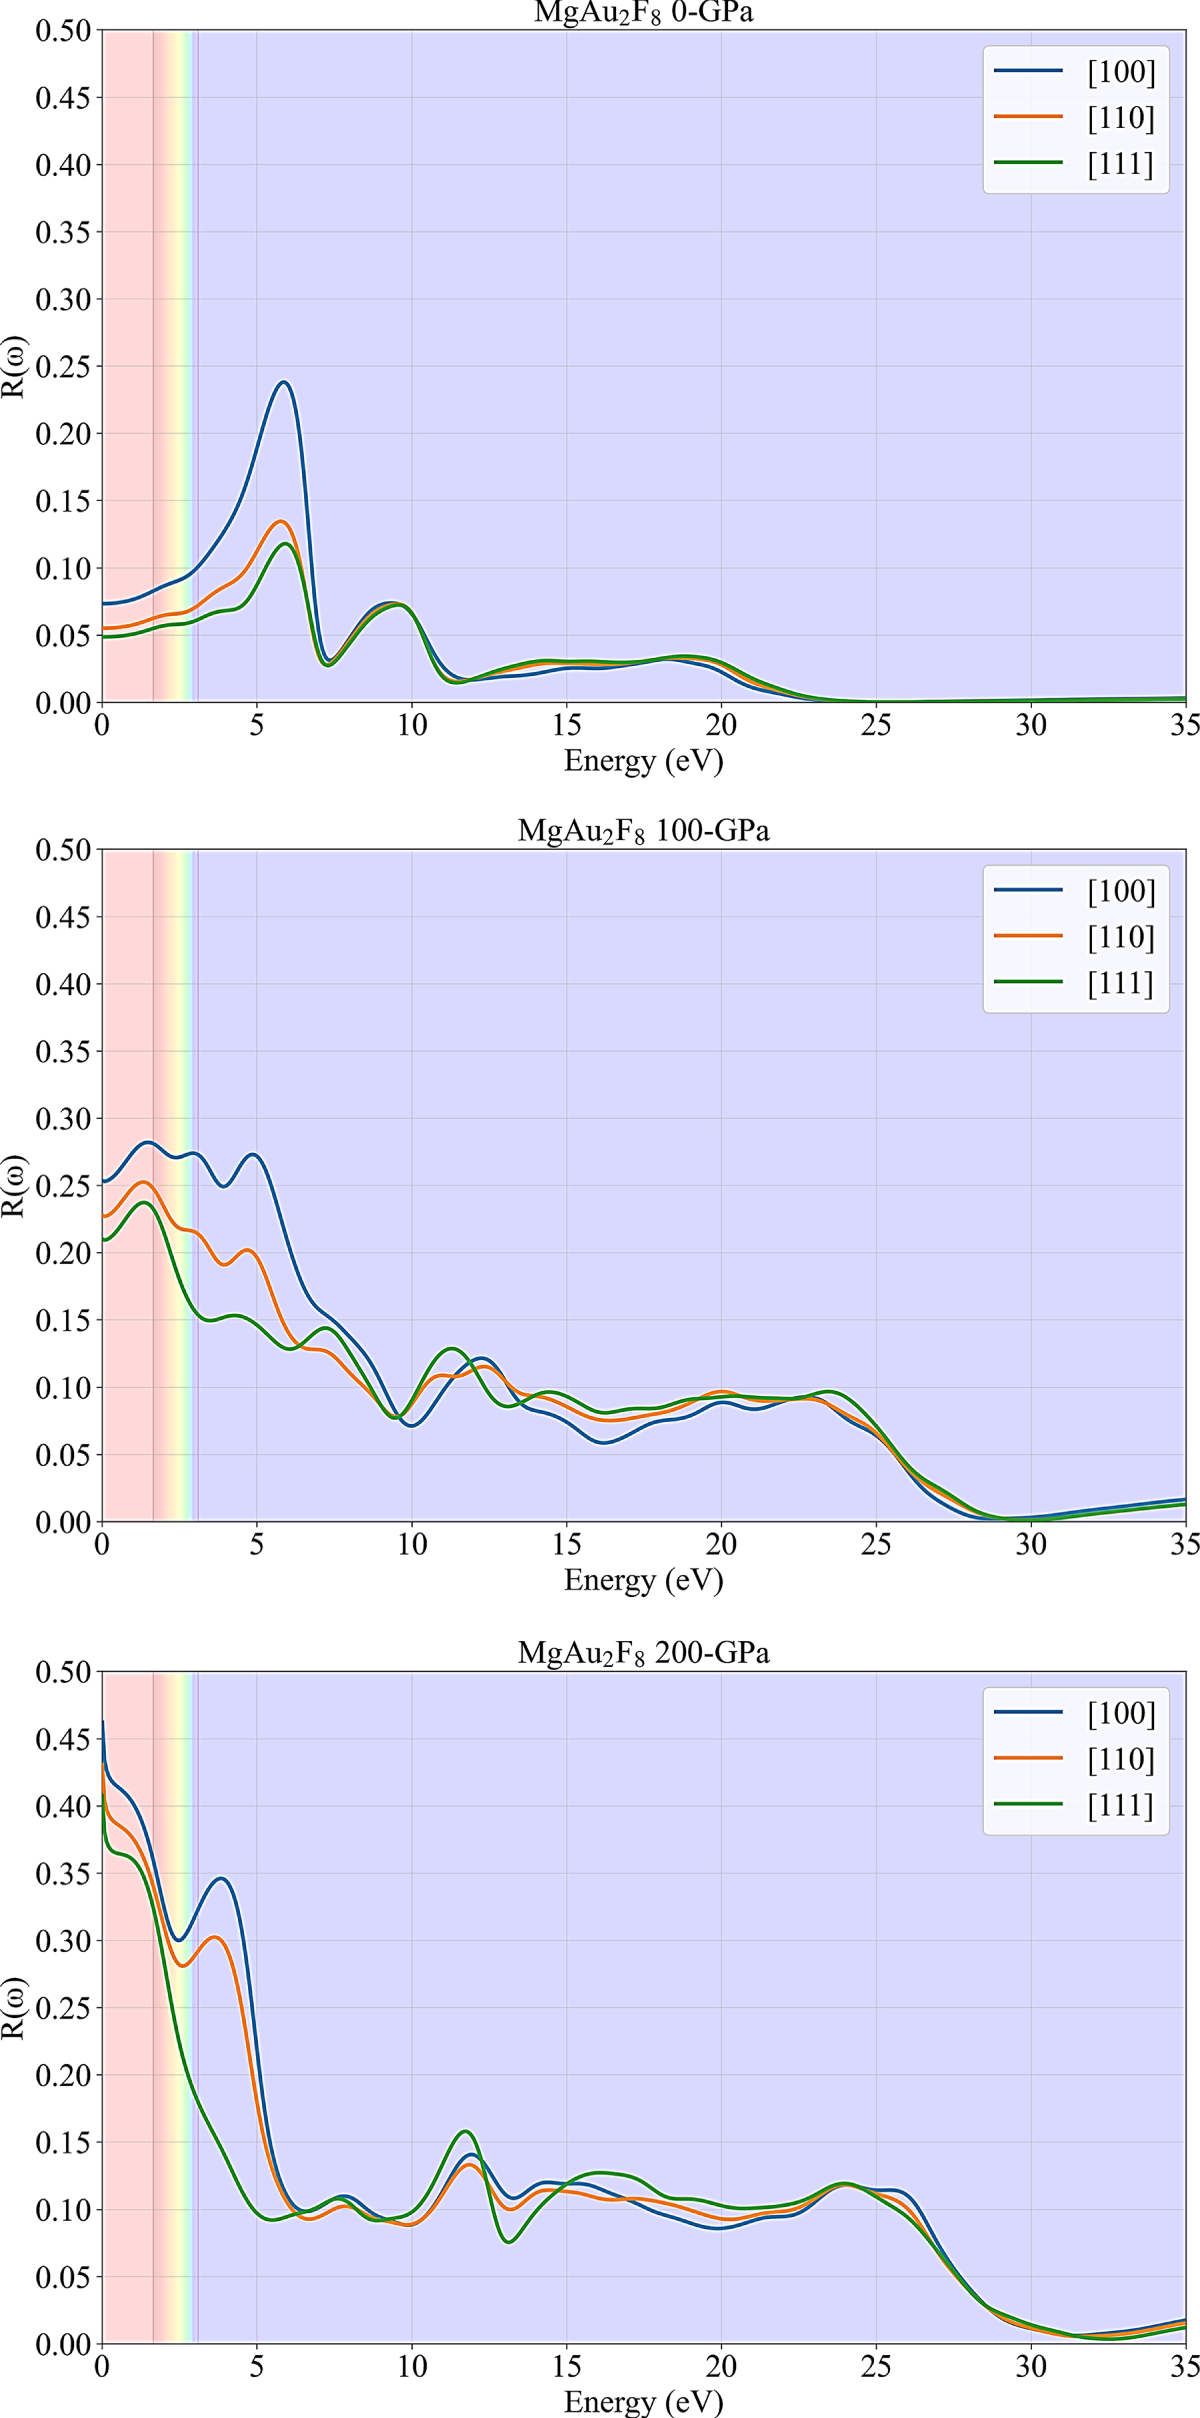
Figure 3: Reflectivity response of MgAu2F8 for different pressures.
Overall, the increased reflectivity at low energies under 200 GPa serves as a direct optical signature of the pressure-induced semiconductor-to-metal transition. As compression forces orbital overlap, the band gap narrows and eventually closes, creating a continuous density of states at the Fermi level. This transition enables intraband transitions, where free carriers can absorb and re-emit low-energy photons that were previously unable to excite electrons across the gap. Consequently, the emergence of these metallic free-carrier dynamics shifts the optical response from transparency to high reflectivity, characteristic of a metallic plasma.
The plots in Fig. 4 provide a detailed view of the anisotropic optical absorption coefficient, α(ω), for MgAu2F8 as a function of photon energy, under varying hydrostatic pressures (0, 100, and 200 GPa) and for three distinct crystallographic directions ([100], [110], [111]). A striking observation across the series is the significant increase in the overall magnitude of the absorption coefficient, accompanied by a clear red shift in the onset and primary peaks as pressure is applied. At ambient pressure (0 GPa), MgAu2F8 exhibits negligible absorption within the visible light spectrum (indicated by the shaded bands, approximately 1.6–3.1 eV), suggesting it would be transparent in this range. The first central absorption peak occurs around 5–6 eV, with the [100] direction showing the strongest absorption. As pressure increases to 100 GPa, the absorption onset shifts noticeably towards lower energies, and significant absorption begins to manifest in the visible range, especially for the [100] direction. The overall absorption magnitude increases dramatically, with a broad, intense peak emerging around 22–24 eV. Further compression to 200 GPa intensifies this trend, resulting in extreme absorption across the entire visible spectrum, indicating that the material would become opaque. The prominent absorption peaks continue to red-shift and broaden, reaching their highest values, which exceed 3 × 105 cm−1 [40]. Throughout all pressure regimes, the material consistently exhibits considerable optical anisotropy, as evidenced by the strong dependence of absorption strength and peak positions on crystallographic orientation, demonstrating that pressure is a powerful tool for tuning the optical properties of MgAu2F8.
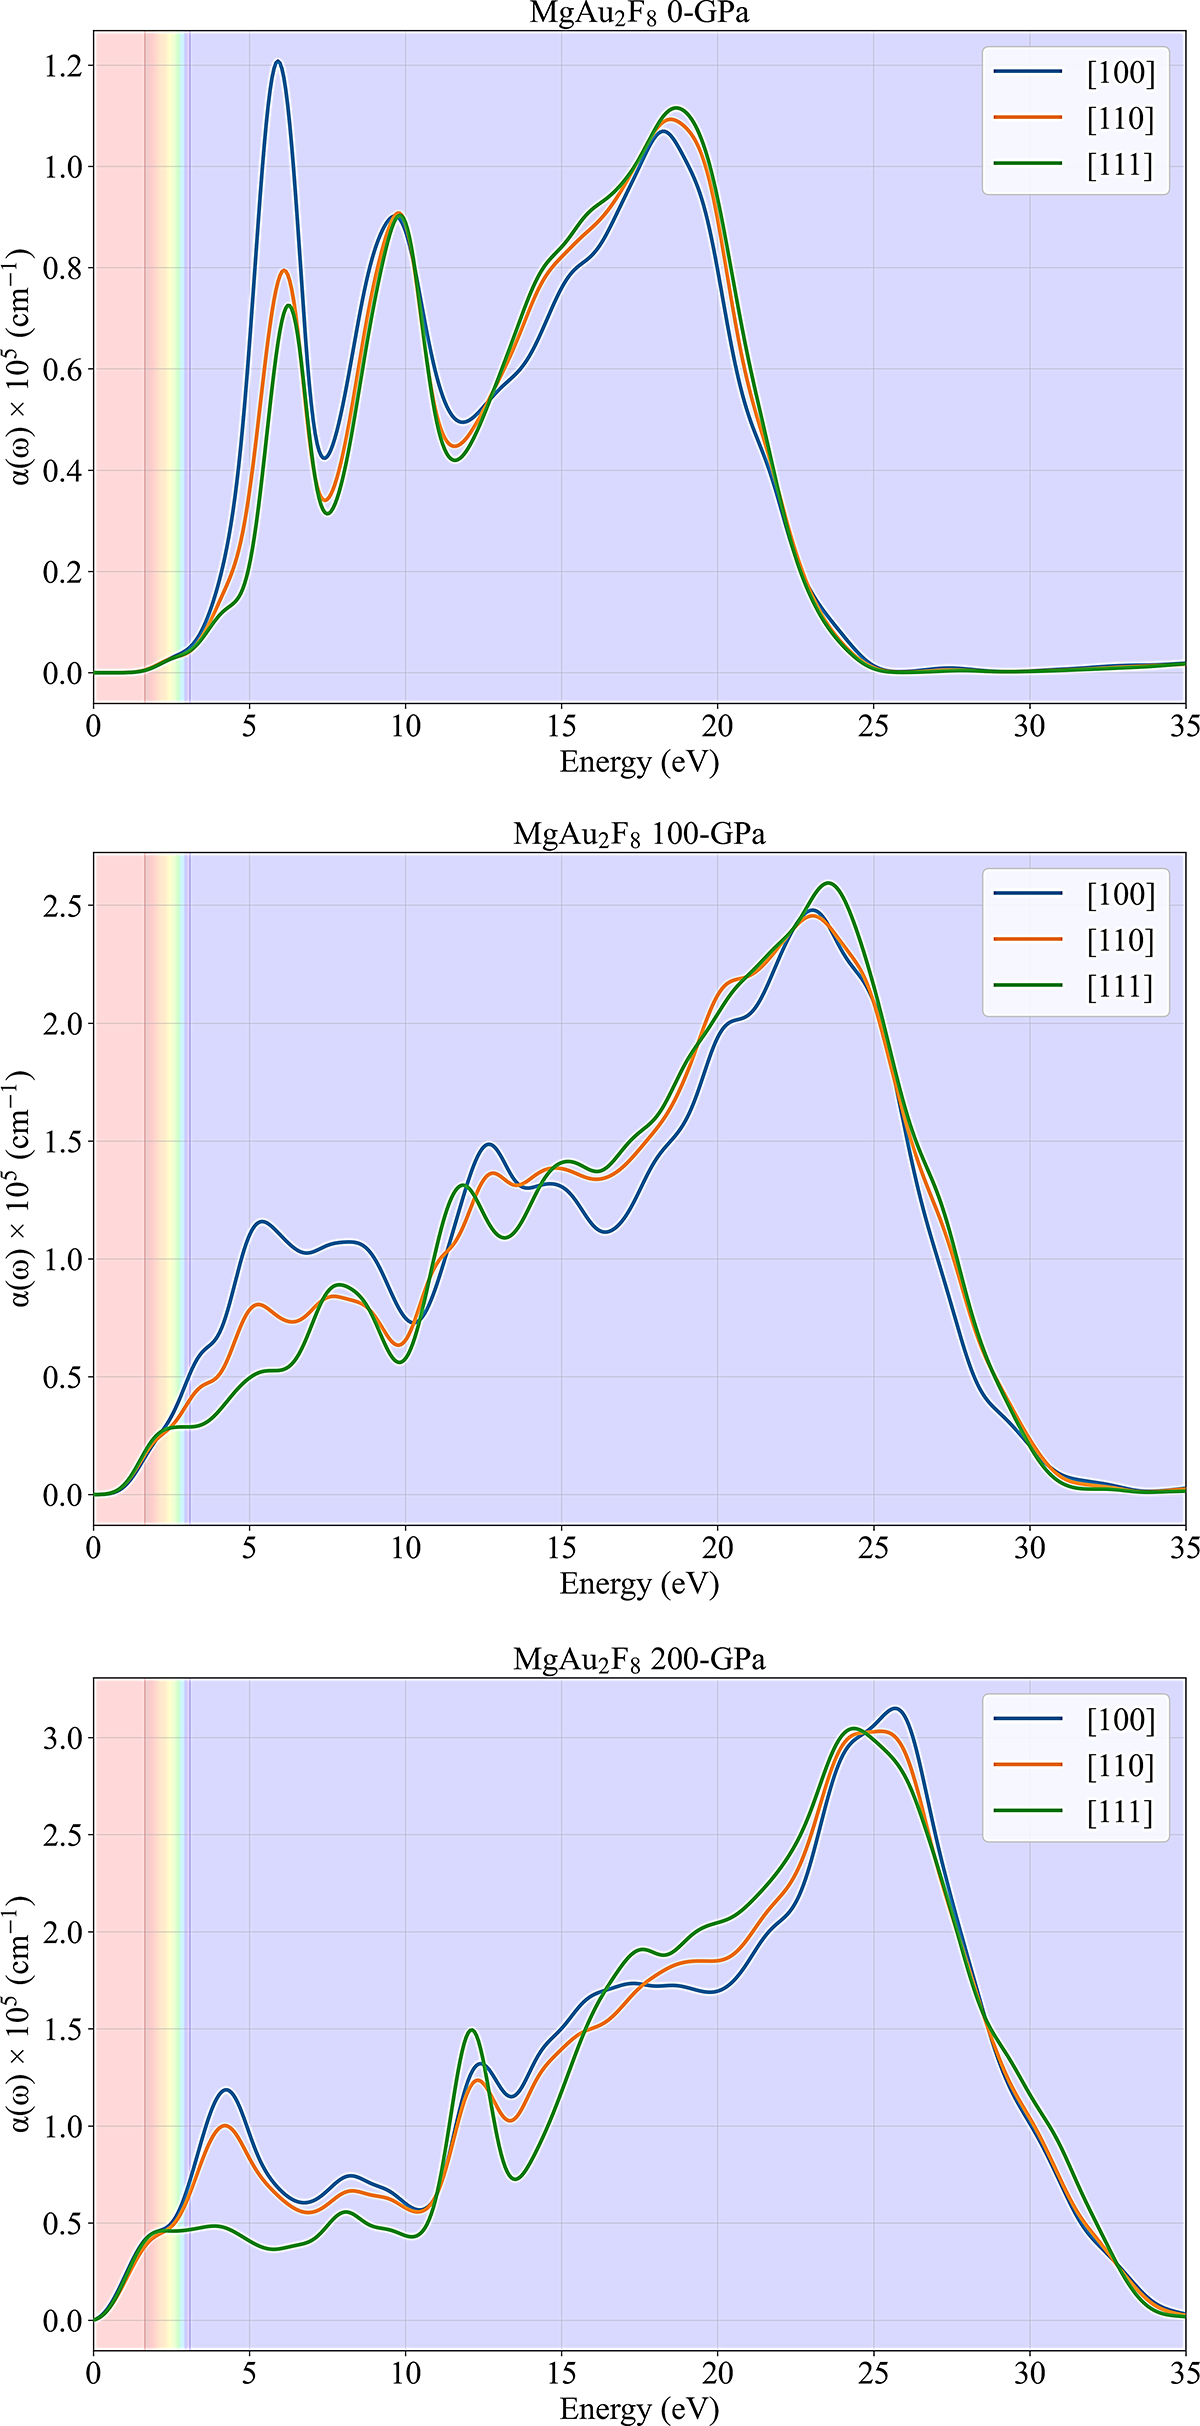
Figure 4: Optical absorption characteristics of MgAu2F8 under pressure.
The plots in Fig. 5 provide a comprehensive look at the complex refractive index, consisting of the real part, n(ω) (refractive index), and the imaginary part, k(ω) (extinction coefficient), for MgAu2F8, across varying pressures (0, 100, 200 GPa) and crystallographic directions ([100], [110], [111]). At 0 GPa (ambient pressure), the MgAu2F8 exhibits relatively high refractive indices (n(ω)) in the visible range (shaded bands), ranging from approximately 1.6 to 2.2, suggesting strong refraction but limited absorption. The extinction coefficient (k(ω)) is near zero in the visible spectrum, confirming the material’s transparency in this range. A significant peak in both n(ω) and k(ω) appears around 5.5 eV, indicating a strong electronic transition at this energy, consistent with peaks observed in reflectivity and absorption. As pressure increases to 100 GPa, both n(ω) and k(ω) undergo substantial changes. The refractive index (n(ω)) shows higher values at lower energies, with a broad peak extending towards the visible spectrum, particularly for the [100] direction. Critically, k(ω) is no longer negligible in the visible range; it rises significantly, indicating the onset of substantial absorption and reflection. A pronounced peak in k(ω) emerges around 4–5 eV, demonstrating a shift of optical activity towards lower energies. Under 200 GPa, these trends are dramatically enlarged. The refractive index (n(ω)) reaches very high values (exceeding three and even 5) at the lowest photon energies, characteristic of highly dense or metallic-like materials. Simultaneously, the extinction coefficient (k(ω)) shows a sharp and substantial increase in the visible region and lower energies, with peaks exceeding 1.5. This high k(ω) in the visible range unequivocally signifies that MgAu2F8 transitions from a transparent material at 0 GPa to a highly absorptive and reflective (opaque) state under extreme pressure. Throughout all pressure conditions, both n(ω) and k(ω) display notable optical anisotropy, with significant differences in magnitude and spectral features depending on the crystallographic orientation. This result indicates that pressure not only tunes the overall optical response but also modulates the material’s directional interaction with light, moving from a transparent dielectric towards a highly reflective and absorptive conductor.
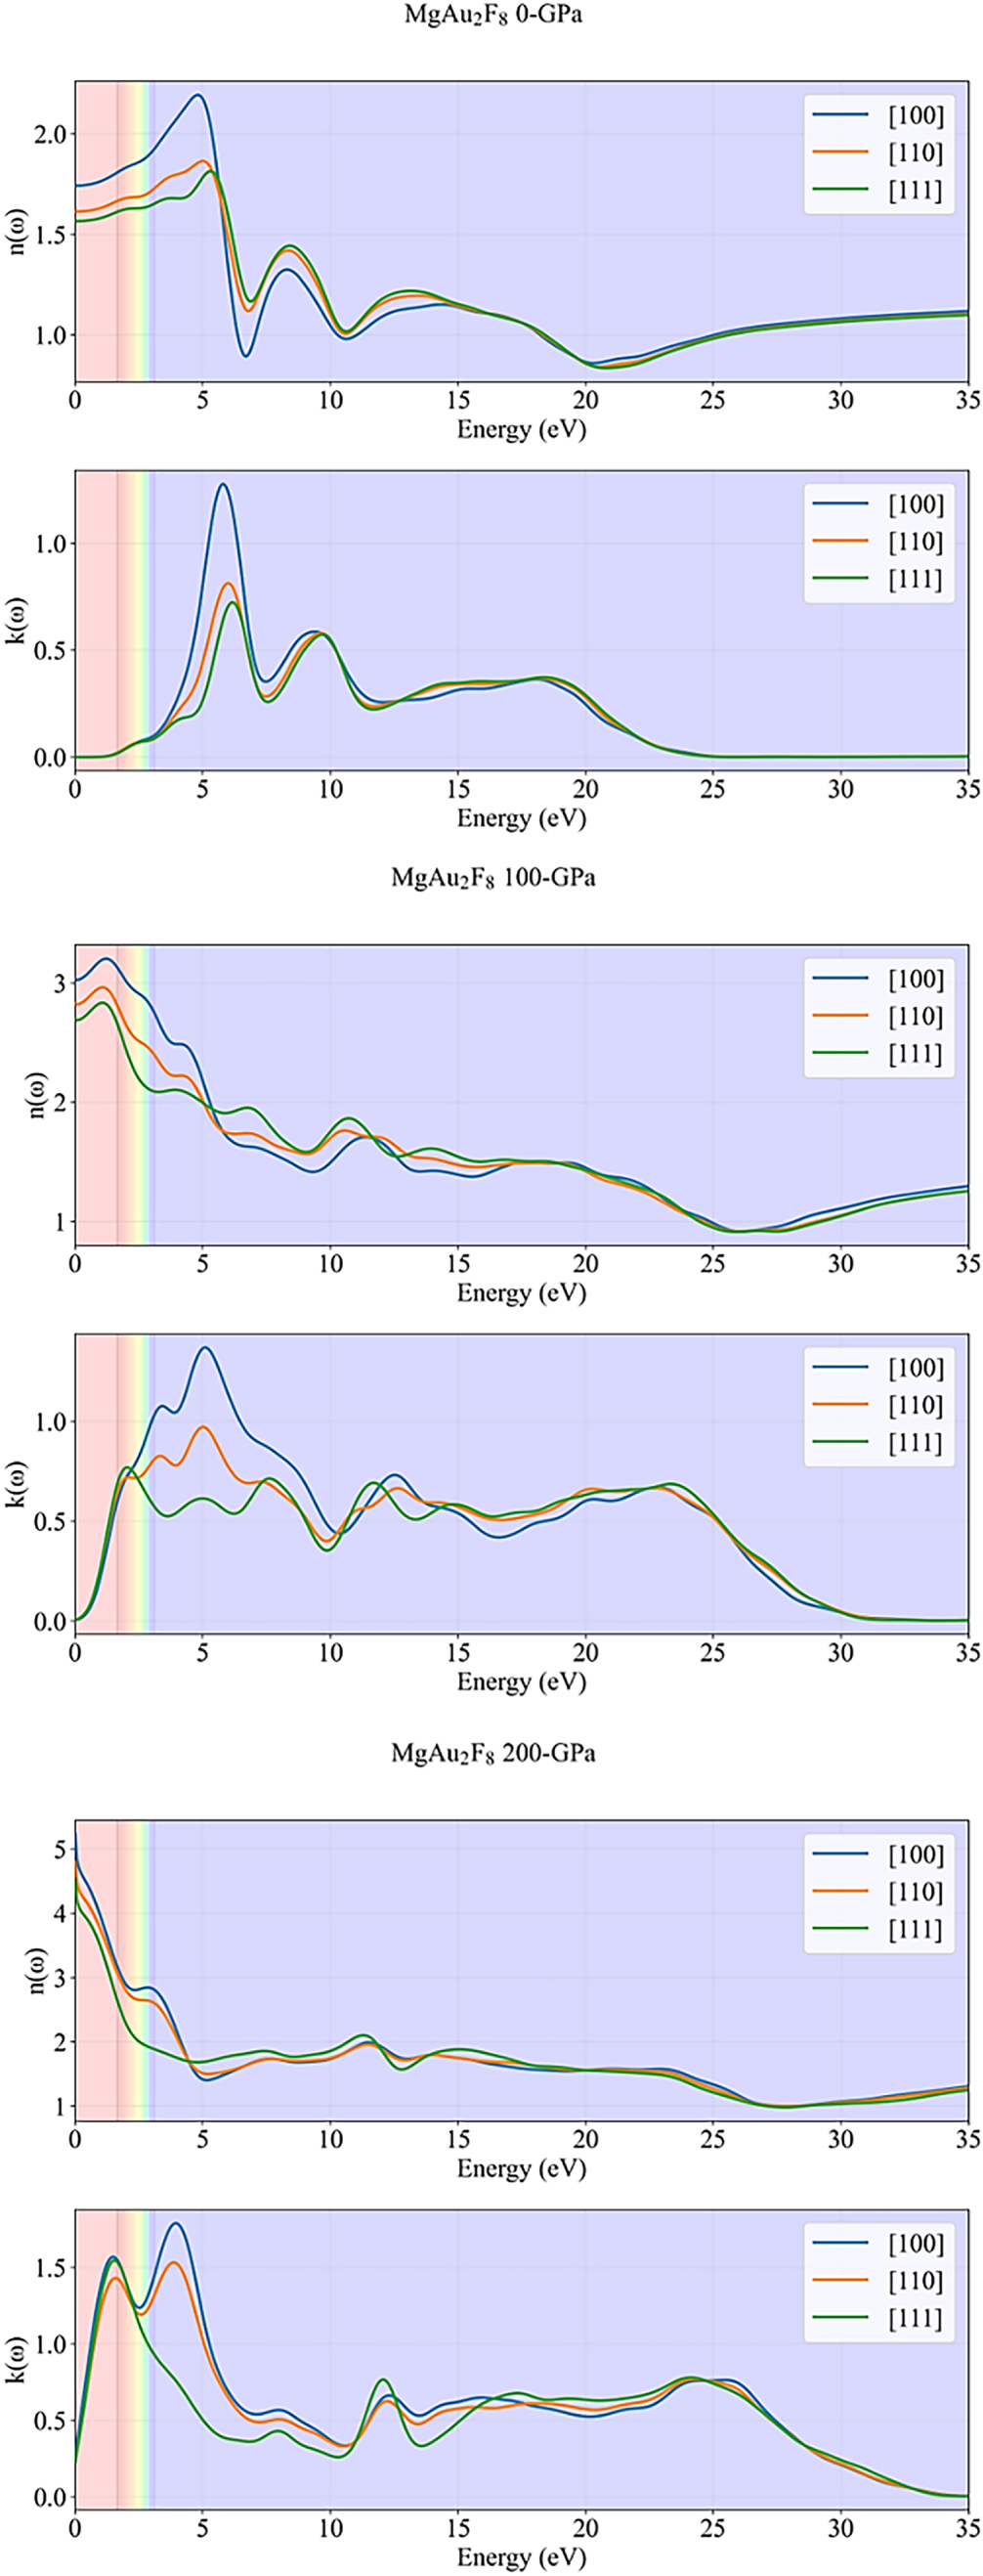
Figure 5: Refractivity performance of MgAu2F8 against pressure.
The plots in Fig. 6 present the real (ε1(ω)) and imaginary (ε2(ω)) parts of the complex dielectric function for MgAu2F8, calculated for three crystallographic directions ([100], [110], [111]) and under increasing hydrostatic pressures (0, 100, and 200 GPa). The dielectric function is fundamental to understanding a material’s optical response, as ε1(ω) relates to polarization and energy storage, while ε2(ω) is directly associated with optical absorption. At 0 GPa, ε1(ω) in the visible region (shaded bands) ranges from about 1.5 to 3.5, with the [100] direction showing the highest values, indicating moderate polarizability and weak anisotropy. ε2(ω) is nearly zero in the visible range, confirming low absorption and transparency, but exhibits a pronounced peak around 5–6 eV, corresponding to strong interband transitions related to valance state of F atom and conduction states of Au atom with secondary contributions from Mg. With increasing pressure to 100 GPa, both ε1(ω) and ε2(ω) increase significantly, especially at low photon energies due to band broadening. ε1(ω) rises to values above 7 in the visible region, and ε2(ω) also becomes substantial, indicating that the material becomes much more polarizable and optically active. The peaks in ε2(ω) shift to lower energies and broaden, reflecting enhanced and red-shifted absorption. The anisotropy between directions becomes more pronounced, especially for the [100] direction. Further, at 200 GPa, these effects are further amplified. ε1(ω) reaches values above 20 at the lowest energies, and ε2(ω) exceeds 10, signifying extremely high polarizability and strong absorption in the visible and near-UV regions. The prominent peaks in both ε1(ω) and ε2(ω) are now located at even lower energies due to metallic character that introduces intraband transitions, and the differences between crystallographic directions remain evident, highlighting strong optical anisotropy under high pressure. Overall, dielectric behavior plots demonstrate that pressure dramatically enhances both the real and imaginary parts of the dielectric function in MgAu2F8, transforming it from a transparent dielectric at ambient conditions to a highly polarizable and absorbing material at high pressures. The strong directional dependence of ε1(ω) and ε2(ω) further underscores the material’s anisotropic optical behavior, which can be finely tuned by external pressure.
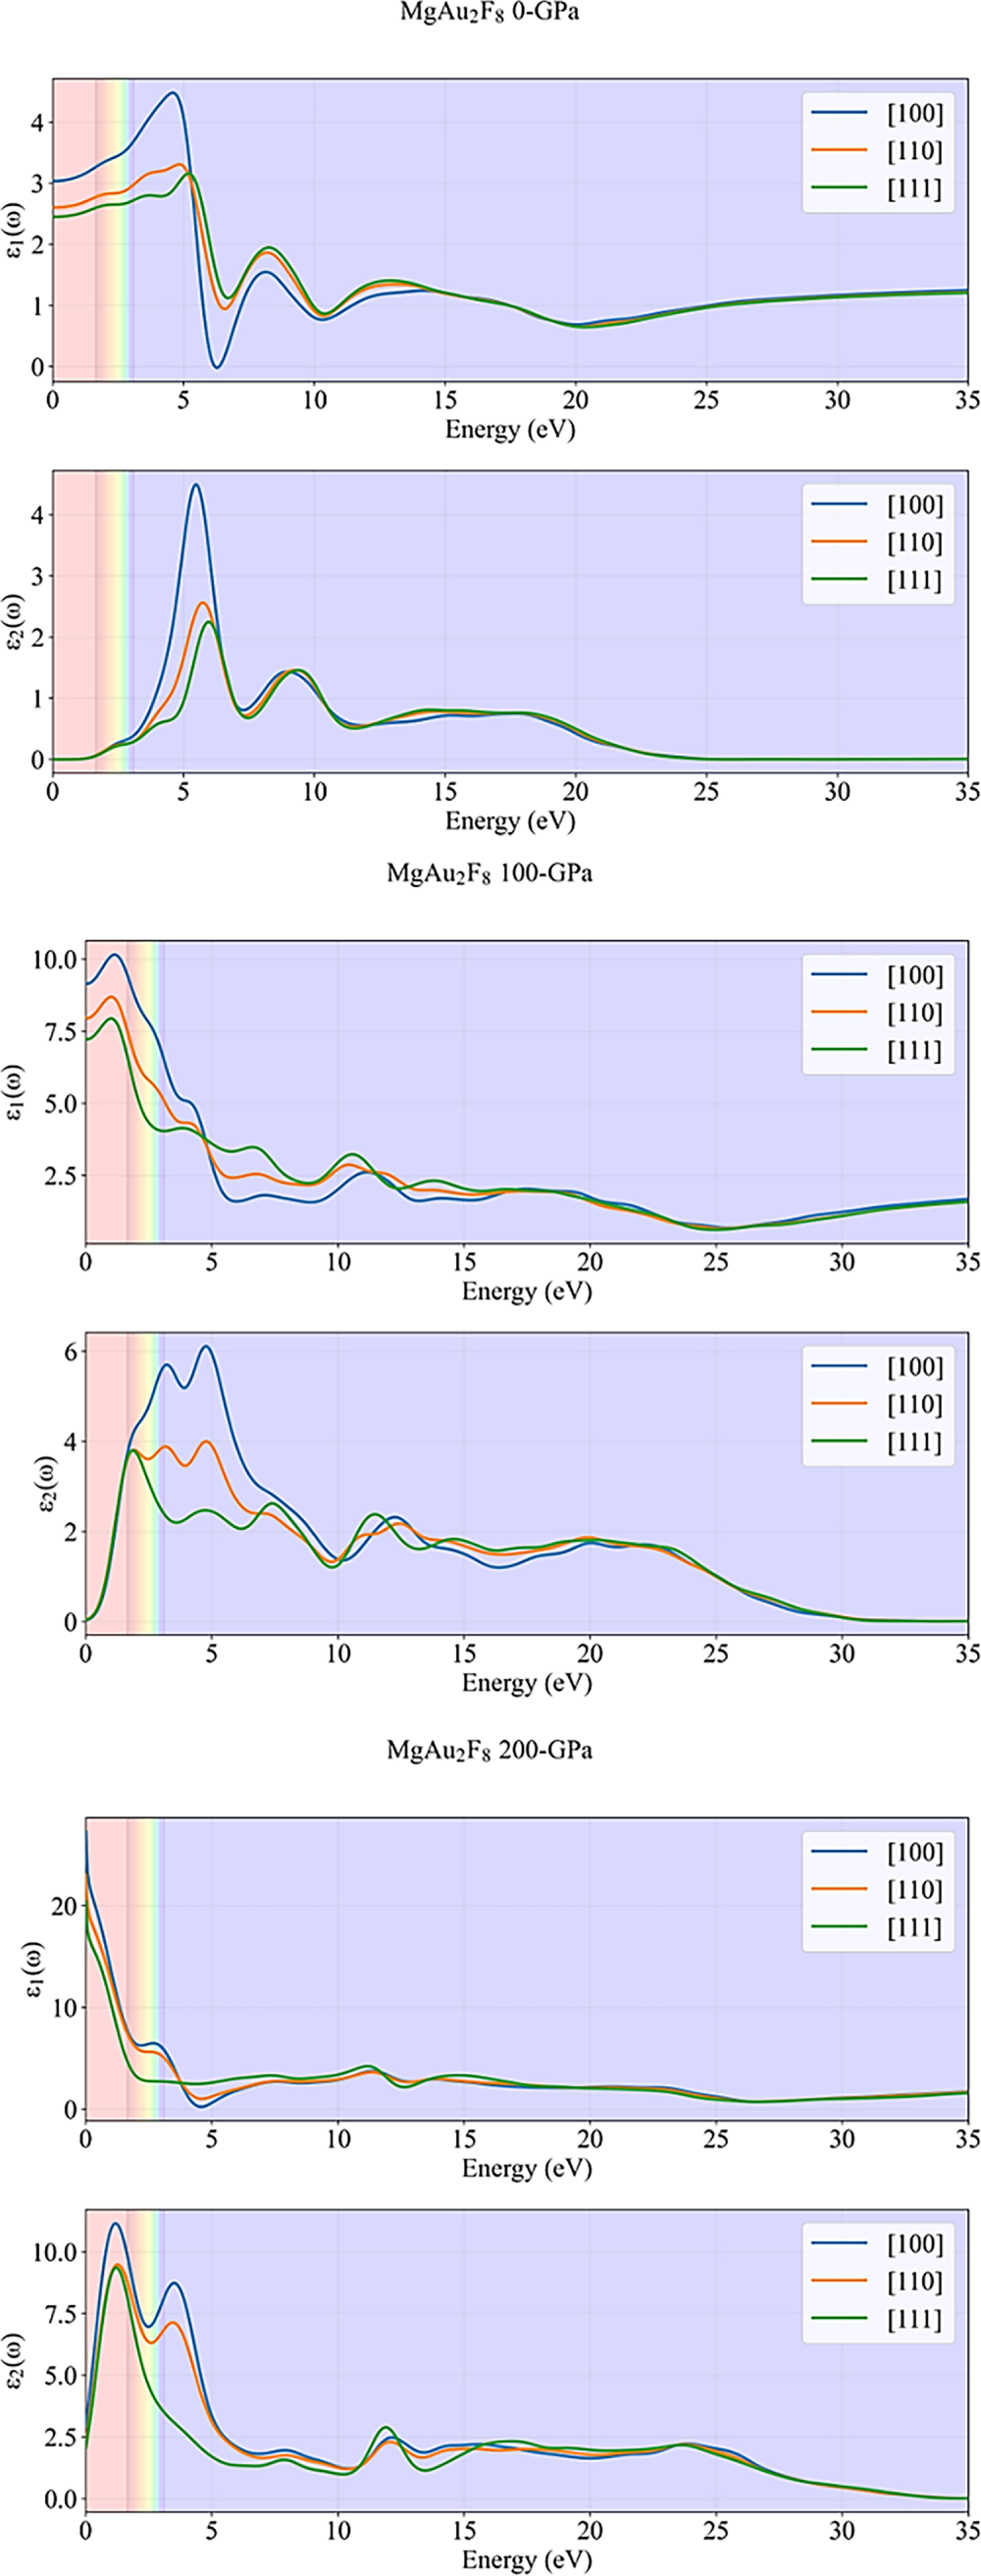
Figure 6: Dielectric function of MgAu2F8 for different pressures.
The curves in Fig. 7 display the real (σ1(ω)) and imaginary (σ2(ω)) parts of the optical conductivity for MgAu2F8, calculated for three crystallographic directions ([100], [110], [111]) and under increasing hydrostatic pressures (0, 100, and 200 GPa). Optical conductivity is a key parameter for understanding how a material responds to electromagnetic fields, with σ1(ω) representing the dissipative (absorptive) part and σ2(ω) the reactive (energy storage) part. At 0 GPa, the real part of the optical conductivity, σ1(ω), is nearly zero in the visible region (shaded bands), indicating that MgAu2F8 behaves as an insulator or transparent material at ambient pressure. Pronounced peaks in σ1(ω) appear around 5–6 eV and 10–20 eV, corresponding to strong interband electronic transitions. The imaginary part, σ2(ω), shows both positive and negative values, with notable features at similar energies, reflecting the complex interplay between absorption and energy storage. As pressure increases to 100 GPa, σ1(ω) rises significantly in the visible and near-UV regions, especially for the [100] direction, indicating a transition toward metallic or semiconducting behavior with enhanced optical absorption. The peaks in σ1(ω) shift to lower energies and become broader, while σ2(ω) also increases in magnitude and displays more pronounced oscillations, signifying stronger and more complex optical responses. The anisotropy between directions becomes more evident, particularly at lower energies. At 200 GPa, these trends are further increased. σ1(ω) reaches even higher values in the visible and low-energy regions, with broad, intense peaks extending up to 25 eV, indicating that MgAu2F8 becomes highly conductive and optically active under extreme pressure. σ2(ω) also shows large oscillations and negative values, especially for the [111] direction, highlighting strong energy storage and release processes. The differences between crystallographic directions remain significant, underscoring the pronounced optical anisotropy of MgAu2F8 under high pressure.
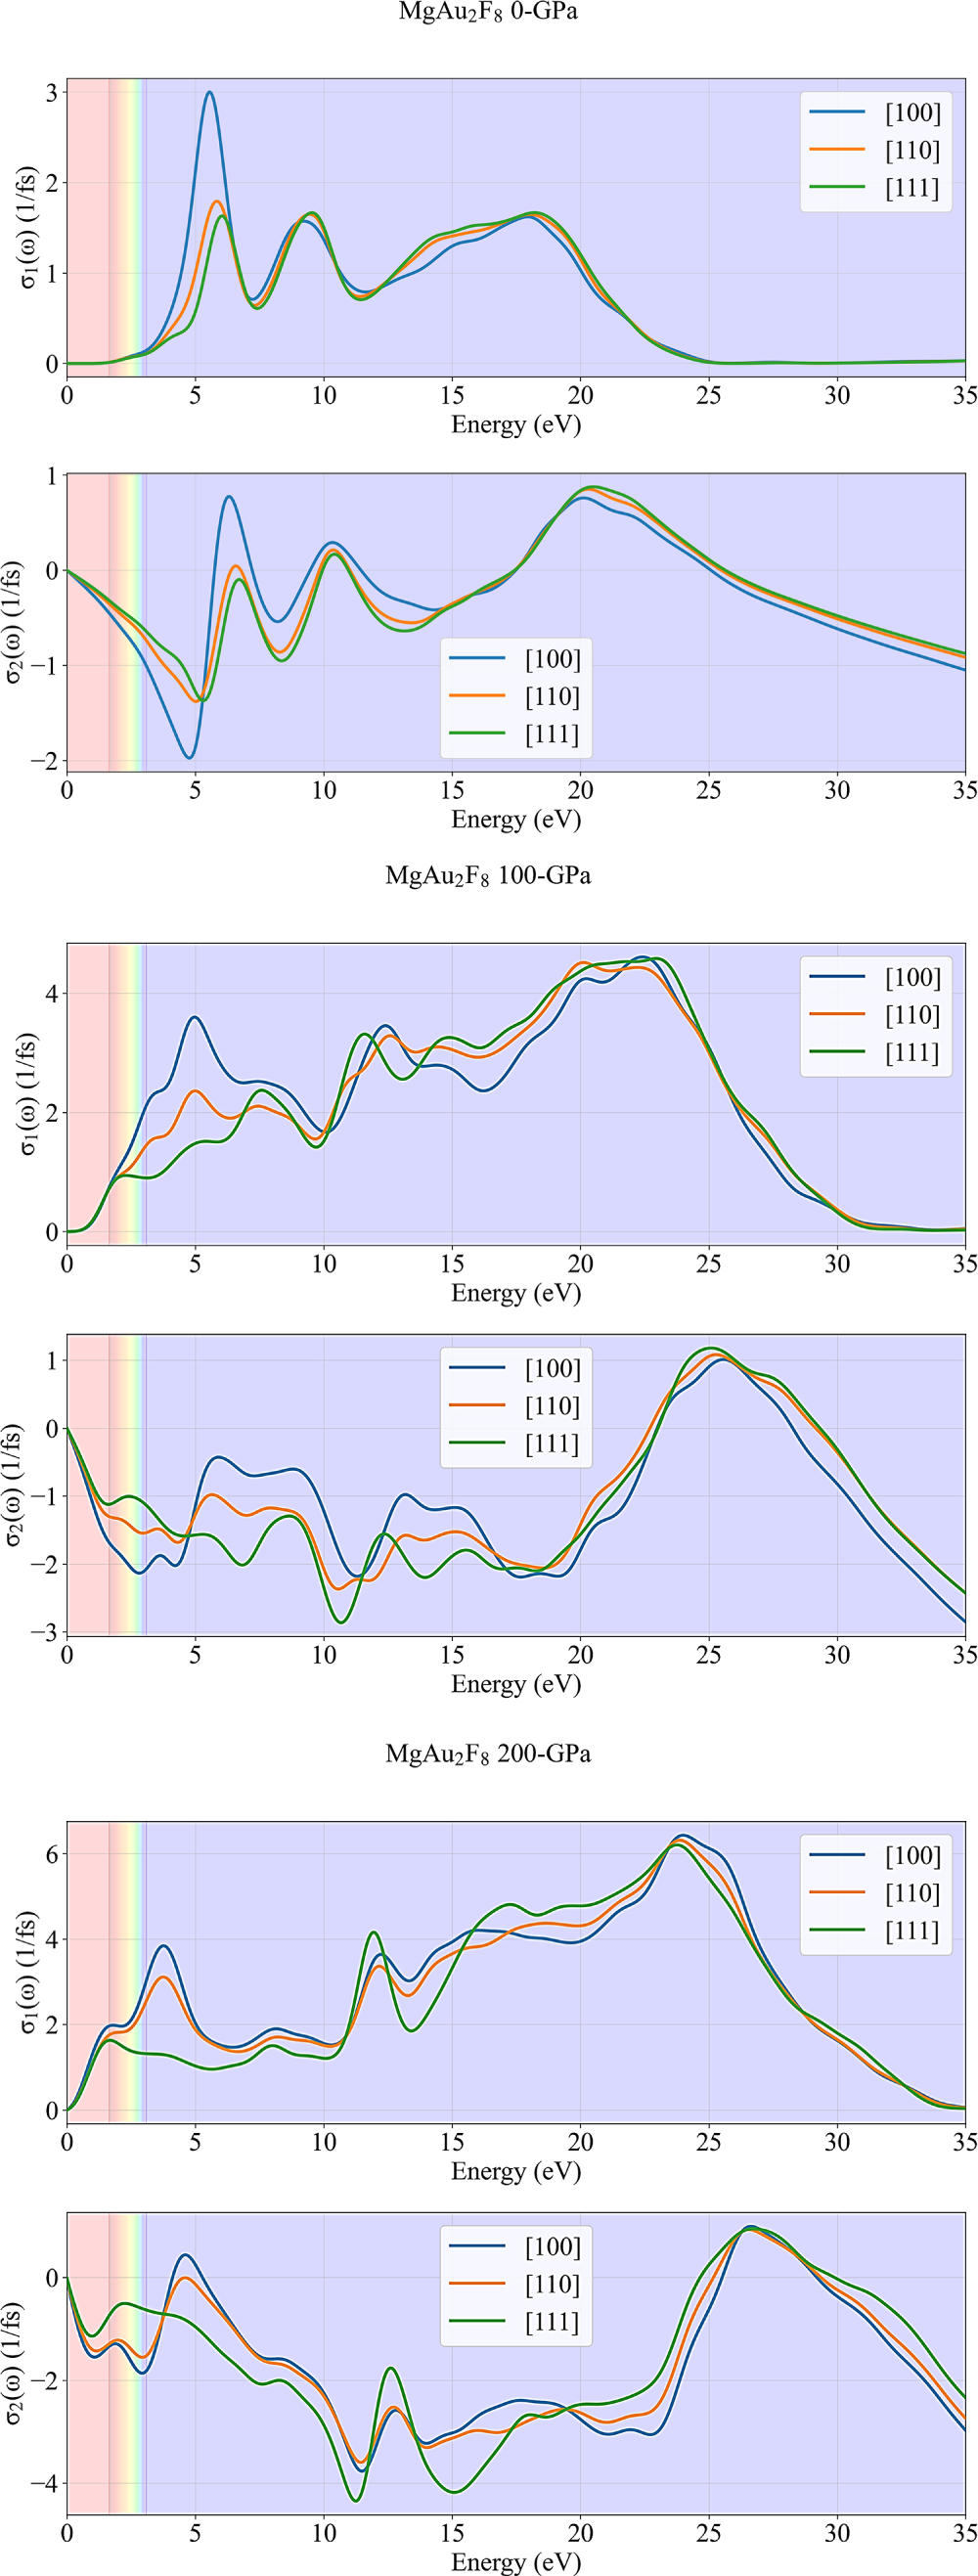
Figure 7: Pressure-dependency of the optical conductivity of MgAu2F8.
Overall, these plots demonstrate that increasing pressure dramatically enhances the optical conductivity of MgAu2F8, transforming it from a transparent insulator at ambient conditions to a highly absorbing and conductive material at high pressures. The strong directional dependence of both σ1(ω) and σ2(ω) further emphasizes the tunable and anisotropic nature of MgAu2F8’s optical properties.
The plots in Fig. 8 illustrate the energy loss function, L(ω), for MgAu2F8 along three crystallographic directions ([100], [110], [111]) under different hydrostatic pressures (0, 100, and 200 GPa). The energy loss function is a crucial optical property that describes the energy lost by fast electrons traversing a material, and its peaks are closely related to collective electronic excitations such as plasmons. At 0 GPa, the loss function exhibits three prominent peaks: the first at approximately 6 eV, the second near 10 eV, and the most intense one at around 20 eV. These peaks correspond to plasmon resonances and interband transitions, with the [100] direction generally showing the highest intensity, indicating some degree of anisotropy. In the visible region (shaded bands), L(ω) remains low, suggesting minimal energy loss for electrons in this range, which is consistent with the material’s transparency at ambient pressure. When the pressure is increased to 100 GPa, the primary plasmon peak shifts to a higher energy, around 25 eV, and becomes sharper and more intense, especially for the [100] and [110] directions. Additional smaller peaks appear at lower energies, reflecting the increased complexity of the electronic structure under compression. The loss function in the visible region remains relatively low. Still, the overall intensity and number of features in L(ω) increase, indicating enhanced electronic excitations and a more metallic character. At 200 GPa, the highest plasmon peak remains near 25 eV but broadens slightly, and the lower-energy features become more pronounced and shift further to lower energies. The anisotropy between directions persists but is less pronounced at the central peak. The overall trend is a broadening and red-shifting of the loss features at lower energies, consistent with the material’s transition toward a highly polarizable and conductive state under extreme pressure. In summary, these plots indicate that the energy loss function of MgAu2F8 is sensitive to pressure, with plasmon peaks shifting to higher energies and becoming more pronounced as pressure increases. The material’s anisotropic response is evident, especially at lower pressures, and the evolution of L(ω) with pressure highlights the tunability of electronic excitations and collective behaviors in MgAu2F8.
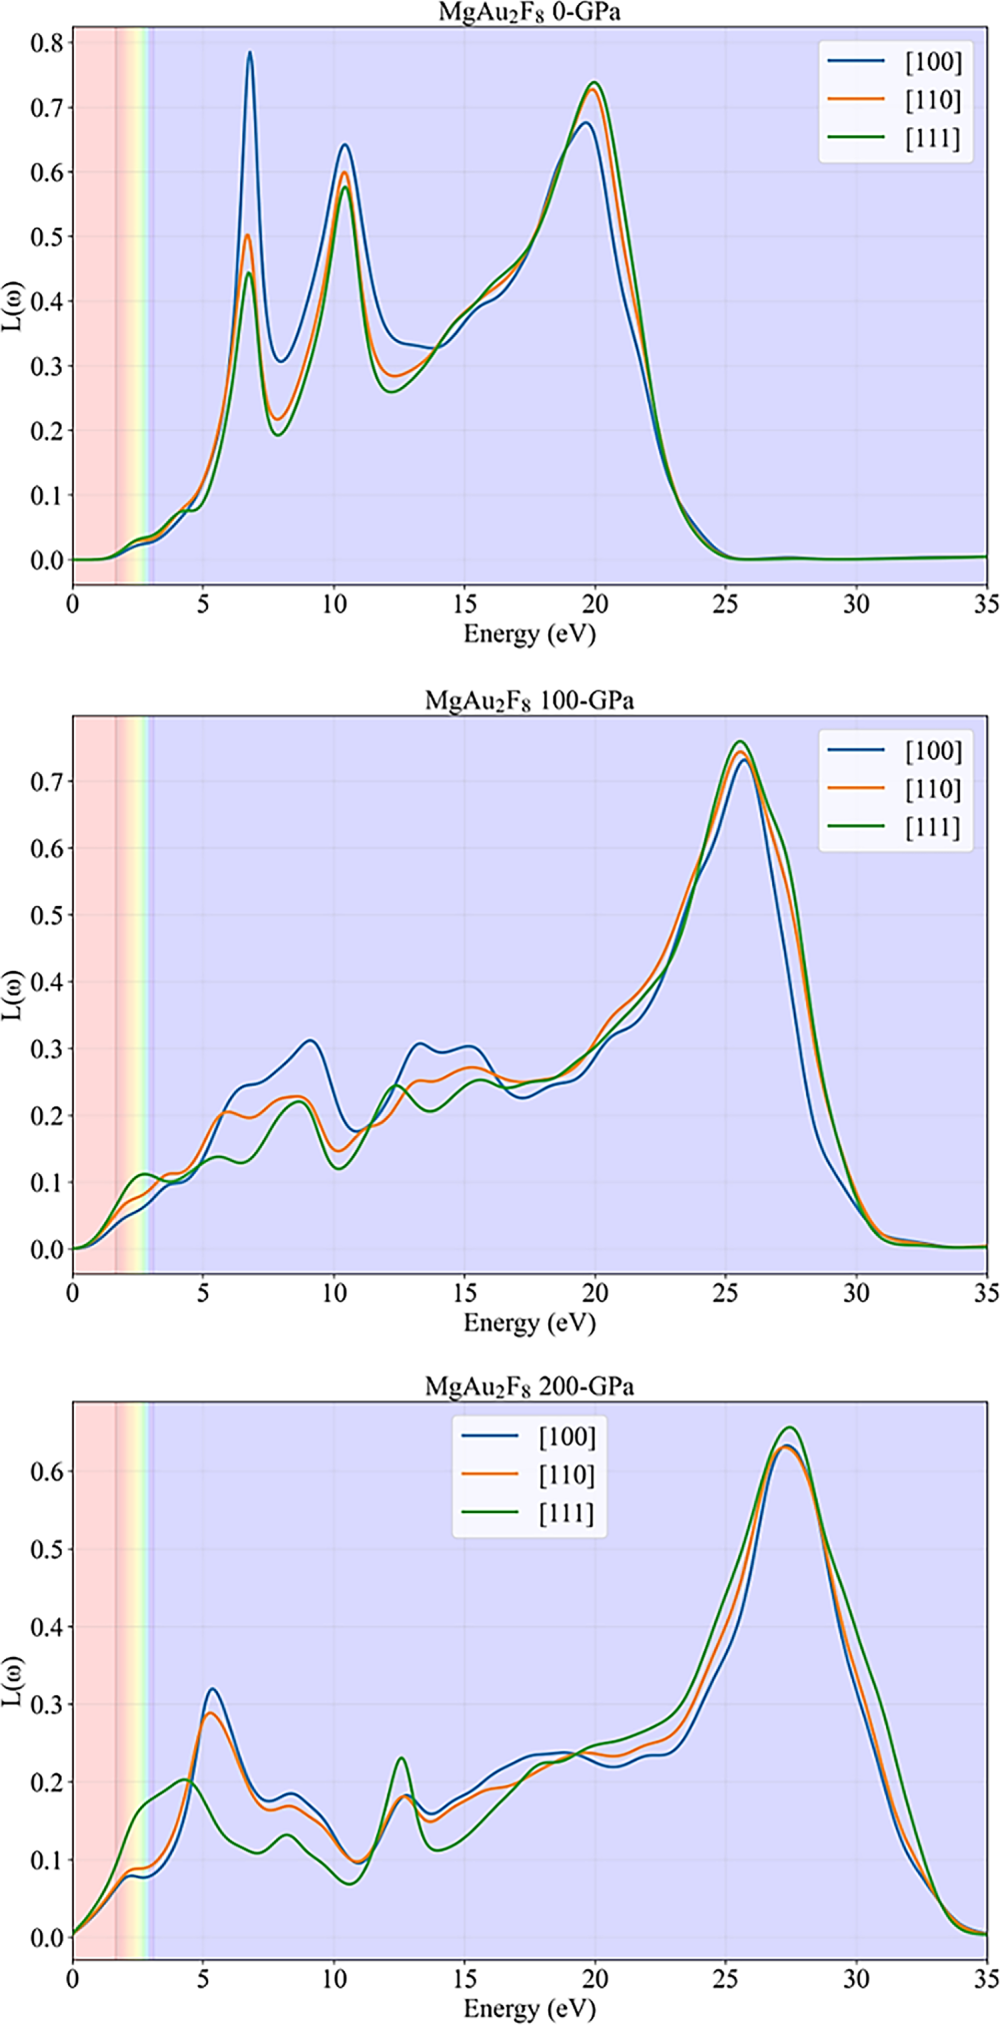
Figure 8: Loss function plots of MgAu2F8 under various pressures.
3.3 Thermoelectric Response of MgAu2F8
The thermoelectric properties of materials, which describe their ability to convert heat into electrical energy and vice versa, are of significant interest for energy harvesting and solid-state cooling applications [46–50]. Within the framework of DFT, these properties can be systematically investigated using the BoltzTraP2 code, which employs semiclassical Boltzmann transport theory to calculate key transport coefficients, including the Seebeck coefficient, electrical conductivity, and electronic thermal conductivity [46–50]. By utilizing the electronic band structure data obtained from DFT calculations, BoltzTraP2 [36] enables accurate, parameter-free predictions of thermoelectric performance over a range of temperatures and carrier concentrations. This approach provides valuable insights into the intrinsic transport behavior of materials and guides the design of novel compounds with enhanced thermoelectric efficiency.
The thermoelectric properties of MgAu2F8, as determined by DFT and BoltzTraP2 [36] calculations, exhibit a pronounced evolution with increasing pressure and temperature, as illustrated in Figs. 9–11. At ambient pressure (0 GPa), due to wide band gap of 1.92 eV, the Seebeck coefficient (top panels) exhibits sharp oscillations and large absolute values, reaching up to ±1500 μV/K near the Fermi level, especially at lower temperatures (300 K) for room temperature usages. This behavior suggests a strong sensitivity to carrier concentration and a potential for high thermopower, but also indicates instability and the possibility of bipolar conduction effects [46–50]. As the temperature increases to 800 K, the Seebeck coefficient becomes smoother, and its peaks broaden, reflecting increased carrier excitation and thermal smearing [46–50] in particular for high temperature applications. The electrical conductivity scaled by relaxation time (σ/τ, middle panels) is relatively low near the Fermi level at 0 GPa, with pronounced peaks away from it, and shows a modest increase with temperature, consistent with the semiconducting nature of the MgAu2F8 at ambient conditions [46–50]. The electronic thermal conductivity (κe/τ, bottom panels) follows a similar trend, remaining low near the Fermi level and increasing with both energy and temperature.
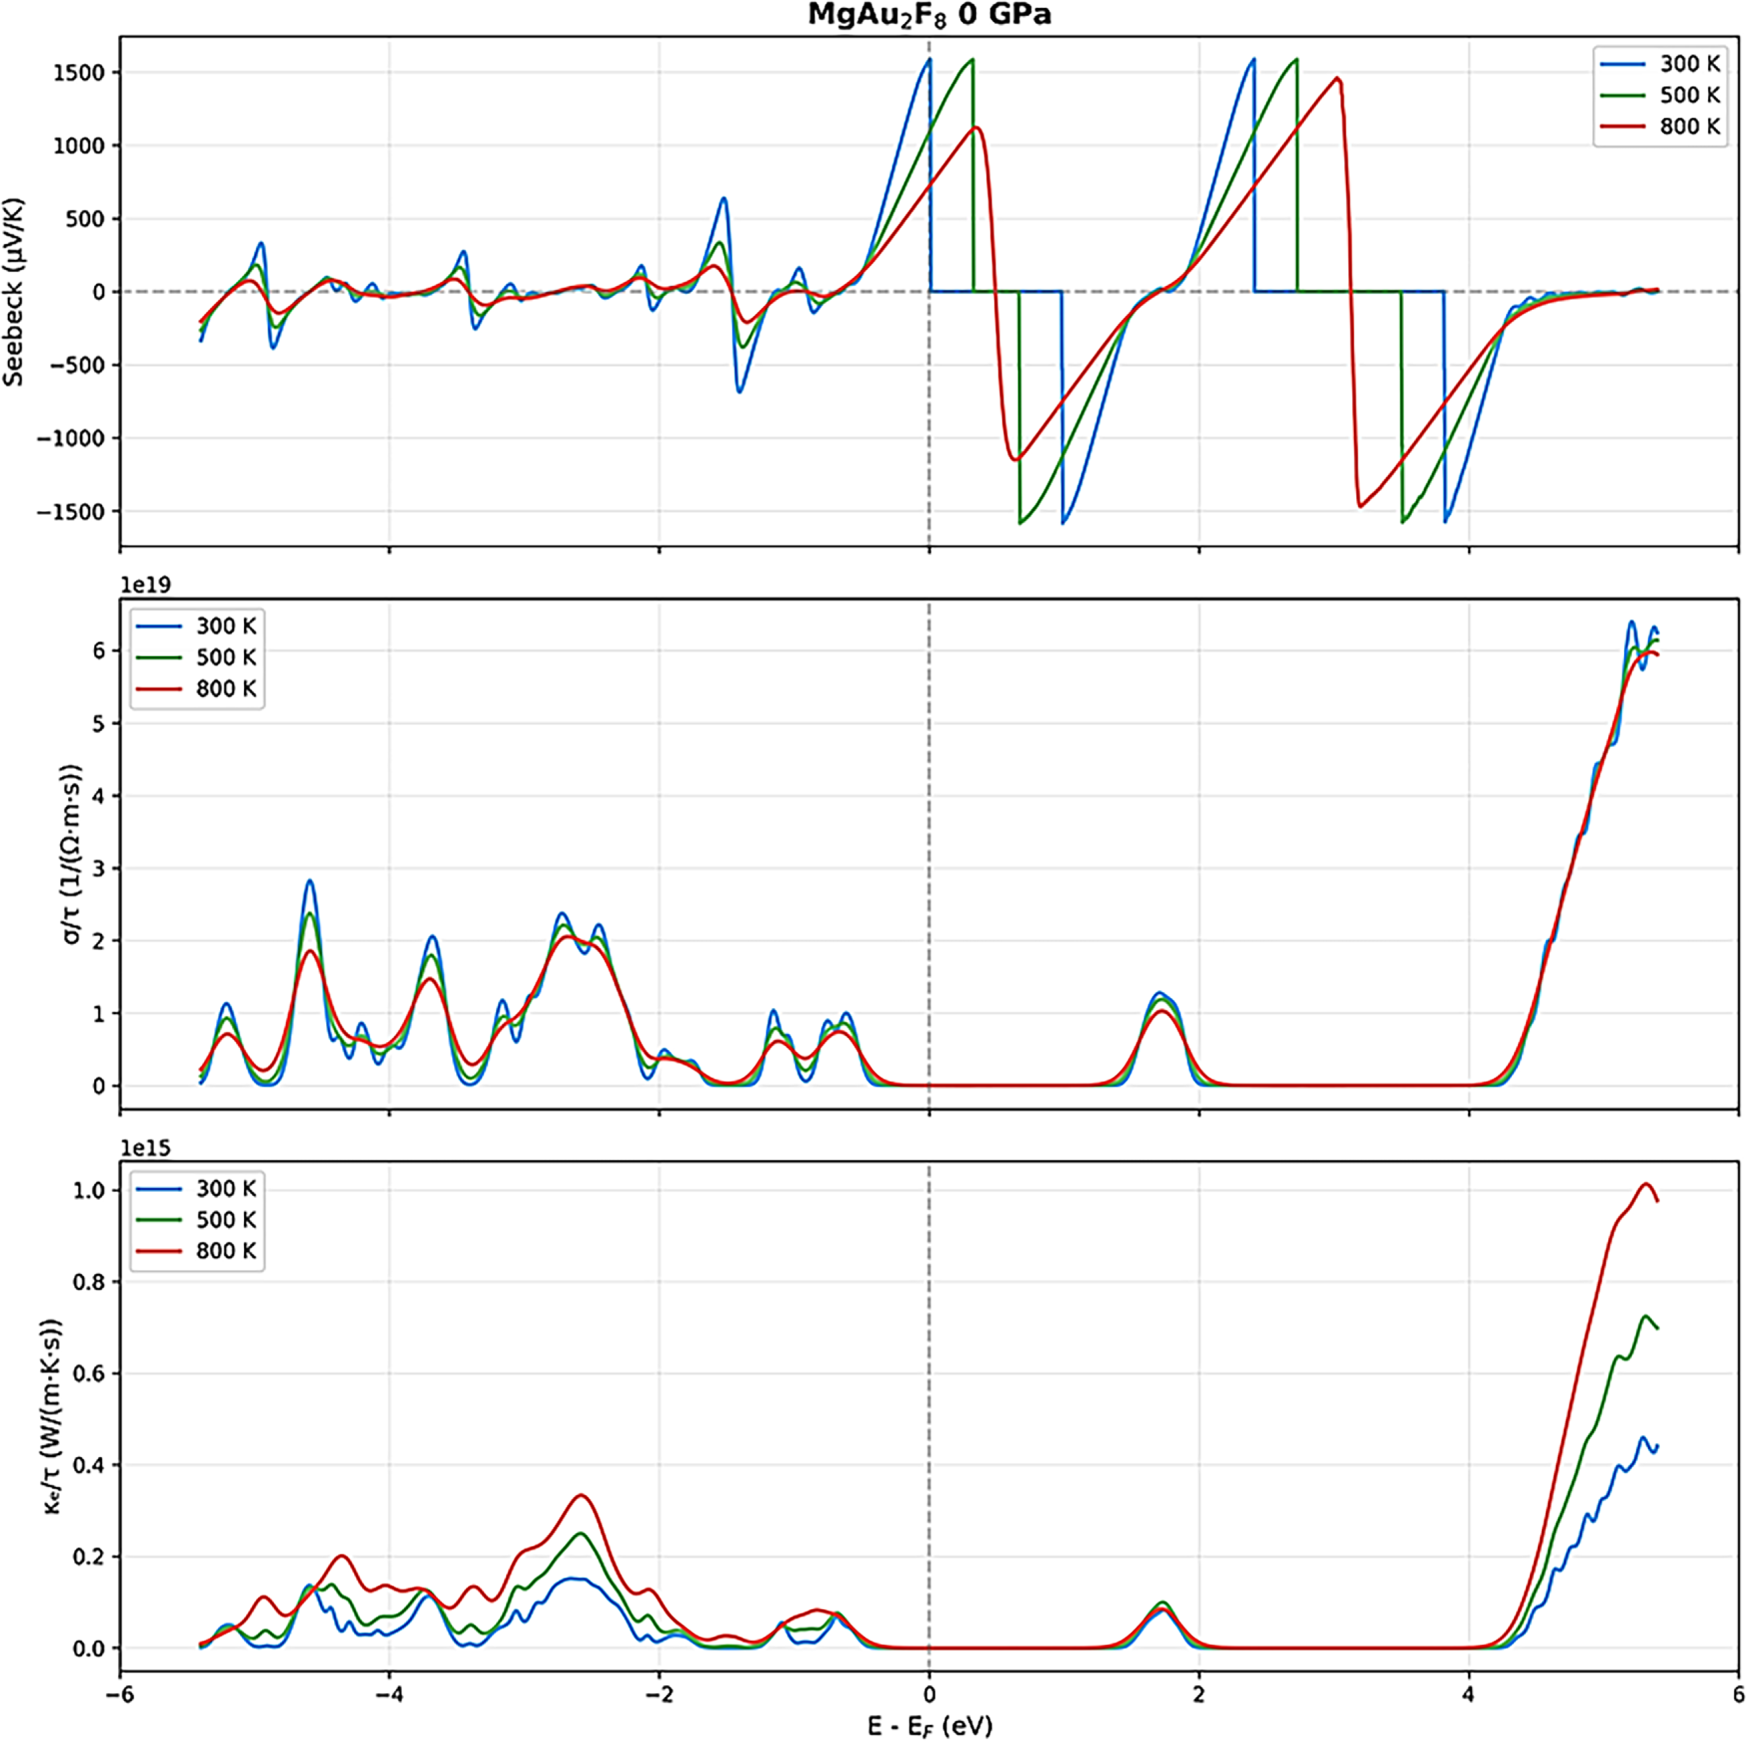
Figure 9: Thermoelectric parameters of MgAu2F8 under 0 GPa under various temperatures.
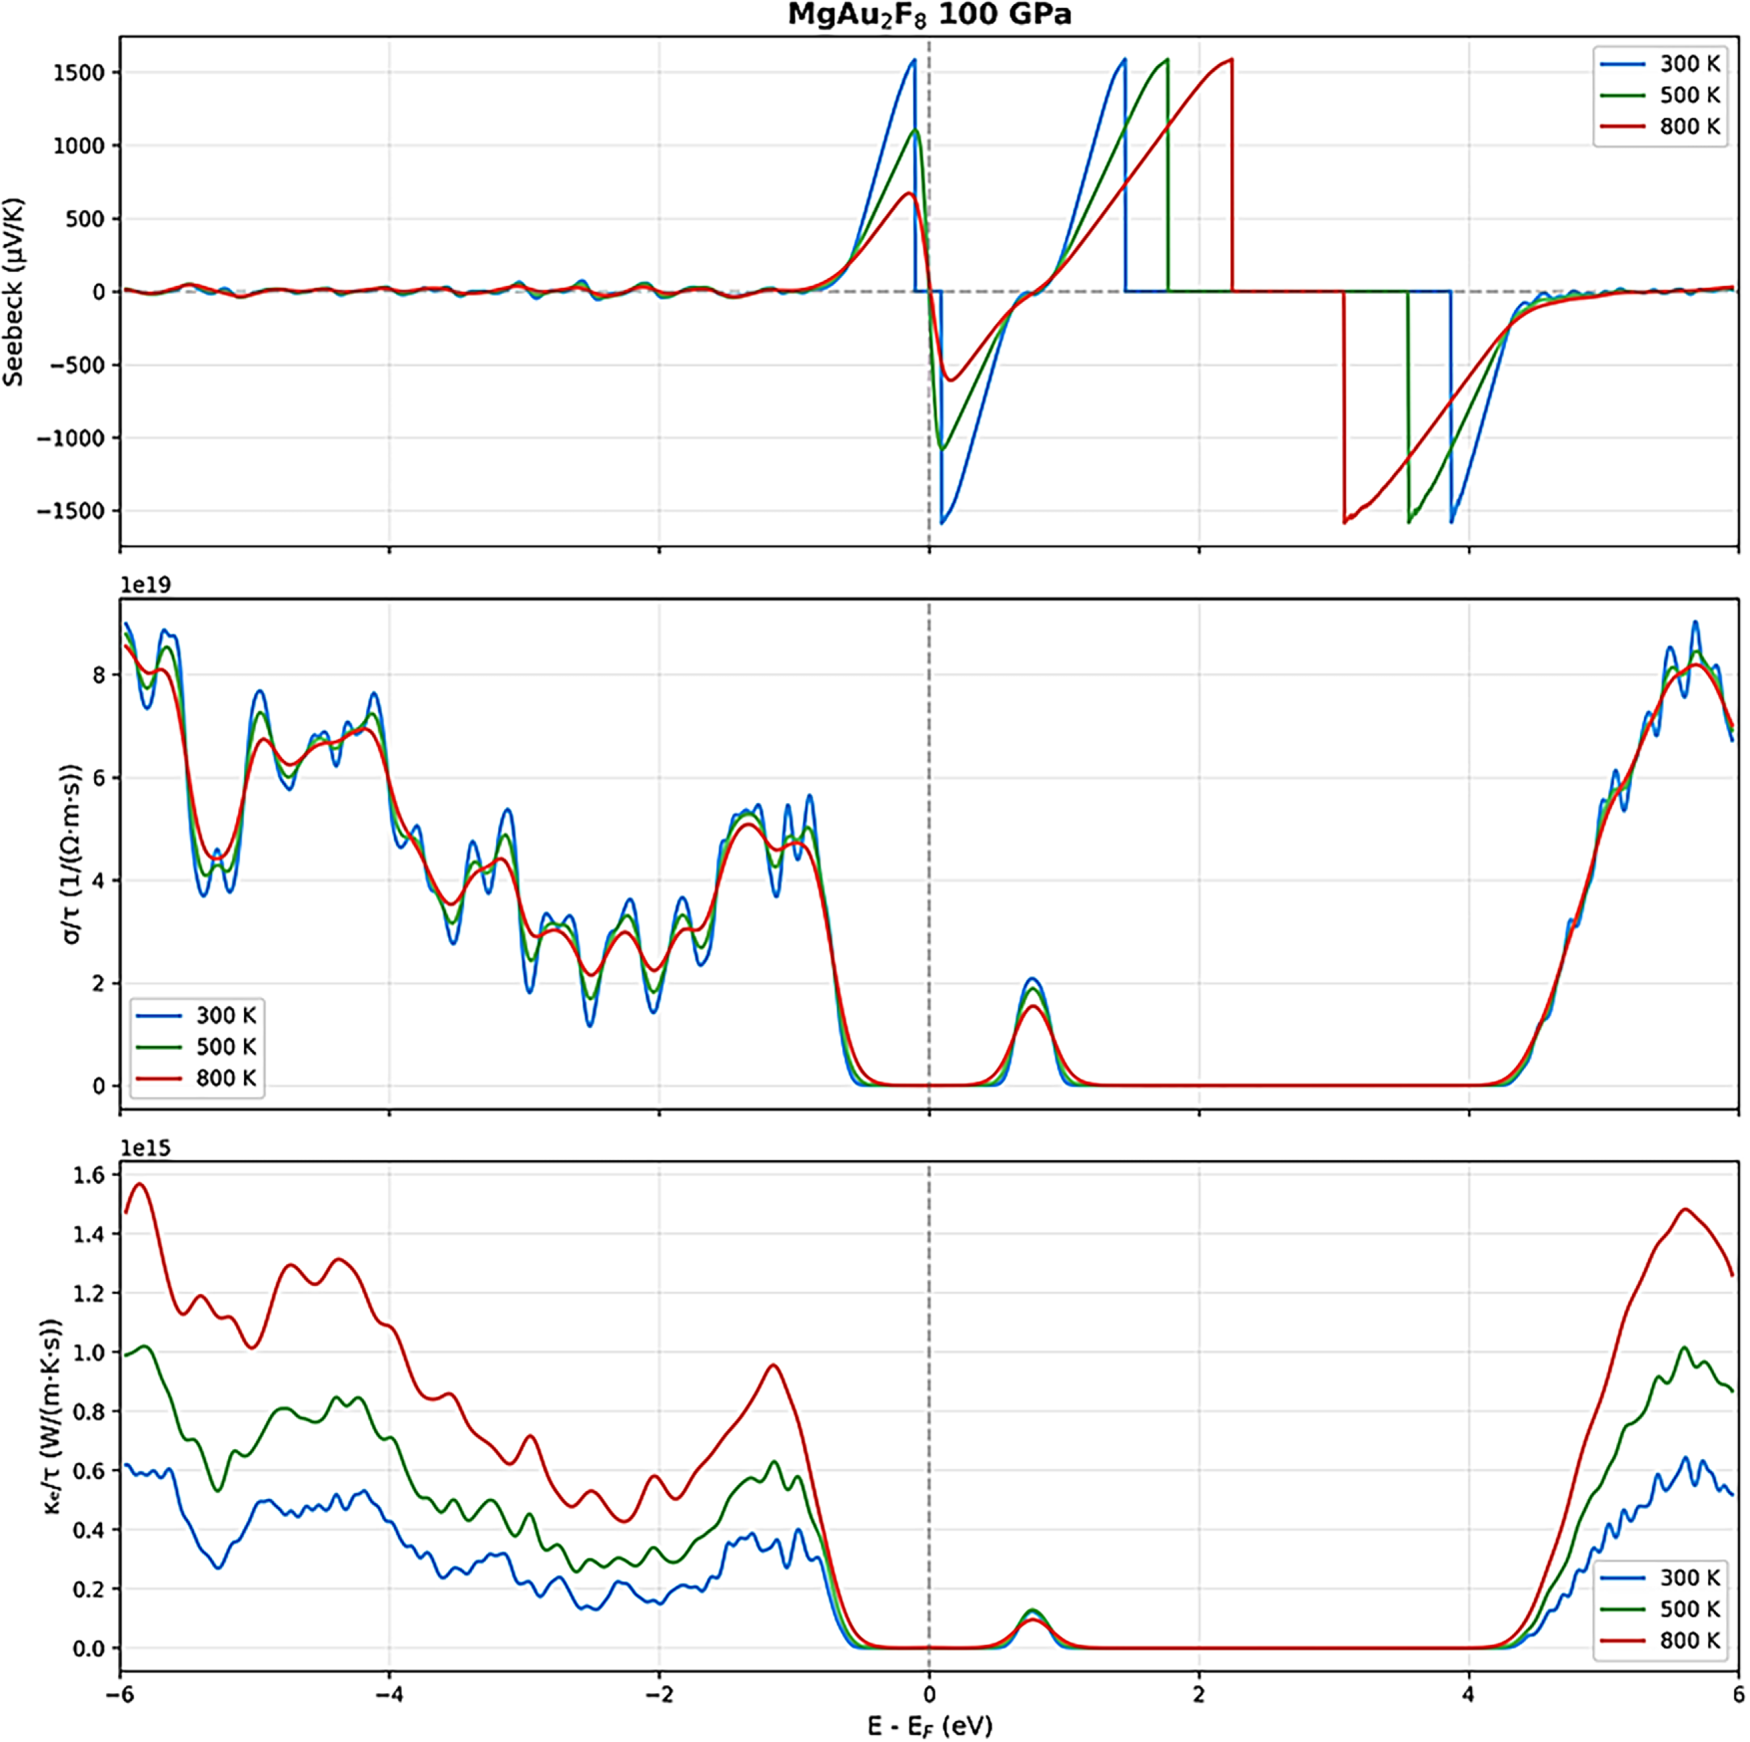
Figure 10: Thermoelectric parameters of MgAu2F8 under 100 GPa for various temperatures.
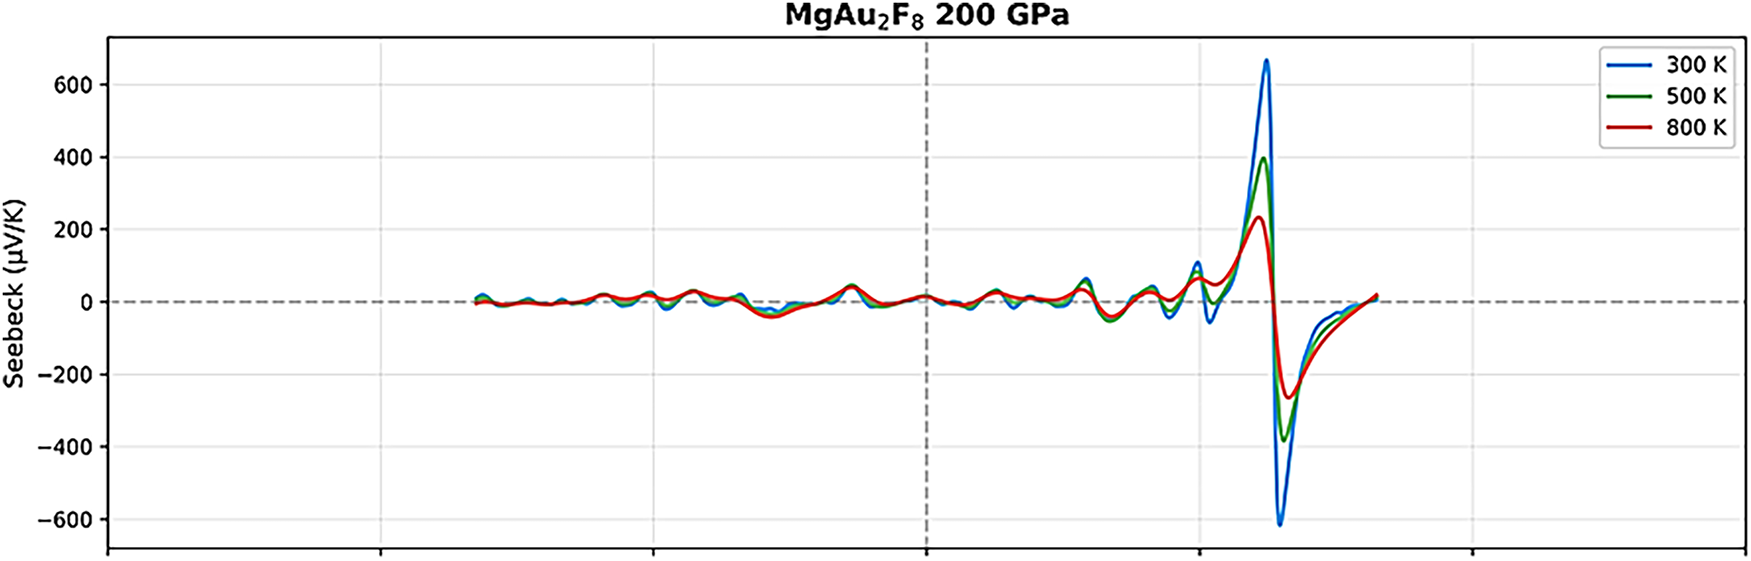
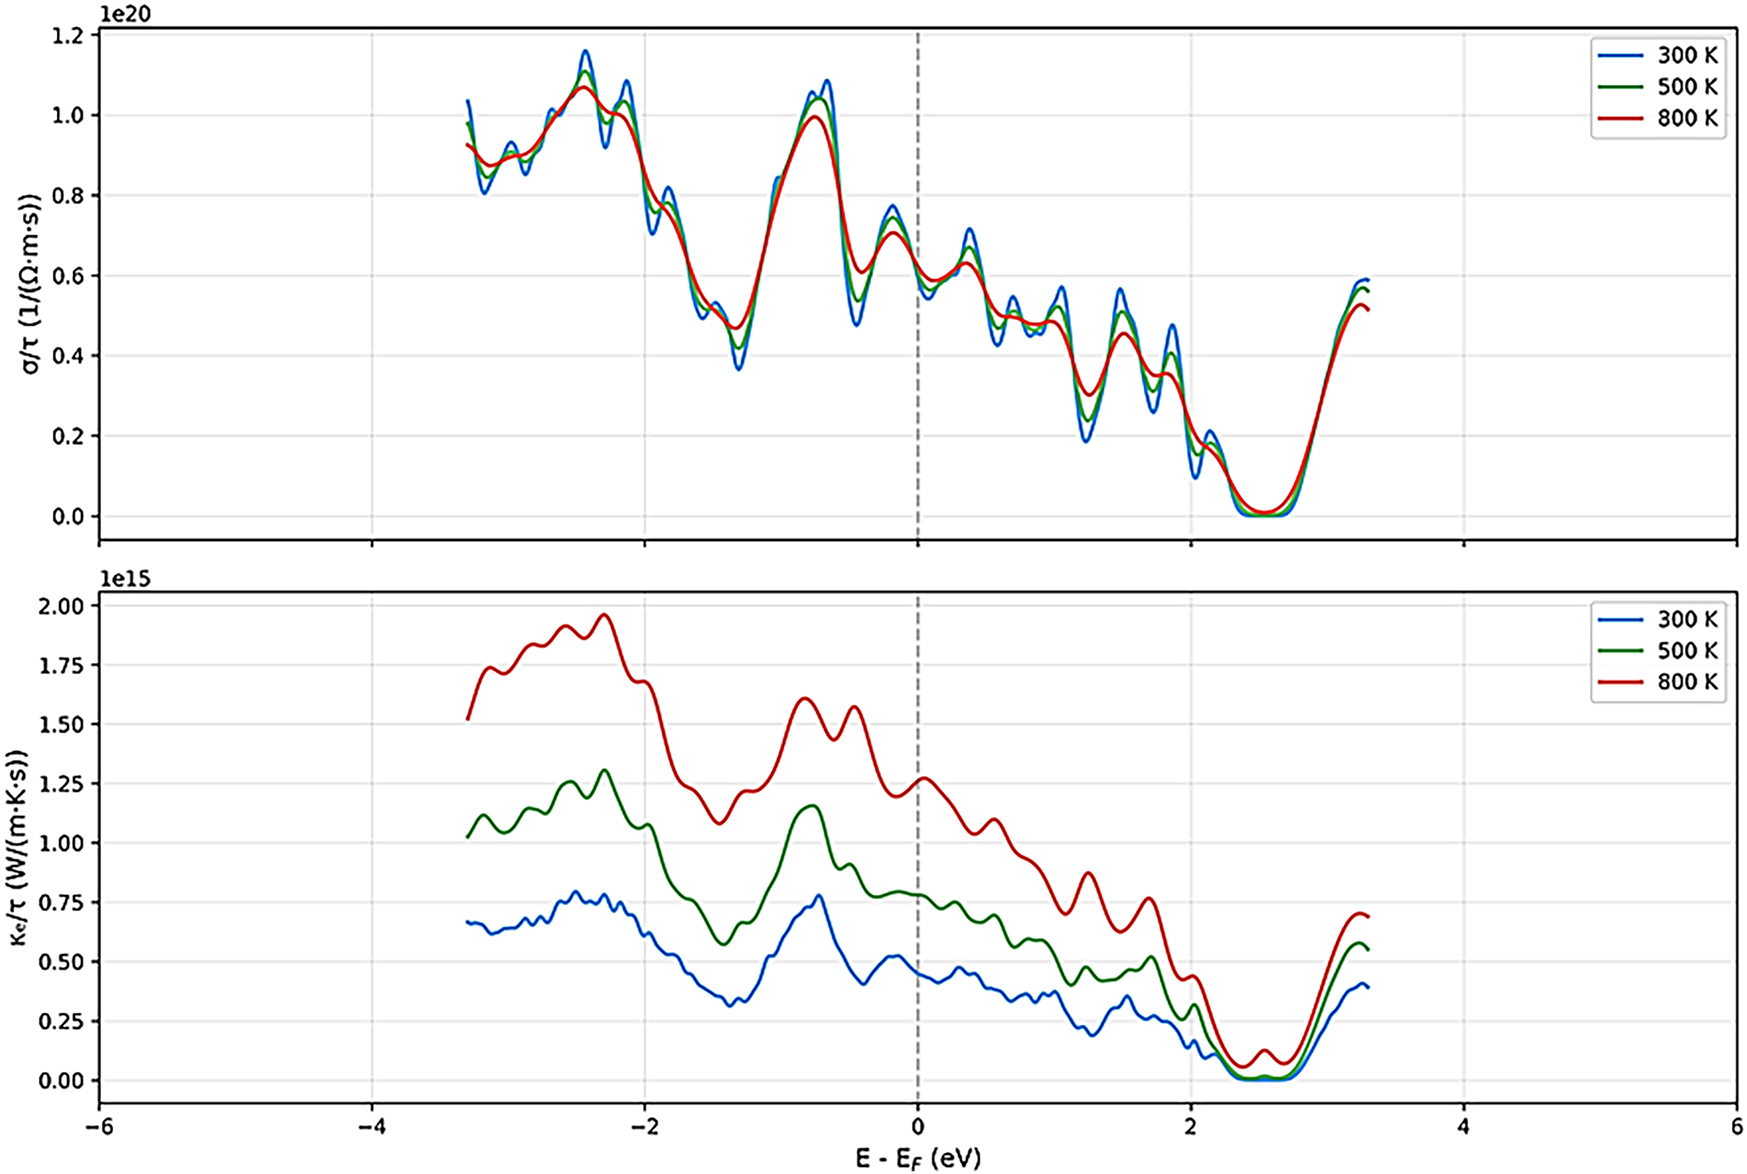
Figure 11: Thermoelectric parameters of MgAu2F8 under 200 GPa with different temperatures.
Upon increasing the pressure to 100 GPa, the thermoelectric response undergoes a remarkable change. The Seebeck coefficient retains its oscillatory nature, but the magnitude of its peaks decreases, and the curves for different temperatures converge more closely, indicating reduced sensitivity to temperature and a shift toward more metallic behavior. The electrical conductivity (σ/τ) increases significantly across the energy range, especially near the Fermi level, and the peaks become broader and more numerous, suggesting enhanced carrier mobility and density [46–50]. The electronic thermal conductivity (κe/τ) also rises substantially, particularly at higher temperatures, reflecting the increased metallicity and the greater contribution of electrons to heat transport. At the highest pressure studied (200 GPa), MgAu2F8 exhibits a distinctly metallic thermoelectric profile [46–50]. The Seebeck coefficient is now much smaller in magnitude (within ±600 μV/K) and far less oscillatory, with all temperature curves nearly overlapping, indicating a diminished thermopower but greater stability and predictability. The electrical conductivity (σ/τ) reaches its highest values, especially near the Fermi level, and shows a nearly monotonic increase with energy, characteristic of a good metal [46–50]. The electronic thermal conductivity (κe/τ) also peaks at this pressure, exhibiting a strong temperature dependence and high values throughout the energy range, which confirms the dominance of electronic heat transport.
Comparatively, these results prove that MgAu2F8 transitions from a high-Seebeck, low-conductivity semiconductor at ambient pressure to a low-Seebeck, high-conductivity metal under extreme compression. The temperature dependence of all properties becomes less pronounced with increasing pressure, and the overall thermoelectric performance shifts from being dominated by potential high thermopower at low pressure to high electrical and thermal conductivities at high pressure. This outcome highlights the tunability of MgAu2F8’s thermoelectric properties under pressure, offering insights into its potential applications. At low pressures, it may be appropriate for thermoelectric devices that require high Seebeck coefficients. In contrast, at high pressures, its metallic nature can be exploited in practical applications that require high electrical and thermal conductivity.
Keeping in mind the practical implications of our findings, several limitations warrant consideration regarding dynamic pressure environments and transformation reversibility. While our DFT calculations predict equilibrium states at each pressure point, the reversibility of the observed pressure-induced transformations requires additional experimental investigations. For practical applications, particularly in pressure sensing devices, we recommend experimental verification using reversible diamond anvil cell studies to assess the cycling stability of the electronic and structural transitions. Additionally, investigating the potential for irreversible structural damage at extreme pressures beyond the studied range would be essential for defining operational limits. These considerations are particularly relevant for applications requiring repeated pressure cycling or operation under rapidly varying pressure conditions, where the interplay between thermodynamic stability and kinetic accessibility of different phases becomes crucial.
In summary, this comprehensive first-principles investigation of the rare MgAu2F8 complex metal fluoride under varying pressures reveals a remarkable spectrum of tunable physical properties, positioning it as an up-and-coming candidate for advanced technological applications. Key findings, applications implications and future research directions of this work can be summarized as in the following:
Key Findings:
• Electronic Transition: MgAu2F8 undergoes a pressure-induced transformation from a wide-bandgap semiconductor at ambient conditions to a metallic state under extreme compression, with systematic band gap narrowing observed throughout the pressure range.
• Optical Response: The material exhibits a dramatic shift from high optical transparency and low reflectivity at ambient pressure to enhanced reflectivity, strong absorption, and pronounced optical anisotropy at elevated pressures, indicating the emergence of free-carrier dynamics.
• Thermoelectric Behavior: Significant pressure-dependent modulation of Seebeck coefficient and thermoelectric performance was observed, with strong thermopower at low pressures transitioning to metallic transport characteristics under compression.
• Mechanical Stability: The compound maintains structural integrity across the studied pressure range while exhibiting systematic changes in elastic and dielectric properties.
• Structure-Property Correlation: The observed transformations are directly linked to increased orbital overlap, bond shortening, and electronic band broadening under compression.
Application Implications:
• Pressure Sensing Devices: The exceptional sensitivity of electronic and optical properties to pressure makes MgAu2F8 a promising candidate for high-precision pressure sensors and shock detectors operating across a wide pressure range.
• Tunable Optoelectronics: The ability to modulate band gap, reflectivity, and absorption through pressure engineering enables applications in switchable optical coatings, smart windows, and adaptive photonic devices.
• Thermoelectric Energy Conversion: The strong thermopower observed at ambient conditions suggests potential for waste heat recovery and solid-state cooling applications, with pressure providing an additional tuning parameter.
• Multifunctional Devices: The coexistence of tunable electronic, optical, and thermoelectric responses within a single material platform opens possibilities for integrated multifunctional device architectures.
Future Research Directions:
• Experimental Validation: Diamond anvil cell experiments combined with in-situ spectroscopic measurements are essential to verify the predicted pressure-induced transitions and confirm the semiconductor-to-metal transformation.
• Chemical Substitution Studies: Systematic investigation of A-site and B-site substitutions (e.g., replacing Mg with Ca or Sr, or Au with other noble metals) could further optimize functional properties and expand the application scope.
• Dynamic Pressure Response: Exploring the material behavior under dynamic and shock compression conditions, including reversibility studies and hysteresis characterization, is crucial for practical device implementation.
• Thin Film Fabrication: Development of synthesis routes for high-quality MgAu2F8 thin films would facilitate integration into optoelectronic and sensing device architectures.
• Temperature-Pressure Phase Diagrams: Comprehensive mapping of the temperature-pressure phase space would provide deeper insights into stability boundaries and potential new phases with distinct functionalities.
Ultimately, MgAu2F8 stands out not only as a model system for fundamental studies of pressure-driven phenomena in complex fluorides but also as a versatile platform for next-generation functional materials, bridging the gap between basic science and practical optoelectronic applications.
Acknowledgement: Not applicable.
Funding Statement: The authors received no specific funding.
Author Contributions: Semih Nart: conceptualization, data analysis. Emre Güler: conceptualization, methodology, data analysis, writing—original draft, supervision, review, editing. Melek Güler: conceptualization, methodology, data analysis, writing—original draft, supervision, review, editing. Gökay Uğur: conceptualization, methodology, data analysis, writing—original draft, supervision, review, editing. All authors reviewed and approved the final version of the manuscript.
Availability of Data and Materials: The data that support the findings of this study are available from the corresponding author, Gökay Uğur, upon reasonable request.
Ethics Approval: Not applicable.
Conflicts of Interest: The authors declare no conflicts of interest.
References
1. Zhang R, Xu Z, Hao Z, Meng Z, Hao X, Tian H. Research advances of metal fluoride for energy conversion and storage. Carbon Energy. 2025;7(1):e630. doi:10.1002/cey2.630. [Google Scholar] [CrossRef]
2. Choi S, Li Y, Kuk Y, Ok KM. (NH4)2Cd2Cl3F3 and (NH4)2Cd2Br3F3: the first fluoride-containing d10 metal mixed halides exhibiting superior ultraviolet nonlinear optical properties. Adv Sci. 2025;12(11):2414503. doi:10.1002/advs.202414503. [Google Scholar] [PubMed] [CrossRef]
3. Li D, Li G, Yu Y, Li C. Construction of acceptor-multi-F state electrolyte to enable unprecedented long-life and high-capacity fluoride-ion batteries. Adv Mater. 2025;37(12):2415106. doi:10.1002/adma.202415106. [Google Scholar] [PubMed] [CrossRef]
4. Wang S, Jia S, Jiang Y, Zhang L, Wang P, Liu Y. Mid-IR fluoride fibers: materials, fabrication, and fiber laser applications. Photonics Insights. 2025;4(3):R07. doi:10.3788/pi.2025.r07. [Google Scholar] [CrossRef]
5. Atosuo E, Mäntymäki M, Ritala M. ALD of metal fluorides-potential applications and current state. Adv Mater Interfaces. 2025;12(4):2400372. doi:10.1002/admi.202400372. [Google Scholar] [CrossRef]
6. Chen B, Wang H, Qiu X, Yin Z, Sun H, Li A. Investigation of sawdust microwave-assisted pyrolysis by machine learning, Part I: optimization insights by large language models. Fuel. 2024;374:132396. doi:10.1016/j.fuel.2024.132396. [Google Scholar] [CrossRef]
7. Wang H, Chen B, Sun H, Zhang Y. Carbon-based molecular properties efficiently predicted by deep learning-based quantum chemical simulation with large language models. Comput Biol Med. 2024;176(8):108531. doi:10.1016/j.compbiomed.2024.108531. [Google Scholar] [PubMed] [CrossRef]
8. Khumaini K, Cho G, Kim HL, Lee WJ. Thermal atomic layer etching mechanism of amorphous aluminum oxide by hydrogen fluoride and trimethylaluminum: first-principles study. Surf Interfaces. 2025;72:107114. doi:10.1016/j.surfin.2025.107114. [Google Scholar] [CrossRef]
9. Mursaleen I, Munir J, Ain Q, Albrahee I, Qaid SMH. Aldwayyan AS The magneto-electronic, mechanical, structural, transport, and optoelectronic attributes of A2FeB′F6 (A = K, Na: B′ = Ag, Au) fluoroperovskites: spin-polarized calculations. J Mater Res. 2025;40(8):1149–63. doi:10.1557/s43578-025-01565-z. [Google Scholar] [CrossRef]
10. Ullah F, Sohail M, Khan R, Ali Khan A, El Jery A, Adrdery M. Studying structural, electronics, elastic and optical characteristics of RbYF3(Y = Nb and Sc) fluoride perovskites computationally for energy generation. Mod Phys Lett B. 2026;40(5):2650005. doi:10.1142/s0217984926500053. [Google Scholar] [CrossRef]
11. Burganova RM, Umar Z, Nedopekin OV, Chepkasov IV, Piyanzina II. Complex investigation of XF3 (X = Gd, Tb, Dy, Ho and Er) fluorides under pressure: an ab-initio perspective. Comput Mater Sci. 2025;246(14):113428. doi:10.1016/j.commatsci.2024.113428. [Google Scholar] [CrossRef]
12. Umar Z, Khyzhun O, Kurboniyon MS, Yamamoto T, Brik MG, Novita M, et al. The effect of hydrostatic pressure on structure, crystal-field strength, and emission properties of neat and Ni2+-activated KMgF3. Adv Theory Simul. 2025;8(2):2400734. doi:10.1002/adts.202400734. [Google Scholar] [CrossRef]
13. Mahalaxmi P, Balakrishnan K, Veerapandy V, Vajeeston N, Vajeeston P. First-principles investigation of pressure-induced structural phase transition and properties of CsPbF3 polymorphs. ACS Omega. 2025;10(9):9793–807. doi:10.1021/acsomega.5c01118. [Google Scholar] [PubMed] [CrossRef]
14. Liu J, Yang J, Wang L, Liu GB, Ong WL, Fan LW. Nanoscale thermal and mechanical responses of lithium fluoride in the solid electrolyte interphase under coupled temperature and pressure conditions. ACS Nano. 2025;19(28):25974–85. doi:10.1021/acsnano.5c06128. [Google Scholar] [PubMed] [CrossRef]
15. Bogdanov EV, Molokeev MS, Gorev MV, Kartashev AV, Pavlovskiy MS, Pogoreltsev EI, et al. Structure, thermal properties and phase transition in RbCdHfF7: experiments and lattice dynamics calculations. Solid State Sci. 2025;168(1):108042. doi:10.1016/j.solidstatesciences.2025.108042. [Google Scholar] [CrossRef]
16. Fan Z, Whittaker ML, Asta M. Efficient machine learning interatomic potentials robust for liquid and multiple solid polymorphs of NaF and KF. Phys Rev Materials. 2025;9(10):103406. doi:10.1103/xbfm-clgd. [Google Scholar] [CrossRef]
17. Kanchana V, Vaitheeswaran G, Rajagopalan M. Pressure induced structural phase transitions and metallization of BaF2. J Alloys Compd. 2003;359(1–2):66–72. doi:10.1016/S0925-8388(03)00212-3. [Google Scholar] [CrossRef]
18. Zhang MG, Chen L, Feng L, Tuo HH, Zhang Y, Wei Q, et al. Pressure-induced phase transition and electronic structure evolution in layered semimetal HfTe2. Chin Phys B. 2023;32(8):086101. doi:10.1088/1674-1056/acd2bf. [Google Scholar] [CrossRef]
19. Zhang X, Li L, Yu Y, Zhang Q, Sun N, Mao Z, et al. High pressure-temperature study of MgF2, CaF2, and BaF2 by raman spectroscopy: phase transitions and vibrational properties of AF2 difluorides. ACS Omega. 2024;9(22):23675–87. doi:10.1021/acsomega.4c01347. [Google Scholar] [PubMed] [CrossRef]
20. Dorfman SM, Jiang F, Mao Z, Kubo A, Meng Y, Prakapenka VB, et al. Phase transitions and equations of state of alkaline earth fluorides CaF2, SrF2, and BaF2 to Mbar pressures. Phys Rev B. 2010;81(17):174121. doi:10.1103/physrevb.81.174121. [Google Scholar] [CrossRef]
21. Stan CV, Dutta R, White CE, Prakapenka V, Duffy TS. High-pressure polymorphism of PbF2 to 75 GPa. Phys Rev B. 2016;94(2):024104. doi:10.1103/physrevb.94.024104. [Google Scholar] [CrossRef]
22. Nelson JR, Needs RJ, Pickard CJ. High-pressure phases of group-II difluorides: polymorphism and superionicity. Phys Rev B. 2017;95(5):054118. doi:10.1103/physrevb.95.054118. [Google Scholar] [CrossRef]
23. Öztürk H, Kürkçü C, Kürkçü C. High-pressure structural phase transitions and intermediate phases of magnesium fluoride. J Alloys Compd. 2014;597:155–60. doi:10.1016/j.jallcom.2014.01.221. [Google Scholar] [CrossRef]
24. Wang J, Yang J, Hu T, Chen X, Lang J, Wu X, et al. Structural phase transition and compressibility of CaF2 nanocrystals under high pressure. Crystals. 2018;8(5):199. doi:10.3390/cryst8050199. [Google Scholar] [CrossRef]
25. Kanchana V, Vaitheeswaran G, Rajagopalan M. Structural phase stability of CaF2 and SrF2 under pressure. Phys B Condens Matter. 2003;328:283–90. doi:10.1016/S0921-4526(02)01851-3. [Google Scholar] [CrossRef]
26. Cappellini G, Bosin A, Serra G, Furthmüller J, Bechstedt F, Botti S. Electronic and optical properties of small metal fluoride clusters. ACS Omega. 2020;5(22):13268–77. doi:10.1021/acsomega.0c01317. [Google Scholar] [PubMed] [CrossRef]
27. Pandey RK, Waters K, Nigam S, He H, Pingale SS, Pandey AC, et al. A theoretical study of structural and electronic properties of alkaline-earth fluoride clusters. Comput Theor Chem. 2014;1043:24–30. doi:10.1016/j.comptc.2014.05.007. [Google Scholar] [CrossRef]
28. Kaawar Z. Theoretical investigations of bulk and surface properties of group II and group XII metal fluorides. Berlin, Germany: Refubium (Universitätsbibliothek der Freien Universität Berlin); 2018 [cited 2026 Jan 1]. Available from: https://refubium.fu-berlin.de/handle/fub188/22172. [Google Scholar]
29. Mattsson S, Paulus B. Density functional theory calculations of structural, electronic, and magnetic properties of the 3d metal trifluorides MF3 (M = Ti-Ni) in the solid state. J Comput Chem. 2019;40(11):1190–7. doi:10.1002/jcc.25777. [Google Scholar] [PubMed] [CrossRef]
30. Bibi N, Li J, Zhuo X, Chai T, Yang S. A computational insight into CuXF3 (X = Ba, K) fluoroperovskites for solar cell and optoelectronic applications. Sol Energy. 2026;303:114144. doi:10.1016/j.solener.2025.114144. [Google Scholar] [CrossRef]
31. Clark SJ, Segall MD, Pickard CJ, Hasnip PJ, Probert MIJ, Refson K, et al. First principles methods using CASTEP. Z Für Kristallogr Cryst Mater. 2005;220(5–6):567–70. doi:10.1524/zkri.220.5.567.65075. [Google Scholar] [CrossRef]
32. Segall MD, Lindan PJD, Probert MJ, Pickard CJ, Hasnip PJ, Clark SJ, et al. First-principles simulation: ideas, illustrations and the CASTEP. J Phys Condens Matter. 2002;14(11):2717. doi:10.1088/0953-8984/14/11/301. [Google Scholar] [CrossRef]
33. Perdew J, Burke K, Ernzerhof M. Generalized gradient approximation made simple. Phys Rev Lett. 1996;77(18):3865–8. doi:10.1103/PhysRevLett.77.3865. [Google Scholar] [PubMed] [CrossRef]
34. Güler E, Güler M. Elastic and mechanical properties of hexagonal diamond under pressure. Appl Phys A. 2015;119(2):721–6. doi:10.1007/s00339-015-9020-8. [Google Scholar] [CrossRef]
35. Monkhorst HJ, Pack JD. Special points for Brillouin-zone integrations. Phys Rev B. 1976;13(12):5188–92. doi:10.1103/physrevb.13.5188. [Google Scholar] [CrossRef]
36. Madsen GKH, Carrete J, Verstraete MJ. BoltzTraP2, a program for interpolating band structures and calculating semi-classical transport coefficients. Comput Phys Commun. 2018;231:140–5. doi:10.1016/j.cpc.2018.05.010. [Google Scholar] [CrossRef]
37. Jain A, Ong SP, Hautier G, Chen W, Richards WD, Dacek S, et al. Commentary: the Materials Project: a materials genome approach to accelerating materials innovation. APL Mater. 2013;1(1):011002. doi:10.1063/1.4812323. [Google Scholar] [CrossRef]
38. Saal JE, Kirklin S, Aykol M, Meredig B, Wolverton C. Materials design and discovery with high-throughput density functional theory: the open quantum materials database (OQMD). JOM. 2013;65(11):1501–9. doi:10.1007/s11837-013-0755-4. [Google Scholar] [CrossRef]
39. Fischer R, Müller BG. Synthese und Struktur von Silber(II)-tetrafluoroaurat(III) Ag[AuF4]2. Z Für Anorg Und Allg Chem. 1997;623(11):1729–33. doi:10.1002/zaac.19976231110. [Google Scholar] [CrossRef]
40. Güler E, Uğur Ş, Güler M, Uğur G. Theoretical predictions for elastic, mechanical, anisotropic, electronic, and optical profiles of wurtzite CdS, CdSe, and CdTe. JOM. 2025;77(5):3472–81. doi:10.1007/s11837-024-06923-6. [Google Scholar] [CrossRef]
41. Uğur Ş, Güler M, Özdemir A, Uğur G, Güler E. Density functional theory analyses for the pressure-dependent electronic, optical, phonon, elastic, mechanical, and anisotropic features of Be2PN3. Phys Status Solidi B. 2026;263(1):e202500319. doi:10.1002/pssb.202500319. [Google Scholar] [CrossRef]
42. Güler E, Uğur Ş, Güler M, Uğur G. DFT insights into the electronic, optical, elastic, mechanical, and anisotropic profiles of 2D Ni2PS2 and Ni2PSe2. J Alloys Compd. 2025;1036:181993. doi:10.1016/j.jallcom.2025.181993. [Google Scholar] [CrossRef]
43. Gou H, Gao F, Zhang J. Structural identification, electronic and optical properties of ZnSnO3: first principle calculations. Comput Mater Sci. 2010;49(3):552–5. doi:10.1016/j.commatsci.2010.05.049. [Google Scholar] [CrossRef]
44. Chen J, Liu T, Cao D, Zhao G. First-principles study of the electronic structures and absorption spectra for the PbMoO4 crystal with lead vacancy. Phys Status Solidi B. 2008;245(6):1152–5. doi:10.1002/pssb.200743403. [Google Scholar] [CrossRef]
45. Tse J, Aziz A, Flitcroft JM, Skelton JM, Gillie LJ, Parker SC, et al. Unraveling the impact of graphene addition to thermoelectric SrTiO3 and La-doped SrTiO3 materials: a density functional theory study. ACS Appl Mater Interfaces. 2021;13(34):41303–14. doi:10.1021/acsami.1c10865. [Google Scholar] [PubMed] [CrossRef]
46. Tab S, Boudali A, Berber M, Driss khodja M, El Hachemi OL, Moujri H. Structural, elastic, electronic, and thermoelectric properties of chalcopyrite B2BiN alloys: a first-principles study. Appl Phys A. 2020;126(7):544. doi:10.1007/s00339-020-03725-w. [Google Scholar] [CrossRef]
47. Güler M, Uğur Ş, Uğur G, Güler E. Revealing the electronic, optical, elastic, mechanical, anisotropic, and thermoelectric responses of Sc2NiZ (Z = Si, Ge, and Sn) Heusler alloys via DFT calculations. Int J Quantum Chem. 2023;123(4):e27033. doi:10.1002/qua.27033. [Google Scholar] [CrossRef]
48. Bouhmaidi S, Marjaoui A, Talbi A, Zanouni M, Nouneh K, Setti L. A DFT study of electronic, optical and thermoelectric properties of Ge-halide perovskites CsGeX3 (X = F, Cl and Br). Comput Condens Matter. 2022;31:e00663. doi:10.1016/j.cocom.2022.e00663. [Google Scholar] [CrossRef]
49. Güler E, Uğur Ş, Güler M, Özdemir A, Uğur G. Revealing the electronic, optical, phonon and thermoelectrical characteristics of bulk and monolayered RbLiS and RbLiSe compounds by DFT. J Phys Chem Solids. 2022;170:110972. doi:10.1016/j.jpcs.2022.110972. [Google Scholar] [CrossRef]
50. Jayaraman A, Bhat Kademane A, Molli M. DFT study on the carrier concentration and temperature-dependent thermoelectric properties of antimony selenide. Indian J Mater Sci. 2016;2016(1):7296847. doi:10.1155/2016/7296847. [Google Scholar] [CrossRef]
Cite This Article
 Copyright © 2026 The Author(s). Published by Tech Science Press.
This work is licensed under a Creative Commons Attribution 4.0 International License , which permits unrestricted use, distribution, and reproduction in any medium, provided the original work is properly cited.
 Downloads
 Citation Tools