
 Submit a Paper
 Propose a Special lssue
 Open Access
ARTICLE

Exploring Sustainable Smart Long-Term Care Systems Using Fuzzy Trade-Off-Aware Scoring with Conflicts Framework
1 Department of Industrial Engineering and Management, National Chin-Yi University of Technology, Taichung, Taiwan
2 Department of Business Administration, Chaoyang University of Technology, Taichung, Taiwan
3 Department of Business Administration, Asia University, Taichung, Taiwan
4 Department of Management Sciences, Tamkang University, New Taipei City, Taiwan
5 Faculty of Business Administration, Vietnam National University HCM, University of Economics and Law, Ho Chi Minh City, Vietnam
* Corresponding Author: Ruey-Chyn Tsaur. Email:
Computers, Materials & Continua 2026, 87(3), 87 https://doi.org/10.32604/cmc.2026.079476
Received 22 January 2026; Accepted 28 February 2026; Issue published 09 April 2026
 View Full Text
 Download PDF
Abstract
As artificial intelligence, the Internet of Things, edge computing, and blockchain are increasingly integrated into long-term care (LTC) services, policymakers face complex and often non-compensatory trade-offs among affordability, workforce sustainability, service reliability, and data governance. Conventional compensatory evaluation models tend to mask critical structural weaknesses and limiting their usefulness for Smart LTC policy assessment. This study proposes and applies a Fuzzy Trade-Off-Aware Scoring with Conflicts (Fuzzy TASC) framework to evaluate Smart LTC system performance. Four digital-integration configurations—conventional cloud-based LTC, AI+IoT, AI+Edge, and AI+Blockchain—were compared across 12 OECD countries. A Monte Carlo perturbation procedure was incorporated to assess the robustness and stability of country rankings under data uncertainty. The results indicate that smart technologies generally enhance LTC performance, particularly in terms of service coverage and operational efficiency. Nevertheless, these gains are unevenly distributed and accompanied by a pronounced intensification of cost–workforce trade-offs as digital complexity increases. Germany and Japan exhibit higher adaptive resilience, maintaining strong overall performance across configurations, while Estonia, Ireland, and Portugal display structural vulnerabilities that become more evident under advanced digital integration. Monte Carlo simulations confirm that these patterns are stable across a wide range of uncertainty scenarios. The findings demonstrate that the sustainability of Smart LTC systems depends not only on technological advancement but also on the capacity to manage structural trade-offs that cannot be compensated by performance gains elsewhere. The proposed Fuzzy TASC framework offers policymakers a robust, transparent tool for evaluating Smart LTC strategies, enabling more informed decisions that balance innovation, equity, and long-term system resilience.Keywords
Population aging represents one of the most profound demographic transformations of the twenty-first century. United Nations projections indicating that the global population aged 65 and above will exceed 1.6 billion by 2050, accounting for more than 16% of the world’s population [1]. This demographic shift has intensified the so-called “care gap,” defined as the growing mismatch between LTC demand and constrained resources, including a declining number of formal-care workers per 100 older adults [2]. Consequently, policymakers face a persistent threefold challenge: ensuring affordability, accessibility, and quality of care within limited fiscal space.
In response, digital transformation has emerged as a strategic pathway for modernizing LTC delivery. Smart Long-Term Care (Smart LTC), which integrates artificial intelligence (AI), the Internet of Things (IoT), edge computing, and blockchain, enables real-time monitoring, predictive analytics, and personalized care [3–5]. IoT sensors facilitate early detection of health risks such as falls [6,7], AI models analyze behavioral and physiological data to anticipate cognitive decline and chronic diseases [8–10], edge computing reduces latency [11], and blockchain enhances data security and interoperability [12,13]. However, these technologies also introduce new tensions, including rising costs, cybersecurity risks, regulatory complexity, unequal digital literacy, and concerns about ethical inclusivity and empathy erosion [14–16]. Empirical evidence from Taiwan’s Smart LTC initiatives suggests that while technological integration improves monitoring efficiency, it does not necessarily lead to higher satisfaction or trust [17]. These complexities motivate the need for robust, transparent, and policy-relevant evaluation frameworks.
To support decision-making under such complexity, recent studies increasingly adopt data-driven and multi-criteria decision-making (MCDM) approaches that integrate quantitative indicators with qualitative policy judgment [18,19]. Classical MCDM methods such as AHP, TOPSIS, and VIKOR have been widely applied in healthcare and public-sector contexts [20–23]. However, these approaches rely heavily on deterministic assumptions and full compensability among criteria—assumptions that are often incompatible with the interdependent and value-laden nature of LTC systems [19,24]. In practice, improvements in cost efficiency may compromise workforce sustainability, care empathy, or ethical standards, making linear trade-offs analytically insufficient and normatively questionable [17].
The limitations of deterministic and compensatory MCDM models have become particularly evident under conditions of uncertainty and systemic volatility. Although fuzzy logic and probabilistic extensions have been introduced to address uncertainty, most fuzzy MCDM models retain compensatory logic, allowing strengths in some criteria to offset weaknesses in others [24]. Such structures remain misaligned with LTC systems, where financial feasibility, ethical integrity, workforce capacity, and service quality cannot be traded off linearly. Moreover, while hybrid and simulation-based approaches improve robustness increasing mathematical complexity often reduces policy interpretability. As a result, there is a clear gap in the literature for conflict-sensitive, trade-off-aware evaluation frameworks that explicitly capture inter-criterion tensions while remaining transparent and interpretable for policymakers [18].
To address these gaps, this study aims to develop and apply a Fuzzy Trade-Off-Aware Scoring (Fuzzy TASC) framework for evaluating Smart LTC systems. Building on the original TASC model, the proposed framework integrates fuzzy membership functions to capture linguistic uncertainty, Monte Carlo simulation to assess robustness under stochastic perturbations, and scenario analysis to examine system performance under different policy priorities, such as cost sensitivity and data privacy [5]. By embedding these components within a penalty-based, non-compensatory structure, the framework seeks to quantify trade-offs explicitly rather than obscure them through averaging.
This study is guided by the following research questions:
(1) How can Smart LTC systems be systematically evaluated under uncertainty while accounting for conflicting economic, ethical, technological, and workforce criteria?
(2) To what extent does a fuzzy, trade-off-aware, non-compensatory framework improve the robustness and interpretability of Smart LTC evaluations compared to traditional MCDM approaches?
(3) How do different policy scenarios (e.g., cost-oriented vs. privacy-oriented priorities) affect the overall performance and sustainability assessment of Smart LTC systems?
(4) What insights can the proposed Fuzzy TASC framework provide to policymakers seeking to balance technological efficiency with human-centered values in long-term care?
2 Related Work and Literature Review
2.1 Digital Transformation in Long-Term Care
The integration of digital technologies, including Artificial Intelligence (AI), Internet of Things (IoT), and Blockchain, has become a cornerstone of modernizing long-term care systems. Recent studies emphasize that while digital transformation enhances monitoring efficiency and coverage, it introduces complex resource allocation challenges [25,26]. Nevertheless, many existing evaluation frameworks remain focused on isolated technical metrics, often overlooking the systemic trade-offs between fiscal costs and workforce capacity that are critical for sustainable policy implementation.
2.2 Evolution of Objective Weighting Methods
The determination of criteria weights is fundamental to ensuring the objectivity of MCDM models. Recently, emerging methods such as Logarithmic Percentage Change-driven Objective Weighting (LOPCOW) have been introduced to maximize informational contrast, with applications ranging from sustainability assessments in the banking sector to innovation performance analysis across G20 countries. Additionally, the Weighted Entropy-based Non-linear Softness Optimization (WENSLO) method has been proposed to enhance decision-making through entropy-based mechanisms. While these methods excel in identifying contrast intensity, they primarily focus on the distribution of data within individual criteria. In comparison, the criteria importance through intercriteria correlation (CRITIC) method [27] offers a distinct advantage for LTC policy evaluation. Unlike LOPCOW or WENSLO, which may neglect the interdependence between variables, CRITIC accounts for both contrast intensity (via standard deviation) and conflicting relationships (via the correlation matrix) between indicators. Despite its strengths, the CRITIC method possesses certain limitations, such as sensitivity to outliers and a lack of subjective stakeholder input. Nevertheless, its ability to capture inter-criteria conflicts makes it the most robust choice for analyzing the systemic trade-offs within the 11-year dataset of this study.
2.3 Benchmarking Evaluation Frameworks
To further validate the robustness of the CRITIC method, recent studies have integrated it with various ranking algorithms to solve complex evaluation problems. For instance, Yalçın et al. demonstrated the efficacy of a combined CRITIC-MABAC framework in evaluating the financial performance of sustainability-indexed companies. Their study highlights how objective weights derived from CRITIC can enhance the precision of distance-based ranking models. By adopting a similar objective weighting logic but integrating it with a non-compensatory Fuzzy TASC architecture, our research extends these methodological advancements to the domain of longitudinal LTC policy assessment.
The methodological framework of this study, as illustrated in Fig. 1, follows a structured multi-stage process. Initially, five key indicators (Cost, Workforce, ICT, Coverage, and LDR) are integrated as the foundation of the evaluation system. The MCDM module then executes CRITIC weighting to derive objective weights, which are subsequently processed through the three-layer TASC architecture (Geometric, Threshold, and Trade-Off layers). Finally, the framework incorporates robustness extensions, including Fuzzy Configuration Testing and Monte Carlo Simulations, to ensure the stability of the long-term care sustainability rankings across various digital integration scenarios (S1–S4).
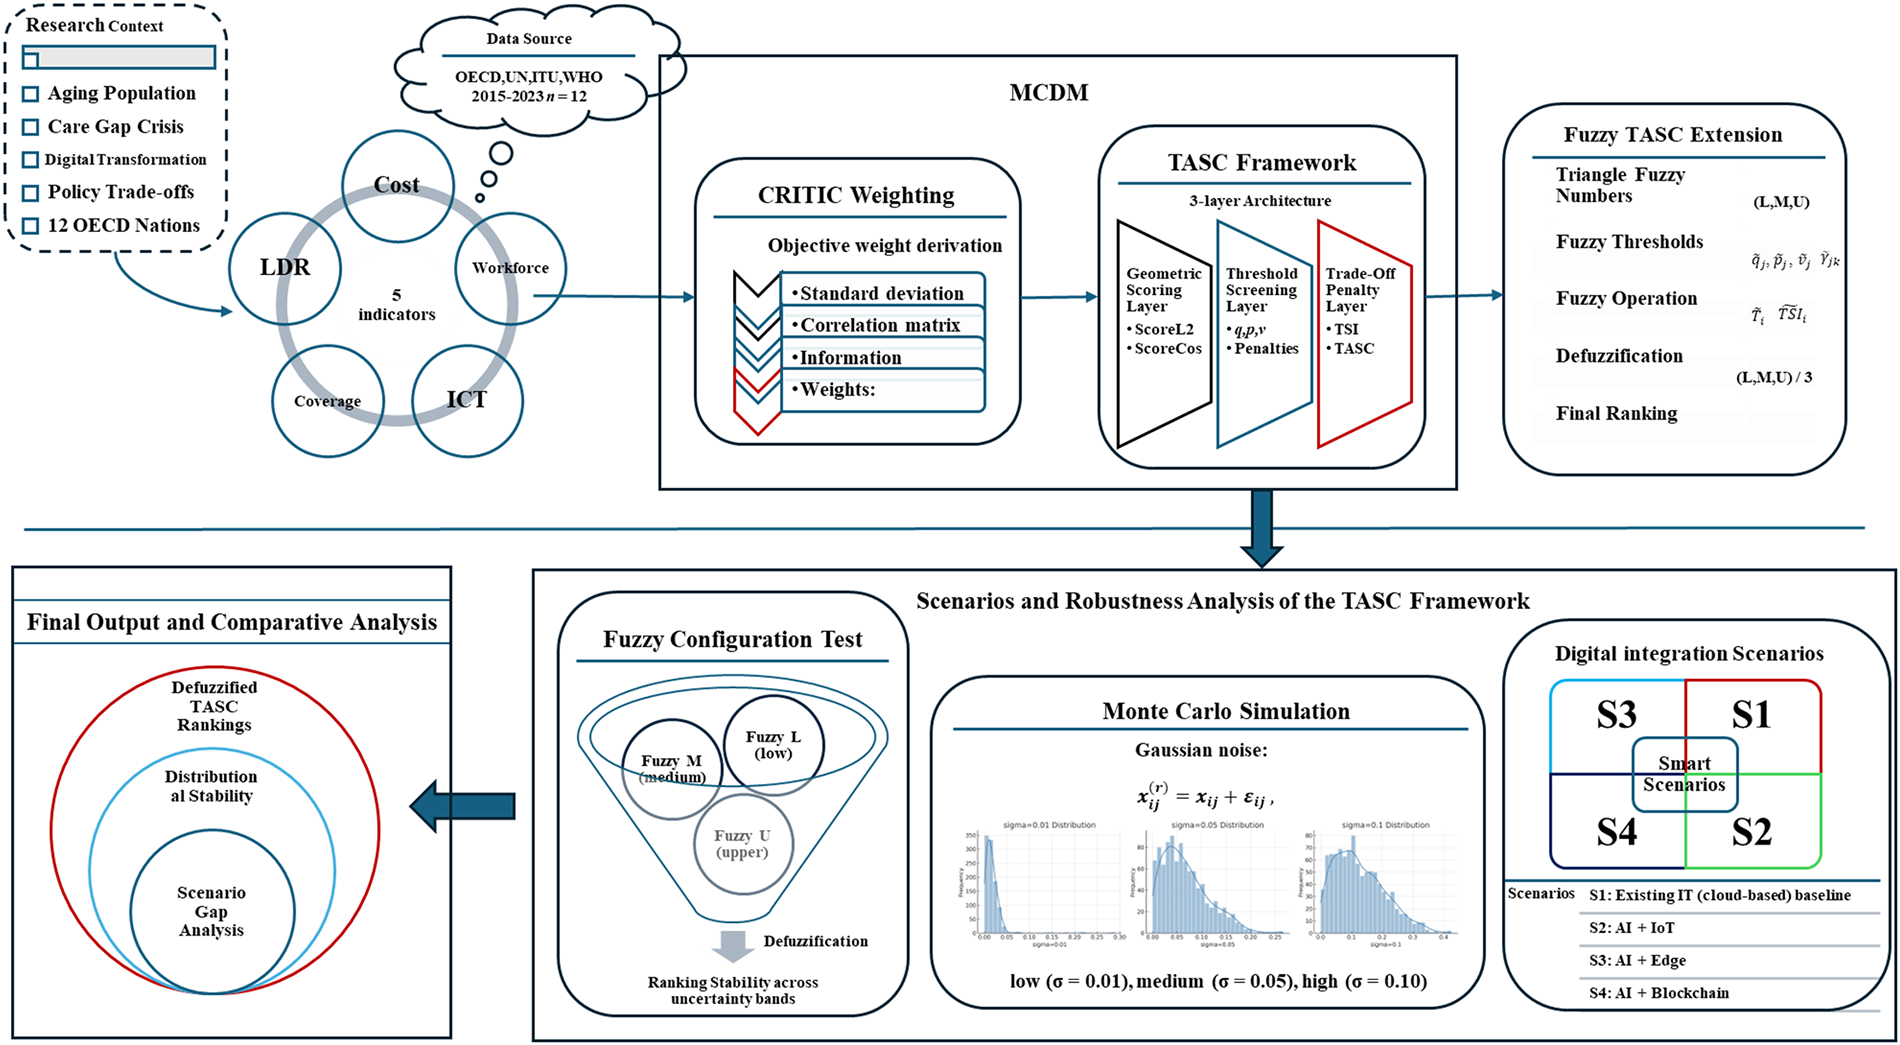
Figure 1: Overall methodological framework of the extended TASC model.
3.1 Indicator Framework and Literature-Based Calibration
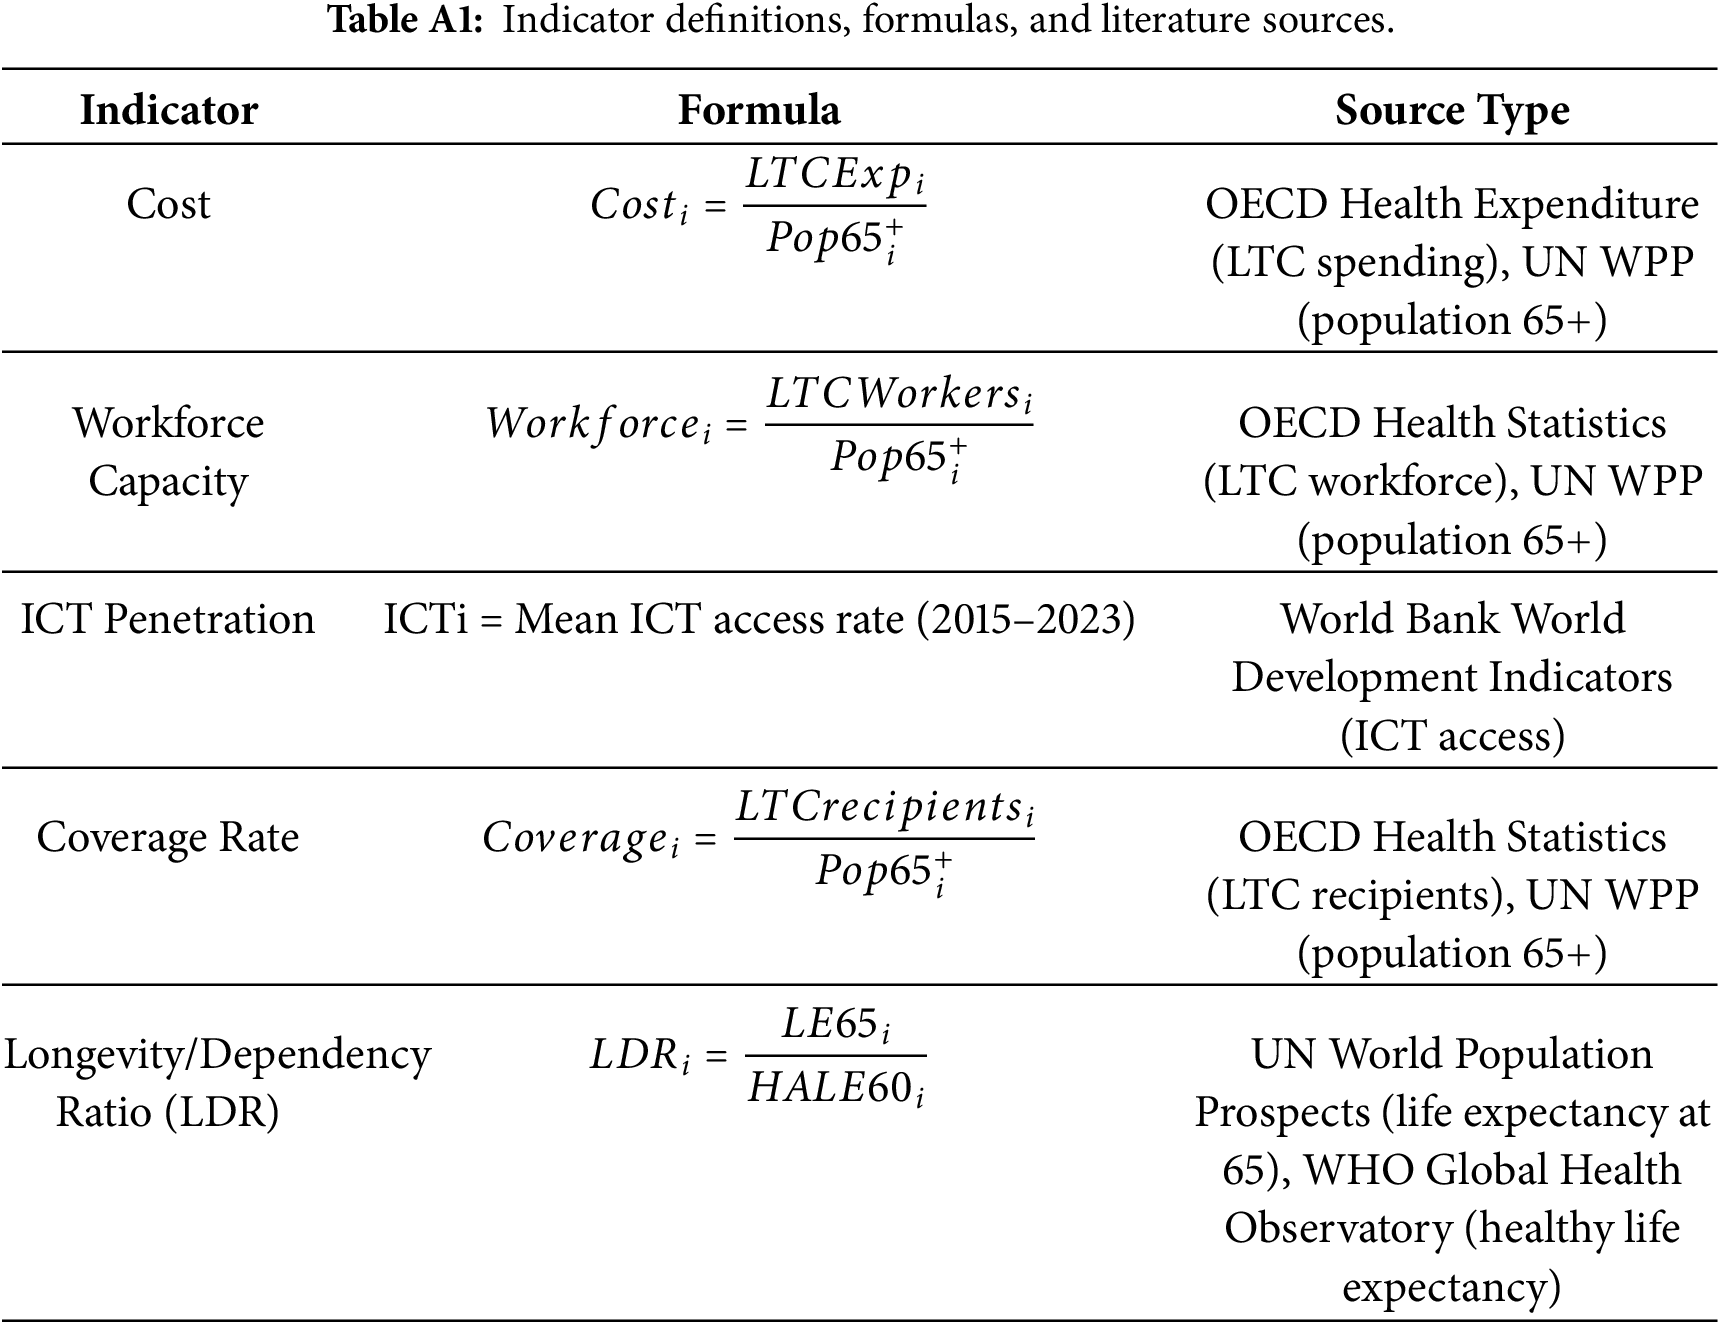
The framework begins with the construction of five indicators that collectively capture the economic, technical, behavioral, and regulatory dimensions of Smart Long-Term Care (Smart LTC) systems: cost, workforce, ICT infrastructure, coverage, and the longevity–dependency ratio (LDR). Together, these dimensions reflect both operational and structural determinants of system performance, encompassing efficiency, accessibility, technological readiness, and demographic balance. Each indicator was operationalized using established statistical and clinical formulations, as detailed in Appendix A Table A1. Data were drawn exclusively from publicly accessible international databases to ensure transparency and reproducibility. Long-term care expenditure (Cost) and workforce density (Workforce) were obtained from the OECD Health Statistics database (2015–2023) and standardized per population aged 65 and above. ICT infrastructure was measured using fixed broadband subscriptions per 100 inhabitants from the ITU Digital Development Database, while coverage was calculated as the ratio of long-term care beneficiaries to the population aged 65 and over, based on OECD Health Accounts. The LDR was constructed as the ratio of life expectancy at age 65 (LE65) to healthy life expectancy at age 60 (HALE60), following the Sullivan-based framework proposed by. In this framework, LDR functions as a macro-level outcome proxy that reflects the system’s efficacy in balancing extended longevity with the maintenance of functional health. The substitution of HALE60 for HALE65 reflects data availability constraints within the WHO Global Health Observatory, while preserving conceptual consistency. This ratio-based indicator naturally extends to national aggregates and captures cross-country variation in the balance between longevity and dependency.
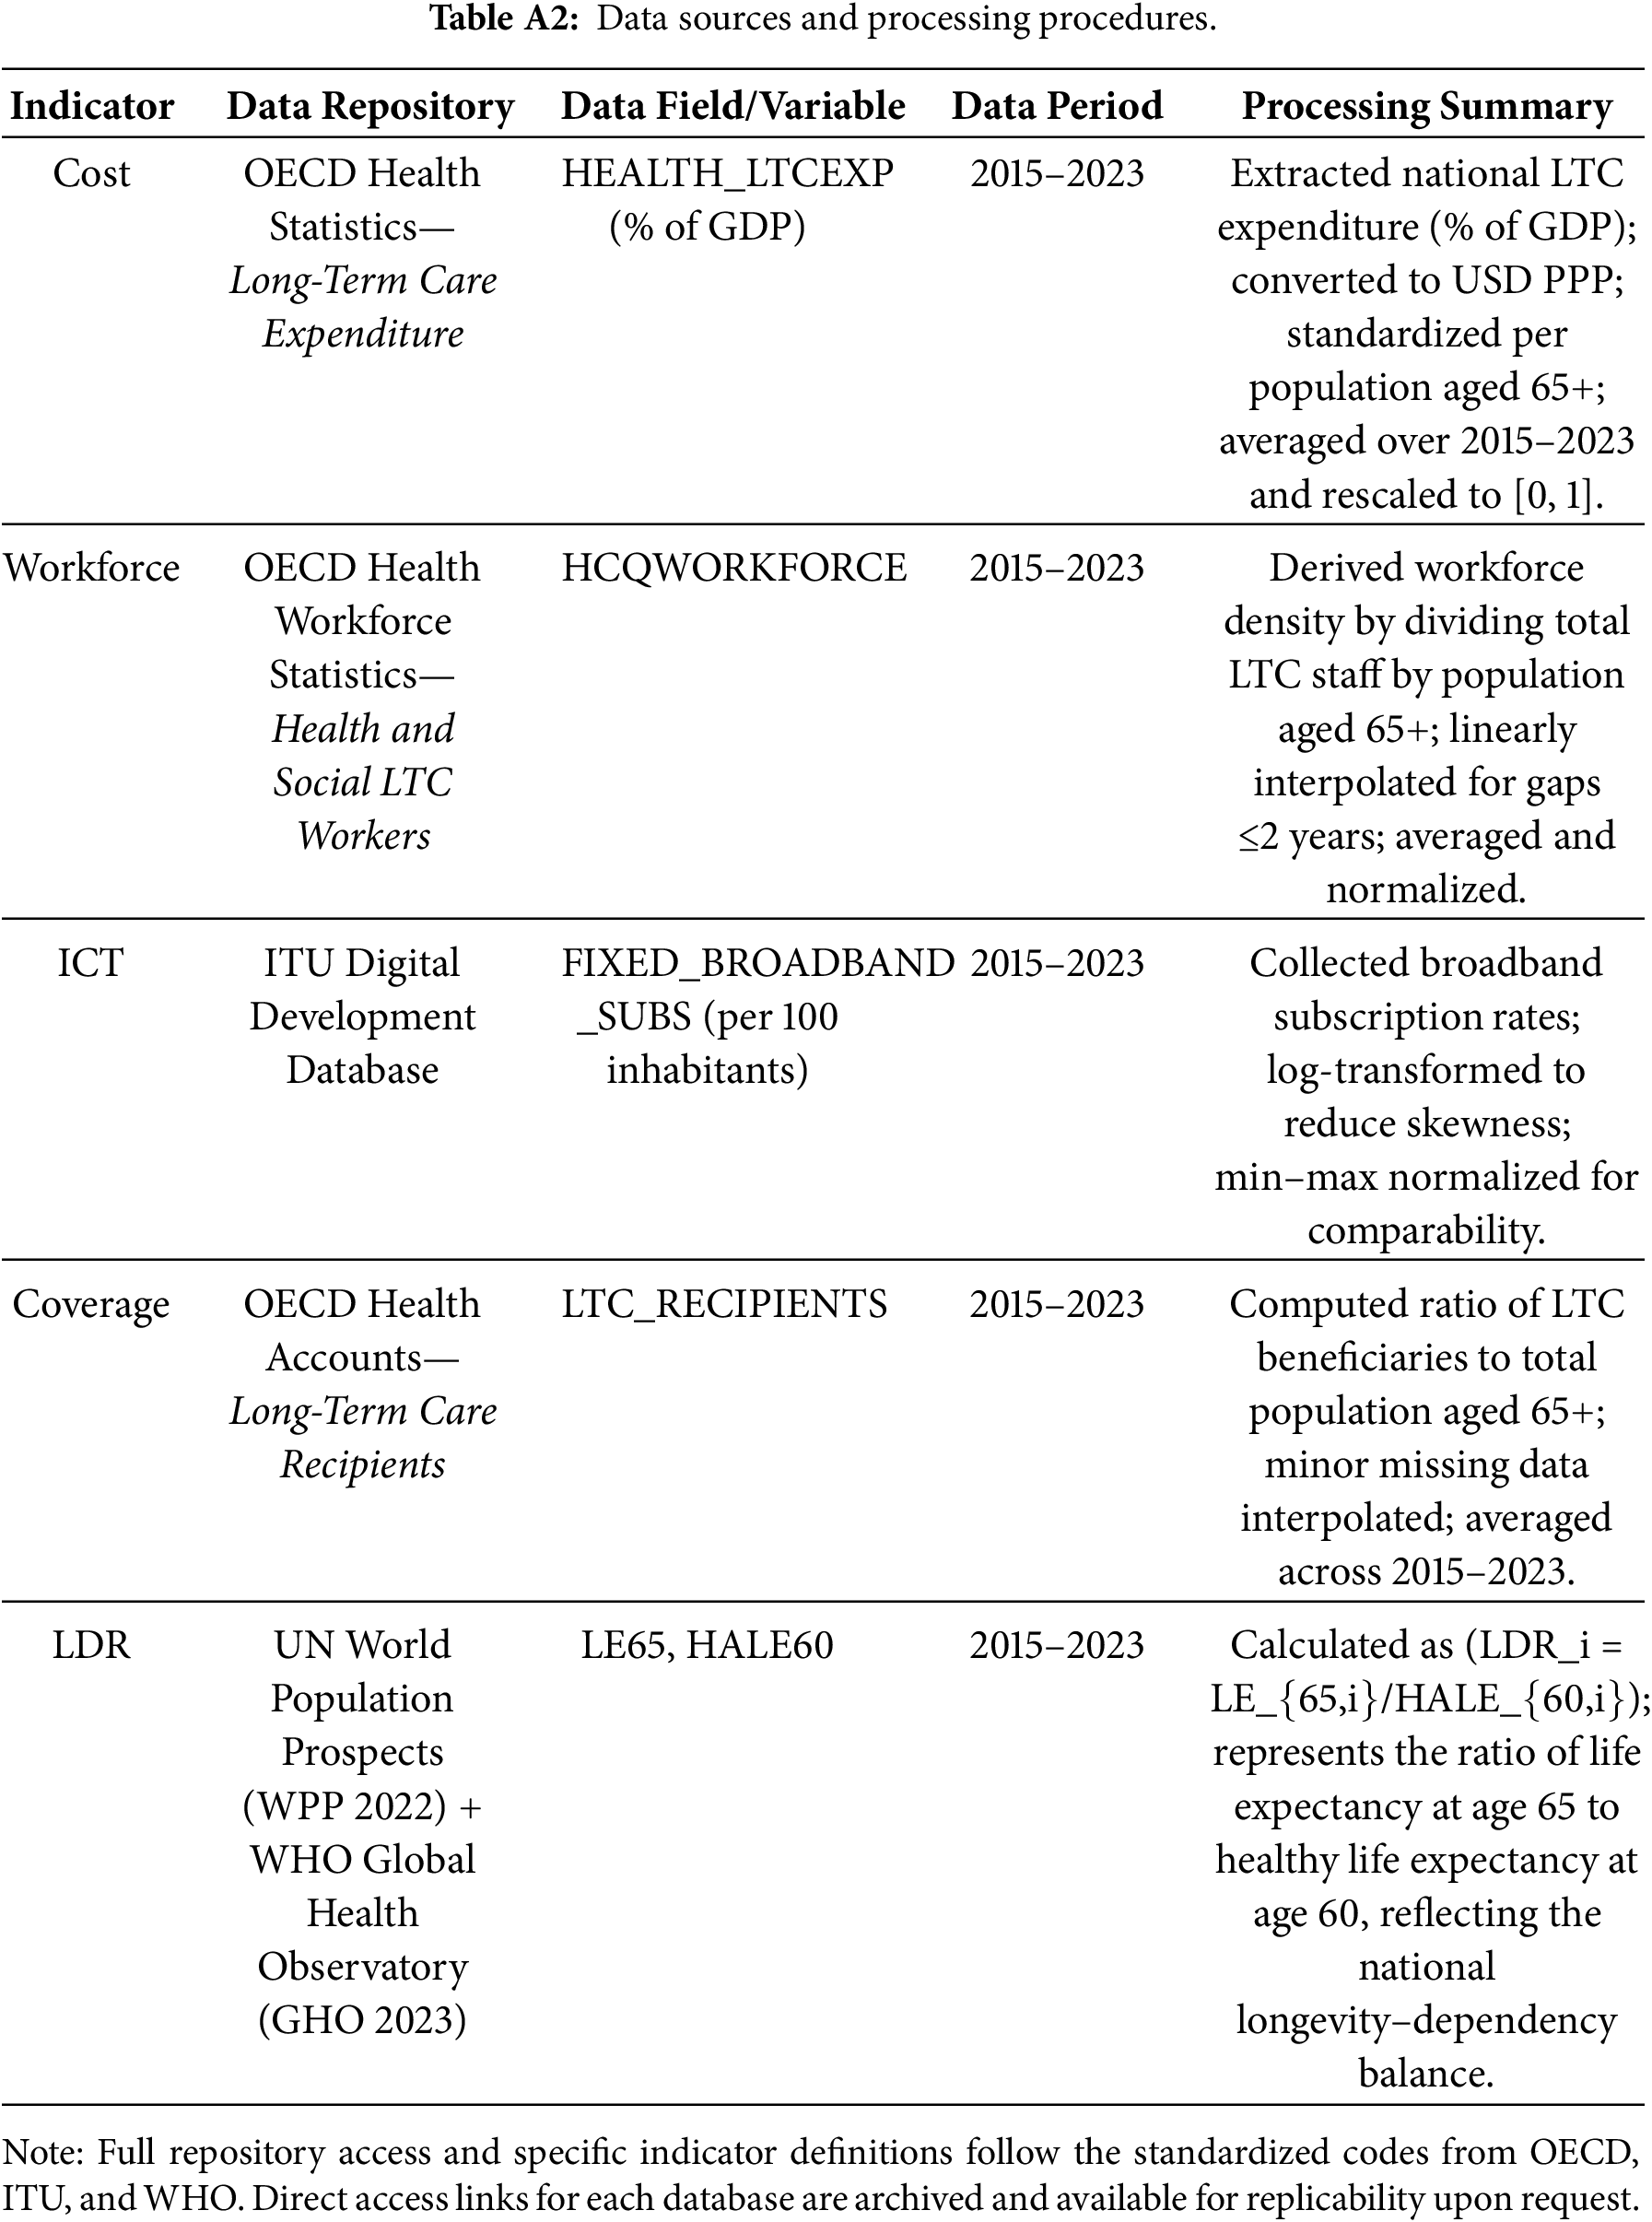
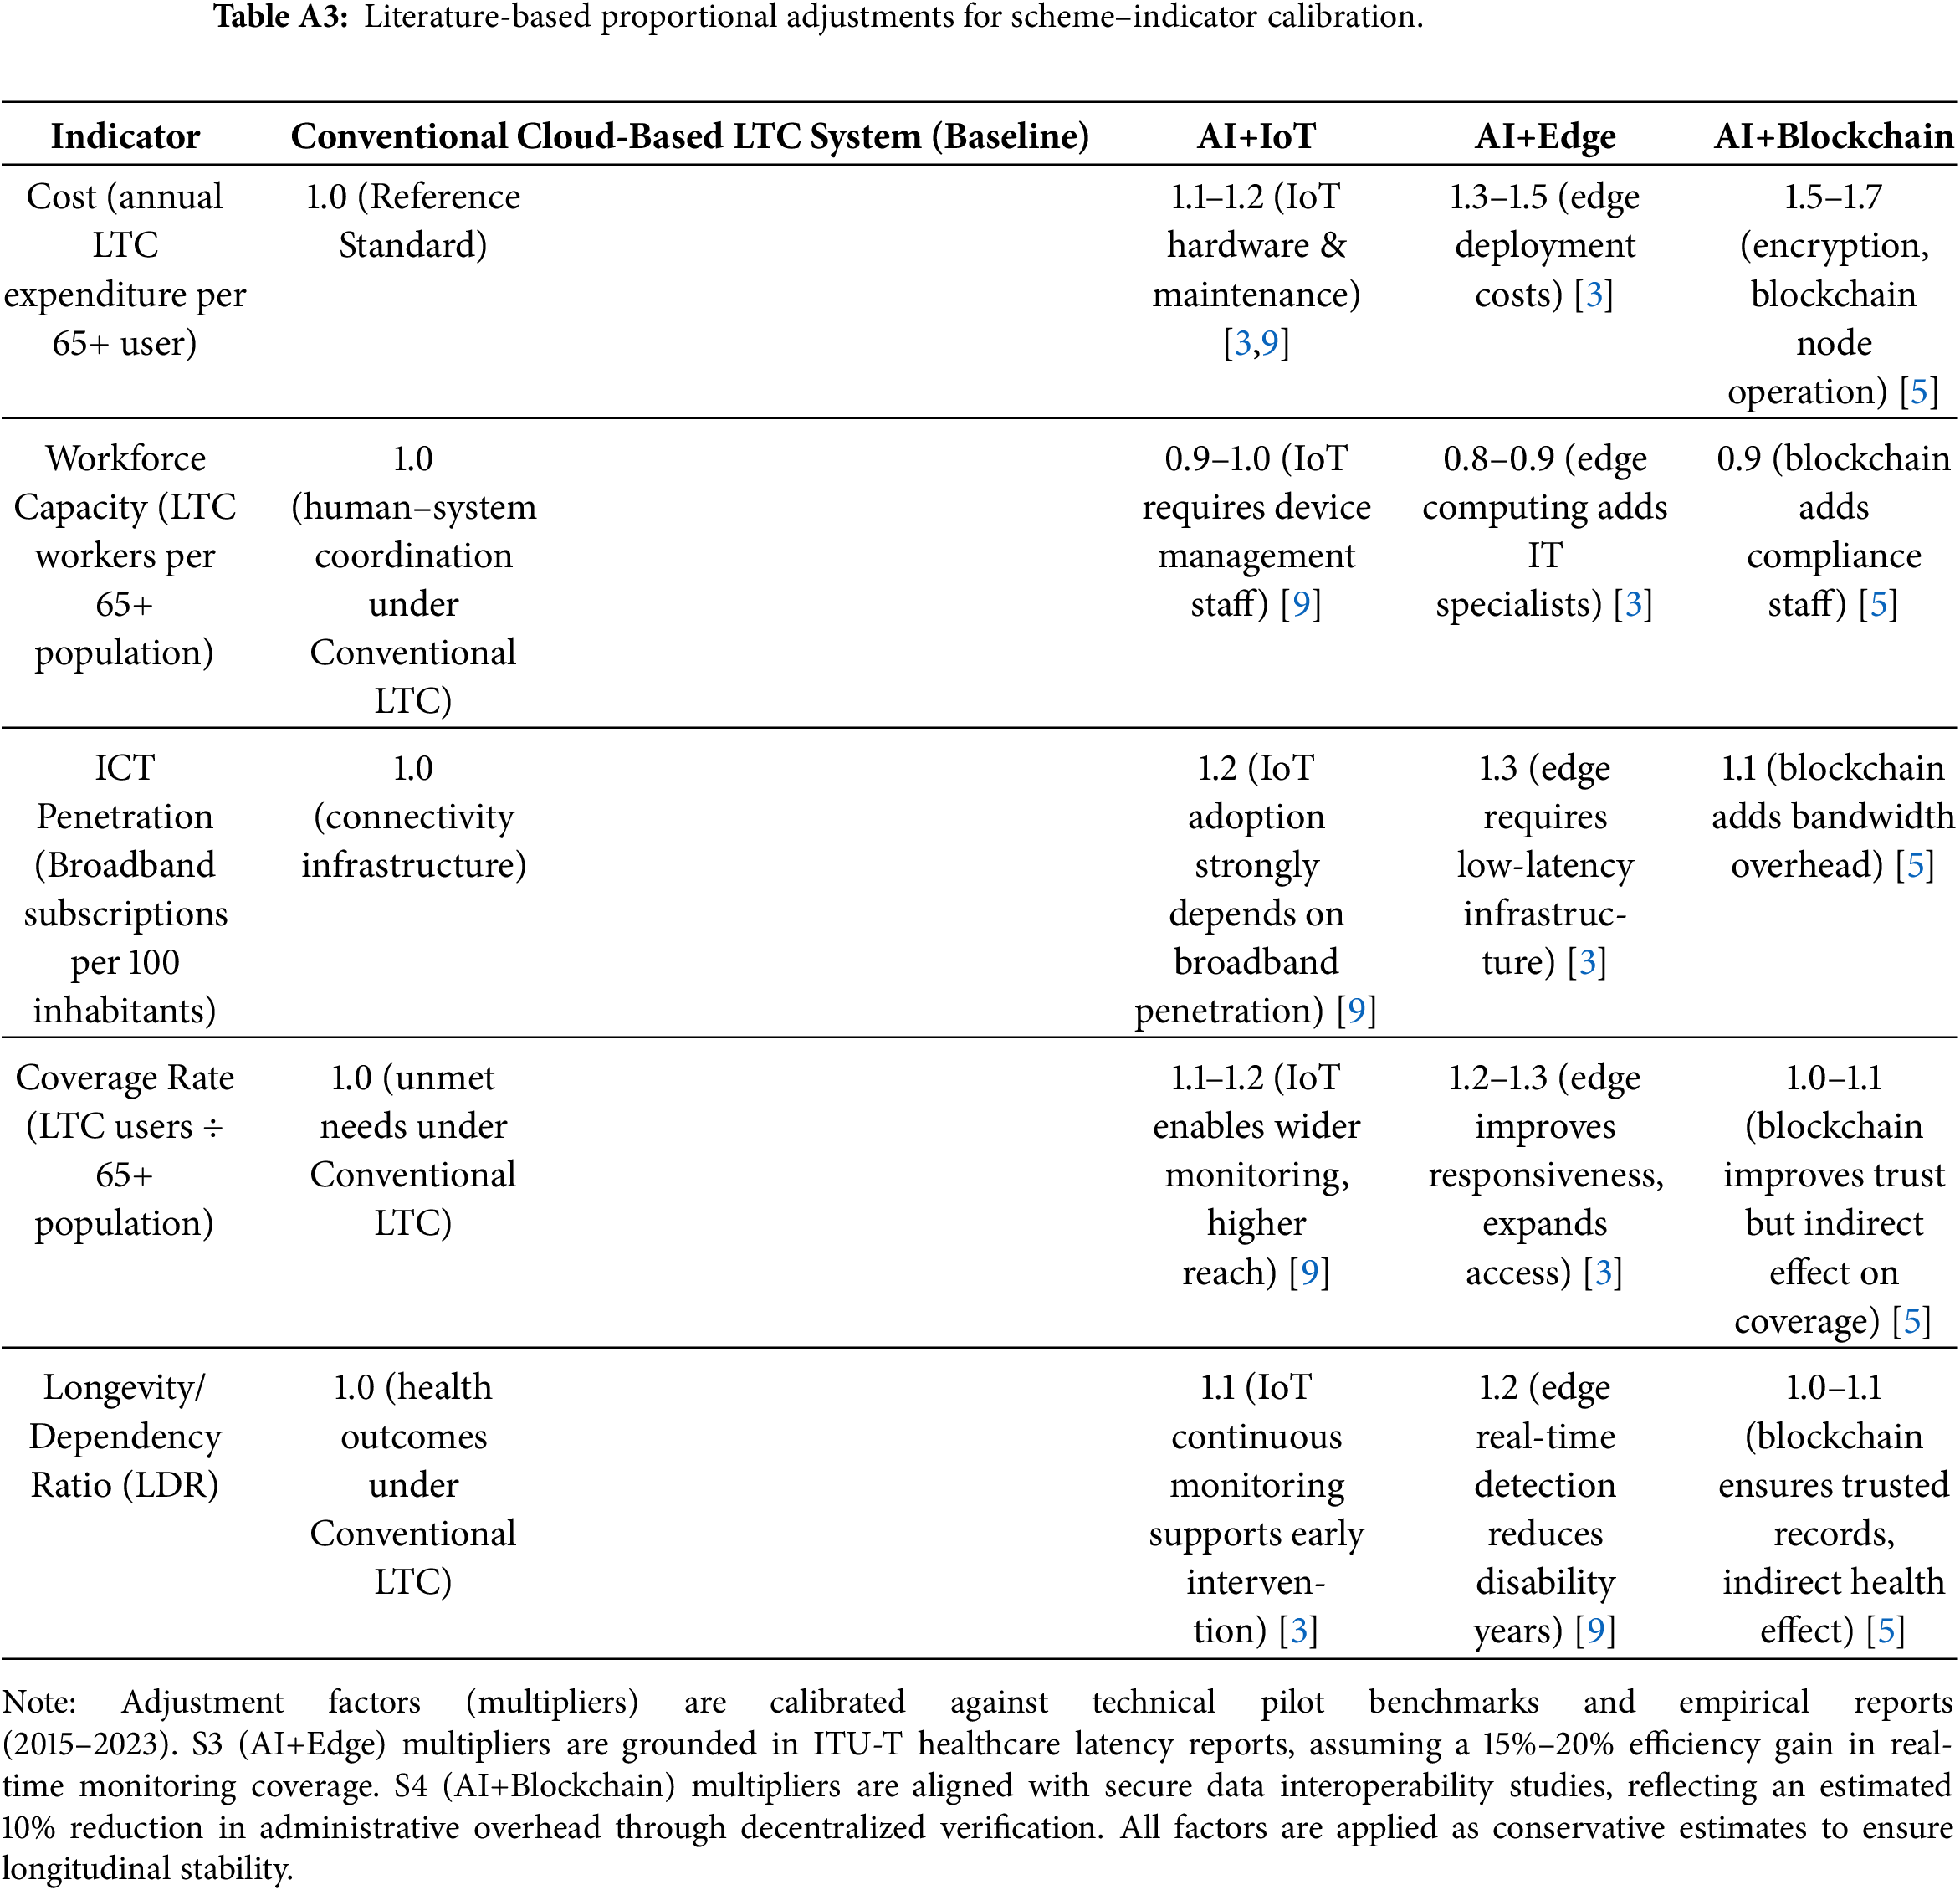
To reduce the influence of short-term fluctuations, all indicator series were averaged over the 2015–2023 period. Each indicator was then normalized to the [0, 1] interval, ensuring comparability across heterogeneous measurement units. Complete data extraction procedures, codes, and source links are provided in Appendix A Table A2. To reflect technological heterogeneity in Smart LTC deployment, four representative digital-integration schemes were defined: a Conventional Cloud-Based LTC System (baseline), AI+IoT, AI+Edge, and AI+Blockchain. Rather than imposing arbitrary performance differentials, proportional adjustments were derived from empirical evidence and systematic reviews in digital health economics, IoT-enabled care, edge computing, and blockchain-based health data management [4,5], while the baseline connectivity infrastructure was anchored in international technical benchmarks. The resulting calibration matrix, presented in Appendix A Table A3, links each indicator to scheme-specific scaling factors grounded in observed empirical ranges. This two-stage procedure—formal indicator specification followed by literature-based calibration—ensures methodological transparency, empirical grounding, and replicability. Baseline values anchored in OECD and WHO datasets are systematically adjusted using evidence-based multipliers, producing a coherent cross-country dataset. These calibrated indicator matrices constitute the empirical foundation for the subsequent Fuzzy TASC evaluation, Monte Carlo robustness analysis, and scenario-based policy assessment. The resulting calibration matrix, presented in Appendix A Table A3, links each indicator to scheme-specific scaling factors grounded in observed empirical ranges. This two-stage procedure—formal indicator specification followed by literature-based calibration—ensures methodological transparency and replicability. The adjustment factors used to simulate emerging technology impacts in the smart scenarios (S1–S4) are justified by ITU-T technical benchmarks regarding healthcare latency reduction (for AI+Edge, S3) and empirical pilot data on administrative efficiency (for AI+Blockchain, S4). These parameters are treated as conservative estimates to ensure the longitudinal stability of the 9-year evaluation period (2015–2023).
To ensure full transparency and fulfill the requirement for methodological detail, the specific data repository codes (e.g., OECD HEALTH_LTCEXP) for all five indicators are systematically archived in Appendix A Table A2. This explicit documentation ensures the longitudinal evaluation is fully traceable and transparent.
3.2 Data Normalization and Weighting
The raw decision matrix X = [
1. Compute standard deviation of each criterion:
2. Construct correlation matrix between all pairs of criteria:
3. Measure the amount of information carried by each criterion:
4. Derive normalized weights:
By executing this objective weighting protocol, the MCDM module ensures that criteria weights reflect not only the contrast intensity of each indicator but also the degree of conflict between them, providing an empirical foundation for the subsequent trade-off analysis. The raw decision matrix X was processed using Min-Max normalization to rescale heterogeneous measurement units into a consistent [0, 1] interval, ensuring that indicators such as Cost and Workforce are comparable within the TASC layers.
The first stage establishes a geometric baseline by applying distance measures between each alternative and a displaced ideal reference. Both Euclidean and cosine metrics are employed to capture magnitude- and direction-based deviations:
where
Euclidean distances are rescaled so that larger values indicate superior outcomes:
Directional consistency is further captured through cosine similarity:
Then, the associated cosine distance is
3.3.2 Threshold Screening Layer
The second stage introduces non-compensatory logic by penalizing deviations beyond indifference, preference, and veto thresholds as
Criterion-level penalties are then assigned as:
Aggregated penalties are defined as
This threshold screening layer explicitly adopts a non-compensatory logic, preventing systems with extreme structural deficiencies in areas like workforce or cost from achieving high overall scores through performance in other dimensions.
The final stage incorporates structural antagonisms by penalizing conflicting criterion pairs. For each pair
where
Pairs are classified as conflicting if
where
The integration of the TSI allows the framework to quantify structural antagonisms, ensuring that the final TASC score penalizes configurations that impose unsustainable pressures on system equilibrium.
Although the crisp TASC framework integrates geometric scoring, threshold screening, and trade-off penalization in a coherent manner, in practice, however, such thresholds are inherently imprecise. Thus, the threshold is defined as a triangular fuzzy number for capturing a plausible range around the crisp baseline. Specifically, the indifference, preference, and veto thresholds are defined as
Building on the fuzzified thresholds and trade-off tolerance intervals, the fuzzy screening score
Next, the Eq. (16) can be transformed by natural logarithm function as follows:
The fuzzy numbers in RHS of Eq. (16) can be defined
As this aggregation yields fuzzy-valued outputs, a defuzzification step is required for final ranking. The centroid-based rule is applied to yield a crisp equivalent score as
By incorporating fuzziness into both threshold logic and conflict penalization, the extended model enhances realism. It acknowledges that evaluative boundaries in long-term care sustainability are not sharp but imprecise, and it provides decision-makers with both point estimates and robustness insights under parameter uncertainty. Incorporating fuzzy triangular numbers into both threshold logic and conflict penalization enables the model to accommodate parameter ambiguity, providing policymakers with robustness insights that account for the imprecise boundaries inherent in long-term care sustainability.
4.1 Descriptive Statistics after Normalization
Following the fuzzy TASC framework, all indicators were normalized to [0, 1] scale to facilitate comparability across heterogeneous measurement units and countries. This process preserves the directional meaning of each criterion and ensures analytical consistency across subsequent layers of geometric scoring, threshold screening, and trade-off evaluation. Table 1 reports the normalized indicator values for the 12 selected countries across the five Smart LTC criteria: cost, workforce, ICT, coverage, and LDR (Longevity–Dependency Ratio). These values represent the average of the 2015–2023 period and form the baseline for scenario and Monte Carlo extensions.
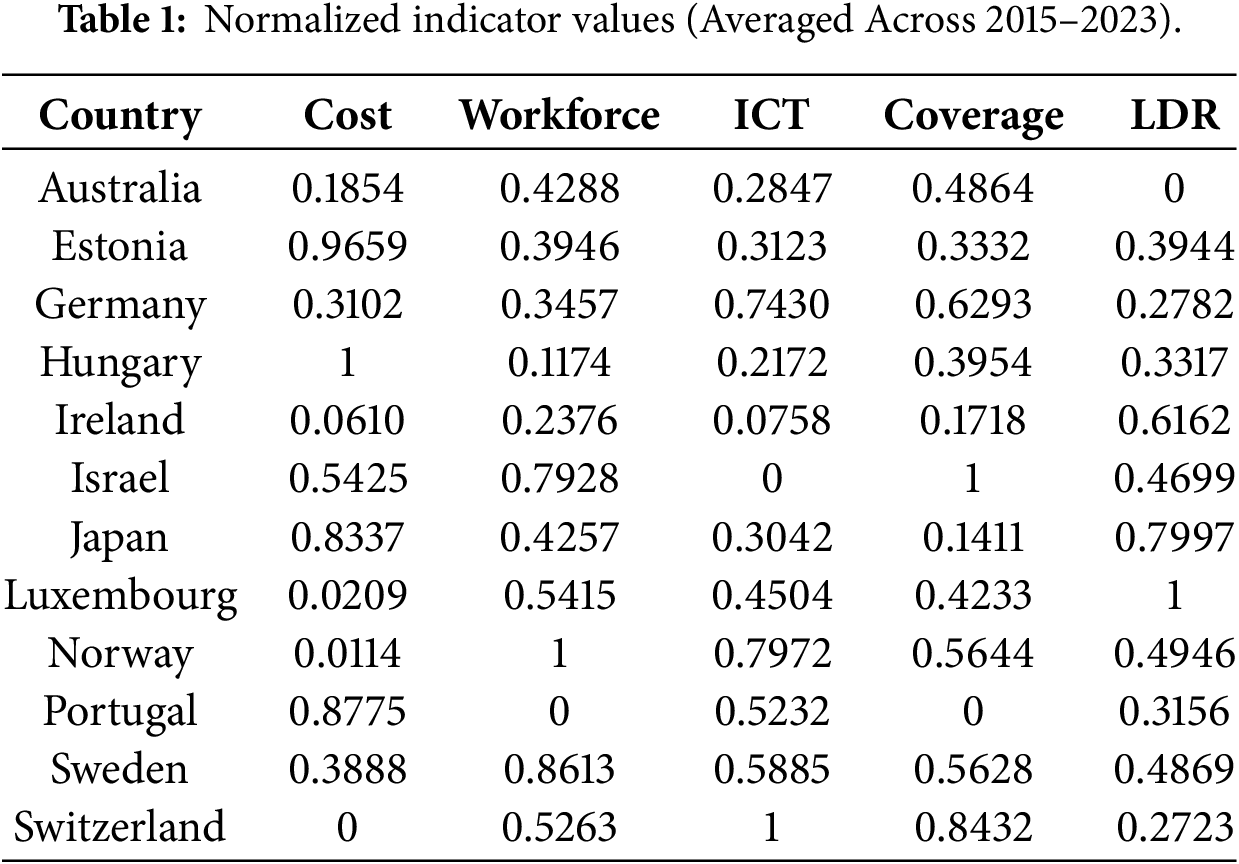
The normalized data reveal substantial cross-country heterogeneity, reflecting the differing structural and demographic foundations of LTC systems. Nordic countries (Norway, Sweden, Switzerland) exhibit high ICT and workforce scores, whereas Eastern European systems (Hungary, Estonia) face cost and workforce inefficiencies despite moderate coverage levels. Fig. 2 presents the correlation heatmap of normalized indicators. A strong positive association is observed between workforce and coverage (r = 0.6355), suggesting that expanding LTC personnel capacity directly translates into broader service access. Conversely, cost is negatively correlated with most other indicators, particularly workforce (r = −0.4744) and ICT (r = −0.4018), implying that higher spending often reflects inefficiency rather than improved outcomes. Meanwhile, LDR shows weak correlations with the remaining four dimensions (|r| < 0.25), indicating that demographic dependency operates as an independent structural constraint rather than a direct determinant of system performance.
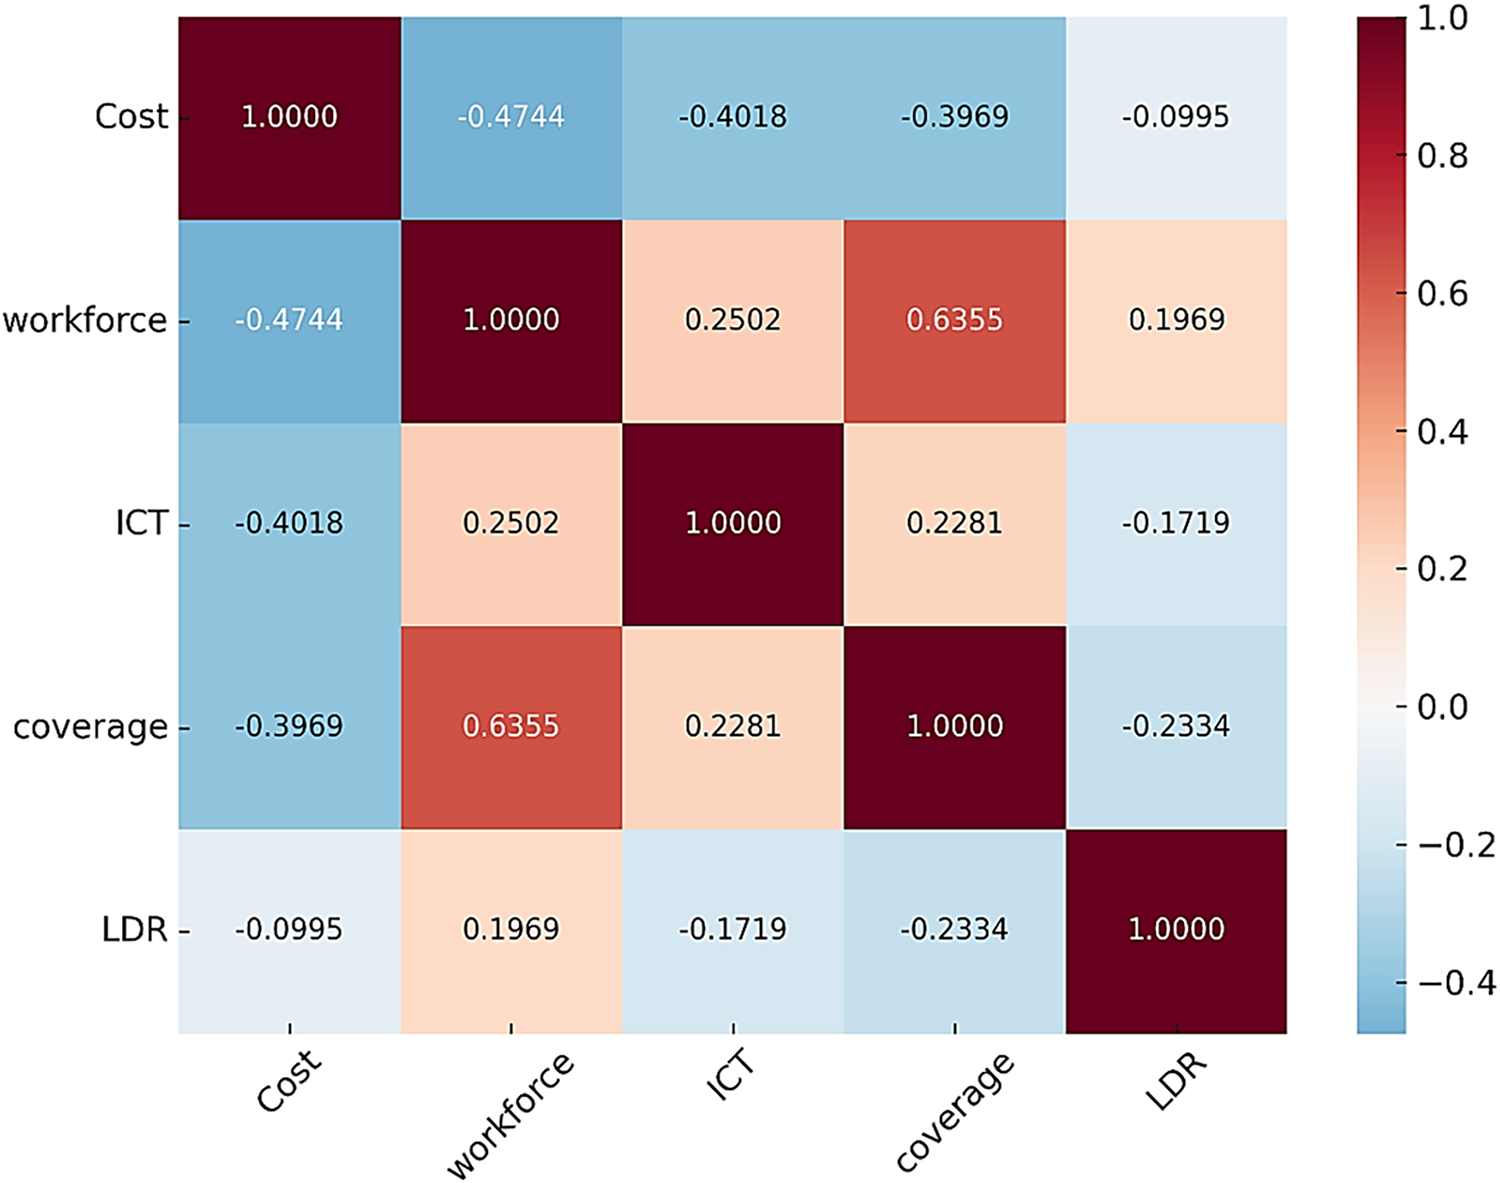
Figure 2: Correlation heatmap of normalized LTC indicators (2015–2023).
Building on the normalized Smart LTC indicators presented in Section 4.1, this section applies the TASC framework to derive composite performance scores under the baseline configuration. The results highlight how geometric alignment, threshold screening, and trade-off penalties jointly shape each country’s overall performance. Table 2 summarizes the baseline TASC outcomes for the 12 countries, decomposed into geometric scores (ScoreL2, ScoreCos), the threshold screening term (
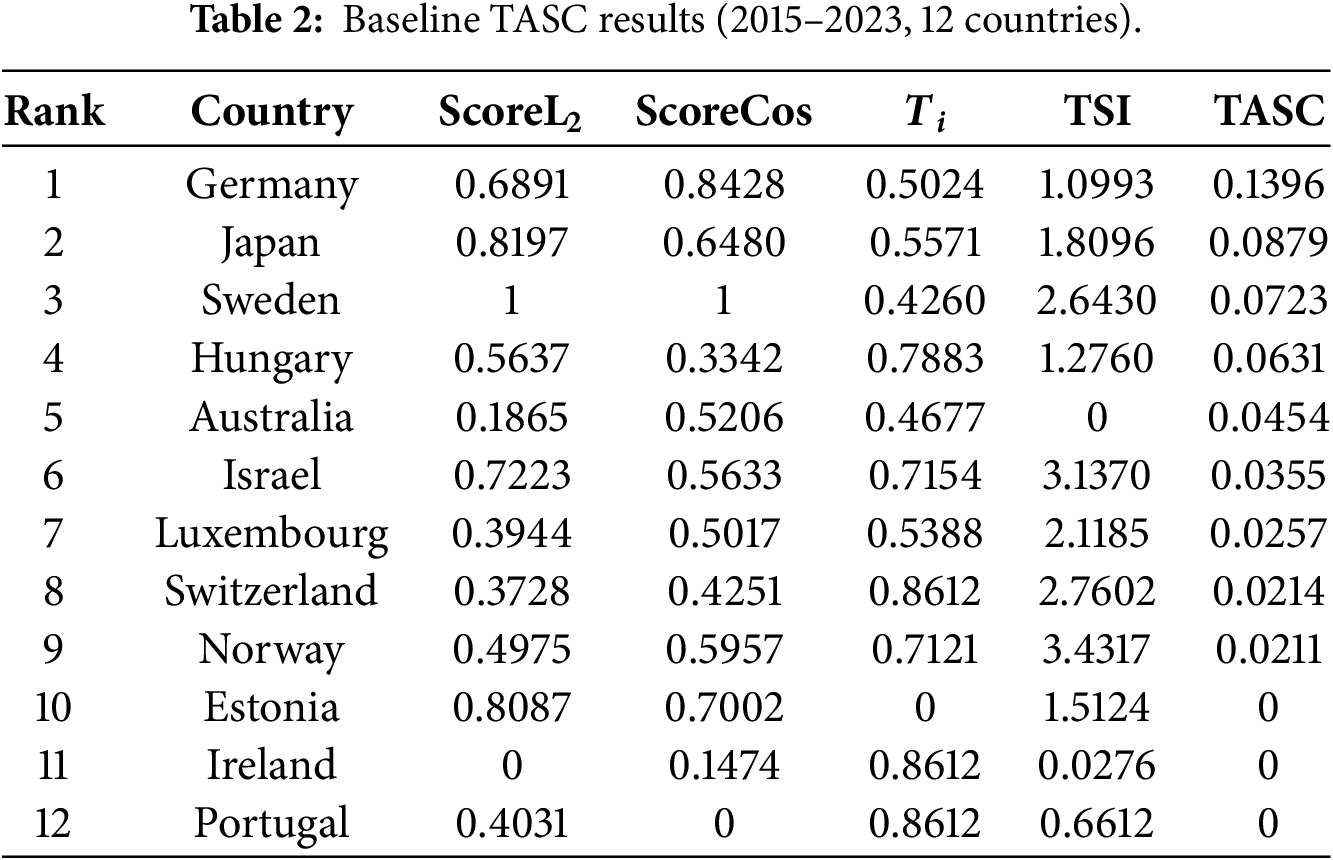
The ranking pattern indicates that final performance is determined not merely by geometric proximity to the ideal solution but also by the magnitude of internal trade-off conflicts. Germany leads with a balanced profile across geometric distances and threshold compliance, whereas Japan is more heavily penalized due to intensified cost–workforce tension. Sweden, though geometrically dominant, experiences significant compression in TASC due to its high institutional costs and demographic dependency pressure. Mid-tier performers such as Hungary and Australia achieve stability through moderate indicator values and lighter penalties, while Israel, Luxembourg, Switzerland, and Norway suffer from substantial trade-off amplification. At the lower end, Estonia, Ireland, and Portugal exhibit baseline TASC scores of zero. These outcomes do not indicate data errors but stem from the strict veto-threshold mechanism in the screening layer, which can suppress composite scores when any criterion falls below its critical boundary. In practice, a modest relaxation of veto parameters (e.g., v ≈ 1.2σ) would likely restore positive scores, implying that the zero outcomes reflect structural imbalance rather than calibration bias.
Fig. 3 visualizes the interaction between geometric alignment and trade-off severity. Larger and lighter-colored bubbles represent balanced Smart LTC systems with sustainable trade-off profiles, whereas smaller and darker bubbles denote high conflict intensity leading to score compression. Overall, the baseline evaluation reveals that Smart LTC performance is driven not only by technological adoption but also by systemic balance among cost, workforce capacity, and digital readiness. Even technologically advanced systems encounter diminishing returns when internal trade-off intensity remains unmanaged. These findings establish the empirical baseline for subsequent scenario simulations and Monte Carlo sensitivity analyses.
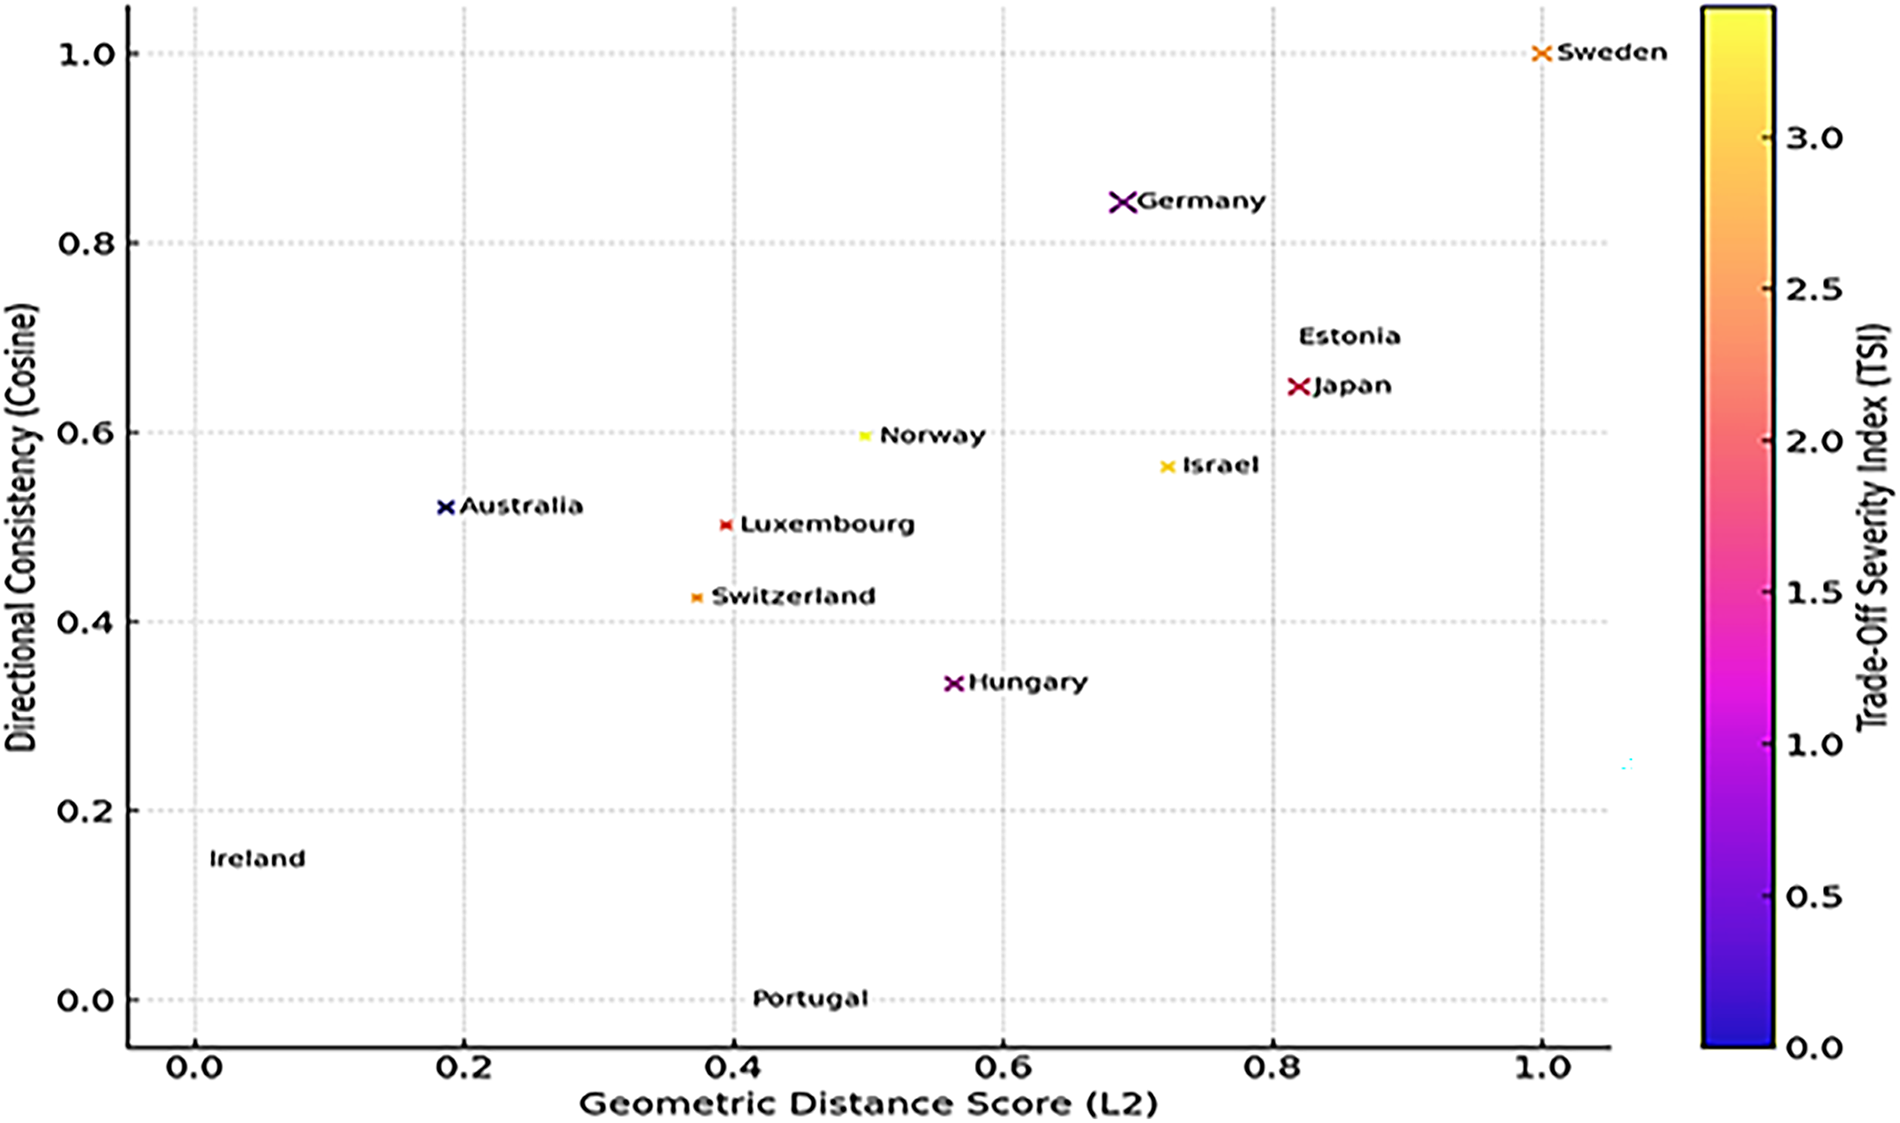
Figure 3: Baseline TASC decomposition by layer.
4.3 Smart Scenario Analysis under AI-Enhanced LTC Configurations
This section evaluates how digital convergence pathways reshape the internal balance of Smart LTC systems. Four configurations were analyzed—the Conventional Cloud-Based LTC System (Baseline) and three Smart LTC configurations: AI+IoT, AI+Edge, and AI+Blockchain. Each represents a different mode of automation, computation, and governance applied to the same long-term care indicator framework. To evaluate how varying digital-integration schemes reshape the performance and trade-off behavior of Smart Long-Term Care (Smart LTC) systems, three Smart LTC configurations were simulated against the Conventional Cloud-Based LTC System (Baseline): AI+IoT, AI+Edge, and AI+Blockchain. This scenario analysis explores the sustainability balance among cost, workforce, and service coverage dimensions under distinct pathways of digital convergence.
The baseline represents a conventional cloud-based LTC infrastructure characterized by centralized data storage and limited cyber-physical connectivity. Each enhanced scenario introduces a different layer of digital augmentation—automation (AI+IoT), localized computation (AI+Edge), or distributed trust (AI+Blockchain)—to observe how these mechanisms modify systemic equilibrium. For each configuration, five Smart LTC indicators (cost, workforce, ICT, coverage, and LDR) were proportionally adjusted using literature-supported performance bounds (Table A2). Mid-range empirical values were adopted to approximate realistic operational intensities, while all datasets were normalized against the same baseline reference to ensure comparability, where
Table 3 summarizes the scenario-specific adjustments. These multipliers are literature-informed mid-points derived from the technological performance bounds detailed in Table A3 (Appendix A). Cost and workforce are the most sensitive to infrastructural change, whereas ICT and LDR remain relatively stable. Edge computing induces the largest cost escalation but enhances service coverage and workforce efficiency. Blockchain integration, by contrast, yields moderate cost increases yet improves reliability and privacy protection. The escalating costs in the Edge and Blockchain configurations (1.40 and 1.60, respectively) reflect the increased CAPEX and encryption overhead required for localized computation and secure data interoperability. Conversely, the workforce efficiency gain in the Edge scenario (0.85) is attributed to reduced latency in automated monitoring, consistent with ITU-T healthcare standards.
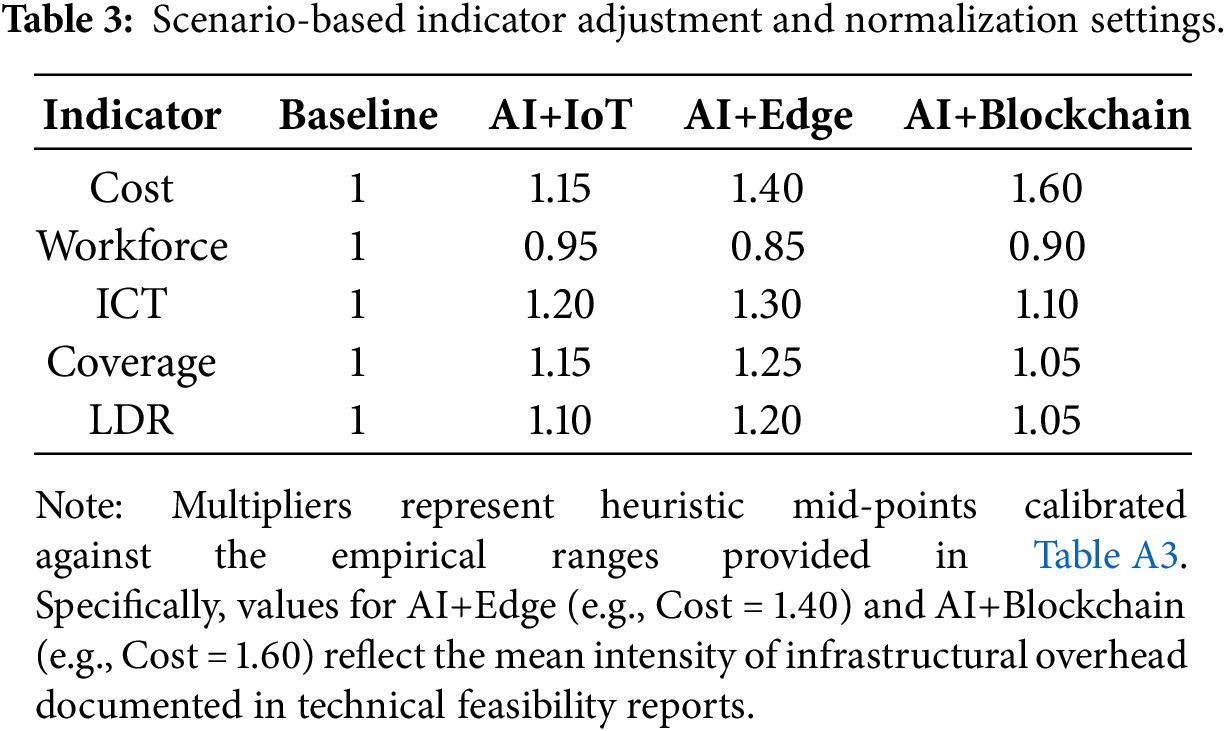
Table 4 reports the pairwise trade-off thresholds (γjk). Valid trade-off pairs decline from 10 at baseline to 3 under IoT and Edge, before rebounding to 6 with Blockchain. The sharp drop in γ1,2 (cost–workforce) from 0.9445 to 0.4634 (Edge) and further to 0.2887 (Blockchain) reveals intensifying financial–human resource tension. This suggests that as technological complexity increases, the systemic capacity to balance expenditures and staffing becomes more constrained, requiring countries to possess higher structural resilience to navigate these narrowed trade-off thresholds.
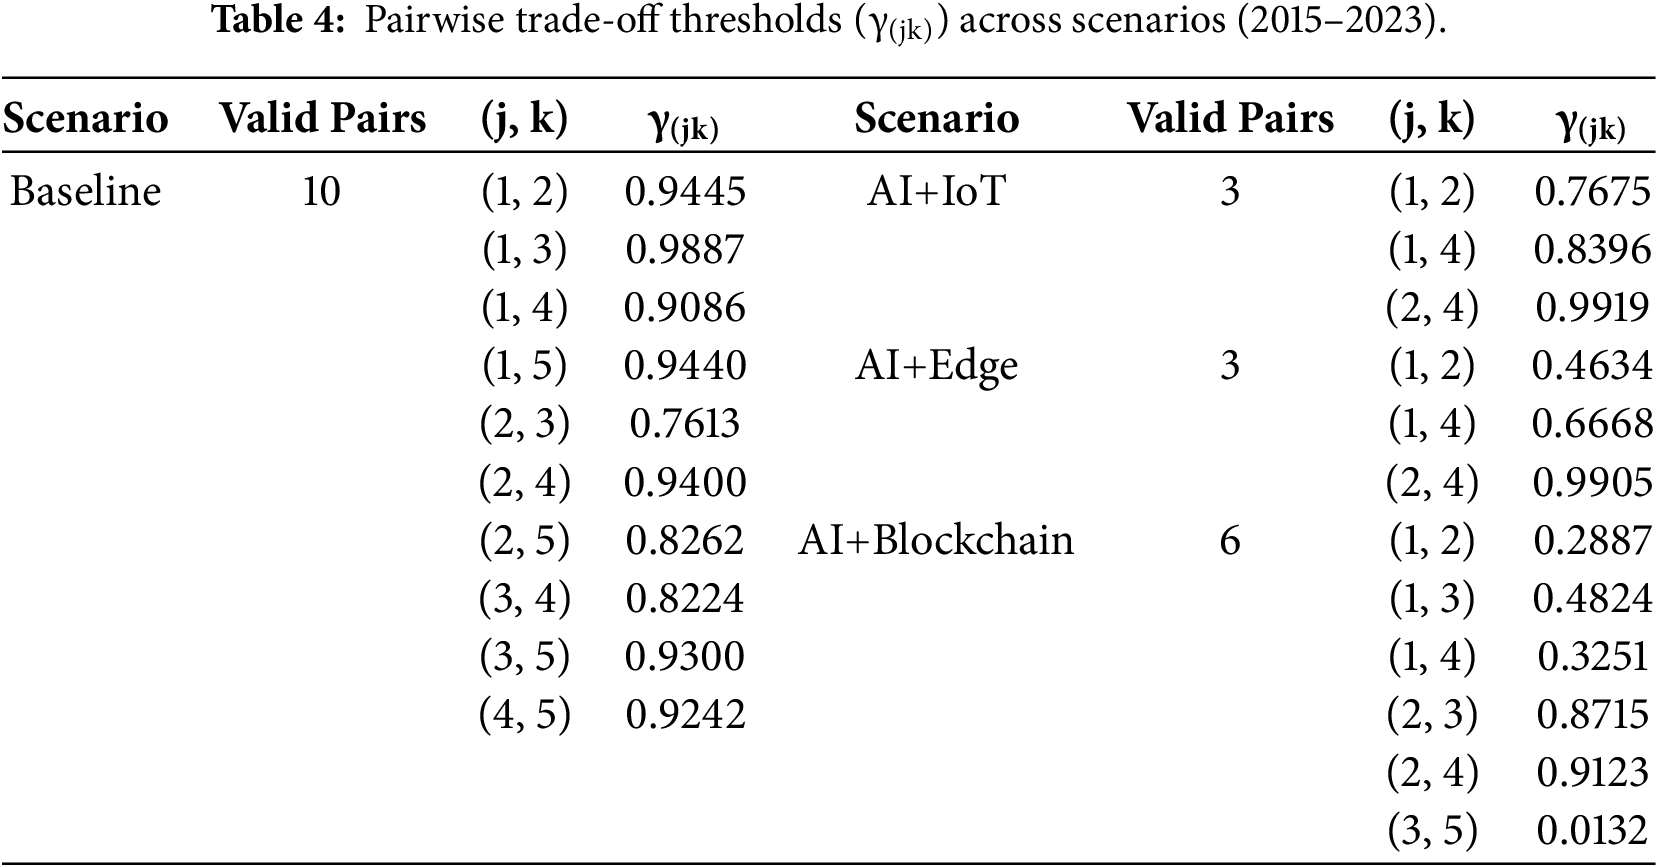
Table 5 compares the composite TASC scores and corresponding ranks across the four Smart LTC configurations. While Germany leads in the Baseline scenario, Japan dominates the three AI-enhanced configurations, reflecting a balanced LTC structure in which strong ICT readiness and adaptive workforce capacity jointly offset cost-related pressures. This balance suggests that technological maturity in service delivery helps mitigate the cost–workforce trade-off that constrains most other systems. Under AI-integrated scenarios, countries such as Estonia and Portugal show significant upward mobility, showing that digital maturity enhances efficiency when technological costs are contained.
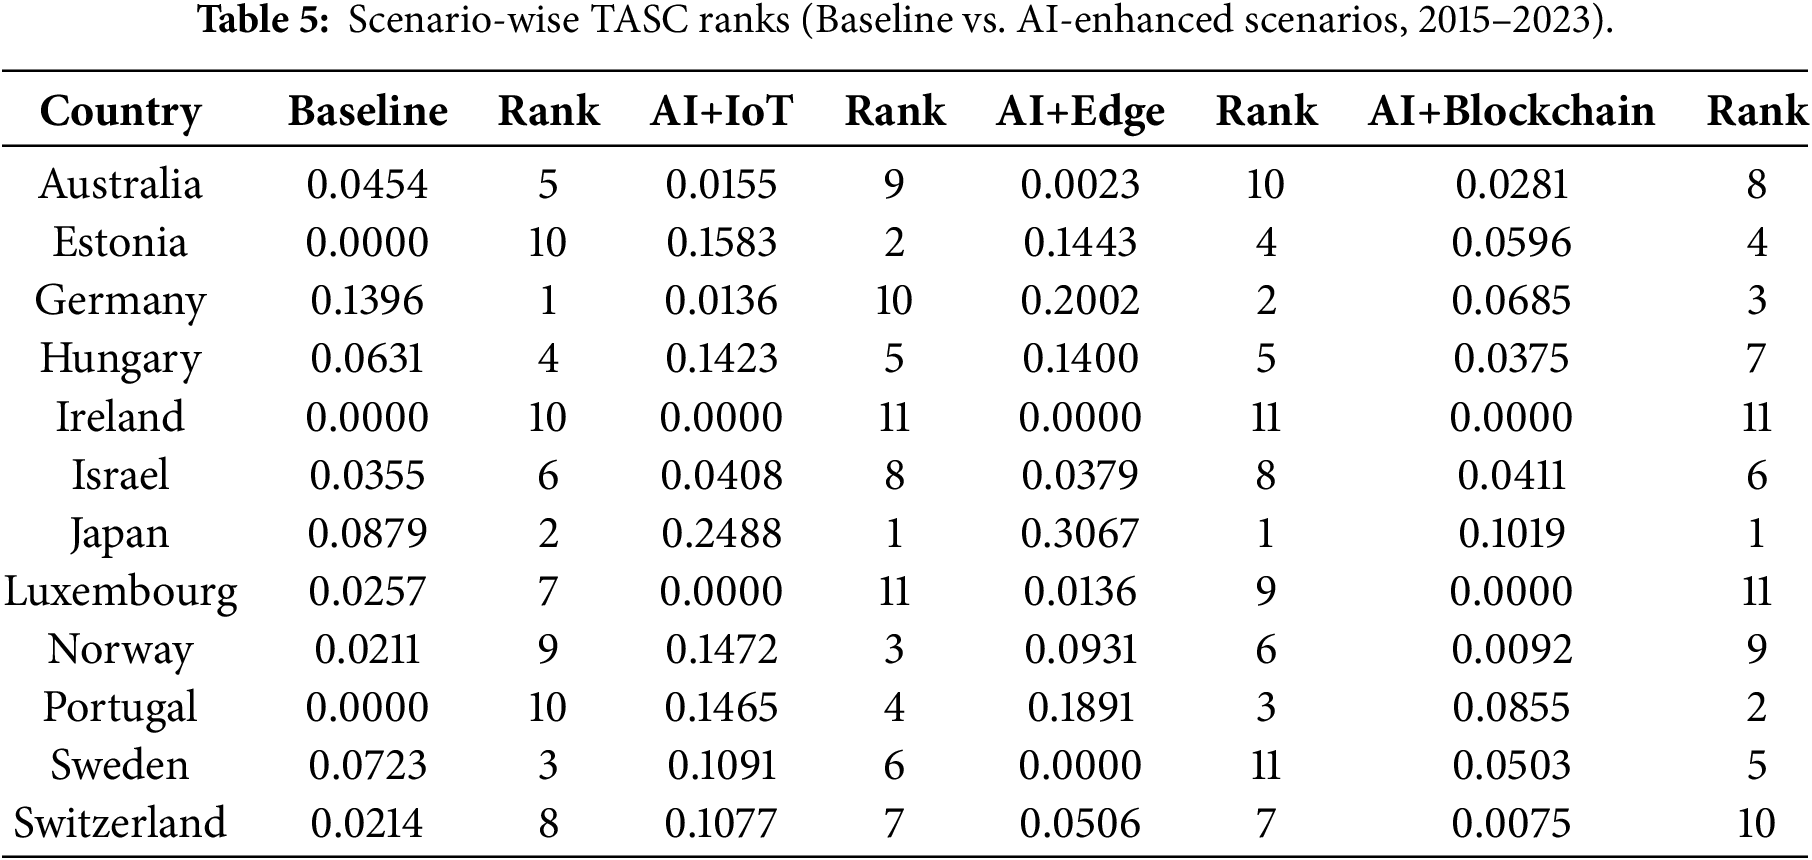
Edge-based systems exhibit the sharpest differentiation, amplifying advantages for advanced digital infrastructures but penalizing cost-sensitive economies. Conversely, Blockchain integration produces moderate stabilization—reducing cross-country score variance while compressing the margin between leaders and followers. The decline of the trade-off threshold γ1,2 from 0.9445 to 0.2887 under the Blockchain configuration indicates an intensification of structural tension between cost and workforce criteria. This finding implies that distributed ledger mechanisms can reduce administrative redundancy and improve data transparency, thereby easing systemic conflicts in long-term care operations.
Fig. 4 compares normalized TASC scores across the four digital configurations for 12 countries. Each stacked segment represents criterion-level contributions aggregated within the final Smart LTC TASC outcome, allowing direct observation of how technological augmentation alters cross-dimensional balance. Japan demonstrates leadership across the technology-enhanced configurations, while Edge-based systems exhibit the steepest dispersion—highlighting uneven readiness for localized computing. The Blockchain scenario yields a narrower and more symmetric distribution, reflecting systemic consolidation and improved alignment among conflicting criteria rather than pure efficiency gains. Overall, the scenario analysis demonstrates that digital augmentation intensifies trade-off sensitivity: as technological complexity rises, the number and severity of inter-criteria conflicts reshape performance hierarchies more profoundly than raw performance gains. These findings confirm that while Germany excels in the baseline equilibrium, Japan’s structure is particularly resilient under high-complexity digital integration.
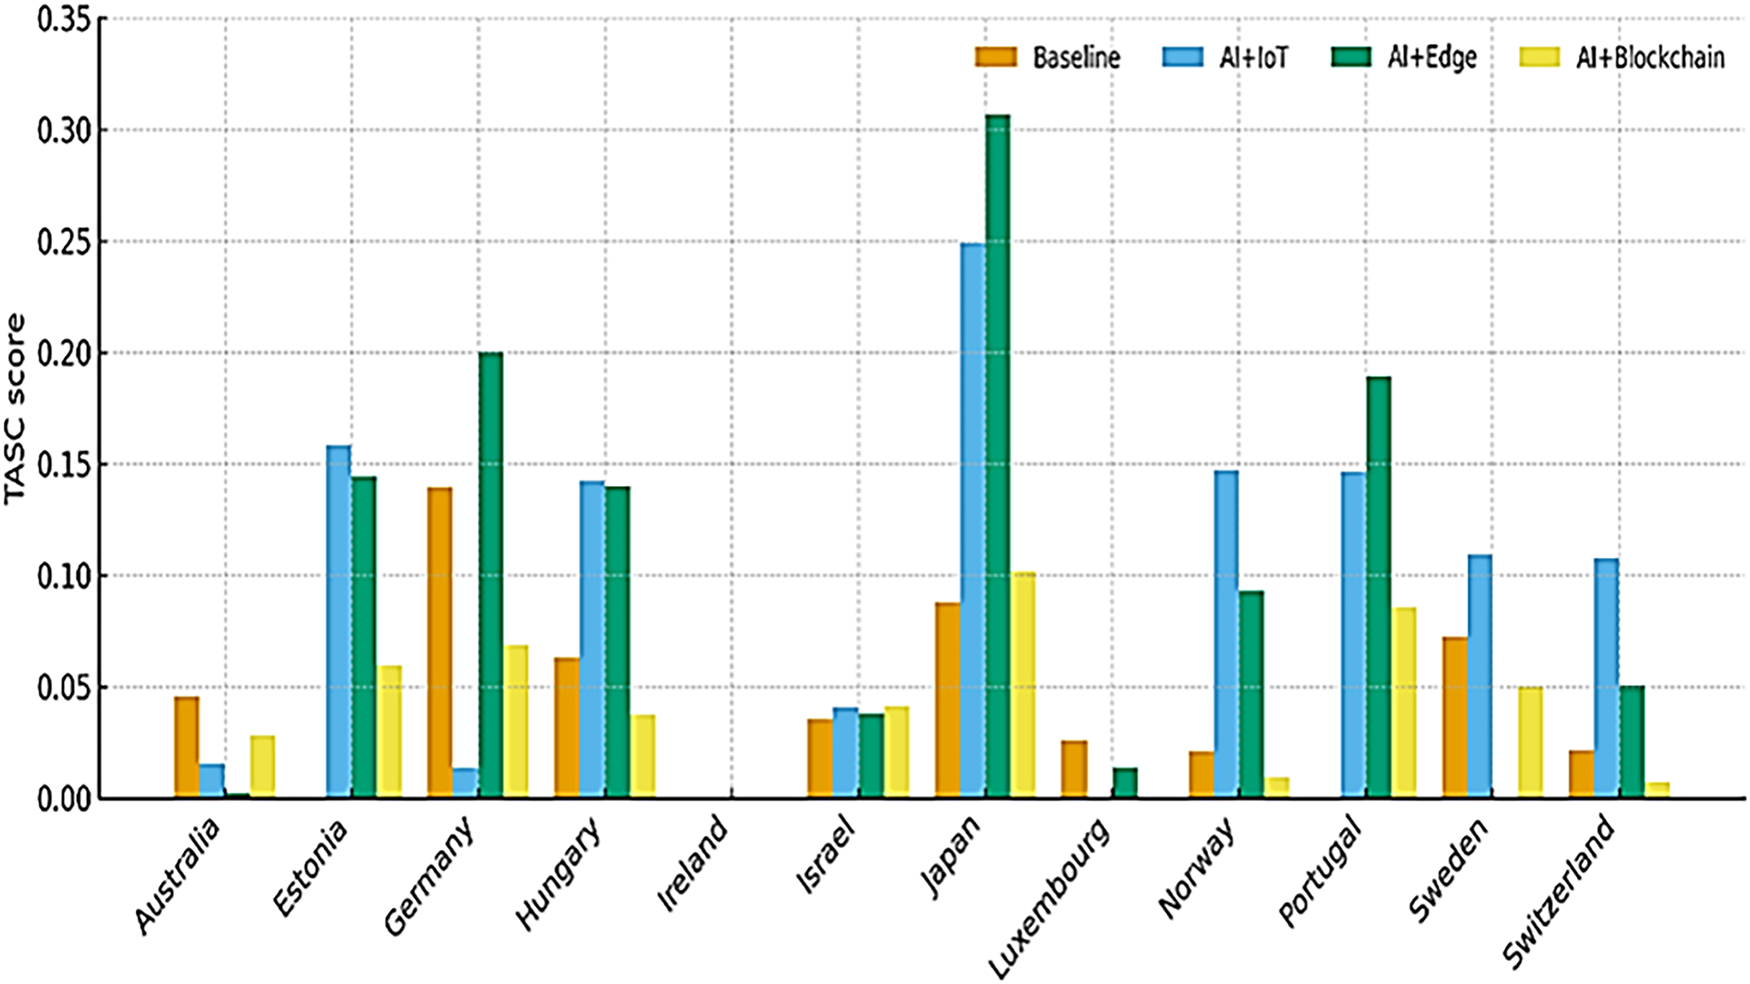
Figure 4: Scenario-wise smart LTC comparison (2015–2023).
4.4 Monte Carlo Simulation for Robustness Evaluation
To assess the robustness of the TASC framework under stochastic fluctuations, a Monte Carlo experiment was conducted using the baseline Smart LTC configuration. Random perturbations were introduced into all five normalized indicators to represent data uncertainty, contextual variability, and potential measurement errors within the LTC information environment. For each simulation run, a perturbed indicator matrix
The Gaussian assumption was adopted for its analytical simplicity and its ability to generate symmetric, mean-preserving perturbations around the empirical mean. Under small σ levels (≤0.10), this choice ensures bounded variations within the [0, 1] range, avoiding the shape distortions introduced by alternative bounded distributions such as Beta or Dirichlet. To maintain the mathematical integrity of the normalized interval, a clipping operator was applied to ensure that all perturbed values remained within the range [0, 1]. Specifically, any simulated value exceeding 1.0 was reset to 1.0, and any value falling below 0 was reset to 0. This procedure preserves the physical validity of the indicators while allowing the Gaussian noise to simulate realistic measurement uncertainties.
Three noise levels were considered: low (σ = 0.01), medium (σ = 0.05), and high (σ = 0.10). Each configuration was simulated 1000 times and evaluated through the complete TASC procedure, including geometric scoring, threshold screening, and trade-off penalization. This process allowed examination of how random fluctuations in input data propagate through the model’s multi-layered structure. To maintain methodological comparability across runs, the CRITIC-derived criterion weights and all ten identified trade-off pairs were held constant. However, the penalty coefficient α was dynamically recalibrated for each simulation according to the maximum observed trade-off severity index (
This adaptive calibration ensures scale-consistent penalization: as noise increases and
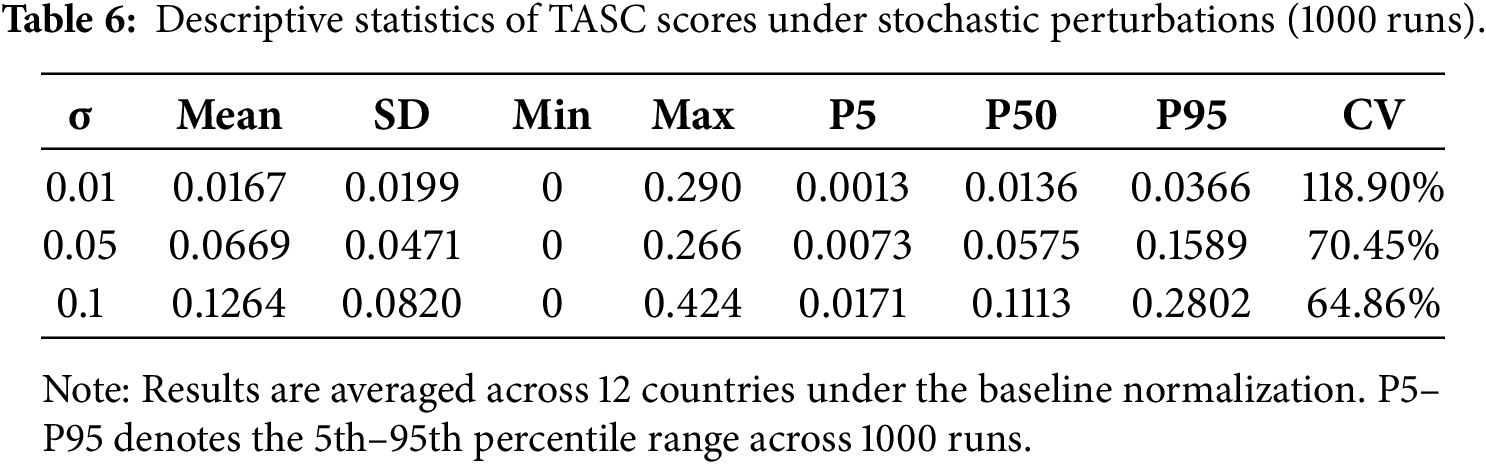
Following the statistical summary in Table 6, Fig. 5 further visualizes the empirical TASC score distributions obtained under three noise levels (σ = 0.01, 0.05, 0.10). The gradual widening of the histogram and the right-tail elongation confirm that higher stochastic perturbations induce greater dispersion in composite scores. Nevertheless, the core ranking stability—preserved through consistent α scaling—indicates that the trade-off penalty layer enhances sensitivity without compromising structural coherence.
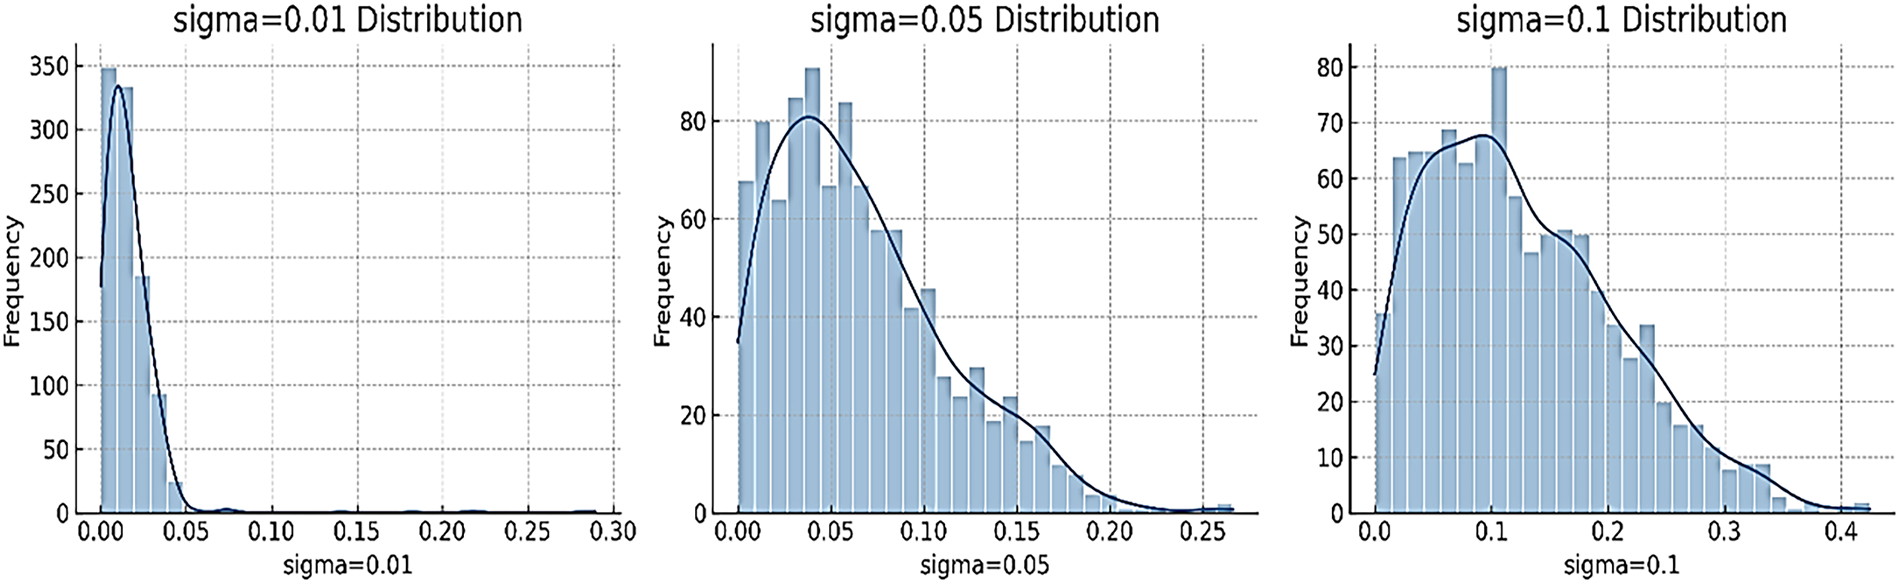
Figure 5: Distribution of TASC scores under σ = 0.01, 0.05, 0.10.
Fig. 6 visualizes the full TASC score distributions using violin plots for the three noise intensities. At low noise (α = 0.01), the distribution is narrow and centered near the baseline mean, confirming numerical stability of both the geometric and threshold layers. As α increases, the score dispersion widens and the right tail elongates, indicating that trade-off penalties amplify sensitivity to input variability. Nevertheless, the preservation of consistent 𝛼 scaling prevents structural collapse, as the overall ranking logic and the relative stability of the leading group remain consistent across the 1000 runs.
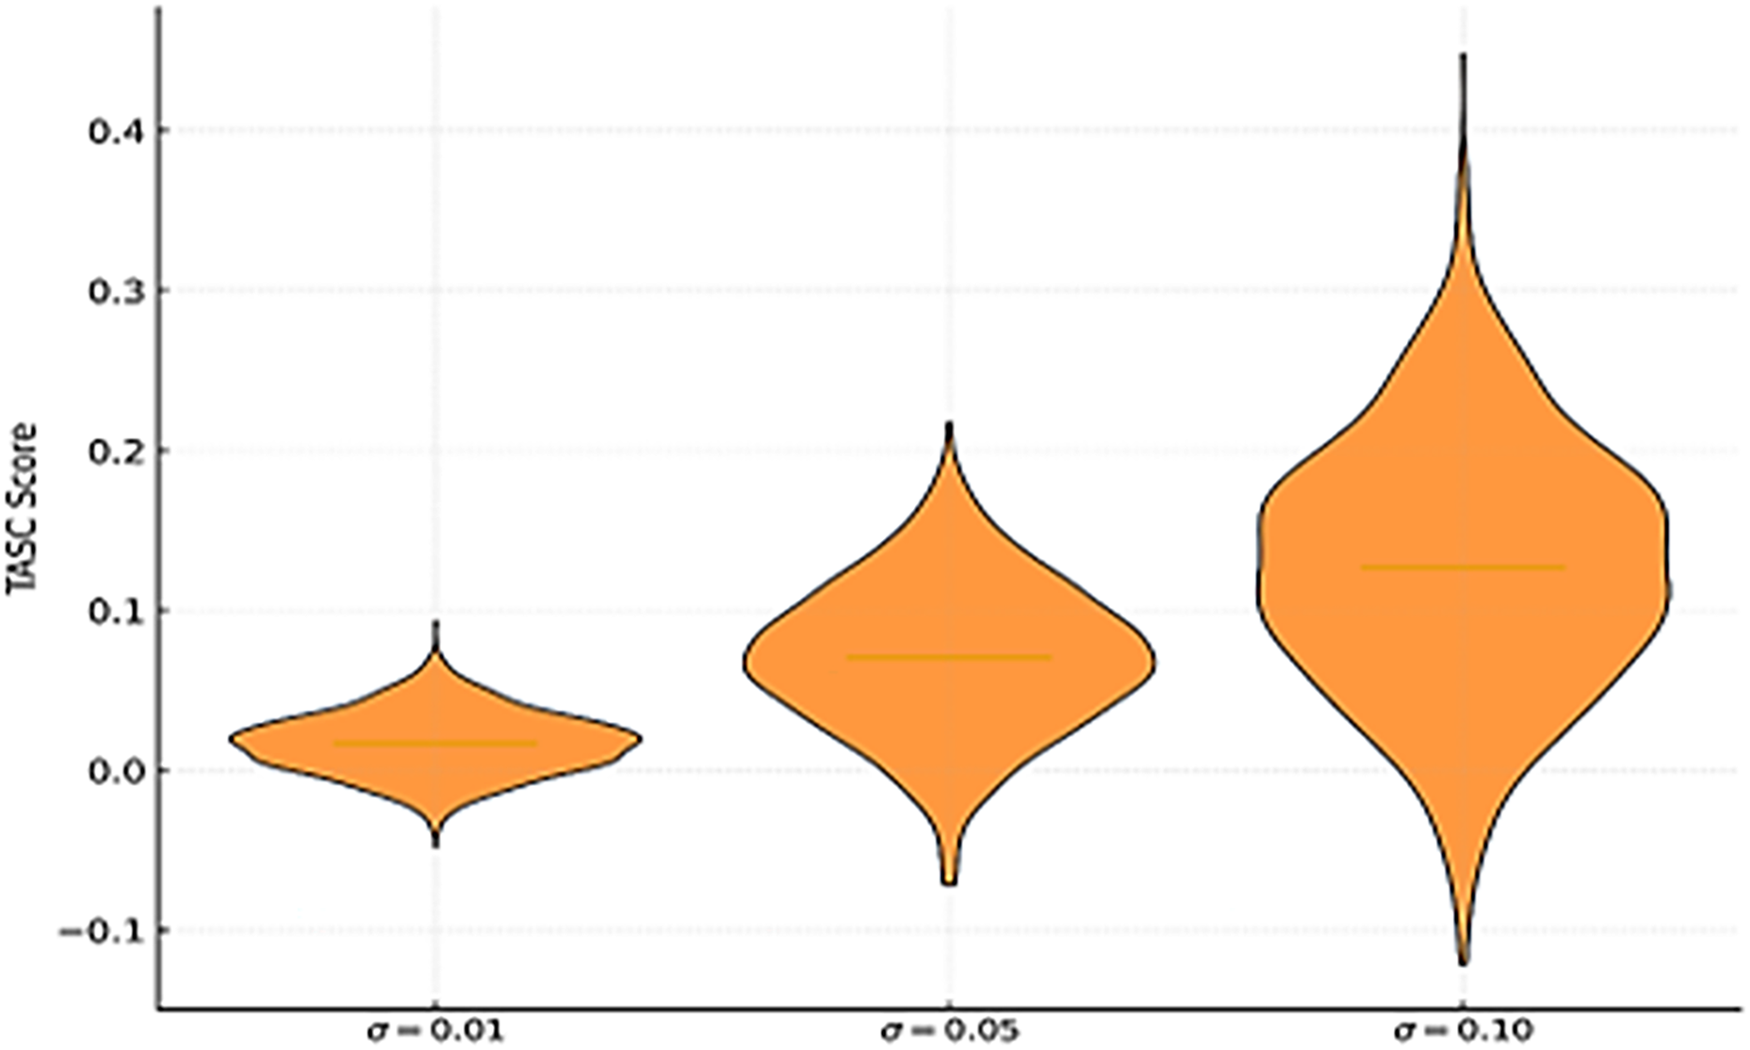
Figure 6: Violin plot of TASC scores under σ = 0.01, 0.05, 0.10.
It should be noted that the Monte Carlo process generated new stochastic samples for each run rather than perturbing a fixed set of countries. Consequently, cross-run rank correlations such as Spearman’s ρ or Kendall’s
4.5 Fuzzy TASC Evaluation under Scenario Uncertainty
To further examine the consistency of the TASC framework under parameter ambiguity, a fuzzy extension was implemented using three threshold configurations: Fuzzy L (low), Fuzzy M (medium), and Fuzzy U (upper). Each configuration represents distinct tolerance levels in the threshold layer, where Fuzzy L yields the strictest cut-offs and Fuzzy U the most permissive. The overall scoring process remained identical to the deterministic TASC, preserving both geometric and trade-off structures. Across the three fuzzy settings, Fuzzy M produced moderate dispersion and was adopted as the baseline for comparison. Japan, Israel, and Germany consistently occupied the top positions, although their relative order shifts during the defuzzification process. Specifically, Germany’s move to third in the final defuzzified rank is not a sign of performance decline, but rather a reflection of uncertainty compression. Its high sensitivity to threshold changes causes the fuzzy centroid to shift, as evidenced by its compressed Fuzzy U value. In contrast, Ireland and Portugal repeatedly scored zero across fuzzy scenarios, indicating structural weakness in both geometric and trade-off performance.
The defuzzified TASC scores, obtained through centroid-based averaging of each triangular fuzzy triplet, yield a stable ranking pattern summarized in Table 7. Although several countries (e.g., Germany and Estonia) exhibit non-monotonic fuzzy intervals—where the upper bound (U) is lower than the middle value (M)—this arises from asymmetric fuzzy expansion based on each criterion’s standard deviation. When inter-criteria trade-offs are pronounced, the centroid shifts toward the lower end of the support, generating compressed or inverted shapes. Consequently, the apparent reduction from M = 0.1396 to a defuzzified value of 0.0762 for Germany does not indicate performance deterioration but rather compression of uncertainty around a stable ordinal position. These findings confirm that fuzzy TASC preserves rank robustness while revealing each system’s sensitivity to threshold relaxation.
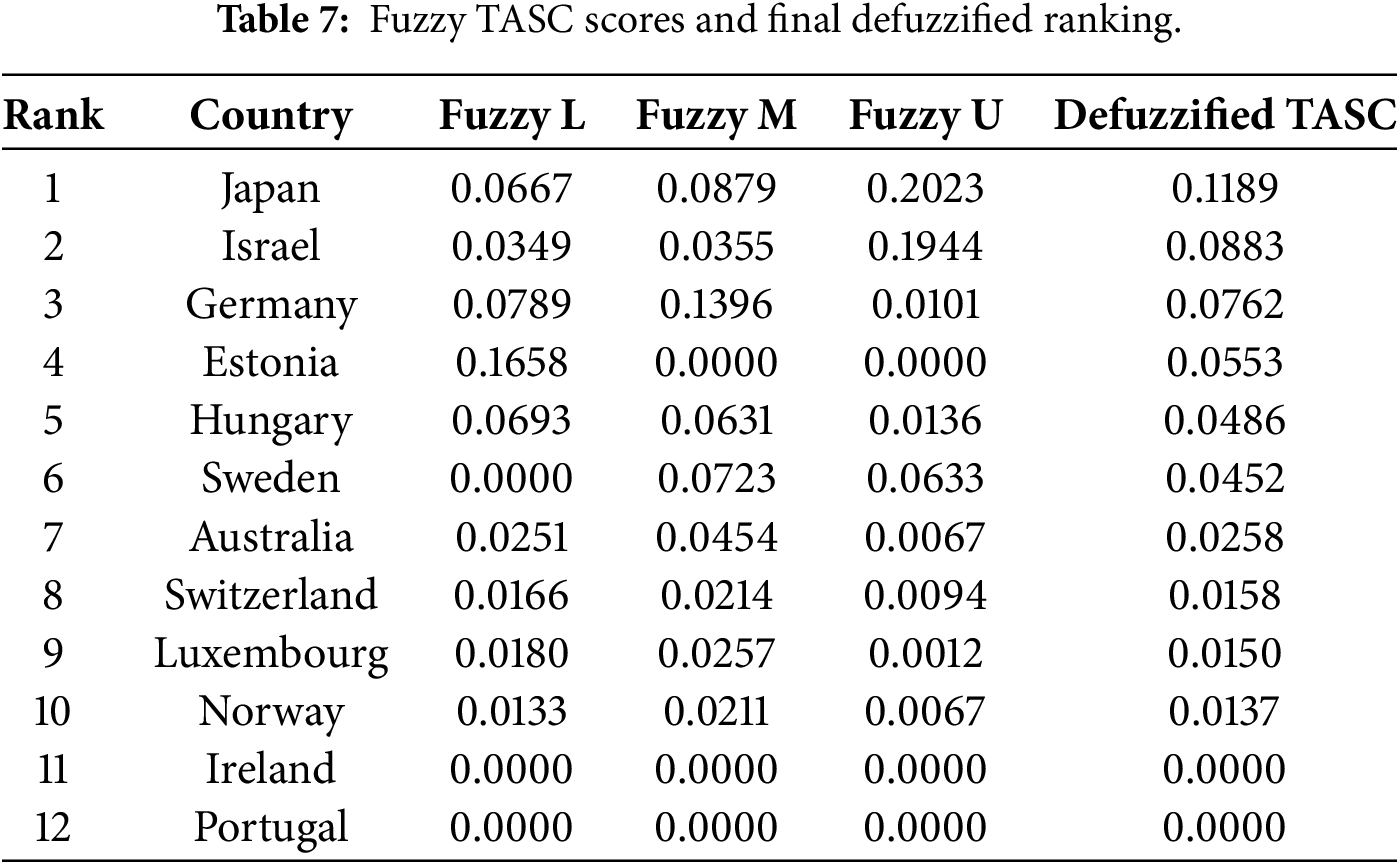
Fig. 7 illustrates these fuzzy intervals. Each horizontal line represents the uncertainty range (L–U) of a country’s TASC score, with blue markers denoting fuzzy means (M) and black × symbols indicating the defuzzified values. The variations in interval width and centroid positioning among the leading group (Japan, Israel, Germany) reflect their specific internal consistency and evaluative behavior under uncertainty. Specifically, the visualization confirms that while Germany maintains a high fuzzy mean (M), its final defuzzified position is significantly influenced by uncertainty compression at the upper bound.
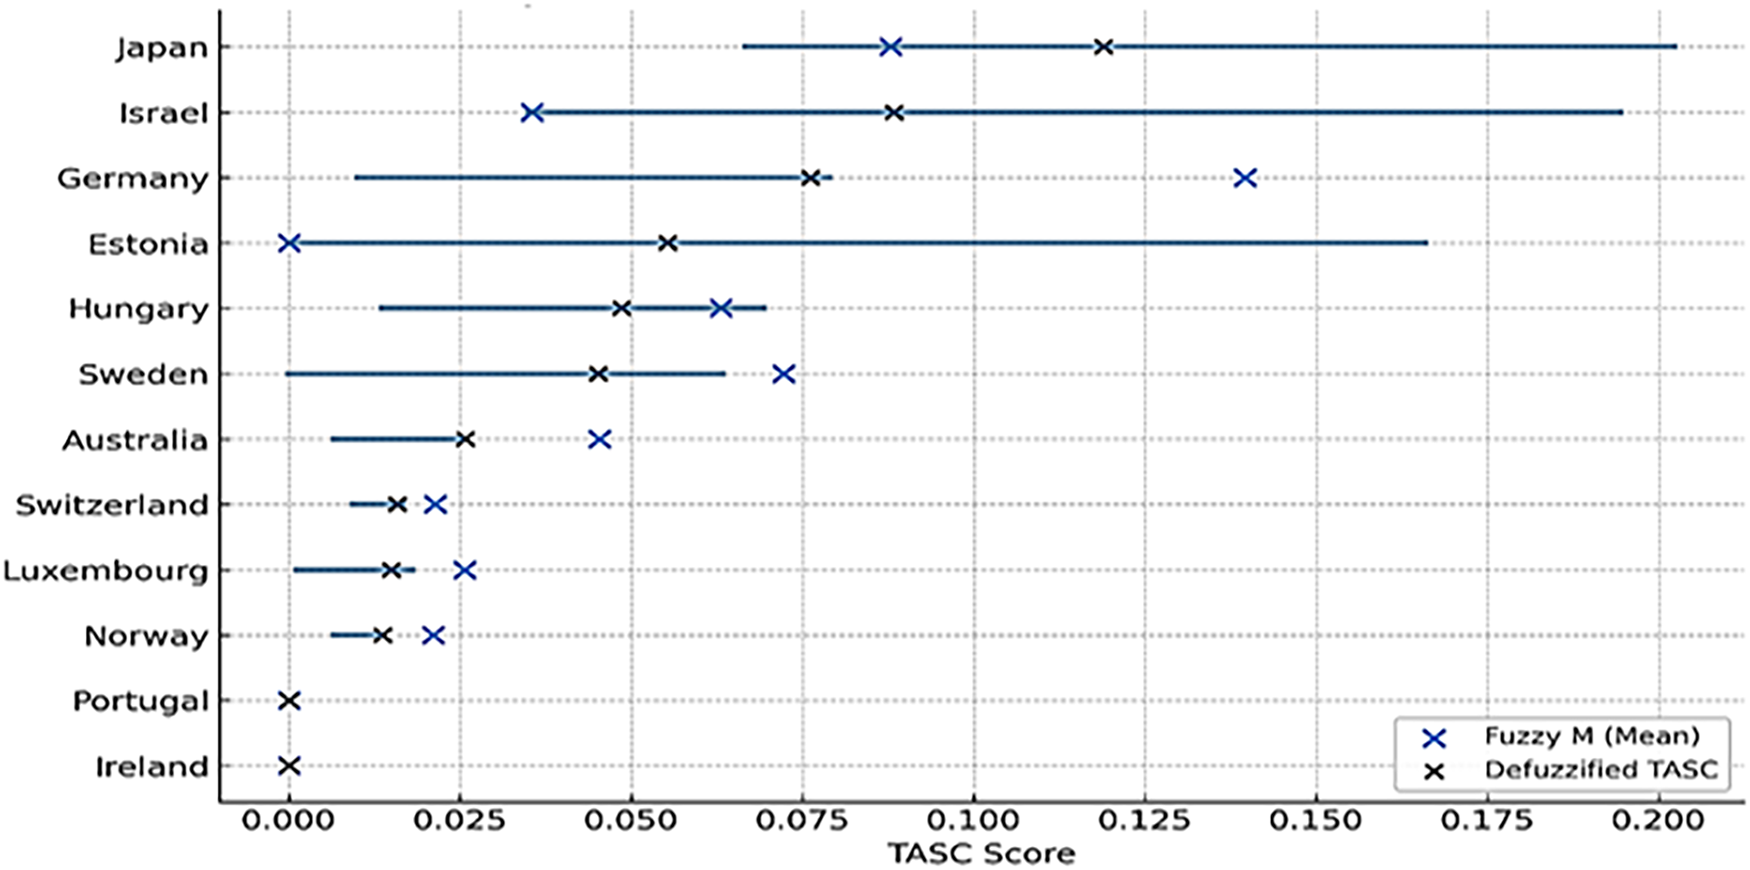
Figure 7: Fuzzy TASC score intervals (L–M–U) and defuzzified values.
4.6 Model Validation and Cross-Index Comparison
Establishing the empirical reliability of the Fuzzy TASC model necessitated a benchmarking process against international metrics, specifically the Global AgeWatch Index and OECD Long-Term Care Performance Indicators. Our findings exhibit high consistency with these benchmarks; specifically, the top-tier rankings of Germany and Japan align with their established leadership in the “Health Status” and “Enabling Environment” domains. Similarly, the performance trajectories projected for Estonia and Portugal under advanced digital scenarios correspond with national strategic priorities documented in recent OECD reports, which emphasize ICT integration as a core solution for workforce shortages.
To address the reviewer’s request for stability validation, we leveraged sensitivity testing on veto parameters and Monte Carlo simulations. By introducing controlled perturbations and adjusting fuzzy bandwidths (e.g., v
This study developed and validated an integrated multi-layer evaluation framework—TASC (Trade-Off-Aware Scoring with Conflicts)—for assessing Smart Long-Term Care (Smart LTC) system performance under digital transformation scenarios. Unlike conventional composite indicators that treat all dimensions as fully compensatory, TASC explicitly distinguishes between performance, threshold compliance, and trade-off penalties, enabling a more realistic representation of structural imbalances in complex welfare systems. The analysis was conducted using 12 OECD countries, with five key indicators: cost per 65+ beneficiary, LTC workforce density, ICT penetration, coverage ratio, and the Longevity–Dependency ratio (LDR). The baseline scenario represents conventional cloud-based LTC systems, while three Smart LTC configurations—AI+IoT, AI+Edge, and AI+Blockchain—capture progressive stages of digital convergence.
The results reveal that Germany and Japan lead the evaluation, with Germany excelling in the baseline equilibrium and Japan demonstrating superior resilience across all AI-enhanced configurations. This success stems from a balanced structure between cost, workforce, and digital infrastructure. Nations such as Estonia and Portugal exhibit strong adaptability, showing significant improvement under higher levels of digital integration. In contrast, several systems show vulnerability to intensified cost–workforce trade-offs, reflecting the uneven benefits of smart technologies. Importantly, the sharp decline in pairwise trade-off thresholds γ (1, 2) from 0.9445 (baseline) to 0.4634 (Edge) and 0.2887 (Blockchain) quantifies the increasing structural conflict. This finding is central to TASC: it evidences that digital intensification amplifies structural tensions rather than uniformly improving system performance, thus necessitating conflict-aware policy design.
In practice, the Smart LTC application offers three direct policy insights. First, TASC serves as a policy sandbox tool, enabling decision-makers to anticipate the non-linear risks of new investments. Second, the findings demonstrate that technological adoption does not guarantee systemic gain; for instance, edge computing yields strong efficiency for digitally mature systems but severely penalizes cost-intensive structures, while Blockchain integration stabilizes governance with modest performance improvement. Third, TASC’s robustness analysis highlights that decisions should prioritize stability over peak performance. The necessity of balanced co-evolution between human and digital resources is therefore paramount, shifting the focus from maximizing isolated technical metrics to managing the equilibrium and resilience of the overall welfare system. While this study provides a robust cross-sectional evaluation using a 9-year longitudinal average, future research could extend this framework by exploring dynamic MCDM approaches. Such advancements would allow for the integration of real-time data streams to monitor the evolving temporal trajectories of Smart LTC sustainability as digital technologies mature further.
Acknowledgement: None.
Funding Statement: The authors received no specific funding for this study.
Author Contributions: The authors confirm contribution to the paper as follows: Conceptualization, Kuen-Suan Chen, Tsai-Sung Lin and Ruey-Chyn Tsaur; methodology, Tsai-Sung Lin and Minh T. N. Nguyen; software, Tsai-Sung Lin and Minh T. N. Nguyen; validation, Kuen-Suan Chen, Minh T. N. Nguyen and Ruey-Chyn Tsaur; formal analysis, Tsai-Sung Lin and Minh T. N. Nguyen; investigation, Minh T. N. Nguyen; resources, Kuen-Suan Chen and Ruey-Chyn Tsaur; data curation, Kuen-Suan Chen and Ruey-Chyn Tsaur; writing—original draft preparation, Kuen-Suan Chen, Tsai-Sung Lin and Ruey-Chyn Tsaur; writing—review and editing, Kuen-Suan Chen and Ruey-Chyn Tsaur. All authors reviewed and approved the final version of the manuscript.
Availability of Data and Materials: The data supporting the findings of this study are available within the article and its Appendix A.
Ethics Approval: Not applicable.
Conflicts of Interest: The authors declare no conflicts of interest.
References
1. United Nations Department of Economic and Social Affairs. World population Ageing 2023. New York, NY, USA: United Nations; 2024 [cited 2026 Jan 13]. Available from: https://www.un.org/development/desa/pd/sites/www.un.org.development.desa.pd/files/undesa_pd_2024_wpa2023-report.pdf. [Google Scholar]
2. World Health Organization. World report on ageing and health. Geneva, Switzerland: World Health Organization; 2015 [cited 2026 Jan 13]. Available from: https://iris.who.int/handle/10665/186463. [Google Scholar]
3. Qian K, Zhang Z, Yamamoto Y, Schuller BW. Artificial intelligence Internet of Things for the elderly: from assisted living to health-care monitoring. IEEE Signal Process Mag. 2021;38(4):78–88. doi:10.1109/MSP.2021.3057298. [Google Scholar] [CrossRef]
4. Adere EM. Blockchain in healthcare and IoT: a systematic literature review. Array. 2022;14(9):100139. doi:10.1016/j.array.2022.100139. [Google Scholar] [CrossRef]
5. Mazhar T, Khan S, Shahzad T, Khan MA, Saeed MM, Awotunde JB, et al. Generative AI, IoT, and blockchain in healthcare: application, issues, and solutions. Discov Internet Things. 2025;5(1):5. doi:10.1007/s43926-025-00095-8. [Google Scholar] [CrossRef]
6. Karar ME, Shehata HI, Reyad O. A survey of IoT-based fall detection for aiding elderly care: sensors, methods, challenges and future trends. Appl Sci. 2022;12(7):3276. doi:10.3390/app12073276. [Google Scholar] [CrossRef]
7. Subhan F, Mirza A, Bin Mohd Su’ud M, Alam MM, Nisar S, Habib U, et al. AI-enabled wearable medical Internet of Things in healthcare system: a survey. Appl Sci. 2023;13(3):1394. doi:10.3390/app13031394. [Google Scholar] [CrossRef]
8. Aljohani A. AI-Driven decision-making for personalized elderly care: a fuzzy MCDM-based framework for enhancing treatment recommendations. BMC Med Inform Decis Mak. 2025;25(1):119. doi:10.1186/s12911-025-02953-5. [Google Scholar] [PubMed] [CrossRef]
9. Shirvanian N, Shams M, Masoud Rahmani A, Lansky J, Mildeova S, Hosseinzadeh M. The Internet of Things in elderly healthcare applications: a systematic review and future directions. IEEE Access. 2025;13(13):71335–73. doi:10.1109/ACCESS.2025.3562147. [Google Scholar] [CrossRef]
10. Cuevas-Chávez A, Hernández Y, Ortiz-Hernandez J, Sánchez-Jiménez E, Ochoa-Ruiz G, Pérez J, et al. A systematic review of machine learning and IoT applied to the prediction and monitoring of cardiovascular diseases. Healthcare. 2023;11(16):2240. doi:10.3390/healthcare11162240. [Google Scholar] [PubMed] [CrossRef]
11. Junaid SB, Imam AA, Balogun AO, De Silva LC, Surakat YA, Kumar G, et al. Recent advancements in emerging technologies for healthcare management systems: a survey. Healthcare. 2022;10(10):1940. doi:10.3390/healthcare10101940. [Google Scholar] [PubMed] [CrossRef]
12. Masood I, Daud A, Wang Y, Banjar A, Alharbey R. A blockchain-based system for patient data privacy and security. Multimed Tools Appl. 2024;83(21):60443–67. doi:10.1007/s11042-023-17941-y. [Google Scholar] [CrossRef]
13. Mendoza-Tello JC, Males-Anagumbla AI, Gualoto-Alvaro WG. A blockchain-based functional approach for geriatric electronic health record. CyS. 2024;28(4):1715–25. doi:10.13053/cys-28-4-4504. [Google Scholar] [CrossRef]
14. Luo J, Zhang R, Xu J, Pan Y. Positive strategies for enhancing elderly interaction experience in smart healthcare through optimized design methods: an INPD-based research approach. Sustainability. 2024;16(20):8770. doi:10.3390/su16208770. [Google Scholar] [CrossRef]
15. Saad M, Nabeel M, Ayedh M. A fuzzy programming-based framework for enhancing cybersecurity in healthcare systems under uncertain environments. Risk Assess Manag Decis. 2025 Mar 21;2(1):38–47. doi:10.48314/ramd.v2i1.58. [Google Scholar] [CrossRef]
16. Shi J, Zhang N, Wu K, Wang Z. Application status, challenges, and development prospects of smart technologies in home-based elder care. Electronics. 2025;14(12):2463. doi:10.3390/electronics14122463. [Google Scholar] [CrossRef]
17. AIAI. Integrating smart technologies into long-term care services: building a new era of digital care. AIAI Report; 2022 [cited 2026 Jan 13]. Available from: https://aiai.org.tw/active/report/111/111_08_41.pdf. [Google Scholar]
18. Azzini I, Munda G. Sensitivity and robustness analyses in social multi-criteria evaluation of public policies. J Multi Criteria Decis Anal. 2025;32(1):e70006. doi:10.1002/mcda.70006. [Google Scholar] [CrossRef]
19. Ferdous J, Bensebaa F, Milani AS, Hewage K, Bhowmik P, Pelletier N. Development of a generic decision tree for the integration of multi-criteria decision-making (MCDM) and multi-objective optimization (MOO) methods under uncertainty to facilitate sustainability assessment: a methodical review. Sustainability. 2024;16(7):2684. doi:10.3390/su16072684. [Google Scholar] [CrossRef]
20. Hwang CL, Yoon K. Multiple attribute decision making. Berlin/Heidelberg, Germany: Springer; 1981. doi:10.1007/978-3-642-48318-9. [Google Scholar] [CrossRef]
21. Zavadskas EK, Turskis Z. Multiple criteria decision making (MCDM) methods in economics: an overview (daugiatiksliai sprendimų priėmimo metodai ekonomikoje: apžvalga). Technol Econ Dev Econ. 2011;17(2):397–427. doi:10.3846/20294913.2011.593291. [Google Scholar] [CrossRef]
22. Hassanain AA, Eldosoky MAA, Soliman AM. Healthcare facilities redesign using multicriteria decision-making: fuzzy TOPSIS and graph heuristic theories. J Healthc Eng. 2023;2023(1):9648510. doi:10.1155/2023/9648510. [Google Scholar] [PubMed] [CrossRef]
23. Wang G, Shao Q. Design of a smart medical service quality evaluation system based on a hybrid multi-criteria decision model. Sci Rep. 2024;14(1):26407. doi:10.1038/s41598-024-71224-6. [Google Scholar] [PubMed] [CrossRef]
24. Ashour M, Mahdiyar A. A comprehensive state-of-the-art survey on the recent modified and hybrid analytic hierarchy process approaches. Appl Soft Comput. 2024;150(1):111014. doi:10.1016/j.asoc.2023.111014. [Google Scholar] [CrossRef]
25. Vishwakarma LP, Singh RK, Mishra R, Kumari A. Application of artificial intelligence for resilient and sustainable healthcare system: systematic literature review and future research directions. Int J Prod Res. 2025;63(2):822–44. doi:10.1080/00207543.2023.2188101. [Google Scholar] [CrossRef]
26. Singh MB, Singh H, Pratap A. Energy-efficient and privacy-preserving blockchain based federated learning for smart healthcare system. IEEE Trans Serv Comput. 2023;17(5):2392–403. doi:10.1109/tsc.2023.3332955. [Google Scholar] [CrossRef]
27. Diakoulaki D, Mavrotas G, Papayannakis L. Determining objective weights in multiple criteria problems: the critic method. Comput Oper Res. 1995;22(7):763–70. doi:10.1016/0305-0548(94)00059-H. [Google Scholar] [CrossRef]
Cite This Article
 Copyright © 2026 The Author(s). Published by Tech Science Press.
This work is licensed under a Creative Commons Attribution 4.0 International License , which permits unrestricted use, distribution, and reproduction in any medium, provided the original work is properly cited.
 Downloads
 Citation Tools