
 Login
Login Register
 Submit a Paper
 Propose a Special lssue
 Open Access
ARTICLE
Interpretable AI for Non-Destructive Prediction of Electrode Properties from Frequency-Domain Ultrasonic Signals
Businesses Informatics College, University of Information Technology and Communications, Baghdad, Iraq
* Corresponding Author: Wasnaa Kadhim Jawad. Email:
Computers, Materials & Continua 2026, 89(2), 18 https://doi.org/10.32604/cmc.2026.084636
Received 04 May 2026; Accepted 24 July 2026; Issue published 15 September 2026
 View Full Text
 Download PDF
Abstract
The accuracy of the electrode properties is important in the lithium-ion battery manufacturing process because the thickness variation is a direct influence on the compaction and structural uniformity, transport behavior and overall manufacturing quality. Of the different types of monitoring, ultrasonic frequency-domain relies on a non-destructive pathway for quality evaluation in a process-aware manner and is a promising approach; but, interpretable predictive modeling has been limited at the electrode level. In this study, an open-access database of ultrasonic frequency-domain data of lithium-ion battery electrodes under coating and calendering conditions was used to develop an artificial intelligence (AI) framework for predicting electrode thickness. The data set consisted of two subsets (anode and cathode) each of which included metadata, frequency bins and the associated magnitudes in a spectrum. It involved a combination of preprocessing, feature preparation, Stochastic Gradient Descent optimization of the Deep Neural Network (DNN) training process, and Shapley Additive Explanations (SHAP) for the post hoc analysis of the feature importances. To accommodate differences between the data sets, process variables, and spectral behavior, separate models were created for the anode and cathode sets. The results reported that the proposed framework has a good performance for the anode dataset, where the model got a mean absolute error of 9.530, root mean square error of 16.649, and coefficient of determination of 0.824. The values suggest that the model had a good predictive power on the relationship between ultrasonic frequency-domain input and electrode thickness. The interpretation stage also showed that the presence of certain components of the mid- and high-frequency spectra were important for the prediction of the anode, indicating a relationship between the acoustic response and the variations of material state caused by the manufacturing process. Furthermore, the overall dataset analysis revealed unique distribution in anode and cathode thickness, behavior under calendering state, and spectral-response patterns. The signals of the ultrasonic frequency domain can be effectively combined with deep learning and explainable AI to assist in interpretable thickness prediction, it was concluded. The proposed framework presents an excellent computational tool for non-destructive quality monitoring and intelligent manufacturing control in the production of advanced batteries.Keywords
The rapid expansion of electrification technologies has intensified the need for advanced lithium-ion battery systems with high energy density, long cycle life, and stable electrochemical performance [1–3]. Achieving these requirements depends not only on electrode chemistry, but also on precise manufacturing control across the full production chain. In modern battery manufacturing, even small deviations in material distribution, porosity, coating uniformity, and structural compaction can propagate into significant variations in capacity retention, internal resistance, thermal behavior, and safety [4–6]. As a result, manufacturing science has increasingly focused on data-related quality control, in-line sensors and smart monitoring to minimize waste, ensure product quality, and enable scale-up of large-scale production. In this respect, linking sensing, signal processing and machine learning has become an important avenue to enhance process transparency and improve our understanding of complex manufacturing processes.
Coating and calendering are crucial steps in the production of battery electrodes, as they define the thickness, density and microstructure of the resulting electrodes [7,8]. These factors influence the structure and pathways for ionic and electronic transport, mechanical stability, and ultimately battery performance, and must be well characterized to optimize the process [9,10]. Traditional offline measurements can be informative, but they are typically slow, destructive, and not suitable for real-time industrial applications. As such, non-destructive ultrasonic measurements have emerged as a potential tool for monitoring as they are sensitive to structural alterations and variations in the state of materials. When represented in the frequency domain, ultrasonic signals can reveal characteristic patterns associated with electrode condition and process-induced transformations, thereby offering a valuable basis for computational modeling, predictive analysis, and interpretable quality assessment in battery electrode manufacturing.
The study provides an overview in Table 1 of recent important works on monitoring battery manufacturing, ultrasonic property characterization, and quality assessment using machine learning, highlighting their limitations. As indicated, recent studies have demonstrated the following significant advances: ultrasonic sensing, transfer learning, digital manufacturing, virtual quality gates, and non-destructive defect applications. Yet, several limitations remain in the studies, including a lack of direct research focus on interpretable thickness prediction, the predominance of review articles, limited data validation at the battery-electrode scale using ultrasonic frequency-domain data, and inadequate incorporation of interpretability into predictive models. These shortcomings suggest that there remains a need for a more designed and explainable computational framework to evaluate battery electrode thickness.
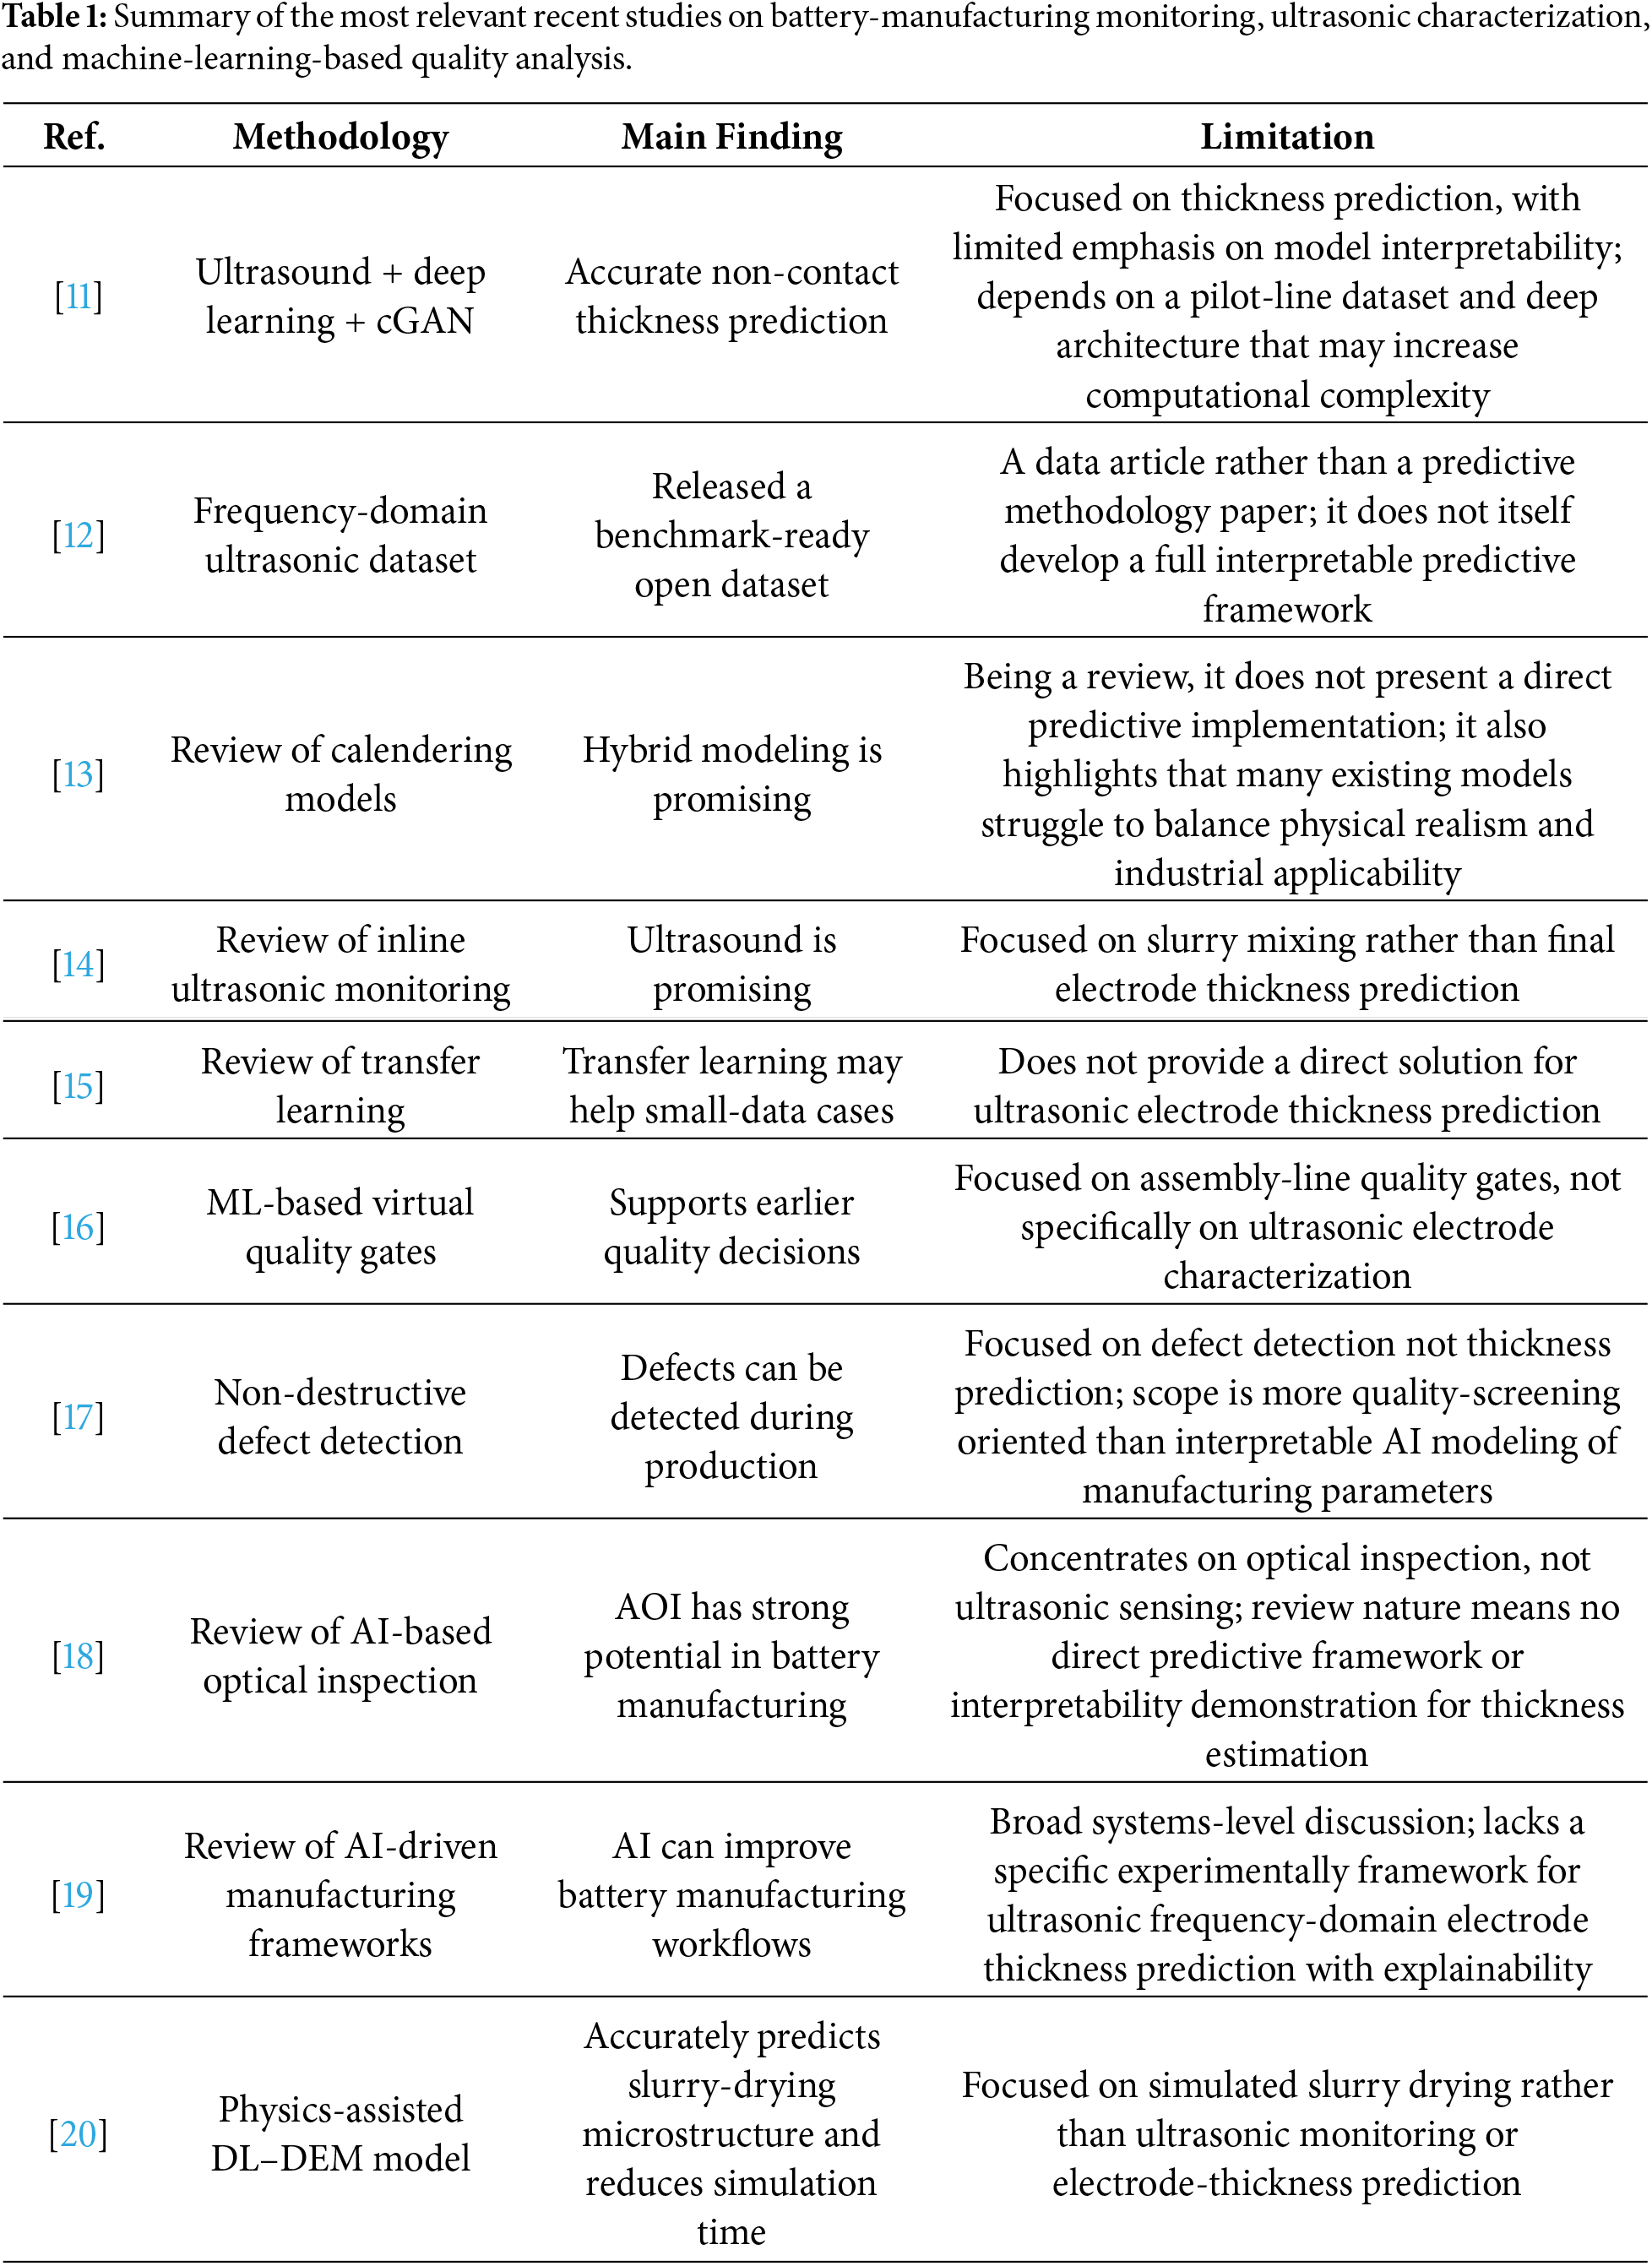
Despite the growing body of work on battery-manufacturing monitoring, important research gaps remain at the electrode level. While prior research has primarily focused on general quality, defect prediction, discussion, and highly specific deep learning tools, relatively few studies have explored explainable thickness prediction based on ultrasonic frequency features related to coating and calendering states. Specifically, the integration of ultrasonic frequency variables at the level of the electrode, process-related metadata, deep neural prediction, and post hoc explanation has not been sufficiently explored. This highlights the need for a computational approach that not only accurately predicts the electrode thickness, but also explains which spectral and process variables play a significant role in the prediction. The main contributions of this work are summarized as follows:
• A frequency-domain ultrasonic learning framework is established for non-destructive prediction of lithium-ion battery electrode thickness.
• Separate DNN-SGD models are developed for anode and cathode datasets to reflect electrode-specific signal behavior and process variables.
• SHAP interpretation is used to reveal the key spectral and manufacturing features influencing the predicted thickness.
The remainder of this manuscript is organized as follows. Section 2 presents the experimental work and describes the dataset source, structure, and main variables. Section 3 introduces the artificial intelligence approach, including the DNN-SGD prediction framework and the explainability stage. Section 4 provides the results and discussion, covering model performance, predictive behavior, and feature-importance interpretation. Finally, Section 5 concludes the manuscript and summarizes the main findings.
The data set utilized in this work is taken from [12] which is an open-access ultrasonic frequency-domain data set covering the lithium-ion battery electrode coated and calendered specimen. The main features of the dataset used in this work from [12] are presented in Table 2. The data is currently presented in two separate sets: anode and cathode, with different numbers of samples, metadata, and FFT length, so it is assumed that they belong to two different sets, but are related. The data is stored in JSON format both as frequency domain signatures of ultrasound and as process cognition-aware metadata that enables the connection between the characteristics and features of the ultrasound signals and manufacturing knowledge. Such features allow the data to be used for data-driven thickness prediction and also enable a more insightful examination of potential differences between process conditions, ultrasonic response, and electrode types.
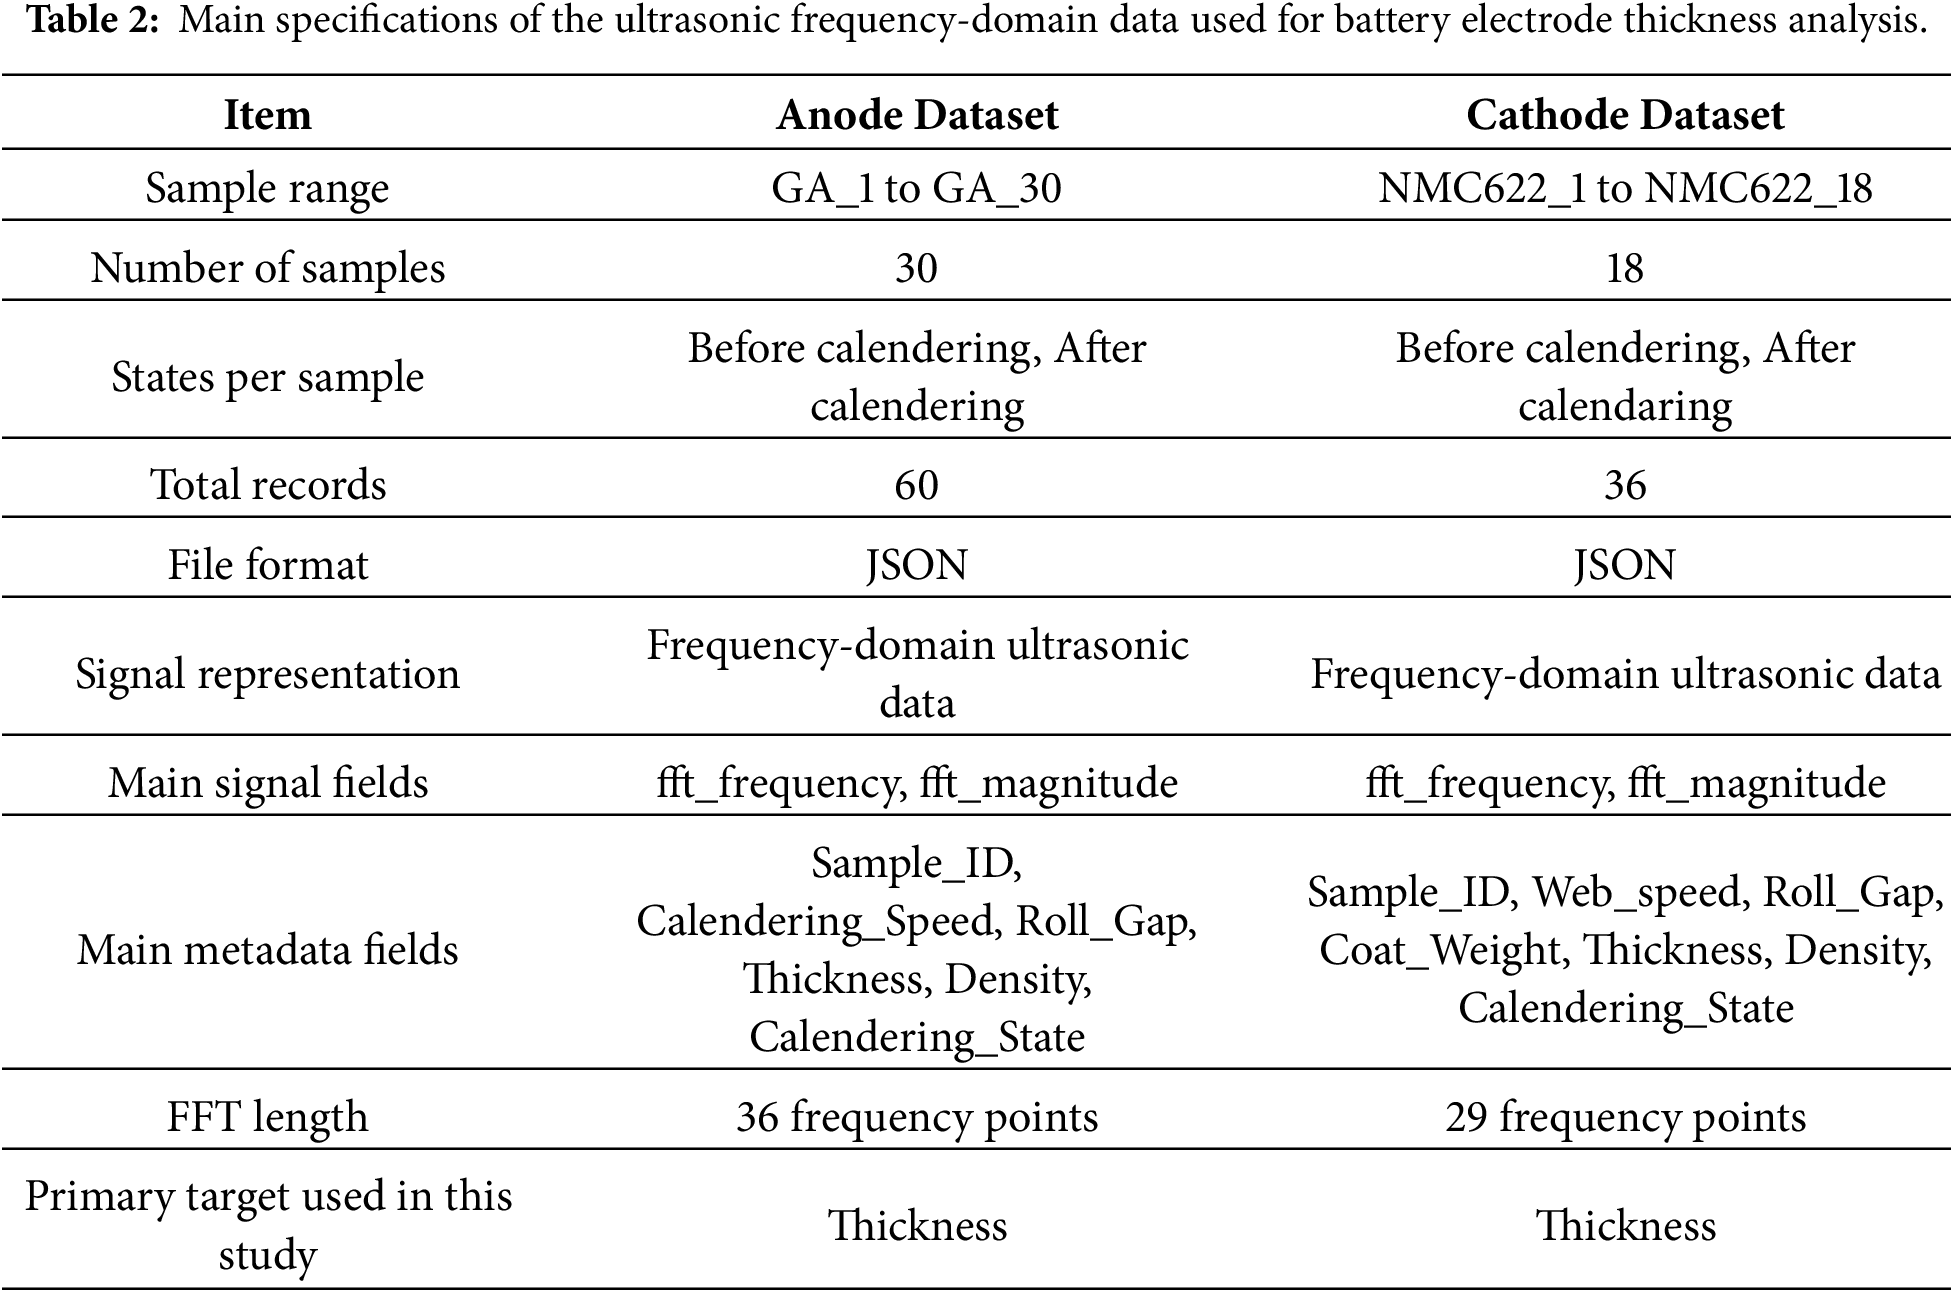
Fig. 1 presents a visual overview of the dataset structure, contents, and role in the present study. As shown, the dataset is composed of separate anode and cathode subsets, comprising 60 and 36 records, respectively, for a total of 96 usable records. Each sample state is stored in JSON format and contains three main components: metadata, fft_frequency, and fft_magnitude. The figure also highlights the main process-related and physical variables associated with the electrode manufacturing stages, including roll gap, speed or web speed, coat weight, thickness, and density. In addition, it summarizes how the dataset was used in this study, where frequency-domain features were processed through the DNN-SGD framework and subsequently interpreted using SHAP-based analysis for thickness prediction.
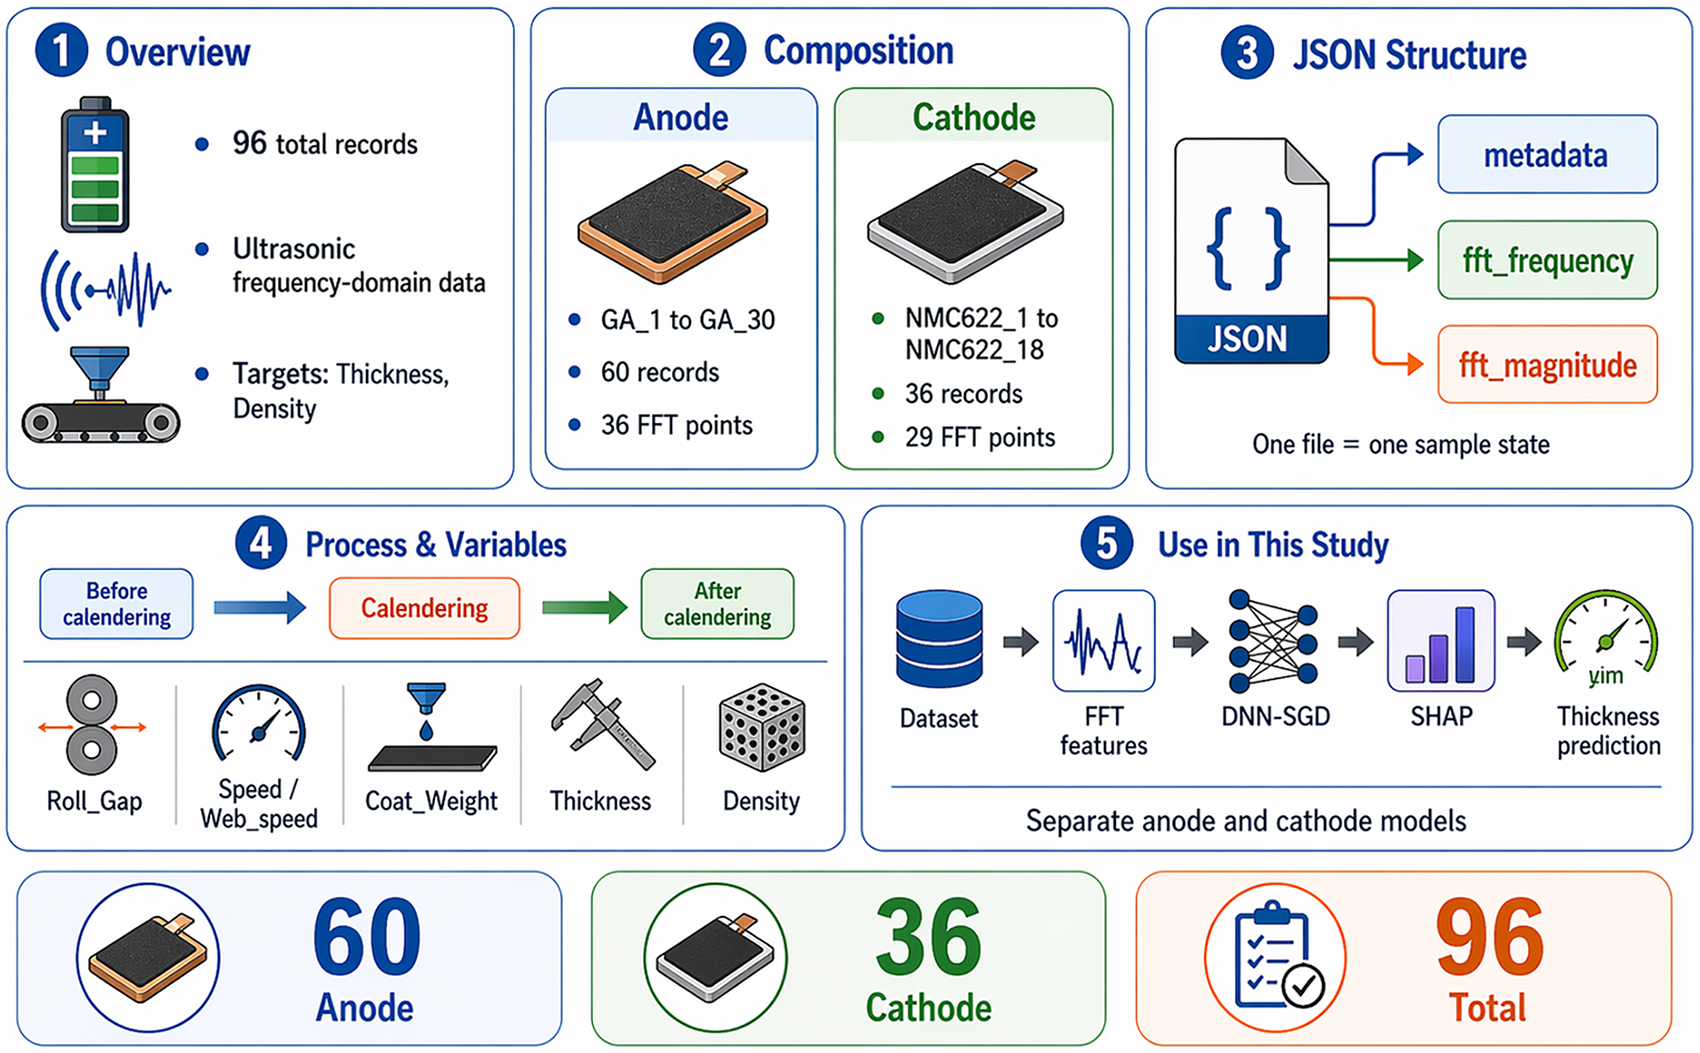
Figure 1: Overview of the ultrasonic frequency-domain dataset for lithium-ion battery electrodes.
Section 3 presents the methodology adopted for the artificial intelligence stage of this work. It describes the preprocessing of the ultrasonic frequency-domain dataset, the feature preparation strategy, the development of the DNN-SGD model for thickness prediction, the validation procedure used for the anode and cathode subsets, and the SHAP-based interpretation approach applied to explain the contribution of the most influential input features.
Artificial intelligence has become widely used across diverse applications, including healthcare, finance, autonomous systems, manufacturing, image analysis, and predictive decision support, because of its ability to learn complex relationships from data and improve analytical performance [21–24]. Machine learning is part of this AI methodology in various fields of interest [25,26]. In materials-related fields, AI has been increasingly applied for property prediction, process optimization, defect detection, microstructure analysis, and intelligent quality monitoring [27–30]. DNNs can capture nonlinear high-dimensional patterns; their general forward propagation form is:
with
where:
•
•
•
•
•
•
This is the main structural equation for the DNN.
3.2 Stochastic Gradient Descent (SGD)
The standard SGD weight-update rule is [31]:
where
•
•
•
•
•
This is the main optimization equation for SGD.
For a DNN trained by SGD for regression, the combined loss-minimization form can be written as:
and the parameters are updated by:
where:
•
•
•
•
•
•
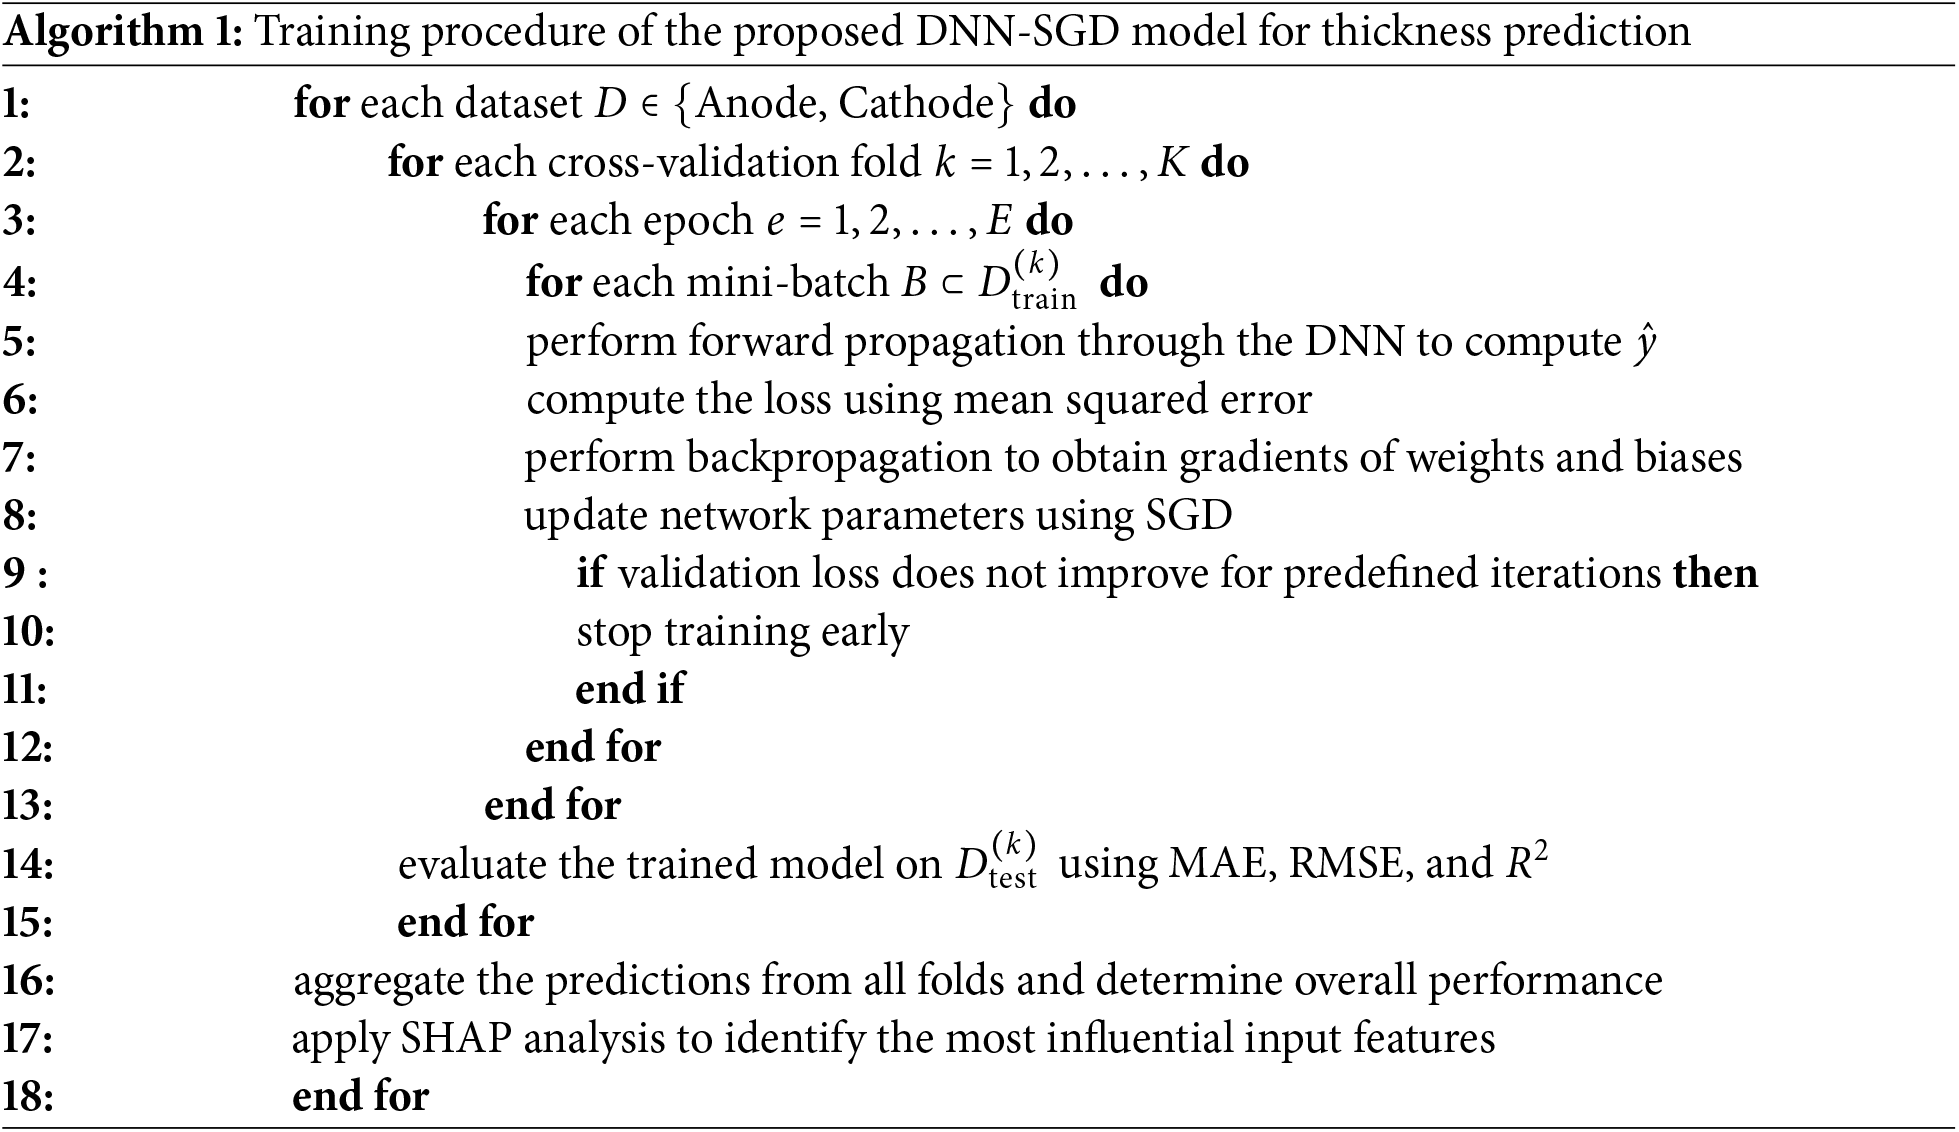
Algorithm 1 summarizes the overall training and evaluation procedure of the proposed DNN-SGD framework for thickness prediction. As shown, the process was conducted separately for the anode and cathode datasets and involved cross-validation-based training, iterative weight updating through stochastic gradient descent, early stopping based on validation behavior, performance assessment using MAE, RMSE, and R2, and a final SHAP-based interpretation stage to determine the most influential input features.
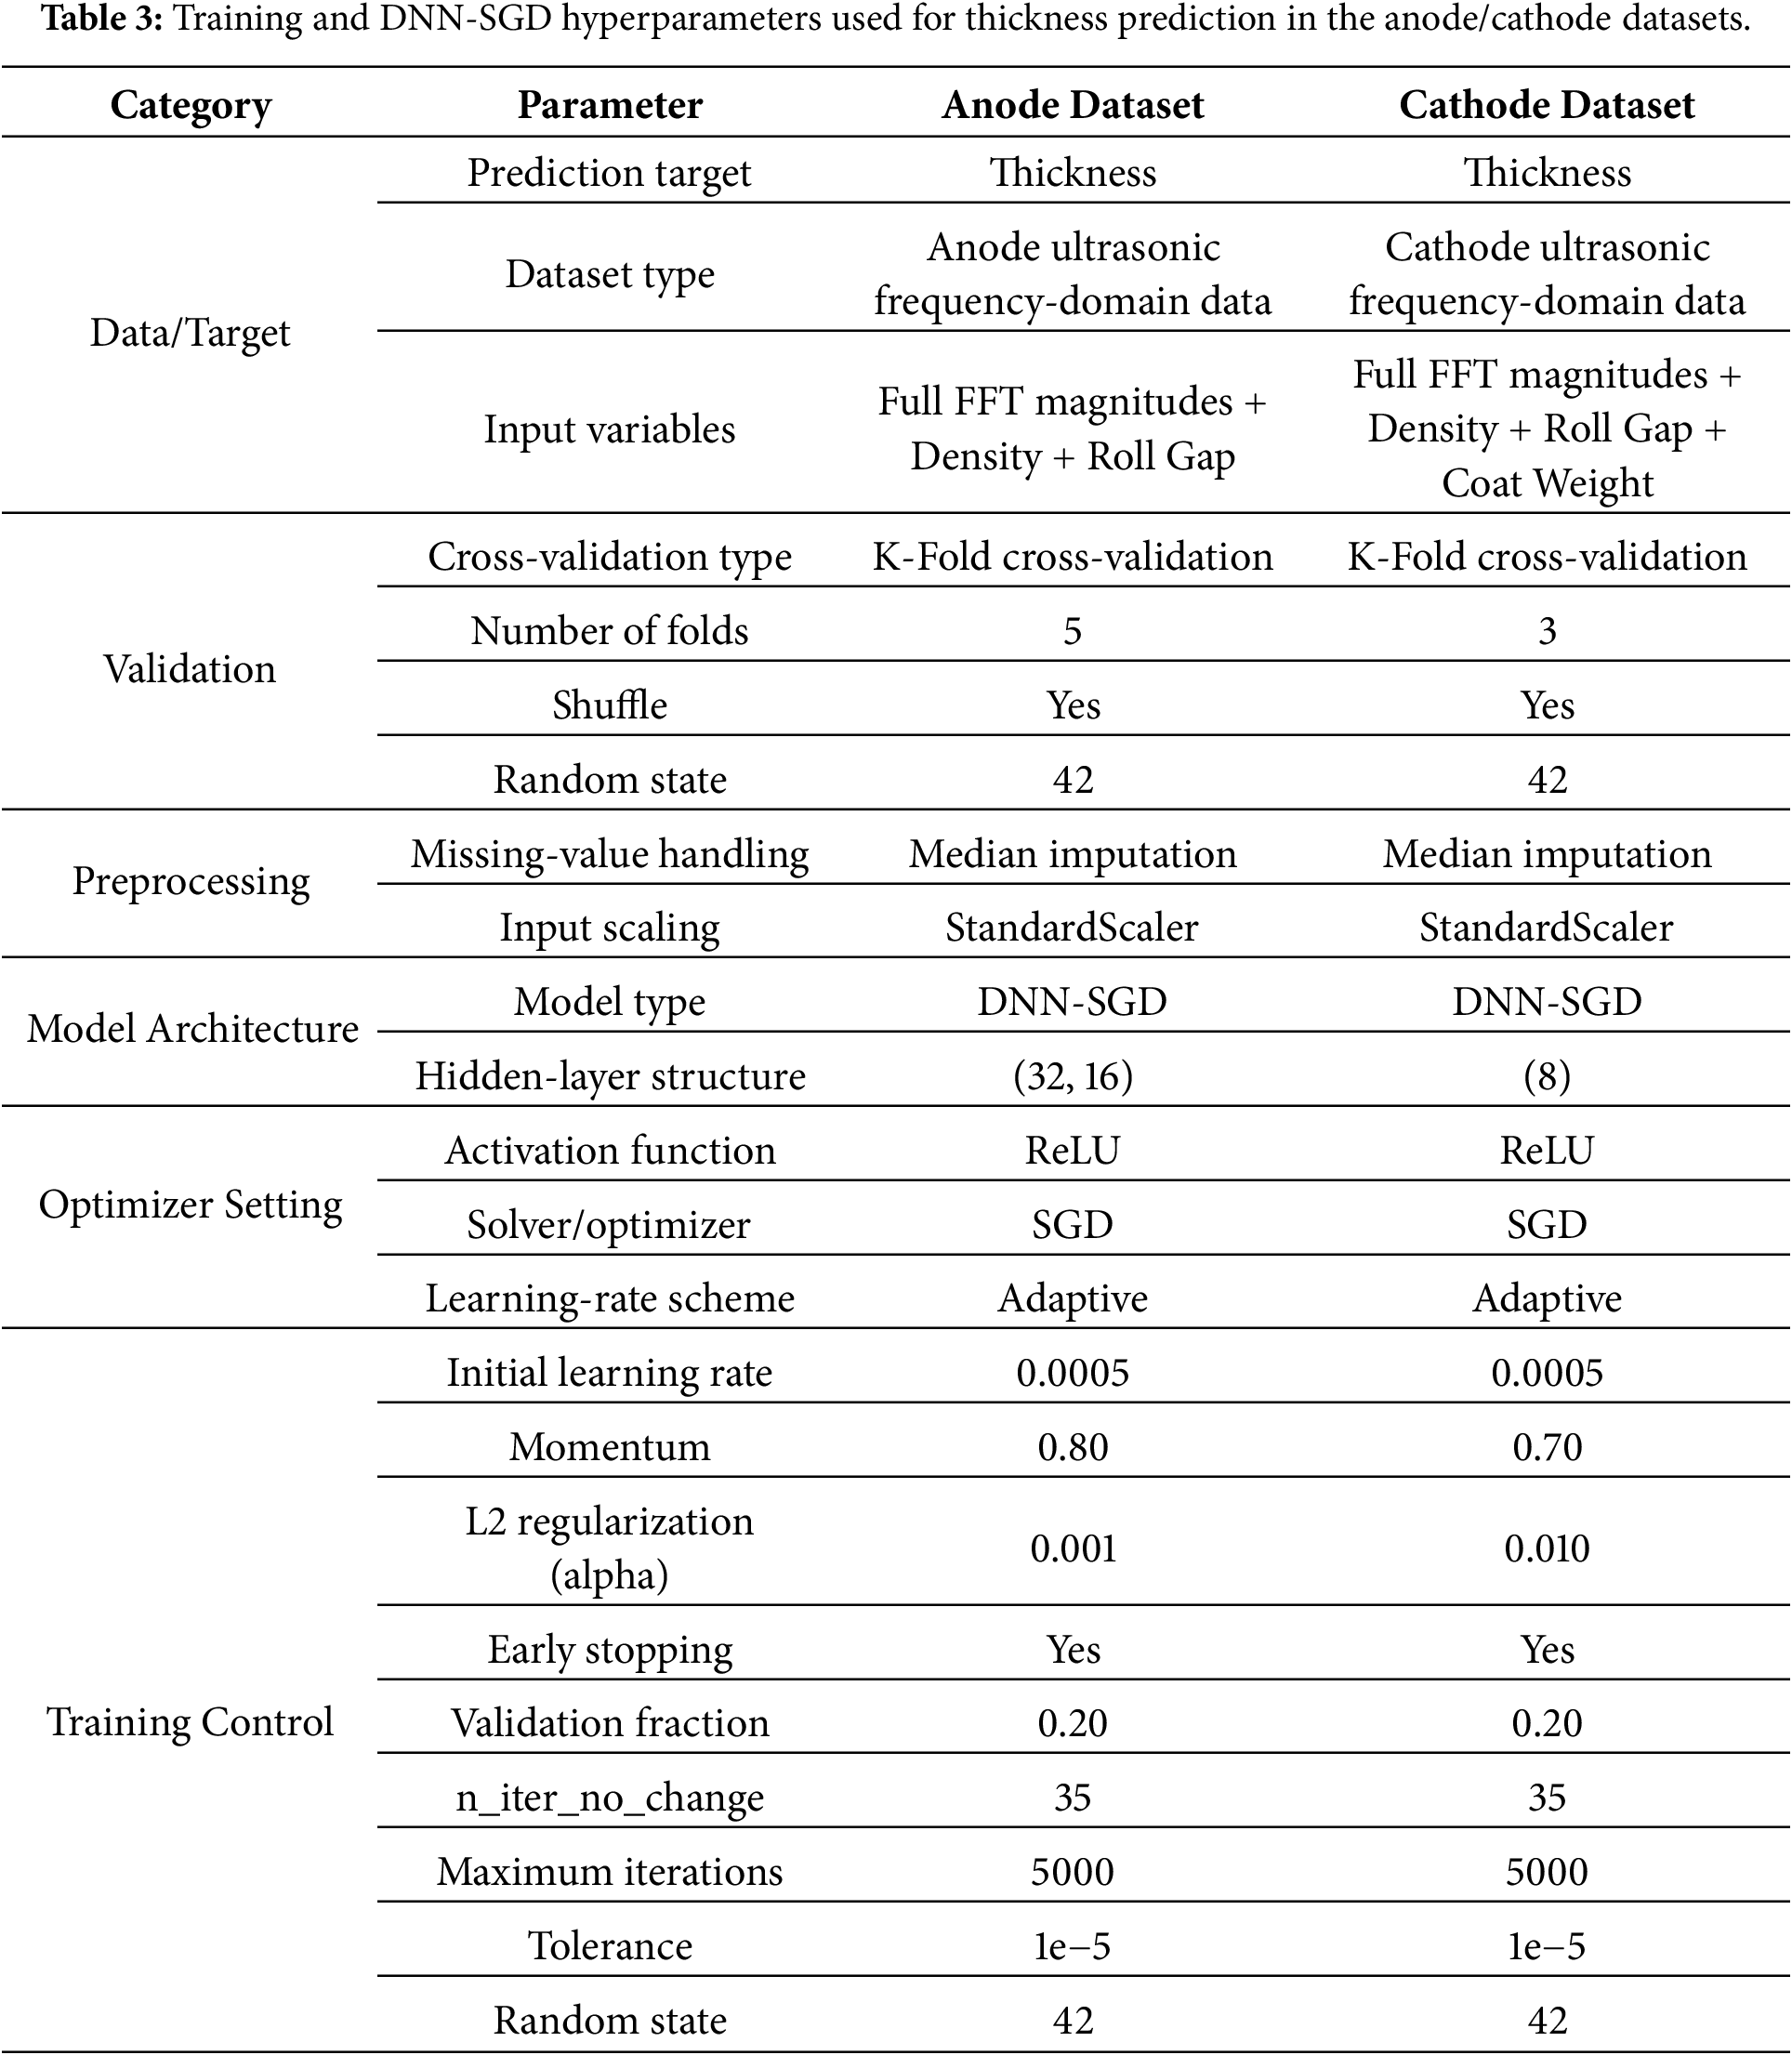
With a relatively small dataset of only about one hundred instances, due to the high-dimensional and nonlinear nature of the ultrasonic frequency-domain features, regularization, early stopping, cross validation and comparisons with baseline (Other models) were used to minimize risk of overfitting and to objectively assess the value of the proposed model. The dataset specific preprocessing related to the dataset, the validation settings, the network architecture, the training-control parameters, and the optimizer configuration used in the proposed DNN-SGD framework are summarized in Table 3.
3.4 SHAP (Shapley Additive Explanations)
SHAP (Shapley Additive Explanations) has become a widely adopted explainable artificial intelligence technique for interpreting complex machine-learning models by quantifying the contribution of each input feature to the final prediction outcome. The SHAP explanation model is:
and the Shapley value for feature
where:
•
•
•
•
•
•
•
•
The flow chart of the methodology used in this work for attribute interpretation of the battery electrode thickness is shown in Fig. 2. This workflow involves inputting the anode and cathode datasets, followed by the JSON data engine for data parsing, metadata, fft_frequency, and fft_magnitude extraction. The data are then separated, parsed, preprocessed, and used to train the DNN-SGD model. The network models are then assessed using MAE, RMSE, and R2, followed by model interpretation using SHAP to determine the most significant features for the battery thickness prediction.
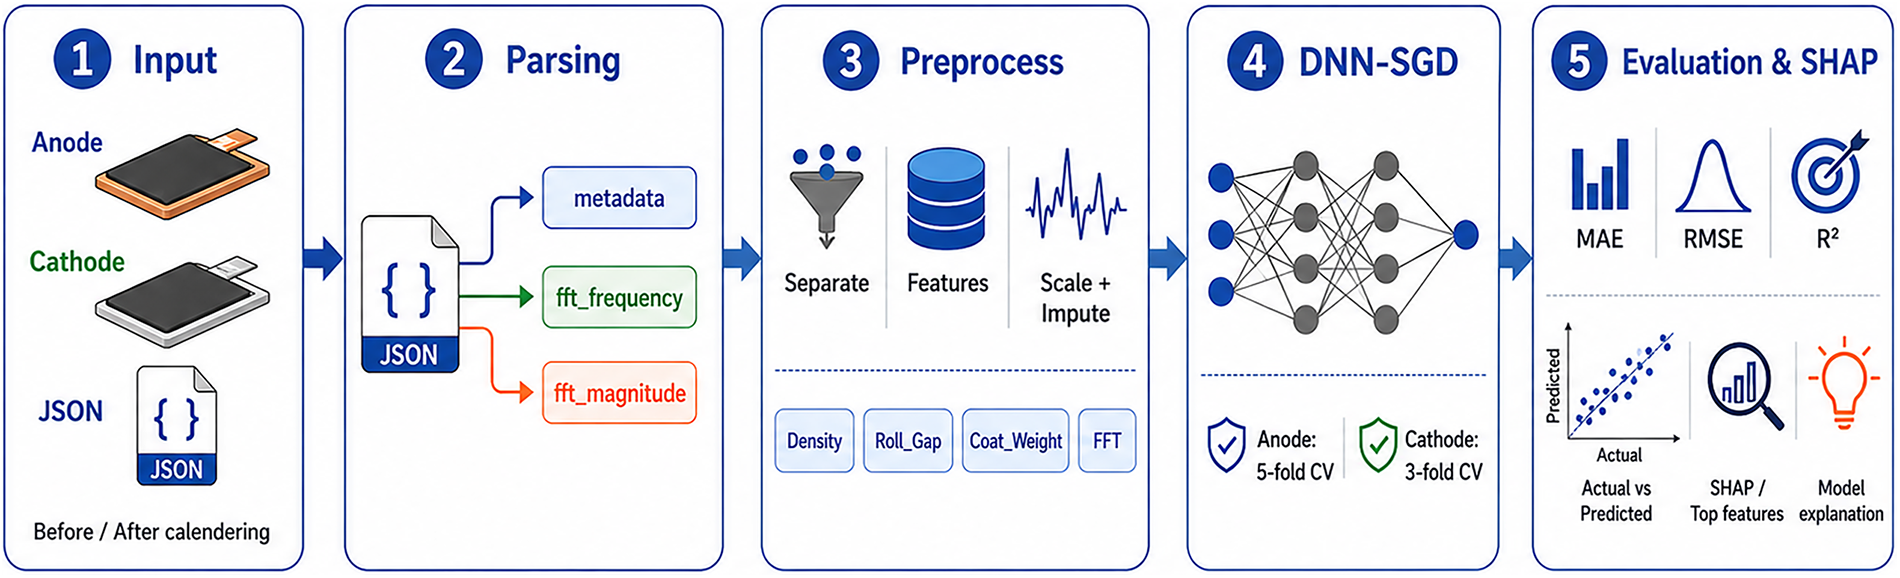
Figure 2: Workflow of data processing, thickness prediction, and SHAP-based interpretation.
This section presents the predictive results and their interpretation by examining the statistical behavior of the target variable and the performance of the DNN-SGD framework for the anode and cathode datasets.
4.1 Experimental Results Visualization
Fig. 3 illustrates the thickness distributions of both electrode datasets and provides an initial view of the variability that the prediction model must learn. As shown, the two subsets also have different spread and concentration patterns, supporting the idea that they are different modeling problems during both training and evaluation. As seen in Fig. 3a, the thickness of the anodes falls into a relatively wide range, from about 30 to 170, and there is a notable cluster around the middle range of 80–110. Additional observations can be distinguished in the gaps between 40 and 60, 110 and 130, and 140 and 160, indicating wider variation and a more spread-out target structure in the anode dataset. This wider spread indicates a more difficult regression space as the model needs to cover thickness behavior in low, medium, and high ranges as opposed to just around a central narrow band. Fig. 3b, on the other hand, shows that the thickness of the cathode is restricted to around 50–100, with the maximum thickness occurring around 88–90. The distribution of cathodes is narrower than the anode distribution, and there are recognizable values around 60–80, as well as a few at 95–100. The narrower cathode thickness distribution suggests stronger local prediction sensitivity, while Fig. 4 confirms that calendering reduces thickness in both electrode datasets.
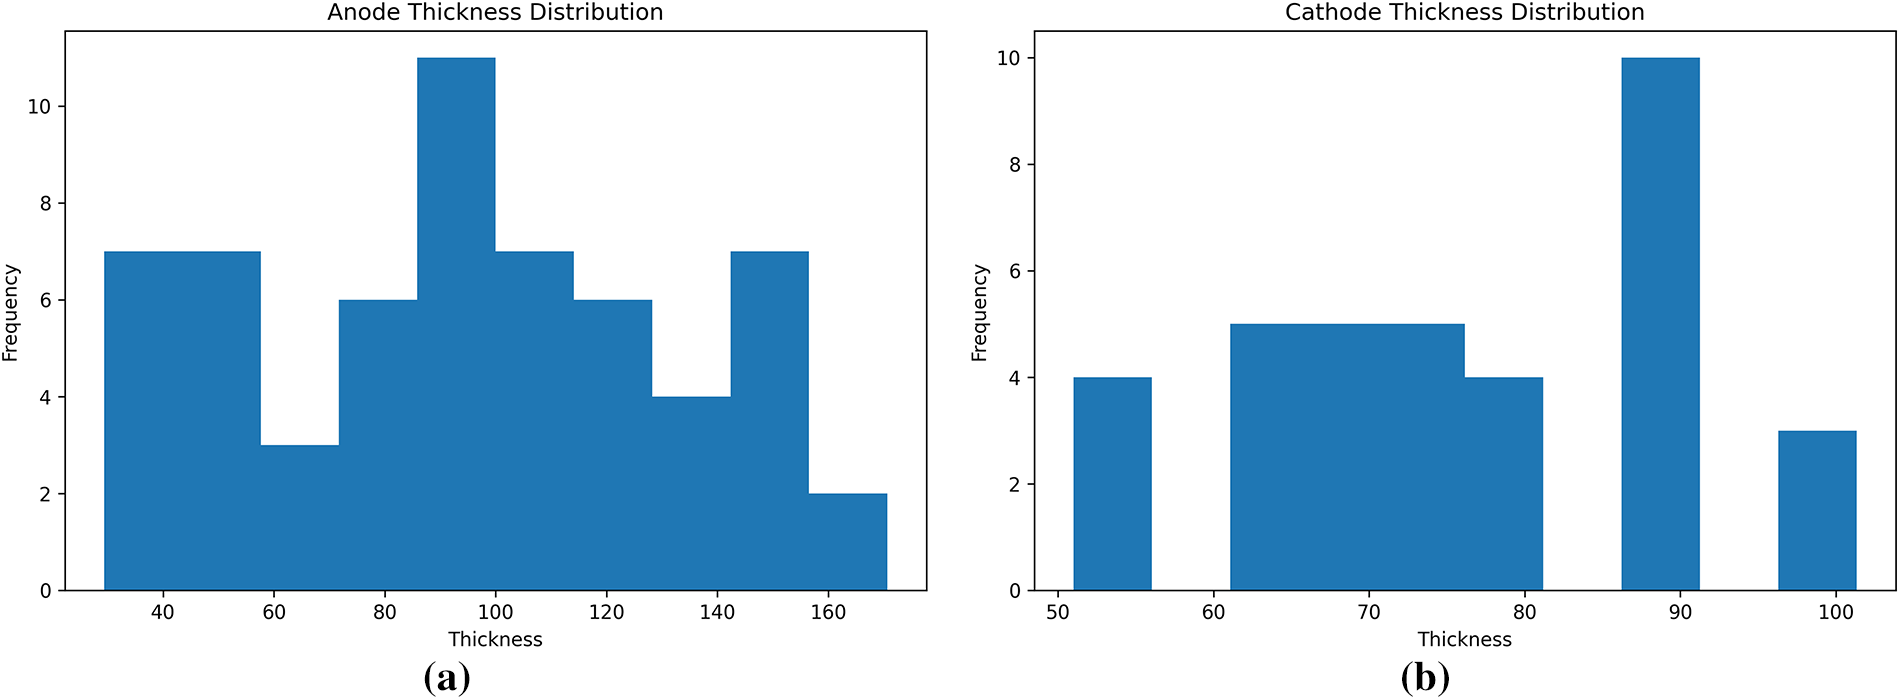
Figure 3: Thickness distribution of the battery electrode datasets used in this study: (a) anode thickness distribution; (b) cathode thickness distribution.
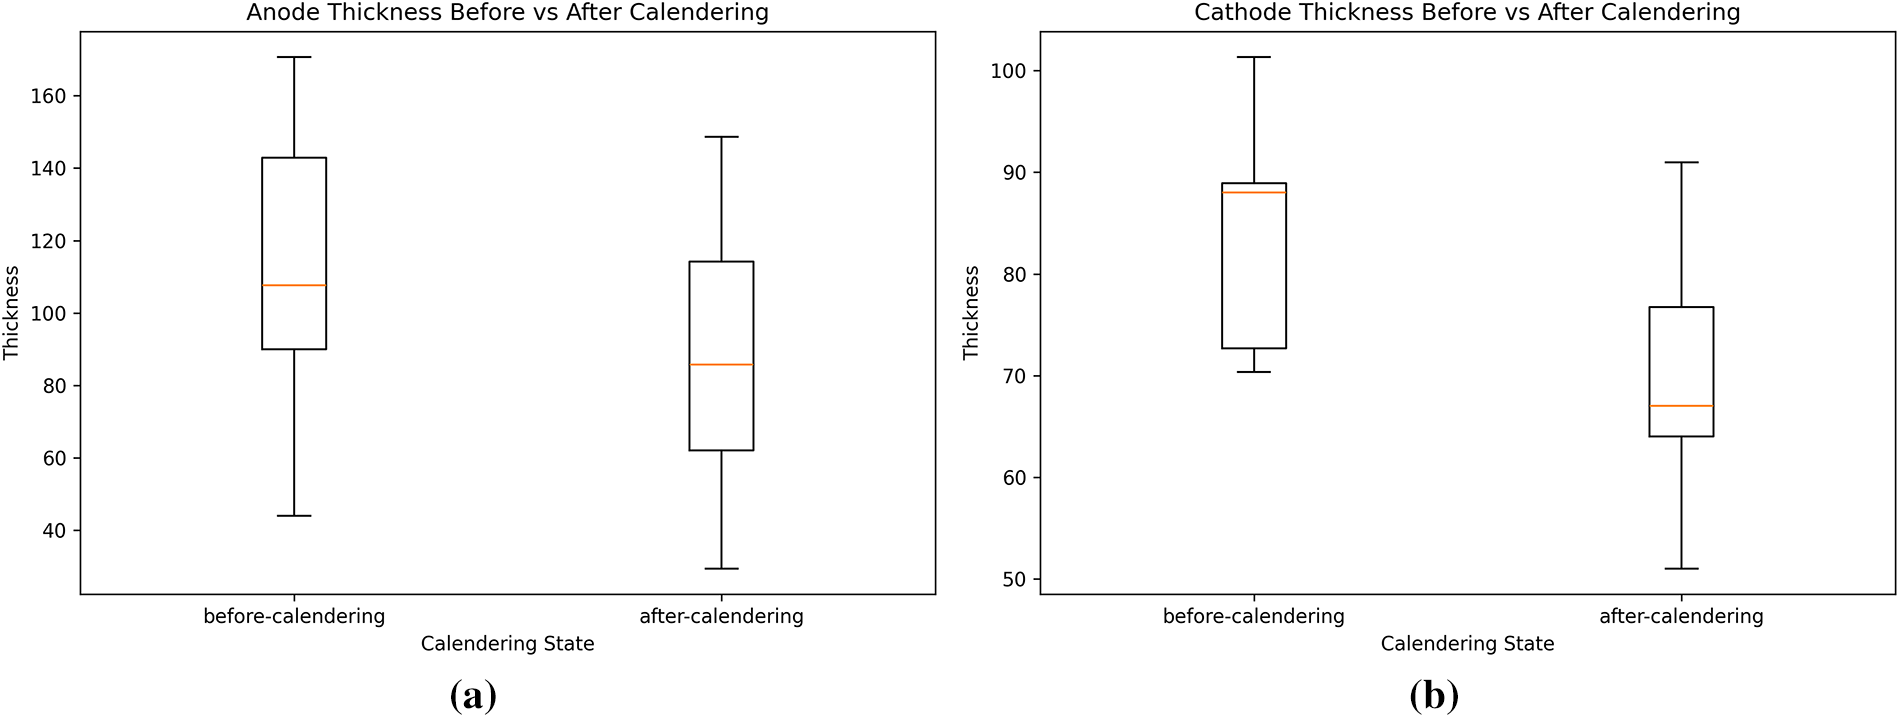
Figure 4: Comparison of electrode thickness before and after calendering for the studied datasets: (a) anode thickness before vs. after calendering; (b) cathode thickness before vs. after calendaring.
Fig. 5 presents representative frequency-domain ultrasonic spectra for the anode and cathode datasets before and after calendering, thereby illustrating how the spectral response changes with processing state. Overall, the figure shows that both electrode types exhibit their strongest responses in the lower-frequency region. At the same time, the post-calendering behavior differs in magnitude and decay pattern depending on the electrode type. Fig. 5a shows that the representative anode spectra contain multiple peaks and a broader frequency response than the cathode case. Before calendering, strong peaks can be observed near approximately 2.5 and 3.2, with normalized magnitudes approaching about 0.88 and 1.00, respectively, while after calendering the dominant peak remains close to 3.2 with a magnitude of about 1.00 and an additional elevated response appears around 4.8–5.8, where the magnitude remains between 0.45 and 0.63. In the higher-frequency range, the pre-calendering signal still preserves noticeable amplitudes around 8–9, reaching nearly 0.30–0.32, whereas the post-calendering signal decays more gradually after about 6 and becomes very small beyond approximately 10–11. This behavior suggests that calendering modifies the dominant peak intensity distribution and the anode’s mid-frequency spectral content.
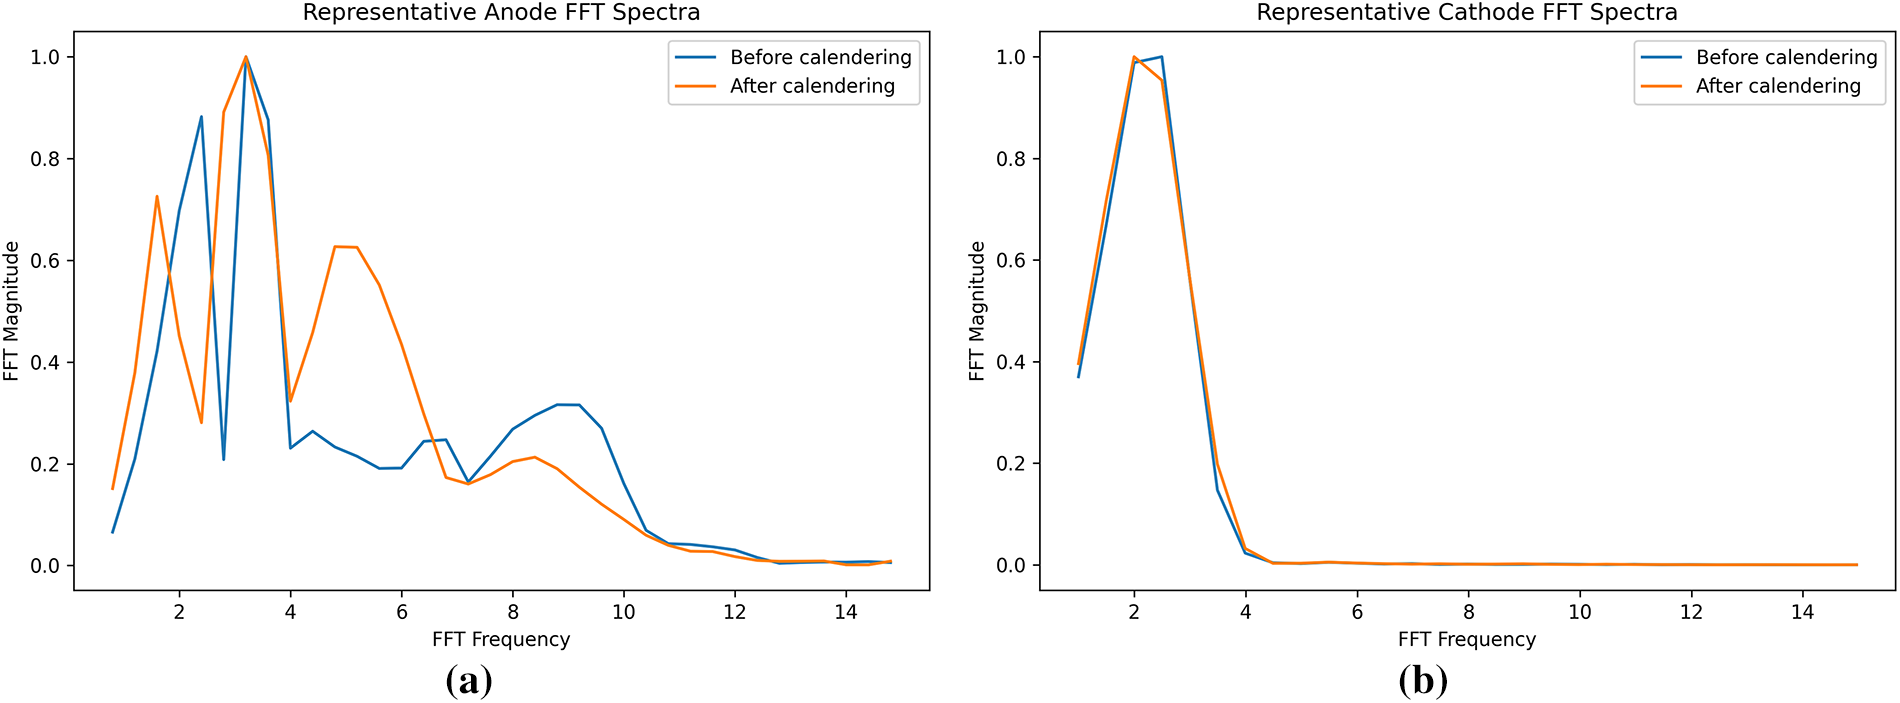
Figure 5: Frequency-domain ultrasonic spectra before and after calendering for the studied electrode datasets: (a) anode FFT spectra before vs. after calendering; (b) cathode FFT spectra before vs. after calendaring.
Fig. 5b shows that the representative cathode spectra are more compact in the low-frequency range. Both before and after calendering, the peak response is again at around 2.0–2.5, where the normalized magnitude reaches about 1.00, followed by a sudden decrease after about 3.0–3.5. After almost 4.0, the magnitude of the response is extremely small and close to 0, and this continues for most of the remaining frequencies up to around 15. The cathode response is therefore more concentrated and heavily weighted at the low-frequency end of the spectrum, with very little difference between the before- and after-calendering curves, compared to the anode response. This suggests that, in the representative cathode case, the spectral information is mostly contained in the first frequency bins, rather than being spread out over a wide frequency range. The correlation structure between thickness and the engineered ultrasonic features for the anode and cathode data sets is shown in Fig. 6, where the magnitude and direction of the correlations are different for the two electrode types.
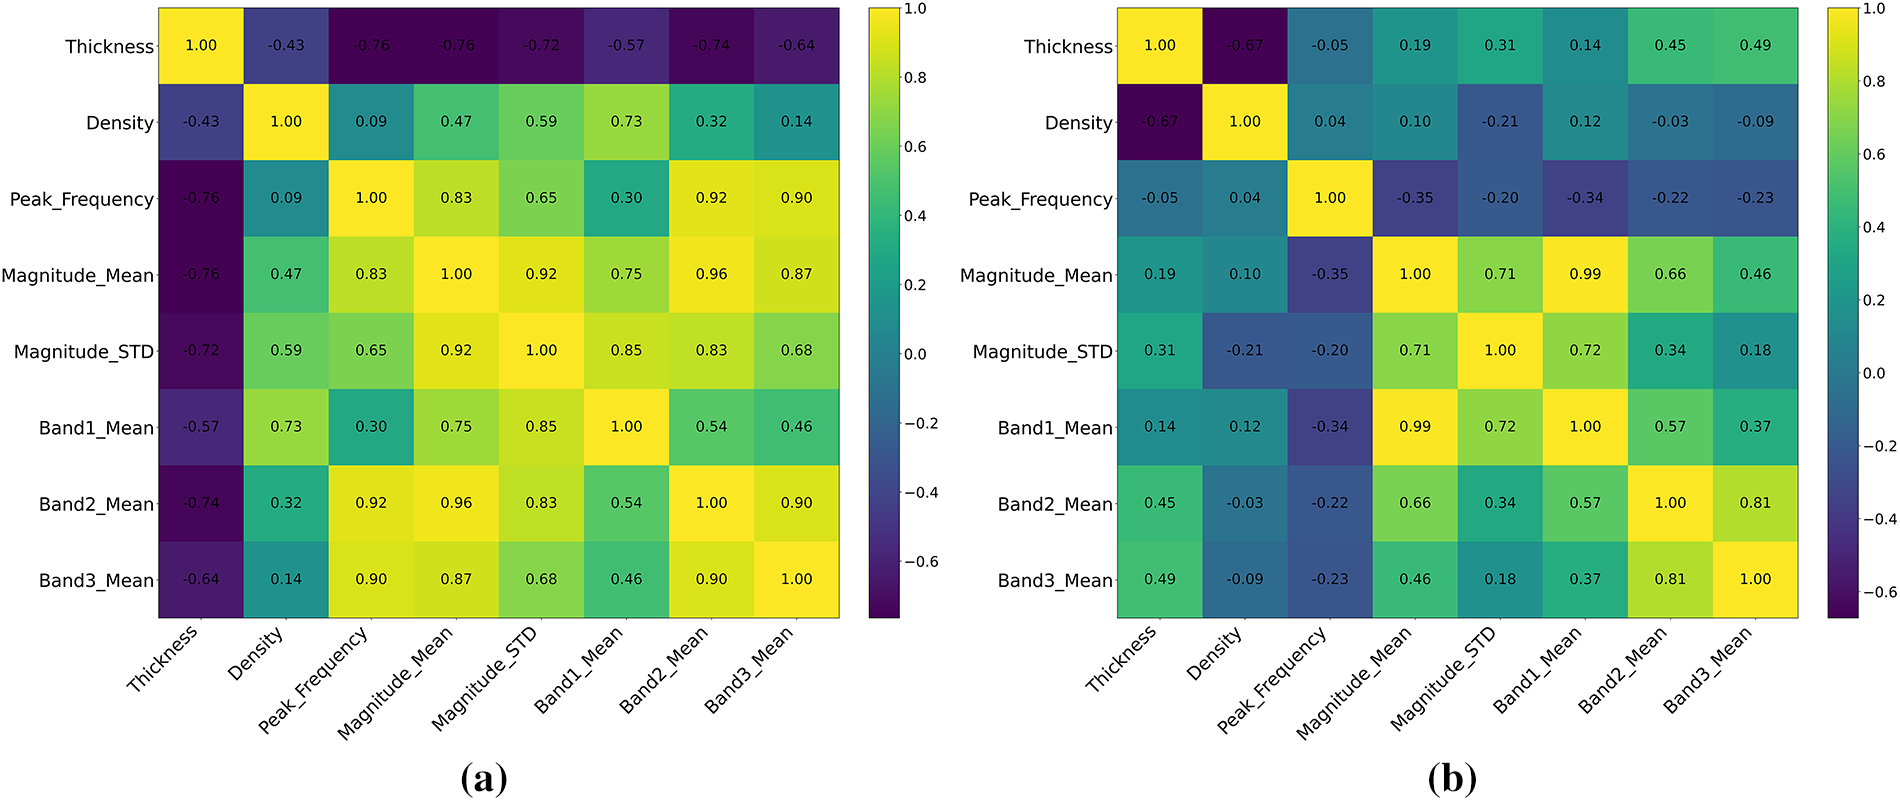
Figure 6: Correlation heatmaps of thickness and engineered ultrasonic features for: (a) anode; (b) cathode.
The main artificial intelligence outcomes of the proposed DNN-SGD model for electrode thickness prediction are presented in Section 4.2. This section compares the model’s prediction accuracy in the anode and cathode datasets and analyzes its learning of the relationship between the inputs (ultrasonic frequency domain) and the thickness. Model performance was quantified using standard metrics such as MAE, RMSE and R2. As seen in Fig. 7a, there is good agreement between the predicted and measured thickness values with an MAE of 9.530, an RMSE of 16.649, and an R2 value of 0.824 for the anode model. The model had an MAE of 9.849, RMSE of 12.280, and R2 of 0.145 for the cathode dataset. The low cathode R2 value is primarily due to the smaller number of cathodes in the subset and the narrower thickness distribution, since there is a smaller difference in the target thickness and the R2 value is more sensitive to small error values in the prediction even if the error values are not high. These results suggest that the DNN-SGD framework is more effective for the anode dataset, which better represented the dataset with respect to the thickness variations. The smaller data set in the cathode model, as well as the more compact target distribution, provided lower error levels, but also reduced explained variance. The normalized errors of both data sets are similar, with CVRMSE of 17.653% for the anode model and 16.093% for the cathode model. In this context for predicting the electrode thickness, CVRMSE value of less than around 20% was deemed acceptable for preliminary non-destructive regression modeling, due to the small size of the dataset and the fact that it was based on experimentally measured ultrasonic frequency-domain signals. Fig. 7b shows the training and validation loss curves of the DNN-SGD models over 180 epochs. As seen, the losses of the anode training and validation are rapidly reduced during the initial epochs, and then the losses stabilize. The convergence of the cathodes is also under control with only slight deviations. The absence of a strong late-stage separation between the training and validation losses supports that early stopping, L2 regularization, and the compact network architecture helped reduce severe overfitting.
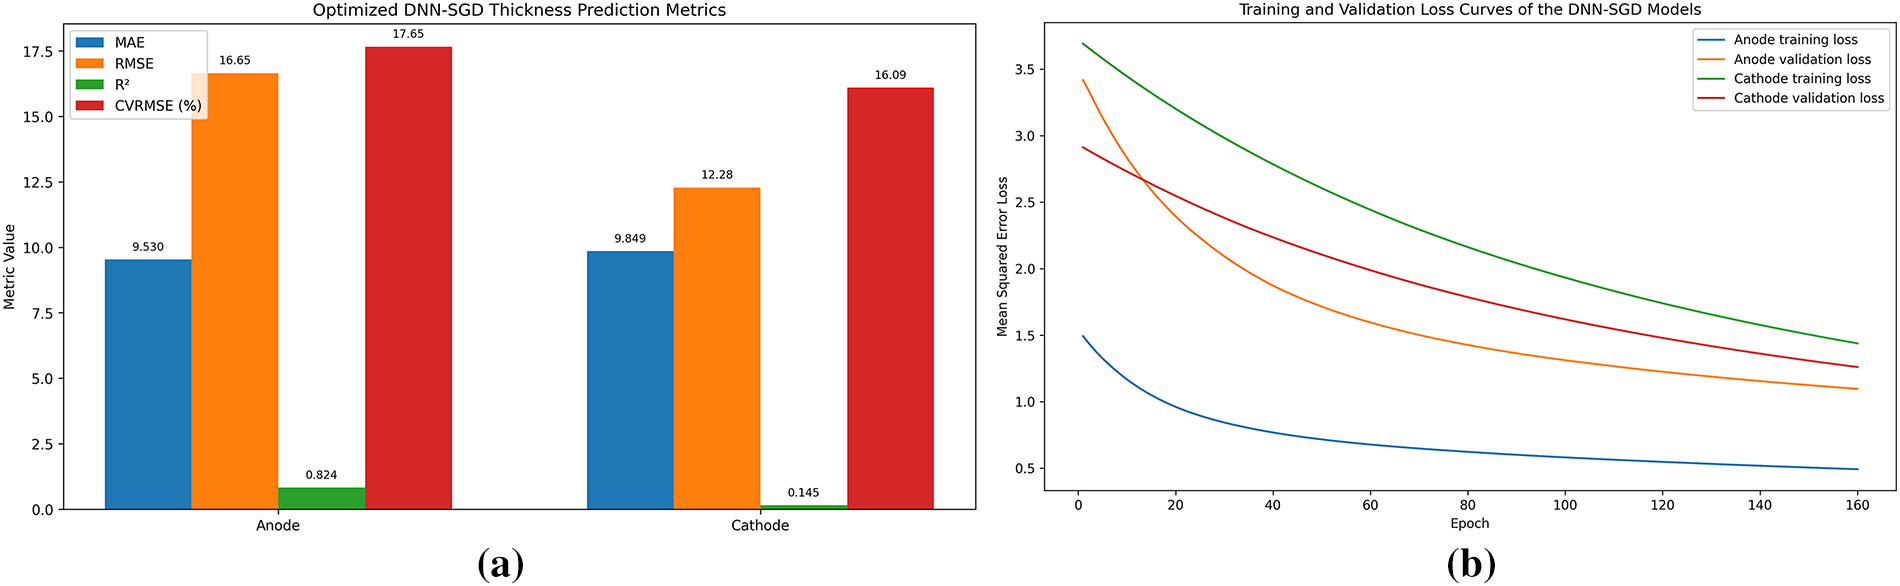
Figure 7: Predictive performance and overfitting analysis of the proposed DNN-SGD model: (a) assessment metrics for the anode and cathode datasets; (b) training and validation loss curves for the anode and cathode models.
Fig. 8 shows the actual-vs.-predicted thickness plot for the optimized DNN-SGD model and offers a visual comparison of the predictive agreement for the two datasets. Fig. 8a shows that the anode points are mostly clustered around the 45° line, which confirms that the measured and predicted thickness values are in good agreement over a large range of thickness values from almost 20 to 180. The associated performance metrics of 5-fold CV, MAE = 9.530, RMSE = 16.649, and R2 = 0.824 also support the excellent predictive performance of the anode model. By contrast, Fig. 8b shows that the cathode points are more dispersed around the reference line, albeit in a more limited range of about 45 to 110. This weaker agreement is reflected in the cathode metrics of 3-fold CV, MAE = 9.849, RMSE = 12.280, and R2 = 0.145, which show that the cathode model resulted in moderate absolute errors but low explained variance. In conclusion, Fig. 8 demonstrates that the proposed DNN-SGD model was more suitable for the anode dataset than for the cathode dataset under the given modeling conditions.
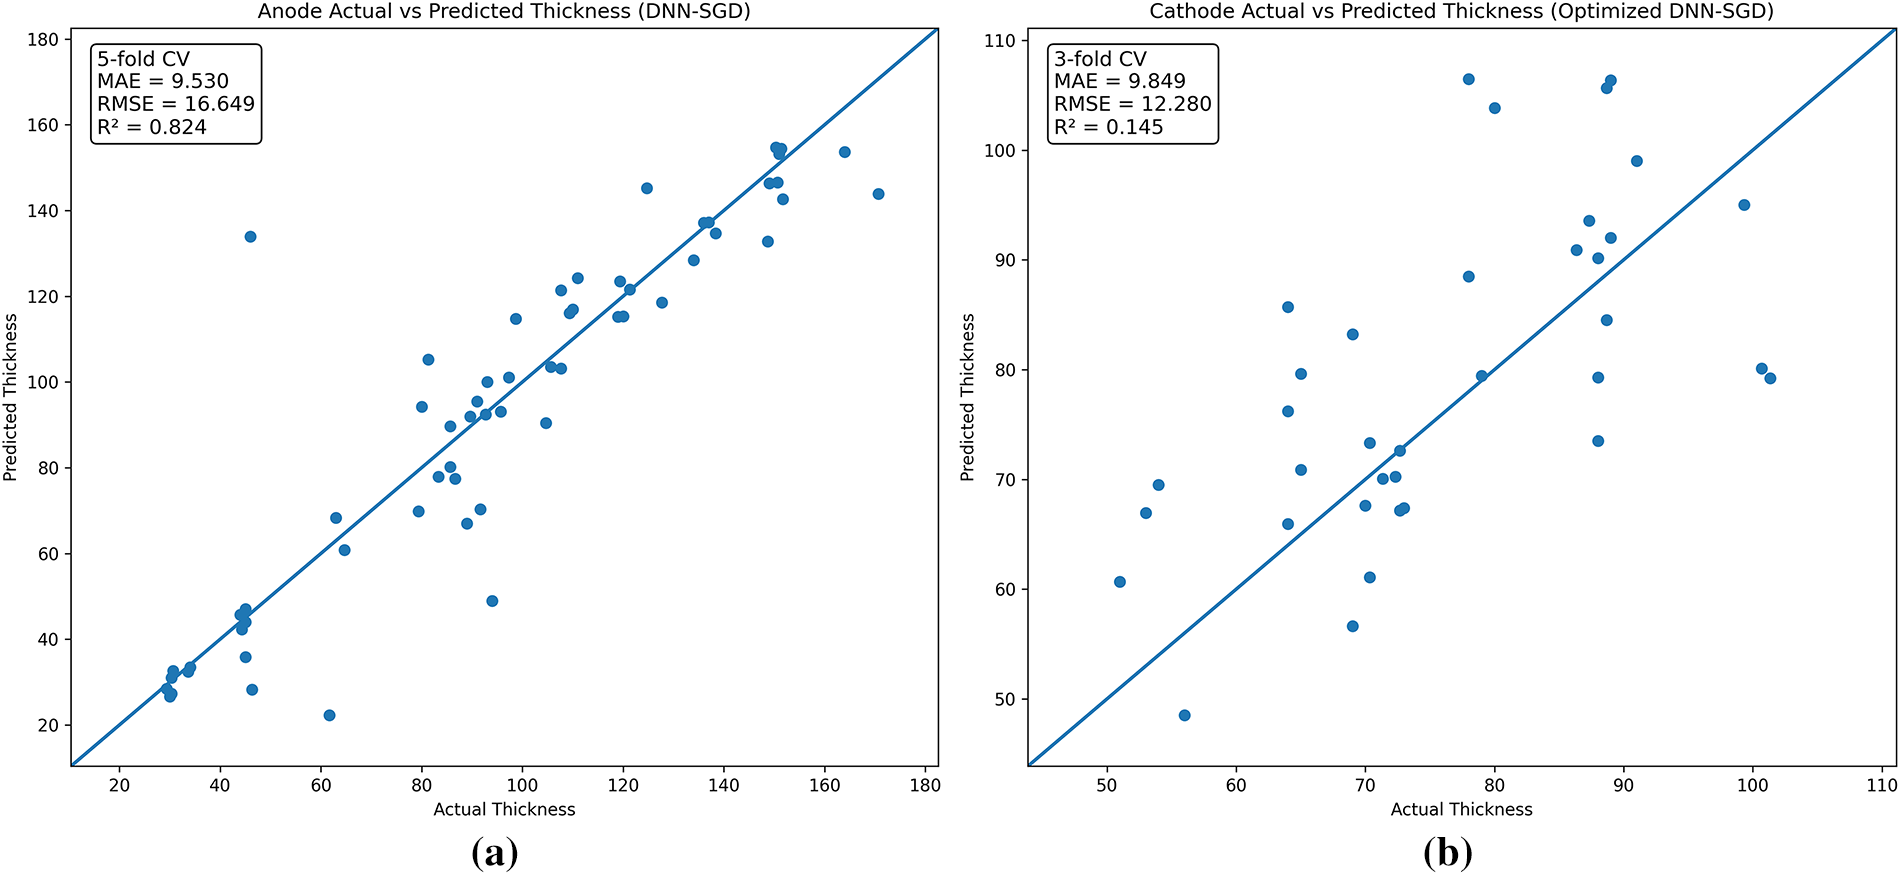
Figure 8: Actual vs. predicted thickness values obtained by the proposed DNN-SGD model for the studied datasets: (a) anode actual vs. predicted thickness; (b) cathode actual vs. predicted thickness.
Table 4 compares the proposed DNN-SGD model with several baseline regression models for anode and cathode thickness prediction. As shown, DNN-SGD achieved the best overall performance for both datasets, giving the lowest errors and highest R2 values compared with Linear Regression, Ridge Regression, Support Vector Regression, Random Forest Regression, XGBoost, and standard DNN. This confirms that the optimized SGD-based deep model provided a measurable improvement over simpler regression alternatives. For reproducibility and fair comparison, all baseline models were trained using the same electrode-specific FFT and metadata input features, preprocessing steps, target variable, cross-validation procedure, and evaluation metrics used for the proposed DNN-SGD framework.
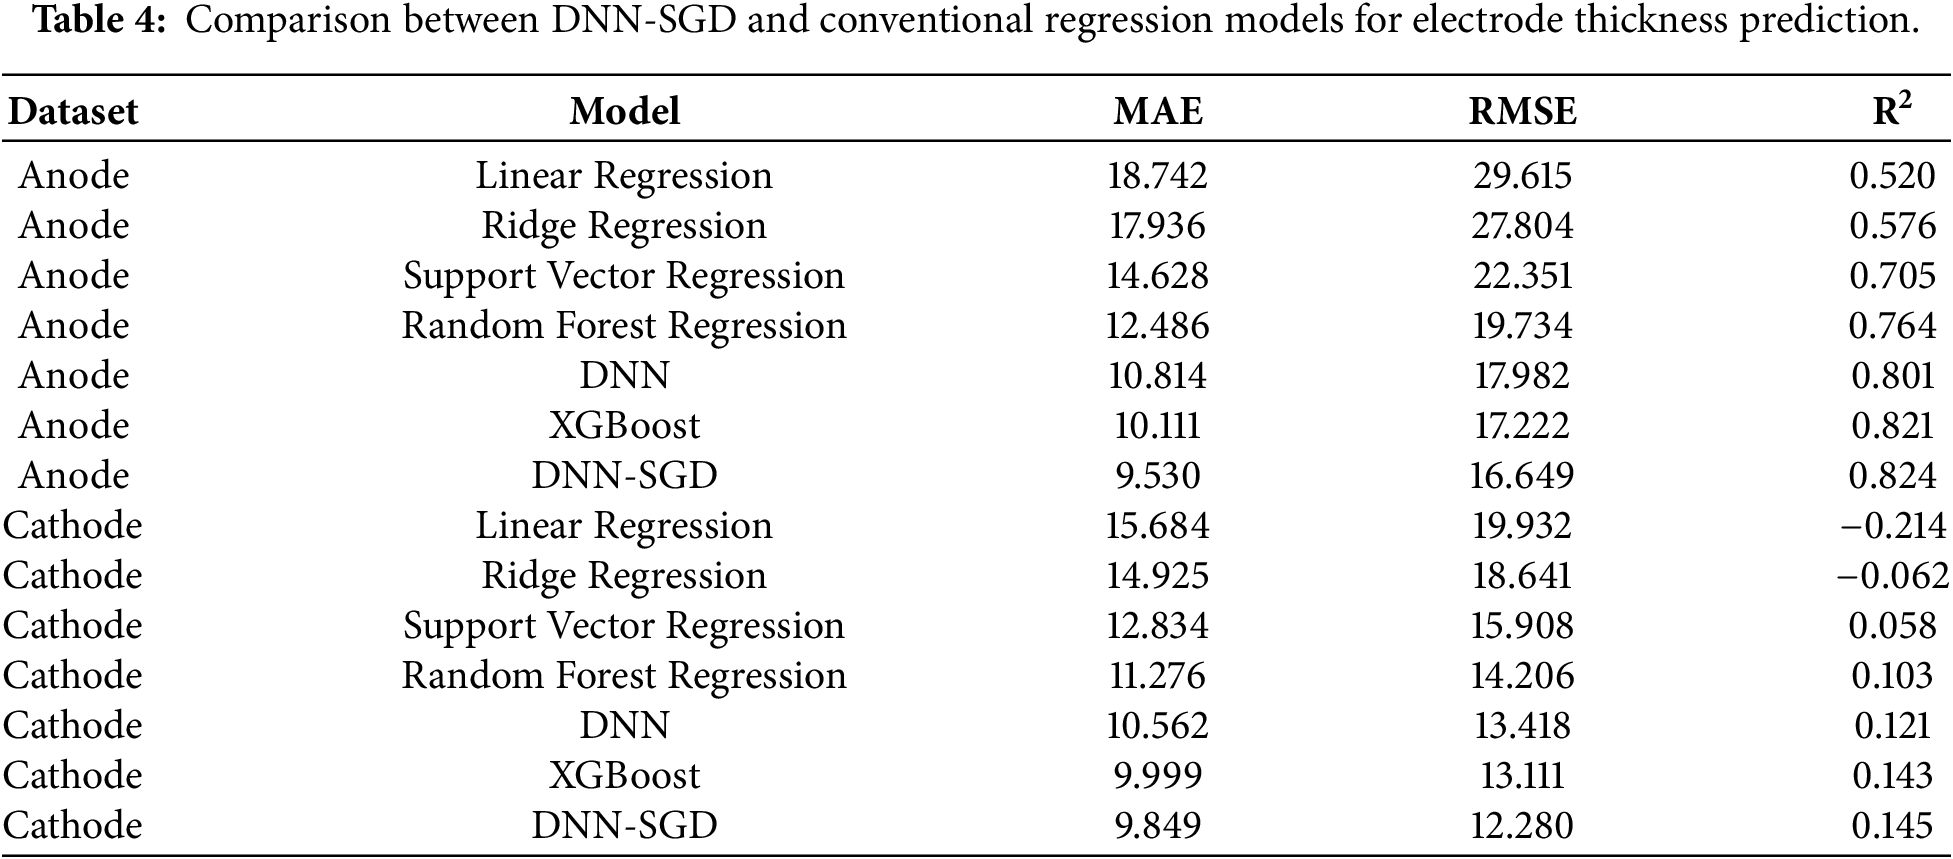
Table 5 presents the combined SHAP feature-importance results for the proposed DNN-SGD thickness-prediction framework and provides a quantitative interpretation of the most influential features for both electrode datasets. For the anode model, the highest contributions were associated with FFT 12.400 MHz (8.297) and FFT 14.800 MHz (6.906), followed by FFT 12.800 MHz (3.668), FFT_5.600 MHz (3.460), and FFT_9.600 MHz (3.208). The rest of the important anode features, FFT_4.400 MHz (3.150), FFT 13.600 MHz (3.054), FFT 6.000 MHz (2.890), FFT 7.200 MHz (2.314) and FFT 9.200 MHz (2.076) suggest that the prediction process was dominated by the ultrasonic spectral content, which is concentrated in the mid- to high-frequency range. The materials point of view indicates that the response in thickness may be strongly coupled to the changes in internal structure, compaction state, and/or the density-related acoustic response of the process, as the high frequency components are more sensitive to the fine-scale variations in the porosity distribution, coating uniformity, and the arrangement of the solid phase within the electrode layer. The most critical feature in the cathode model was FFT_1.496 MHz (1.868), followed by FFT 4.489 MHz (1.692), and Coat_Weight (1.116) which is a process variable. Additional influential features included FFT 10.474 MHz (1.101), FFT 10.973 MHz (1.073), FFT 6.983 MHz (0.991), FFT 5.486 MHz (0.871), FFT 3.491 MHz (0.814), FFT 6.484 MHz (0.791), and FFT 13.965 MHz (0.785). In contrast to the anode, the cathode feature-importance pattern shows a more balanced influence of the spectral (acoustic) and direct manufacturing parameters. This is significant from a materials processing perspective, since cathode thickness is determined not only by ultrasonic spectral features but is also greatly influenced by coating mass loading and the consequent distribution of active material within the coated layer. The presence of Coat_Weight among the top features supports the notion that predicting cathode thickness depends not only on acoustic response but also on the physical properties of the coating material. In summary, the anode model was more signal-dominated, while a combination of ultrasonic response and processing material properties dominated the cathode model.
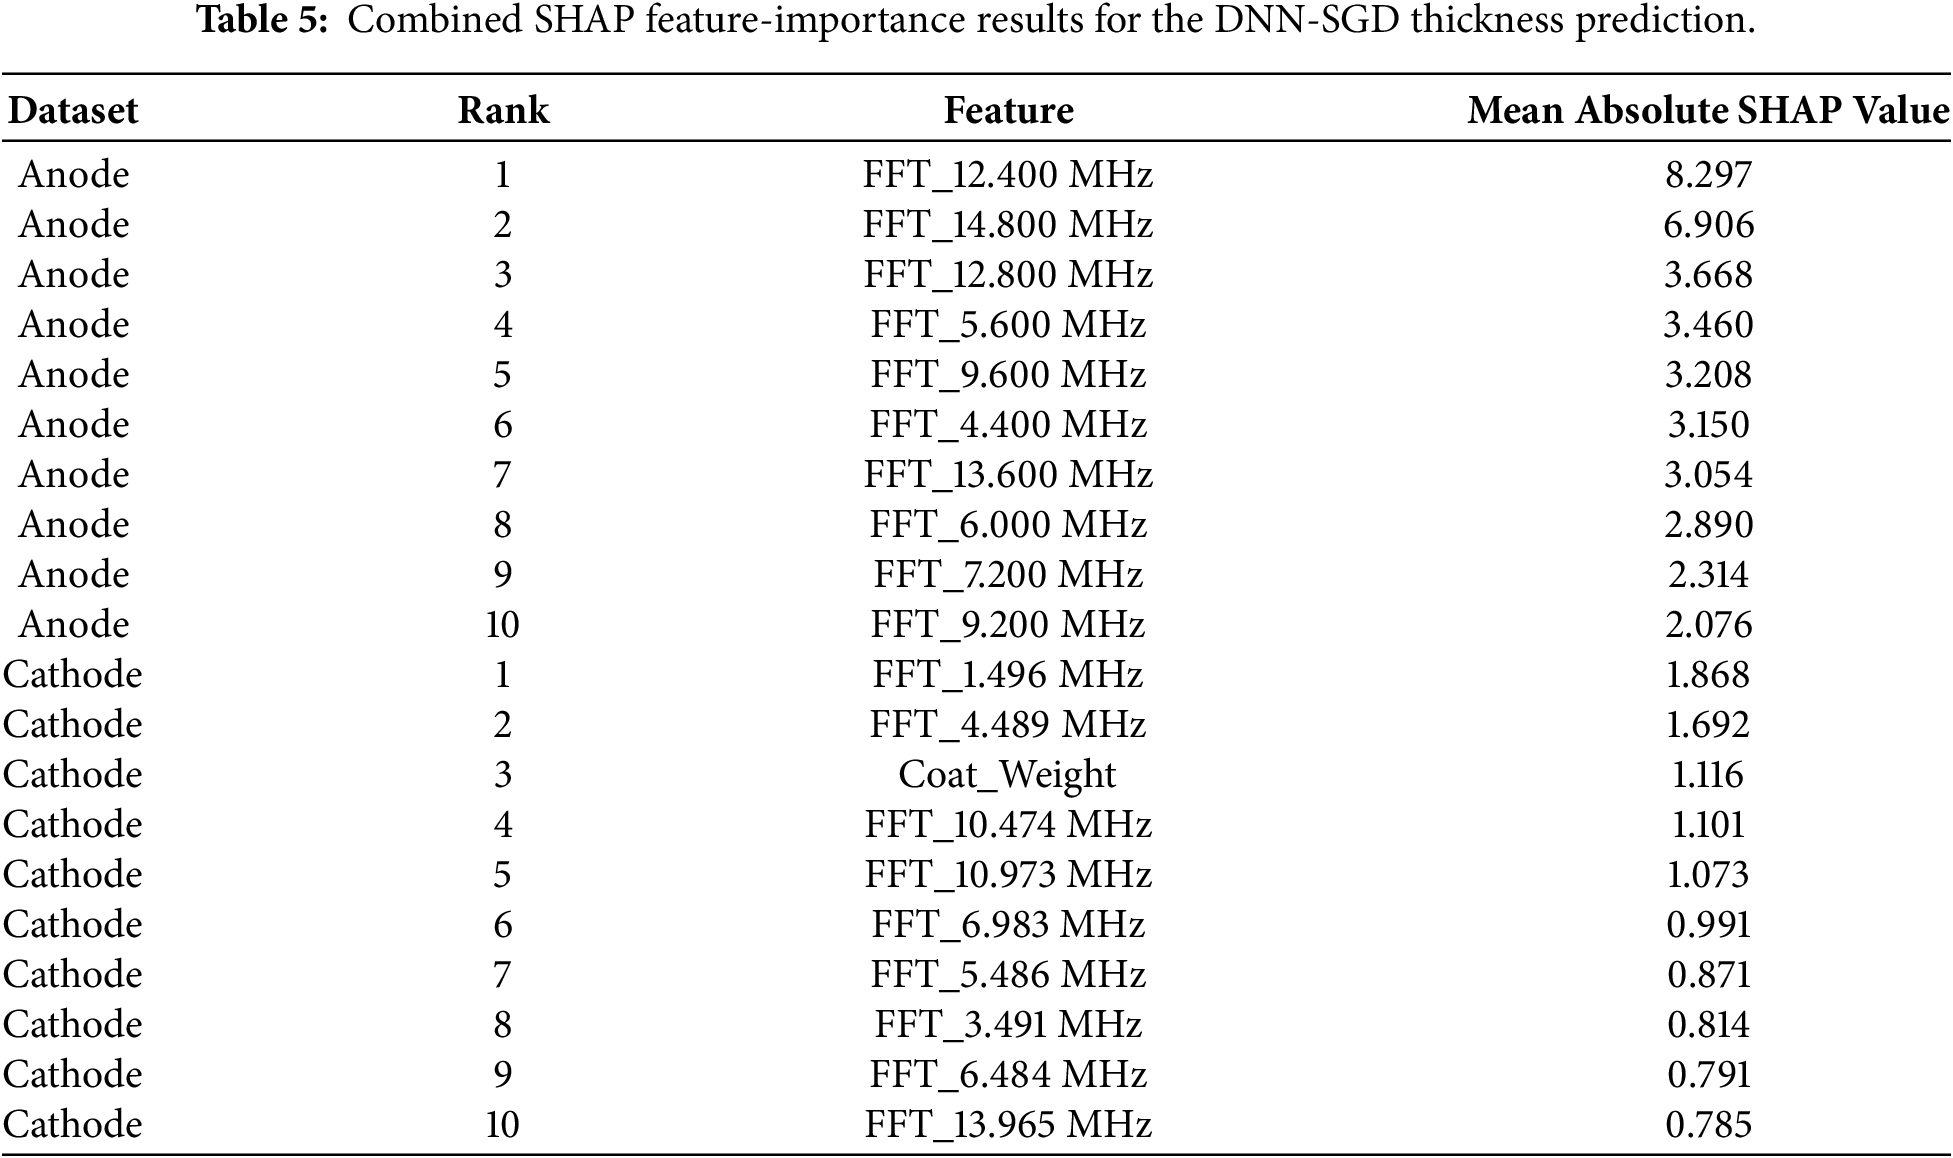
Fig. 9 compares the SHAP-based importance structure of the anode and cathode models and reveals a clear difference in how each model formed its thickness predictions. The anode response is dominated by a small group of highly influential spectral descriptors, whereas the cathode response is governed by a flatter and more distributed importance pattern. This contrast suggests that the anode model relied more strongly on a concentrated set of ultrasonic frequency cues. In contrast, the cathode model drew information from both spectral and process-related inputs in a more balanced way.
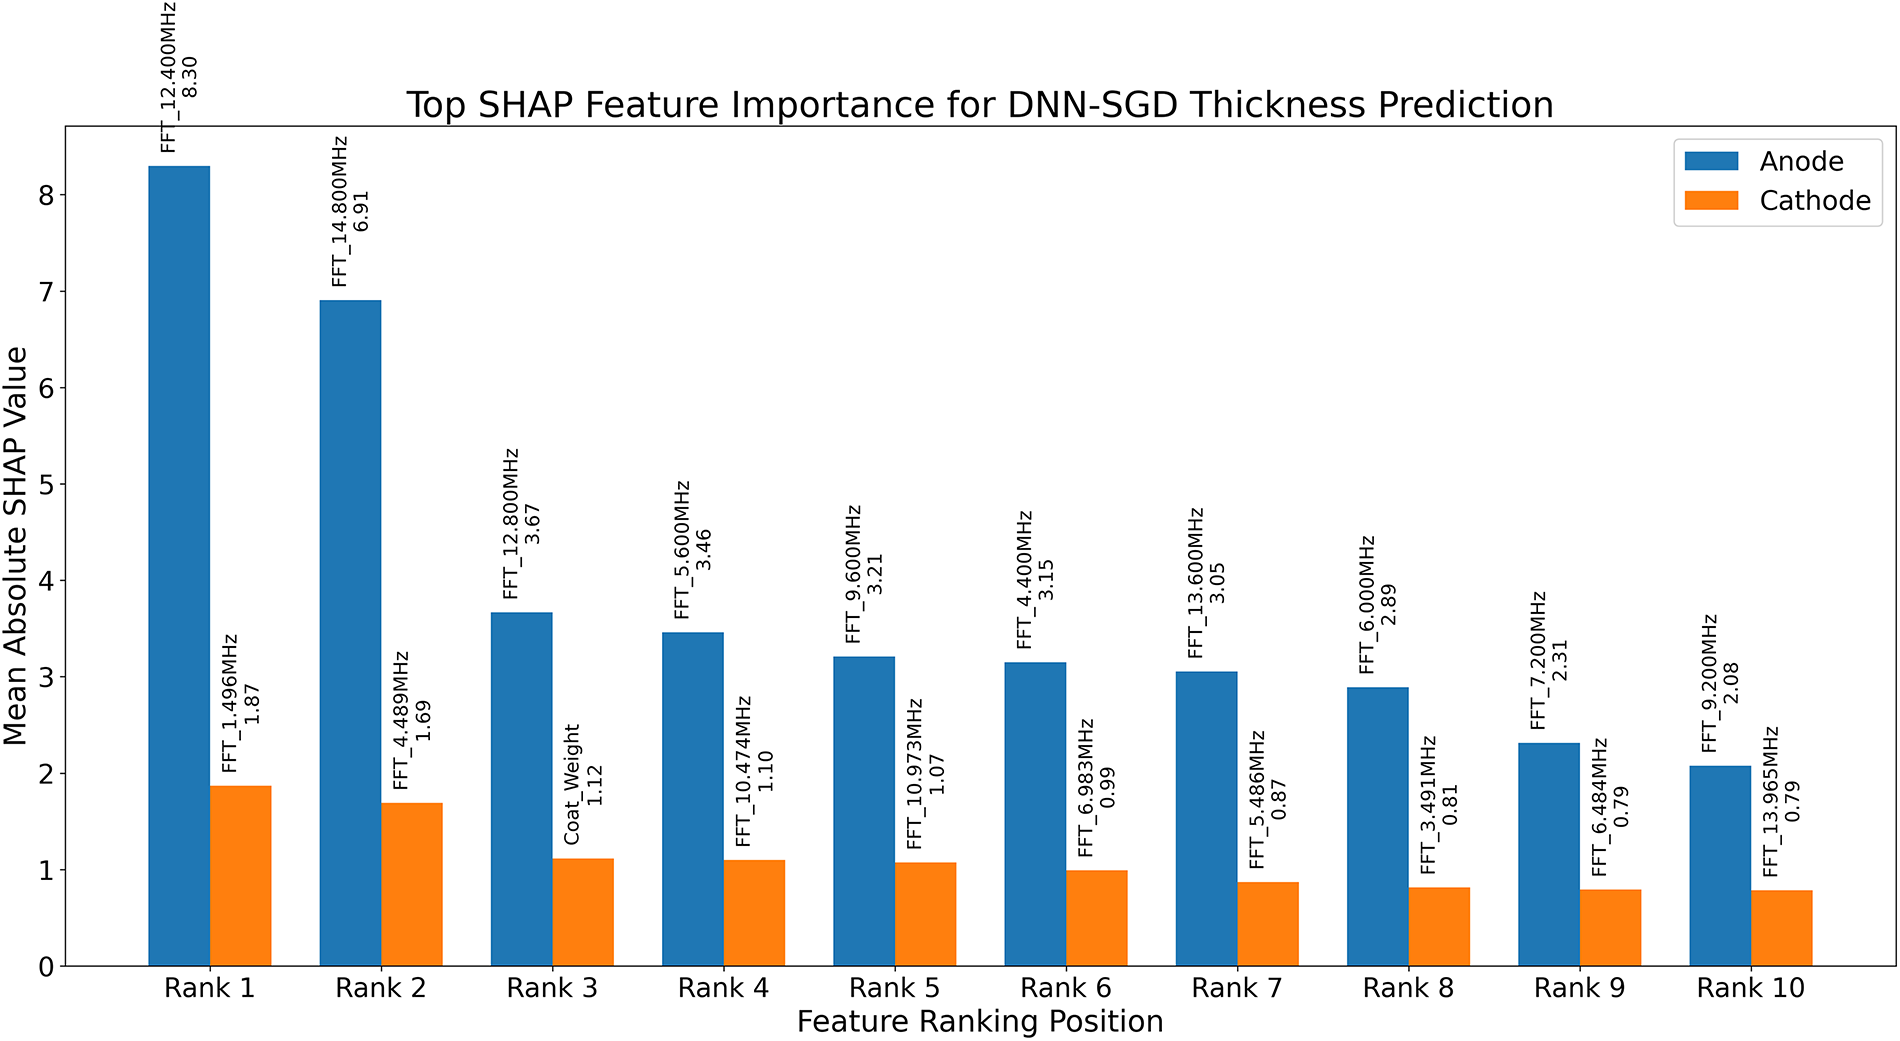
Figure 9: SHAP feature-importance ranking of the DNN-SGD model for anode and cathode thickness prediction.
For the anode, the features at 12.400 and 14.800 MHz are the top predictors, well separated from the rest. After these two dominant components, the importance gradually decreases through features such as 12.800, 5.600, 9.600, 4.400, and 13.600 MHz, followed by 6.000, 7.200, and 9.200 MHz. This ranking suggests that the prediction of anode thickness was particularly sensitive to several mid- and high-frequency features in the ultrasonic spectrum. From a materials point of view, this can be linked to the sensitivity of the ultrasonic wave to subtle changes in the anode structure due to calendering, such as changes in compaction, pore structure, coating continuity, and heterogeneities of the anode layer.
The ranking of the cathode variables is different. The first two ranking frequencies are 1.496 and 4.489 MHz, followed by the appearance of Coat_Weight among the top contributors, and then the rest of the spectral descriptors resume the ranking, respectively. Other important cathode variables are located around 10.474, 10.973, 6.983, 5.486, 3.491, 6.484, and 13.965 MHz. The cathode model does not seem to be dominated by a few “strong” frequencies, but rather commands a complex interplay of acoustic response and material loading associated with the cathode manufacturing process. In particular, the dominance of Coat_Weight is interesting because the cathode thickness depends on the mass and distribution of the deposited material, which affect the physical layer structure and, consequently, its acoustic response. The dominance of specific FFT components indicates that thickness prediction is not governed only by direct process metadata, but also by ultrasonic spectral responses associated with electrode compaction, coating uniformity, density variation, and acoustic wave interaction with the porous electrode structure. In summary, Fig. 9 reveals the higher dependency of the anode model on the signals, compared to the cathode model, which showed increased interaction between spectral descriptors and material loading-related variables.
In conclusion, this study demonstrated that ultrasonic frequency-domain data can be successfully integrated with modern computational intelligence to support thickness prediction in lithium-ion battery electrodes within a materials-manufacturing context. The proposed DNN-SGD framework achieved strong results for the anode dataset, with an MAE of 9.530, an RMSE of 16.649, and an R2 of 0.824, confirming that the learned model captured the relationship between spectral input features and electrode thickness with good predictive capability. From a materials perspective, this is important because electrode thickness is closely tied to compaction behavior, coating quality, porosity evolution, and internal structural uniformity, all of which directly influence transport properties, electrochemical efficiency, and manufacturing consistency. From a computational perspective, the study highlights the value of combining signal-domain representations, deep neural learning, and explainable AI to transform complex manufacturing data into interpretable predictive knowledge. The SHAP analysis further strengthened this contribution by showing that the prediction process was not a black-box output only, but a feature-driven response linked to physically meaningful spectral regions. Overall, the proposed framework demonstrates that frequency-domain ultrasonic sensing combined with interpretable AI can support non-destructive electrode thickness prediction. At the same time, further validation on larger experimental datasets remains necessary before industrial deployment.
More investigations are needed to expand the framework with larger and broader sets of electrodes that are obtained at various coating and calendering conditions. Further experimental batches will also need to be validated to ensure generalization of the model. Independent manufacturing batches here are the electrode data that was collected from different manufacturing runs, calendering/coating machines, operating periods, or production lines to assess the robustness of trained model beyond the original training set. Furthermore, feature-selection and dimensionality-reduction techniques like SHAP-guided feature reduction, PCA and frequency-band selection will be explored to further reduce the number of features, eliminate redundant features in the input FFT space and increase the robustness of the model for practical battery-manufacturing applications. To complete the scope of future work, external electrode datasets and additional manufacturing batches will be utilized to validate the framework proposed in the present work and evaluate the transferability of the proposed framework to different battery-production conditions.
Acknowledgement: None.
Funding Statement: The author received no specific funding for this study.
Availability of Data and Materials: The data that support the findings of this study are openly available in Data in Brief at https://doi.org/10.1016/j.dib.2025.112433.
Ethics Approval: Not applicable.
Conflicts of Interest: The authors declare no conflicts of interest.
References
1. Chang WE, Kung CC. A resistance-based co-estimation framework for state-of-charge and state-of-health of lithium-ion batteries across usage cycles. IEEE Access. 2026;14:57575–87. doi:10.1109/ACCESS.2026.3683310. [Google Scholar] [CrossRef]
2. Shao M, Lv G, Feng W, Wu X, Yang ZX, Guo S. Multifeature fusion of noncontact laser-generated ultrasound and electrochemical data for in situ battery state estimation. IEEE Trans Instrum Meas. 2026;75:9701813. doi:10.1109/TIM.2026.3682830. [Google Scholar] [CrossRef]
3. Akhter MS, Moossa B, Kahraman R, Rasul S, Shakoor RA. Advancements in high voltage, high-energy density, lithium-ion cathode materials: a focused review. Appl Mater Today. 2025;45(21):102827. doi:10.1016/j.apmt.2025.102827. [Google Scholar] [CrossRef]
4. He Y, Chen W. Analysis of electrochemical performances in hybrid lithium-ion/lithium metal battery during charging. J Power Sources. 2025;654:237835. doi:10.1016/j.jpowsour.2025.237835. [Google Scholar] [CrossRef]
5. Lin Z, Tong Z, Cai H, Li C, Ding Y, Lv C, et al. Prelithiation technology for high energy density lithium-ion batteries: design, progress, advantages and challenges. Energy Storage Mater. 2025;83:104709. doi:10.1016/j.ensm.2025.104709. [Google Scholar] [CrossRef]
6. Ngoy KR, Lukong VT, Yoro KO, Makambo JB, Chukwuati NC, Ibegbulam C, et al. Lithium-ion batteries and the future of sustainable energy: a comprehensive review. Renew Sustain Energy Rev. 2025;223(4):115971. doi:10.1016/j.rser.2025.115971. [Google Scholar] [CrossRef]
7. Parvizi P, Jalilian M, Amidi AM, Zangeneh MR, Riba JR. From present innovations to future potential: the promising journey of lithium-ion batteries. Micromachines. 2025;16(2):194. doi:10.3390/mi16020194. [Google Scholar] [CrossRef]
8. Jeong Y, Ryu D, Kim D, Nam G, Cho H, Kwon G, et al. Dry process for green manufacturing of battery electrodes: structural evolution of freestanding film during roll-to-roll processing. Int J Precis Eng Manuf Green Technol. 2026;14(11):1–26. doi:10.1007/s40684-026-00885-7. [Google Scholar] [CrossRef]
9. Xu X, Zhao X, Hui KS, Dinh DA, Hui KN. Rechargeable batteries: regulating electronic and ionic transports for high electrochemical performance. Adv Mater Technol. 2022;7(5):2101107. doi:10.1002/admt.202101107. [Google Scholar] [CrossRef]
10. Chen Y, Kong S. Advances and challenges in dry electrode process for solid-state batteries. J Solid State Electrochem. 2026;30(4):1441–55. doi:10.1007/s10008-025-06518-4. [Google Scholar] [CrossRef]
11. Farhadi Tolie H, Guk E, Marco J, Faraji Niri M. Swin transformer and generative adversarial networks for accurate battery electrode thickness prediction in manufacturing using ultrasound sensing. J Power Sources. 2025;655(4):237919. doi:10.1016/j.jpowsour.2025.237919. [Google Scholar] [CrossRef]
12. Guk E, Niri MF, Tolie HF, Marco J. Dataset of ultrasonic frequency-domain signals and machine-learning outputs for parameterising lithium-ion battery electrodes’ coating and calendering processes. Data Brief. 2026;64:112433. doi:10.1016/j.dib.2025.112433. [Google Scholar] [CrossRef]
13. Chen J, Asachi M, Hassanpour A, Babaie M, Jabbari M. Modelling of lithium-ion battery electrode calendering: a critical review. J Energy Storage. 2025;123(5):116702. doi:10.1016/j.est.2025.116702. [Google Scholar] [CrossRef]
14. Yang Y, Guo Z, Zhao Y, Dong H, Titirici MM, Cegla F, et al. Towards inline ultrasonic characterisation of battery slurry mixing: opportunities, challenges, and perspectives. Energy Environ Sci. 2026;19(1):11–43. doi:10.1039/d5ee03563e. [Google Scholar] [CrossRef]
15. Klenner M, Wang Y, Lindner M, Thiede S, Herrmann C, Turetskyy A. Transfer learning for battery cell manufacturing: review on applications, challenges, and benefits. Batter Supercaps. 2025;8(11):e202500327. doi:10.1002/batt.202500327. [Google Scholar] [CrossRef]
16. Xu X, Stier S, Gronbach A, Moeckel M. Deploying virtual quality gates in a pilot-scale lithium-ion battery assembly line. Batteries. 2025;11(8):285. doi:10.3390/batteries11080285. [Google Scholar] [CrossRef]
17. Zangerle SW, Weinzierl L, Summer A, Schmid S, Jahnke P, Grosse CU. Detection of anode coating defects in batteries electrode production and their effect on cell performance. J Nondestruct Eval. 2025;44(3):66. doi:10.1007/s10921-025-01208-7. [Google Scholar] [CrossRef]
18. Li J, Hu E, Wei W, Shi F. From wafers to electrodes: transferring automatic optical inspection (AOI) for multiscale characterization of smart battery manufacturing. Adv Funct Mater. 2026;36(41):e28142. doi:10.1002/adfm.202528142. [Google Scholar] [CrossRef]
19. Manoharan A, Chong JJ, Choong ZJ, Lambert S, Kumar Gupta R, Chandra D, et al. Optimizing lithium-ion battery manufacturing with digitalization and AI-driven frameworks. Int J Adv Manuf Technol. 2026;142(1):1–37. doi:10.1007/s00170-025-17129-8. [Google Scholar] [CrossRef]
20. Galvez-Aranda DE, Fernandez F, Franco AA. Physics-assisted machine learning for the simulation of the slurry drying in the manufacturing process of battery electrodes: a hybrid time-dependent VGG16-DEM model. ACS Appl Mater Interfaces. 2025;17(22):32150–62. doi:10.1021/acsami.4c23103. [Google Scholar] [CrossRef]
21. Lin B, Carrillo LJ, Peng XL, Chen WX, Santos DA, Banerjee S, et al. Deep learning-enabled large-scale analysis of particle geometry-lithiation correlations in battery cathode materials. J Power Sources. 2026;674(12):239806. doi:10.1016/j.jpowsour.2026.239806. [Google Scholar] [CrossRef]
22. Weiss M, Mrzljak K, von Schmid M, Erbach G, Brierley N, Meisen T. Material-resolving computed tomography of lithium-ion batteries using deep learning. NDT E Int. 2026;158(3):103565. doi:10.1016/j.ndteint.2025.103565. [Google Scholar] [CrossRef]
23. Chen T, Lai X, Chen F, Xu Z, Han X, Lu L, et al. Intelligent prediction of electrode characteristics based on neural networks in the lithium-ion battery production chain. Green Energy Intell Transp. 2026;5(1):100294. doi:10.1016/j.geits.2025.100294. [Google Scholar] [CrossRef]
24. Xiang H, Zhang Y, Feng W. Deep learning and transfer learning for accurate electrode-level degradation diagnosis in lithium-ion batteries. Next Energy. 2026;12(1):100665. doi:10.1016/j.nxener.2026.100665. [Google Scholar] [CrossRef]
25. Ganti SVS, Wölfel L, Kuenneth C. AI-driven discovery of high performance polymer electrodes for next-generation batteries. J Polym Sci. 2025;63(21):4631–9. doi:10.1002/pol.20250198. [Google Scholar] [CrossRef]
26. Bin Faheem A, Han Z, Wu D, Li H. AI-driven big data frameworks for electrode-electrolyte interphases in batteries. Adv Mater. 2026;38(11):e21975. doi:10.1002/adma.202521975. [Google Scholar] [CrossRef]
27. Ali KH, Al-Haddad LA. Data-driven prediction of thermal and thermoelectric performance in GeTe-Sb2Te3 systems: extreme learning of deep neural networks. Discov Mater. 2026;6(1):21. doi:10.1007/s43939-025-00495-1. [Google Scholar] [CrossRef]
28. Yang K, Wang S, Zhou L, Fernandez C, Blaabjerg F. A critical review of AI-based battery remaining useful life prediction for energy storage systems. Batteries. 2025;11(10):376. doi:10.3390/batteries11100376. [Google Scholar] [CrossRef]
29. Li Y, Wu C, Wang Y, Li N, Liu T, Lu J. Accelerating the battery revolution: AI-driven multiscale innovation from material discovery to smart manufacturing. Adv Funct Mater. 2026;36(11):e14830. doi:10.1002/adfm.202514830. [Google Scholar] [CrossRef]
30. Kim S, Lee IH, Jeon Y, Lee C, Lee T, Koo J, et al. Integrated AI-driven framework for precise prediction of electrolyte additive oxidation potentials in lithium-ion batteries. J Power Sources. 2026;665(4):238934. doi:10.1016/j.jpowsour.2025.238934. [Google Scholar] [CrossRef]
31. Jiang N, Bao W, Xing L, Li W. A stochastic column-block gradient descent method for solving nonlinear systems of equations. Appl Math Lett. 2026;172:109735. doi:10.1016/j.aml.2025.109735. [Google Scholar] [CrossRef]
Cite This Article
 Copyright © 2026 The Author(s). Published by Tech Science Press.
This work is licensed under a Creative Commons Attribution 4.0 International License , which permits unrestricted use, distribution, and reproduction in any medium, provided the original work is properly cited.
 Downloads
 Citation Tools
