
 Login
Login Register
 Submit a Paper
 Propose a Special lssue
 Open Access
ARTICLE
A Three-Layer Multi-Agent Framework for PHM-Enabling Autonomous Condition Monitoring of Power ICT Infrastructure in Underground Facilities
1 Department of Energy Systems Engineering, Chung-Ang University, Seoul, Republic of Korea
2 KEPCO Research Institute, Daejeon, Republic of Korea
3 School of Energy Systems Engineering, Chung-Ang University, Seoul, Republic of Korea
* Corresponding Author: Wonhee Kim. Email:
(This article belongs to the Special Issue: AI-Enabled Prognostics and Health Management: Advanced Methodologies, Intelligent Systems, and Field Applications)
Computers, Materials & Continua 2026, 89(2), 31 https://doi.org/10.32604/cmc.2026.085203
Received 07 May 2026; Accepted 22 July 2026; Issue published 15 September 2026
 View Full Text
 Download PDF
Abstract
This study proposes the Artificial Intelligence-integrated Inspection Ecosystem (AIIE) as an autonomous condition monitoring platform to enable Prognostics and Health Management (PHM) for underground infrastructure facilities at the Korea Electric Power Corporation (KEPCO) power Information and Communication Technology (ICT) center. To address the environmental dependency of conventional systems, which necessitate extensive control logic redesigns upon changes in target facilities or environments, a three-layer abstraction architecture separating directive, orchestration, and execution roles is established, integrating a quadrupedal robot with heterogeneous sensors into a unified control structure. To overcome the limitation of relying on one general-purpose model for all inspection tasks, this study introduces a collaborative multi-agent system as its core component. This system is individually optimized for analog gauges, digital gauges, switch/LED states, and qualitative appearance defects. The proposed system achieves an Analog Gauge (AG) inspection error of 1.66% of full scale (%FS) (95% confidence interval (CI): [1.31, 2.11]) and a Digital Gauge (DG) recognition rate of 83.8% () using a small vision-language model (sVLM). A three-way validation score of was obtained in identifying qualitative appearance defects, such as oil/water leaks, cleanliness, and insulation degradation. Field evaluations using 11,692 cases of real operational data confirm the system’s effectiveness, achieving an automatic inspection success rate of 87.6%. Downstream PHM prognostic functions, such as anomaly detection, degradation modeling, and remaining useful life (RUL) estimation, remain as future research directions.Keywords
Supplementary Material
Supplementary Material FileInfrastructure facilities operating within power Information and Communication Technology (ICT) centers are crucial to national digital services. Within these centers, thousands of heterogeneous devices—including temperature-humidity sensors, uninterruptible power supply (UPS) systems, generators, power distribution facilities, and fire extinguishing systems—operate in a highly integrated configuration. In large-scale data centers where these facilities are intensively deployed in confined underground environments, facility anomalies directly lead to service interruptions. Consequently, continuous condition monitoring and early health assessment are indispensable prerequisites for Prognostics and Health Management (PHM). Conventional inspection systems rely on manual patrols, where dedicated personnel repeatedly traverse designated paths to visually inspect a vast number of points. This process generates inconsistent records that are inadequate to serve as a robust foundation for data-driven PHM.
This approach entails several structural limitations. First, a patrol routine that repeatedly performs the same tasks daily diverts the capabilities of skilled personnel toward simple, repetitive labor. This degrades operational efficiency. Second, personnel shortages during night shifts create inspection gaps. The resulting longer intervals increase the risk of missing early warning signs. Third, manual recording of inspection results using spreadsheets hampers historical tracking, anomaly pattern analysis, and preventive maintenance decision-making. Fourth, variability in gauge readings and qualitative assessments, which rely on operator experience, compromises the consistency of inspection results, even for identical facilities.
Robotic automation is a promising technical alternative to address these limitations. However, underground infrastructure environments differ significantly from the operating conditions assumed by conventional industrial robotic systems. These environments are characterized by narrow passages, irregular steps, high-density equipment layouts, and poor lighting. Heterogeneous tasks—such as reading analog gauges, recognizing digital gauges, checking switch/LED states, and conducting qualitative appearance diagnostics (e.g., cleanliness and corrosion)—must be processed on a single robotic platform. In addition, the spatial registration problem of matching various detected objects with checklists in the inspection database must be accurately resolved. Moreover, conventional robotic inspection systems are typically engineered for a specific facility layout, requiring extensive redesign of control logic whenever the target site or operating environment changes.
To address these complex challenges, this study proposes the Artificial Intelligence-integrated Inspection Ecosystem (AIIE) as a Physical-AI-based, PHM-enabling autonomous condition monitoring platform. Here, Physical-AI refers to an edge-based intelligent-system paradigm in which AI inference is embedded directly into physical devices, enabling autonomous on-site decision-making and execution without cloud dependency. The AIIE targets the data acquisition and condition monitoring layers of the PHM pipeline, and we validated its performance at the underground power ICT infrastructure facilities of the Korea Electric Power Corporation (KEPCO) Power ICT Daejeon Center. By mitigating the subjectivity and repetitive burden of manual inspections, the AIIE provides a continuous, high-quality stream of operational data, establishing a solid data foundation for downstream PHM tasks, such as anomaly detection and degradation trend analysis. These downstream prognostic functions remain beyond the present scope and are addressed as future work.
The novelty and major contributions of this study are as follows:
1. Empirical validation of a PHM-oriented autonomous condition monitoring system in an operational environment: While many conventional studies remain limited to proof-of-concept validation in controlled laboratory settings, this study conducts an empirical investigation in an operational underground facility of power ICT infrastructure. By integrating the autonomous navigation of a quadrupedal robot, deep-learning-based object detection, and qualitative inference from recent vision-language models (VLMs), we demonstrate the continuous operational reliability of the AI-based condition monitoring system. This system generates structured time-series data necessary for downstream prognostics and preventive maintenance.
2. Establishment of a three-layer abstraction architecture designed for site-independent deployment: To overcome the limitations of conventional systems that require a complete redesign of control logic whenever an inspection target facility or operating environment changes, we establish a three-layer abstraction architecture that isolates roles into directive (defining health monitoring policies), orchestration (intelligent resource scheduling and control), and execution (performing unit sensing and diagnostic tasks). This architecture separates PHM policies from hardware details to facilitate site-independent deployment. The validation of portability in heterogeneous environments remains a future research topic.
3. Multi-agent collaboration for integrated condition assessment across heterogeneous facility types: To address the complexity of industrial PHM sites, we propose a multi-agent collaborative architecture in which each agent specializes in a distinct condition monitoring modality to overcome the limitations of a single general-purpose model. Heterogeneous facilities with markedly different health indicators and reading mechanisms—including analog gauges (computer vision and geometric calibration), digital gauges (Optical Character Recognition (OCR) optimization), switch/LED states (discrete classification), and qualitative appearance defects such as cleanliness and corrosion (VLM-based inference)—are evaluated independently within a unified framework. This design improves computational efficiency and yields a health assessment engine that allows the addition or modification of sensing logic for any facility type without disrupting the overall PHM pipeline.
2.1 Robot-Based Automated Inspection of Industrial Facilities
As the demand for automated inspection of social infrastructure continues to increase, studies integrating various robotic platforms and computer vision technologies have attracted growing interest. A systematic literature review by Halder and Afsari [1] analyzed 269 papers to provide a comprehensive overview of research in building and infrastructure inspection robotics. This review demonstrated that Unmanned Aerial Vehicles and Unmanned Ground Vehicles lead the inspection field, and categorized the applications of automated inspection into five major domains: maintenance inspection, construction quality inspection, construction progress monitoring, as-built modeling, and safety inspection. The review also highlighted the spatial constraints of fixed single-sensor systems and the need for mobile robotic platforms that adapt to different infrastructure environments. Lee et al. [2] surveyed robotic technologies for civil infrastructure inspection, and further introduced a hierarchical graph-based SLAM (HG-SLAM) technique that fuses IMU, camera, and 3D LiDAR data to enable UAV-based bridge inspection under GNSS denial, together with a multi-layer coverage path planner (ML-CPP) that improves flight efficiency and inspection completeness for UAV-based structural coverage.
Focusing specifically on power facilities, Wei and Rey [3] reviewed the technical status of substation inspection robots. They emphasized that multi-sensor fusion and three-dimensional (3D) Light Detection and Ranging (LiDAR)-based SLAM technologies are essential for avoiding complex obstacles in substations and planning inspection paths, identifying the development of real-time, high-precision navigation and simplified environmental perception algorithms as key challenges for future work. Mineo et al. [4] proposed a geometric and volumetric autonomous inspection framework for free-form components using a six-degree-of-freedom robotic arm and an ultrasonic testing sensor. By departing from conventional offline programming methods and solving the shortest path problem online with the A* algorithm, they demonstrated that fully autonomous single-pass inspection combining real-time robot control and sensor feedback is feasible. Konstantinidis et al. [5] proposed AROWA, an autonomous robot framework for Warehouse 4.0 health and safety inspection operations. This system uses deep learning models such as You Only Look Once (YOLO) and Mask Region-based Convolutional Neural Network (Mask R-CNN) to detect risk factors including fire, flooding, blocked passages, and non-use of personal protective equipment (PPE) without human intervention, and is integrated with a warehouse management system. However, it does not address integrated AI reading algorithms or precision measurement functions for heterogeneous equipment.
As illustrated in Fig. 1, the practical deployment of industrial quadruped robots has attracted significant attention. Boston Dynamics’ Spot has been deployed for unmanned patrol inspections combining thermal imaging cameras, gas sensors, and Red-Green-Blue (RGB) cameras in various hazardous environments such as refineries, power plants, and construction sites, with real-world use cases reported by global energy corporations. ANYmal by ANYbotics [6,7] is an explosion-proof certified, IP67-rated industrial quadruped robot specialized for offshore High-Voltage Direct Current platforms in the North Sea and European energy/chemical plants. This system is equipped with optical/thermal cameras and LiDAR on a pan-tilt head, and performs acoustic diagnostics of machinery such as pumps using a built-in microphone, and leverages autonomous patrol data for preventive maintenance. Deep Robotics in China [8] introduced quadruped robots to inspect substations and power facilities, establishing facility condition monitoring systems through autonomous navigation-based patrols and image data collection, and Energy Robotics [9] provides a software ecosystem that manages these robots through an integrated platform and links AI analysis results with maintenance decision-making.
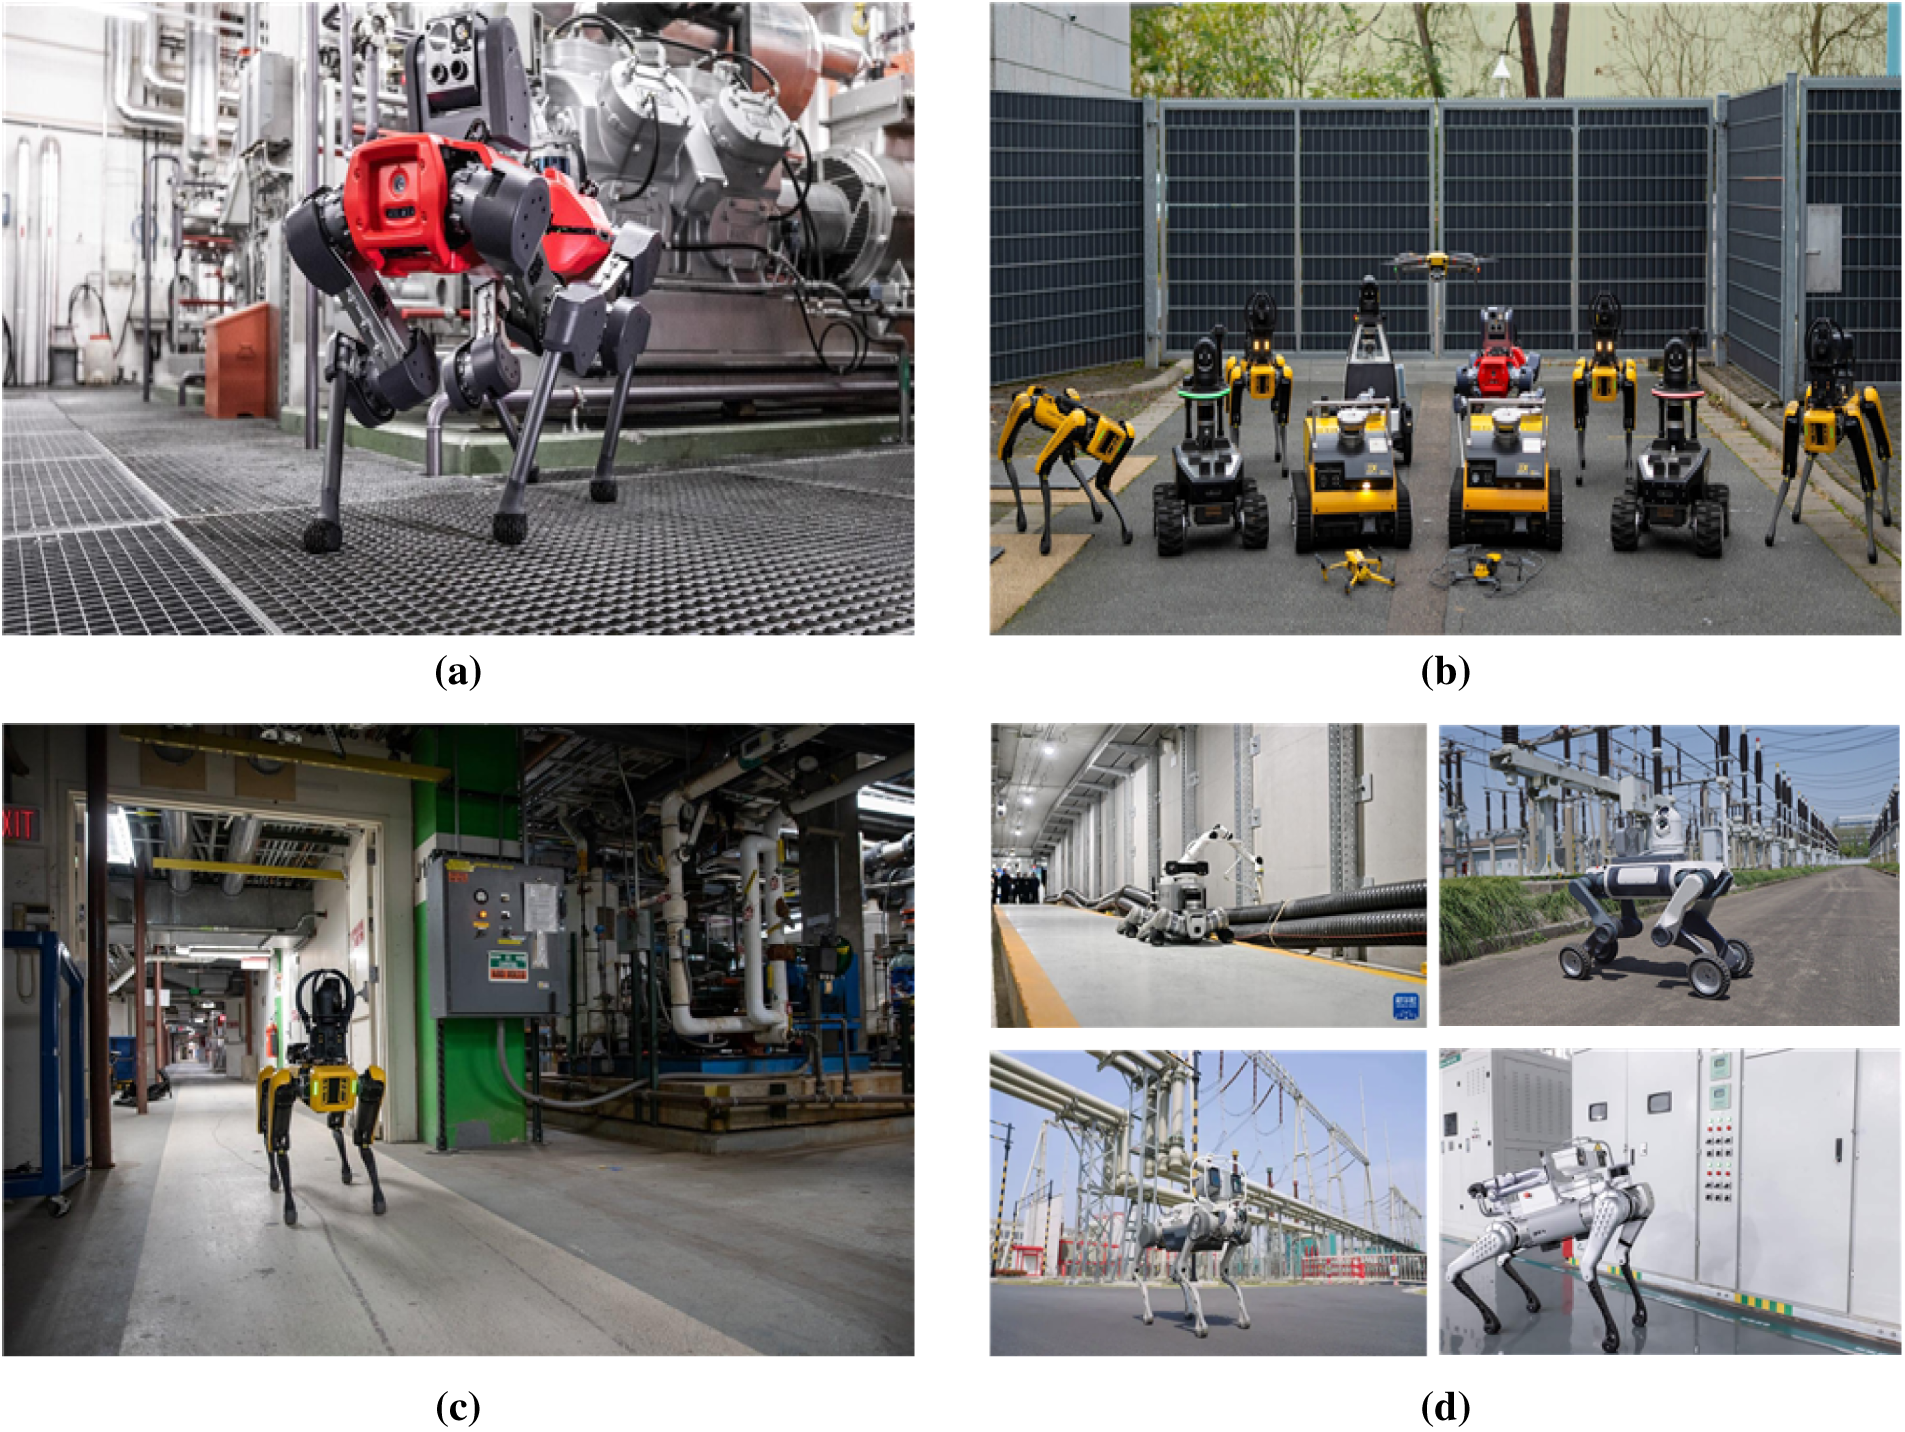
Figure 1: Major industrial quadruped robots. (a) ANYbotics ANYmal (b) Energy Robotics (c) Boston Dynamics Spot (d) Deep Robotics quadruped robot.
Underground infrastructure environments, such as the KEPCO Power ICT Center, possess unique characteristics differentiating them from conditions assumed in previous studies. Conventional wheeled mobile robots have practical limitations in path planning due to narrow passages, high-density equipment layouts, and coexisting irregular steps and obstacles. Conversely, quadruped robots not only ensure stable locomotion in unstructured terrains through their multi-jointed walking structure but also enhance visual recognition accuracy by dynamically securing an appropriate viewpoint of sensors through active posture control. Table 1 presents a comparative analysis of the characteristics of conventional wheeled mobile robots, general-purpose quadruped robots, and the approach proposed in this study.
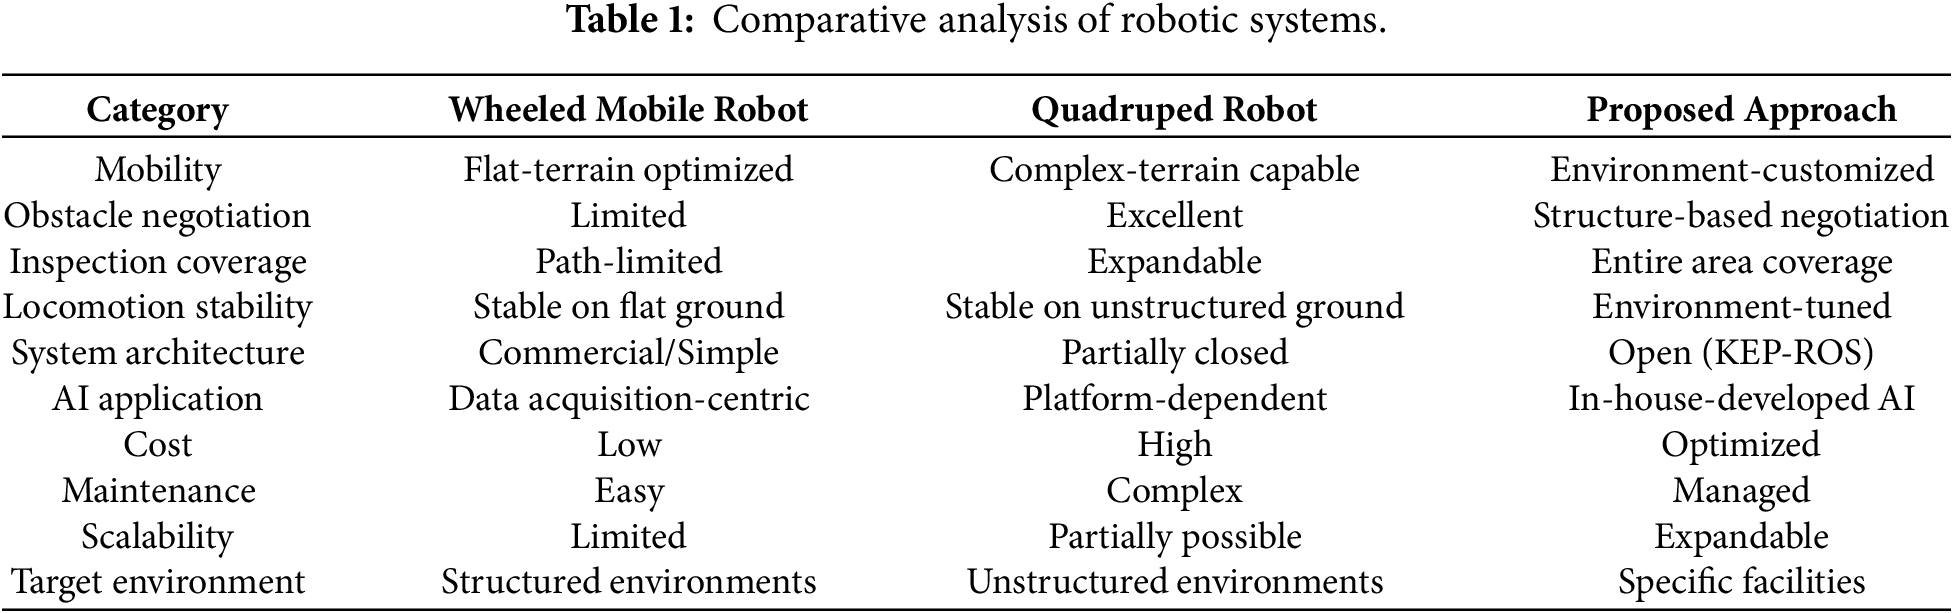
The studies above demonstrate mobile robotic automation for individual inspection domains, but most remain restricted to navigation or detection specialized for a single equipment type or facility, without addressing the integrated inspection of heterogeneous equipment modalities required in enclosed underground environments. As a result, direct application to the integrated inspection of heterogeneous equipment within enclosed and complex environments, such as underground power ICT infrastructure, remains challenging. This study addresses this research gap by integrating a three-layer (directive-orchestration-execution) multi-agent architecture with a quadrupedal robot to propose a system capable of processing analog gauges, digital gauges, switches, LEDs, and qualitative anomaly diagnosis within a single integrated framework.
2.2 Vision-Based Automatic Gauge Reading
In industrial robotic inspection, automatic gauge reading is a critical technology directly linked to system safety. Accordingly, both analog and digital gauges have been studied extensively.
A primary challenge in analog gauge reading is the significant decline in pointer orientation estimation accuracy, which is caused by image quality degradation factors inherent to real-world environments, such as illumination variations, oblique viewpoints, reflections, and occlusions. To address this issue, Dong et al. [10] proposed a vector detection network (VDN) that models the pointer as a two-dimensional vector. The VDN simultaneously estimates a heatmap for the pointer tip and a scalar map representing the orientation using a ResNet-based backbone, thereby jointly detecting multiple needles. An end-to-end pipeline was constructed to first detect the gauge by deploying a region-based convolutional neural network (R-CNN) and subsequently derive the reading through template matching, demonstrating real-time reading capabilities on their proprietary Pointer-10K dataset.
Approaches integrating gauge detection, viewpoint rectification, and value conversion into a single pipeline have also been widely studied. GAUREAD, proposed by Milana et al. [11], detects circular analog gauges by deploying YOLOv4-tiny and applies a geometric perspective rectification algorithm that overcomes the limitations of the Hough transform to correct gauge faces distorted into ellipses due to oblique viewpoints. Consequently, a reading error within 3% for viewpoints below
Automated industrial inspections suffer from a chronic data scarcity problem, where data are biased toward normal states, making it difficult to acquire images of critical anomalies or diverse lighting conditions. Zhang et al. [14] proposed ADD-GAN to generate synthetic defect images of substation equipment for unmanned patrol inspection, raising the mAP of a YOLOv7 detector from 71.9% to 81.5% under defect-image scarcity. In a similar manner, Xu et al. [15] addressed data scarcity by converting safety regulations into structured prompts and using text-to-image generative models, such as DALL
However, these prior studies share a common limitation: most are specialized for a single type of analog gauge or assume controlled capturing conditions where preprocessing is omitted. To overcome these limitations, our analog gauge inspection agent adopts the P2-YOLO-Pose structure [16], which simultaneously detects the center of the rotation axis and the pointer tip through YOLO-Pose-based keypoint extraction. It is designed as a hybrid pipeline that preemptively resolves lens distortion and oblique viewpoint issues through homography-based orthographic projection using elliptical region of interest (ROI) optimization. This design is intended to achieve more robust pointer orientation inference under lens distortion and oblique viewpoints than prior approaches based on the OpenCV Hough transform [17] that utilize the geometric characteristics of circular analog gauges or ellipse fitting [12].
For digital gauge reading, arbitrary-shape scene text detection technology is directly relevant. TextSnake, proposed by Long et al. [18], employs a geometric model that represents text as a sequence of overlapping disks along a symmetric axis. This method effectively detects scale variations and curved text, reaching state-of-the-art performance in curved and multi-oriented text detection at that time, and laying the foundation for subsequent scene text detection research. Conventional OCR-based approaches have advanced rapidly. Early methods relied on pattern-matching techniques, such as Tesseract [19]. Subsequent approaches adopted deep-learning-based models, including EasyOCR [20] and PP-OCR [21]. Most recently, Transformer-based technologies such as TrOCR [22] and GLM-OCR [23] have demonstrated high performance in scene text recognition. However, these OCR methods suffer from issues unique to seven-segment displays in power facility environments, such as font misrecognition, false detection of surrounding nameplate or model-name text caused by unspecified ROIs, and missing decimal points. Our quantitative evaluation demonstrates that directly applying OCR to digital gauge reading yields only 46.9% accuracy. Accordingly, this study aims to overcome the limitations of conventional OCR by leveraging the ability of small vision-language models (sVLMs) to read values in context. Recently, Lin et al. [24] proposed MeasureBench, which systematically benchmarks the gauge reading capability of VLMs and shows that even state-of-the-art VLMs struggle with fine-grained measurement reading, with imprecise spatial grounding of pointers and scale markings as a dominant failure mode that motivates task-specific, context-aware adaptation rather than naive zero-shot inference.
2.3 Industrial Application of Vision-Language Models
Large-scale VLMs, trained on extensive web data, have demonstrated zero-shot inference capabilities in various visual tasks, leading to their rapidly expanding application in industrial safety and inspection. A comprehensive survey by Zhang et al. [25] categorized the development of VLMs into three methodological pillars: pre-training objectives (contrastive, generative, and alignment objectives), downstream transfer learning (prompt tuning and feature adapters), and knowledge distillation. The study quantitatively discusses the zero-shot applicability of a single VLM to cover a wide range of visual recognition tasks, extending from simple image classification to fine-grained object detection and segmentation. Awais et al. [26] investigated the lineage of vision foundation models and emphasized that textual and visual prompting achieve task adaptation without requiring additional parameter retraining. However, they identified critical unresolved challenges for practical industrial deployment, including vulnerability to hallucinations (where large models fabricate responses by relying solely on the prior knowledge of text prompts while ignoring visual inputs), a lack of understanding of complex physical laws in the real world, and bias stemming from training datasets.
To address these limitations, a growing body of research has demonstrated the practical applicability of VLMs in industrial safety fields with constrained computational resources. Xu et al. [15] combined generative AI-based data augmentation and object detection results with structured prompt inputs for VLMs to analyze PPE compliance in high-altitude work, recording a compliance reasoning accuracy of 87.6% with the Qwen2.5-VL:7B baseline. While large VLMs possess strong contextual reasoning capabilities, they are unsuitable for real-time edge monitoring due to excessive computational demands. Conversely, sVLMs with parameters under 4B are computationally efficient but suffer from decreased accuracy in complex construction environments and are prone to hallucinations that cause them to miss critical risk factors. To resolve this trade-off, Adil et al. [27] proposed a detection-guided framework that integrates the spatial precision of an object detection model (YOLOv11n) with the multimodal reasoning of an sVLM. By converting the spatial coordinate and class information of detected workers and construction machinery into structured text prompts to guide the reasoning of the sVLM, the F1-score for construction site risk detection improved from 34.5% to 50.6% when using the Gemma-3:4B model. This approach was demonstrated to reduce speculative false positives and substantially improve the semantic quality of the generated rationales (BERTScore) from 0.61 to 0.82, while introducing an inference overhead of only 2.5 ms per image. The few-shot adaptation capabilities of VLMs to address data scarcity in specialized domains are also being actively researched. In the industrial inspection domain, Ueno et al. [28] fine-tuned a VLM with web-collected product images and inspection-criteria texts, and applied in-context learning so that a single exemplar image with explanatory text could adapt the model to new products without retraining. Their method achieved an F1-score of 0.950 (Matthews correlation coefficient (MCC) of 0.804) on MVTec AD in a one-shot setting, demonstrating that minimal in-context learning enables rapid adaptation to specialized inspection targets. Moreover, training large-scale VLMs from scratch in resource-constrained research environments or specialized industrial domains requires prohibitive computational resources. To overcome this challenge, Cao et al. [29] proposed a generalized domain prompt learning framework that combines a small number of prompt samples (16 per class) with small-scale domain-specific foundation models. They demonstrated that natural-image-based VLMs could be successfully transferred to five specialized domains, including remote sensing, medicine, and geology, without significant computational overhead by leveraging quaternion networks and low-rank adaptation techniques. This finding aligns with our objective of maximizing the domain adaptation capability of VLMs under constrained computing resources, such as edge robotic environments. Regarding inference efficiency, Giedra et al. [30] benchmarked twelve compact open-weight large language models (LLMs) (sub-1B to 8B parameters) deployed using Ollama on an NVIDIA Jetson Orin Nano, linking response quality with measured throughput, power, and energy efficiency. GPU-accelerated inference more than doubled the median throughput (from 7.12 to 18.13 tokens/s) while improving energy efficiency from 0.453 to 0.823 tokens/J, quantitatively confirming that carefully selected small models can satisfy the latency and power constraints of edge deployment. Guided by this efficiency analysis and the visual perception limitations of existing VLMs, we selected the Qwen-VL family [31], which features an architecture specialized for fine-grained visual understanding, text reading, and visual grounding, as the baseline model in this study. Qwen-VL combines a visual receptor with a language model and is trained through a three-stage training pipeline leveraging a multilingual multimodal corpus to enhance detailed geometric cognitive capabilities. Recently, in addition to Qwen3-VL:8B [32], various multimodal VLMs with optimized performance-to-size ratios, such as Qwen3.5-Omni [33] and Gemma 4 [34], have been developed. Considering both edge-device inference efficiency and fine-grained visual understanding capabilities, Qwen3-VL:8B is deployed as the primary on-device model. Furthermore, an optimized pipeline is proposed to minimize hallucinations and support reliable status reading and anomaly diagnosis in complex industrial equipment inspection environments.
While much of the existing industrial VLM application literature has focused on cloud-based large-scale models or binary classification, this study proposes a pipeline specialized for industrial qualitative diagnosis. This pipeline integrates visual question answering (VQA) based on a five-point rubric, 4
2.4 AI-Fused Spatial Alignment and Inference Optimization
In robotic inspection systems, spatial matching that precisely correlates equipment objects detected by a camera with inspection points in a database requires the seamless integration of 3D localization and object matching algorithms. Fan et al. [35] proposed a collaborative mapping framework based on ORB-SLAM3 for robotic navigation and localization in unknown environments, demonstrating improved map construction efficiency and real-time performance. In monocular depth estimation, deep-learning-based relative depth map estimation technologies have advanced, led by MiDaS [36]. Recently, highly generalized models that generate dense depth maps, such as Depth Anything 3 [37], have been widely used for 3D spatial reconstruction combined with camera extrinsic parameters. However, deep-learning-based depth models impose practical constraints in edge robotic environments where hundreds of objects must be processed in real time, owing to high inference latency, high computational resource consumption, and the difficulty of absolute scale recovery. For object detection-based spatial partitioning, edge computing environments with demanding real-time processing requirements necessitate a strict balance between model inference speed and accuracy. Ataei et al. [38] compared YOLOv7, YOLOv7-tiny, and the two-stage Faster R-CNN detector for wind turbine structural damage detection, reporting that YOLOv7 achieved the highest accuracy (82.4% mAP@50) among the three. Furthermore, according to a study by Khanam and Hussain [39] analyzing the latest YOLOv11 architecture, YOLOv11 introduces the more computationally efficient C3k2 block, a refined Cross Stage Partial (CSP) bottleneck, alongside a dedicated C2PSA block that enhances spatial attention in the feature maps, together restricting the parameter count while significantly enhancing feature extraction capabilities for small or occluded objects. Inheriting the development of the YOLO series initiated by Redmon et al. [40], this study constructed a YOLOv8n-based 68-class detection model, yielding a mean average precision (mAP@0.5) of 97.31% under training conditions with
Regarding label matching, approaches such as ontology matching with large language model embeddings [41] and subword-level embeddings for lexical matching [42] have been explored to resolve lexical discrepancies between heterogeneous systems. However, these methods are computationally expensive and may fail to ensure the deterministic behavior required for real-time inspection systems in edge environments. This study develops a four-tier cascade label matching engine that sequentially applies exact matching (Tier 1), suffix tolerance (Tier 2), explicit LABEL_MAP (Tier 3), and stem containment (Tier 4) following normalization preprocessing. This engine achieved a 0% matching error rate for all detected samples (Exp2), indicating that a deterministic matching system can serve as a practical alternative for industrial deployment without requiring complex embedding-based models.
2.5 Prognostics and Health Management of Critical Infrastructure
PHM is a systematic engineering field that integrates data acquisition, health indicator construction, fault diagnosis, remaining useful life (RUL) prediction, and maintenance decision support to guarantee the reliability and availability of complex systems [43]. Lei et al. [43] provided a comprehensive review of machinery prognostics covering the entire pipeline from data acquisition to RUL prediction, emphasizing that the quality and continuity of condition data acquired from monitored assets represent a fundamental prerequisite upon which all downstream prognostic processes depend. Si et al. [44] systematically reviewed statistical data-driven approaches for RUL estimation, clarifying that observable health indicators obtained through condition monitoring serve as the primary inputs for RUL models, and that the diversity and consistency of these indicators directly govern prediction reliability.
With the rapid advancement of artificial intelligence, data-driven methodologies have become the dominant paradigm for the PHM of industrial systems. Zhao et al. [45] surveyed deep learning applications for machinery condition monitoring, including autoencoders, deep belief networks, convolutional neural networks, and recurrent neural networks, demonstrating that deep learning provides powerful tools for extracting health-related features from high-dimensional sensor data. Zhang et al. [46] surveyed data-driven methodologies for predictive maintenance (PdM) across industrial equipment, classifying applications according to machine learning and deep learning algorithm types. They highlighted that most existing PdM research relies on public benchmark datasets of well-instrumented rotating machinery, while relatively few studies have addressed heterogeneous and multimodal equipment environments characteristic of actual infrastructure sites. Serradilla et al. [47] surveyed deep learning models for predictive maintenance across industrial domains, noting that data acquisition quality, continuity, and multimodality represent major bottlenecks that restrict the practical deployment of PdM in complex industrial environments.
A key challenge commonly highlighted by these survey studies is the data acquisition gap. In environments where thousands of heterogeneous inspection points—encompassing analog gauges, digital gauges, switches and LED indicators, and qualitative visual condition inspection items—cannot be cost-effectively instrumented with dedicated fixed sensors, the continuous and structured health data stream required for AI-based PHM pipelines is absent. Traditional data acquisition methods—such as fixed sensor arrays, periodic manual readings, or supervisory control and data acquisition (SCADA) system logs—are suitable for well-instrumented rotating machinery. However, they exhibit severe limitations in physically complex and heterogeneous equipment environments where inspection methods and spatial arrangements vary significantly across zones.
This data acquisition gap serves as the primary motivation for the autonomous mobile inspection platform proposed in this study. By positioning the proposed AIIE as the data acquisition and condition monitoring backbone of the PHM pipeline, this study enables structured, continuous, and auditable health records across heterogeneous equipment types. These records provide the multimodal condition data streams necessary to support downstream fault diagnosis, anomaly trend analysis, and predictive maintenance decision-making in underground power ICT infrastructure.
3 Proposed System Architecture
This section describes the configuration and development details of the patrolling, inspection, and diagnosis technologies developed for a mobile robot, applicable to the underground infrastructure environment of the KEPCO Power ICT Center. Based on the inspection targets and phased automation plan established through the inspection environment analysis (Section 3.1), an inspection system integrating a robotic platform, sensor configurations, autonomous driving technology, and image-based AI analysis technology was developed. The system was implemented to enable the robot to autonomously navigate the underground infrastructure, inspect equipment conditions, and determine the presence of anomalies based on the acquired data. Rather than relying on commercial platforms, we prioritized developing inspection technologies optimized for power facility environments through a proprietary robot operating system and AI analysis framework.
3.1 Inspection Environment Analysis
We derived the patrolling, inspection, and diagnosis items for the underground infrastructure of the KEPCO Power ICT Center based on the patrol inspection manuals currently in use.
3.1.1 Derivation of Inspection Items and Data Analysis
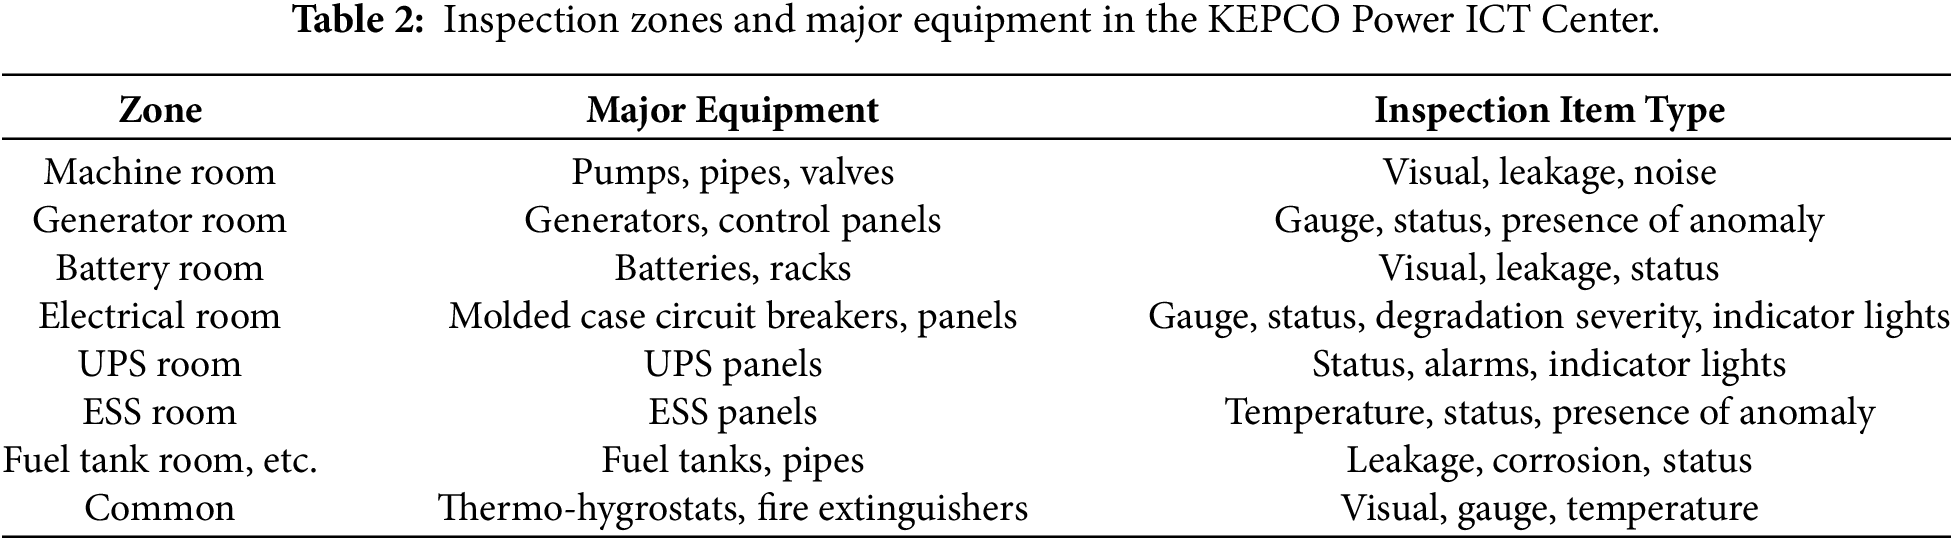
As illustrated in Fig. 2, the underground infrastructure comprises 11 inspection zones: the energy storage system (ESS) room, UPS room, machine room, battery room, fuel tank room, generator room, fire extinguishing agent room, Halon fire extinguisher room, control room, electrical room, and other common areas. Among these, seven zones—the machine room, fuel tank room, generator room, battery room, electrical room, UPS room, and ESS room—were selected as robot-assisted inspection areas. For each selected zone, we reviewed the types, installation formats, inspection methods, and accessibility of the major equipment. Through this survey, a total of 1240 inspection points were identified in the underground infrastructure of the KEPCO Power ICT Center, and all collected data were used in the subsequent analysis. The main inspection areas and major equipment types are summarized in Table 2.
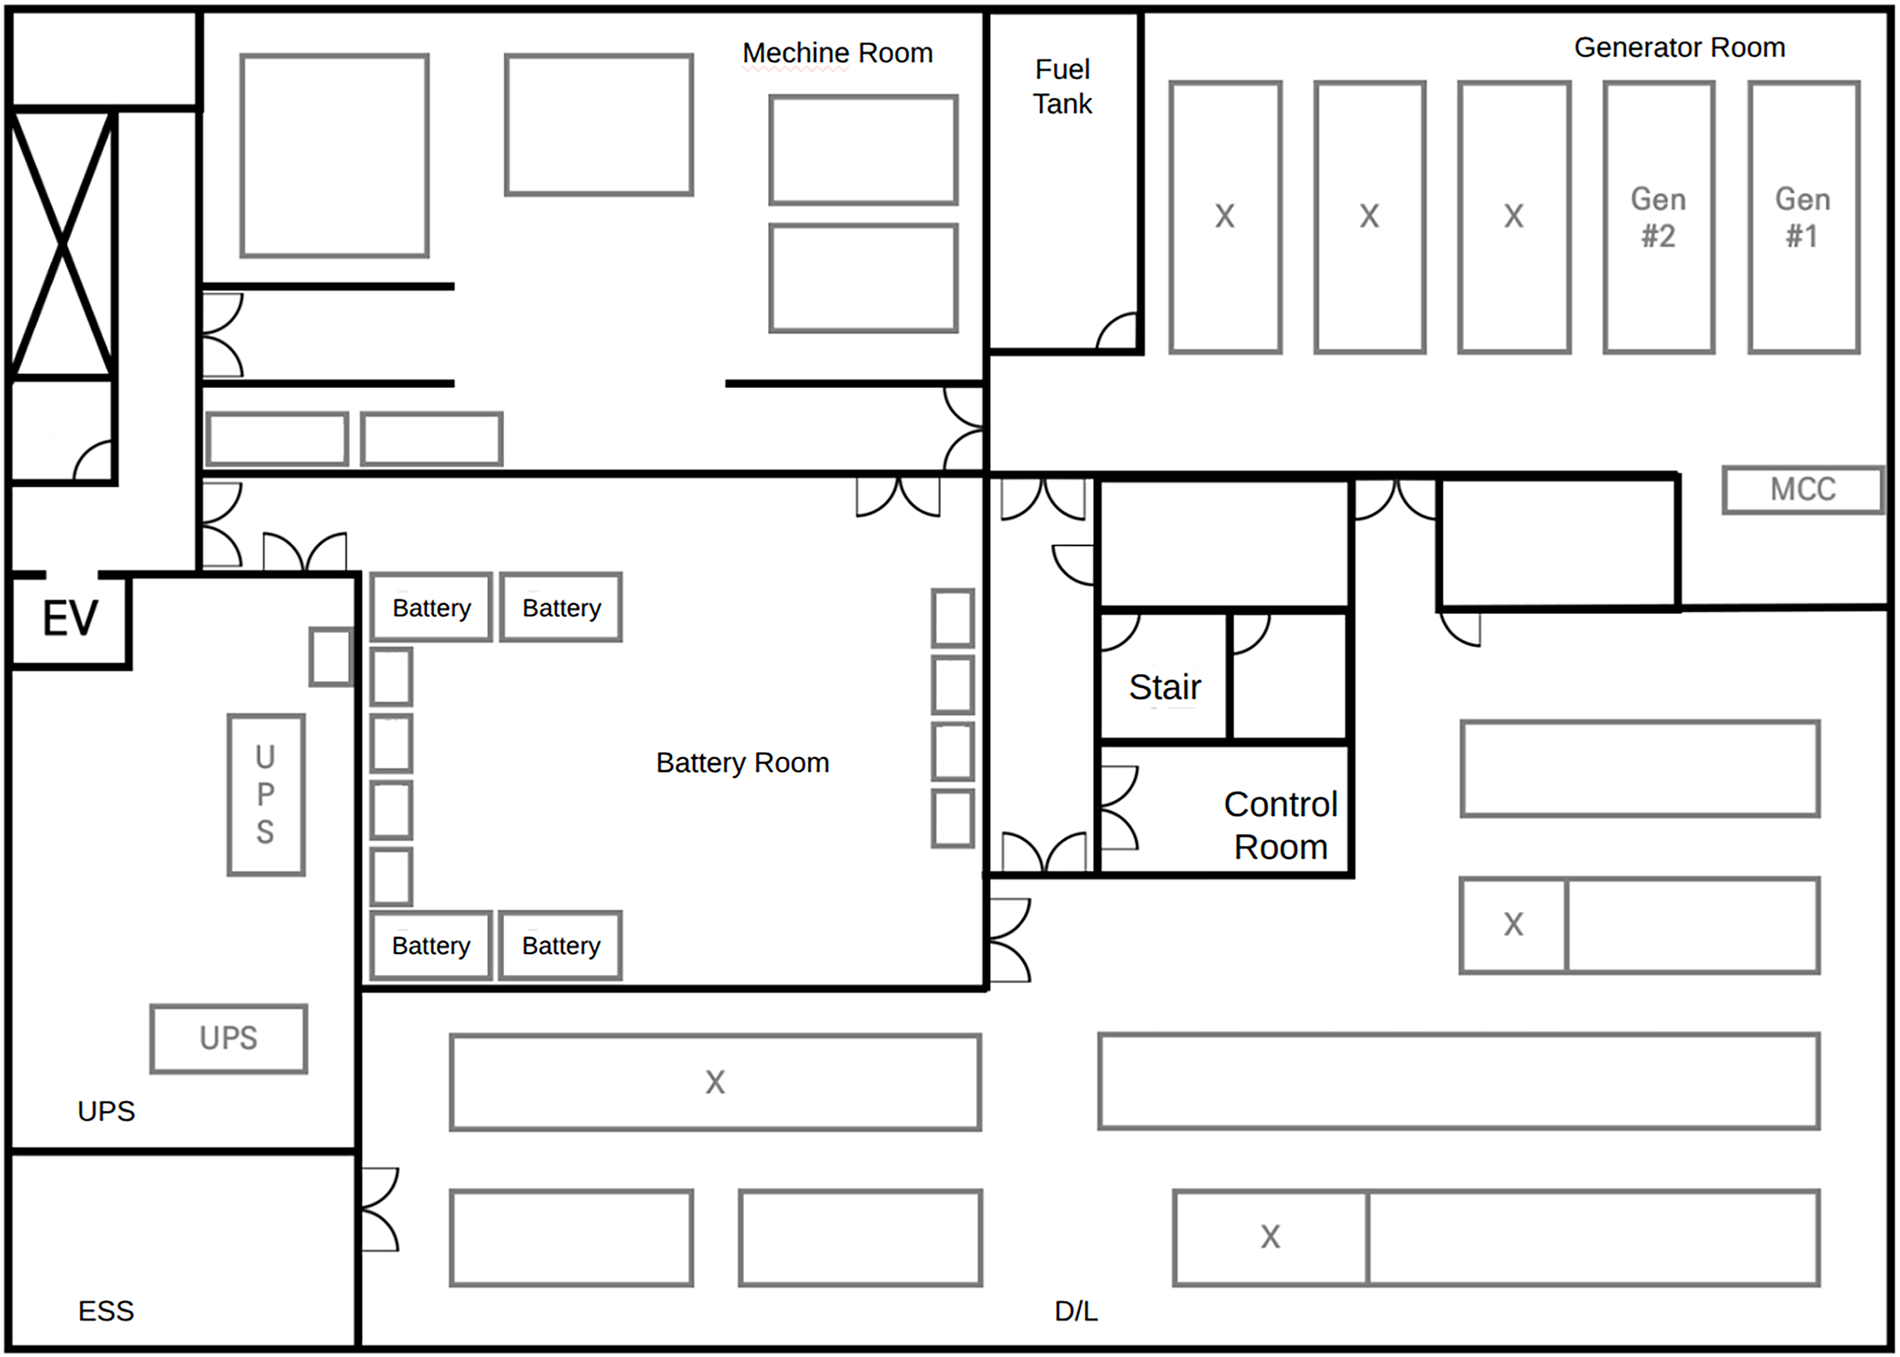
Figure 2: Inspection map of the underground infrastructure of the KEPCO Power ICT Center.
We defined inspection items in detail according to the actual unit of inspection execution, rather than calculating them solely based on the quantity of equipment. Even for the same equipment, if the inspection objectives differed—such as visual inspection, gauge reading, status indicator checking, leakage inspection, and environmental condition monitoring—they were classified as independent inspection points. This approach fully incorporated the actual work units performed in the conventional human-centric inspection system. We classified the derived inspection items into observation, reading, manipulation, and environmental measurement types according to their inspection methods and data characteristics, as summarized in Table 3. Observation-type items involve checking for visual anomalies, signs of leakage, corrosion and contamination, and the status of indicators. Reading-type items involve reading and determining gauge values, including circular analog gauges, digital gauges, and instrument displays. Manipulation-type items require physical intervention, such as button operations, panel opening and closing, and equipment operation checks, whereas environmental measurement-type items are classified as those measuring surrounding environmental conditions, such as temperature, humidity, volatile organic compounds (VOCs), nitrogen oxides (

This classification clarifies the sensing methods and work characteristics required for each inspection item, establishing a baseline for analyzing robotic applicability. A significant portion of the derived inspection points corresponds to repetitive and standardized tasks, such as visual inspections of equipment exteriors, gauge readings, and status indicator checks, examples of which are shown in Fig. 3.
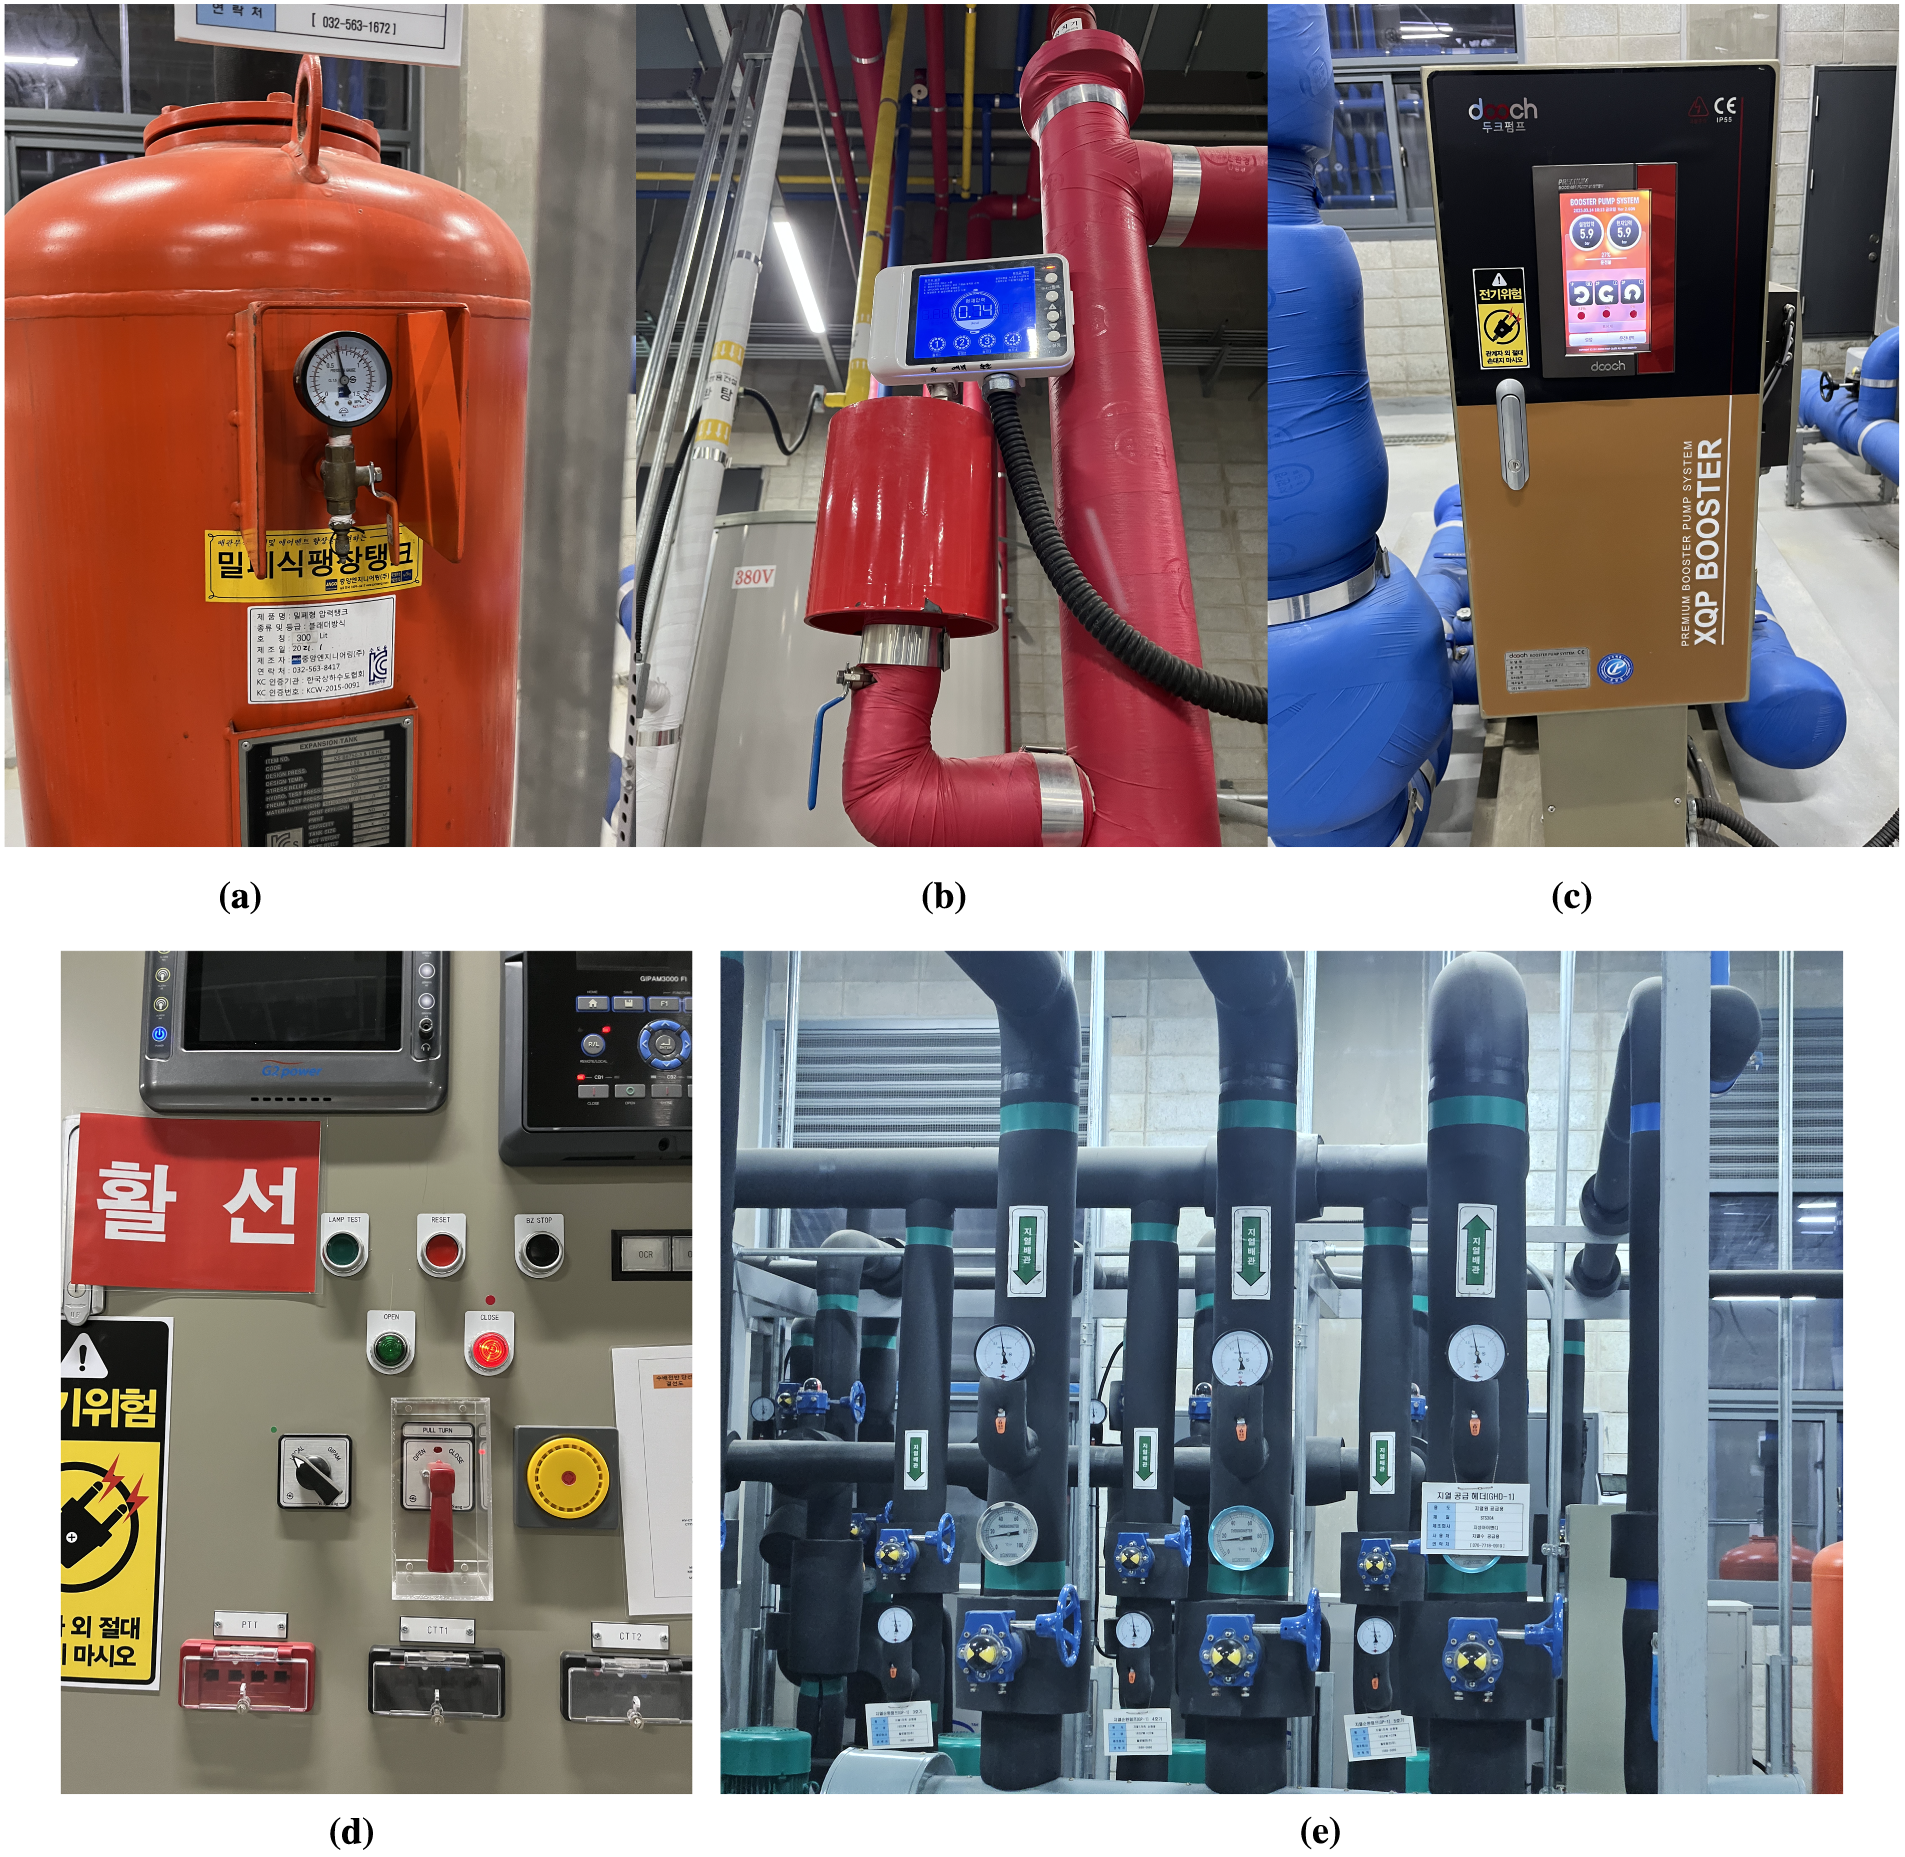
Figure 3: Various forms of equipment including panels, gauges, and piping. (a) Pressure vessels and gauges (b) Halon fire extinguishers (c) Control panels (d) Switch and button (e) Multiple piping structures.
3.1.2 Classification of Inspection Points
Based on the analysis of robotic applicability for the derived inspection items, we classified each inspection point into immediately inspectable, development-required, or uninspectable categories according to the current state of technology. In this classification, we weighed practical field applicability alongside technical feasibility—robot accessibility to the target location, equipment visibility from the robot’s viewpoint, lighting and spatial conditions for data acquisition, and suitability for repetitive automated inspection.
Immediately inspectable points refer to items that the robot can inspect using current technology without additional development. This primarily includes inspection tasks that can be performed in a non-contact manner, such as visual verification, gauge reading, status indicator checking, and environmental data acquisition. Representative examples include checking for anomalies on equipment exteriors, inspecting for leakage and contamination, checking alarm and indicator states, reading analog and digital gauges, and measuring environmental data such as temperature and humidity. These items feature repetitive and standardized characteristics, representing areas where the automation effect is expected to be greatest, as the robot can determine states while navigating along a predetermined path.
Development-required inspection points refer to items that have robotic feasibility but require additional technical development or improvements in equipment and environments. Representative examples include inspections requiring the opening and closing of equipment panels and racks, inspections of equipment located in narrow spaces or shaded areas, zones where image-based recognition is challenging due to unfavorable lighting conditions, and interface manipulation items designed for human operators. This is because existing equipment was designed assuming human-centric inspection. Uninspectable points refer to areas where robotic application is challenging given the current state of technology and field conditions, making human-centric inspection unavoidable at this stage. This applies to cases where direct contact, precise manual operations, or internal equipment verification are essential due to the nature of the tasks. Examples include direct measurements using testers, internal inspections after opening equipment, continuous button operations, and complex field responses by operators (Fig. 4). This classification serves as a criterion for clearly establishing the current limitations of automation.
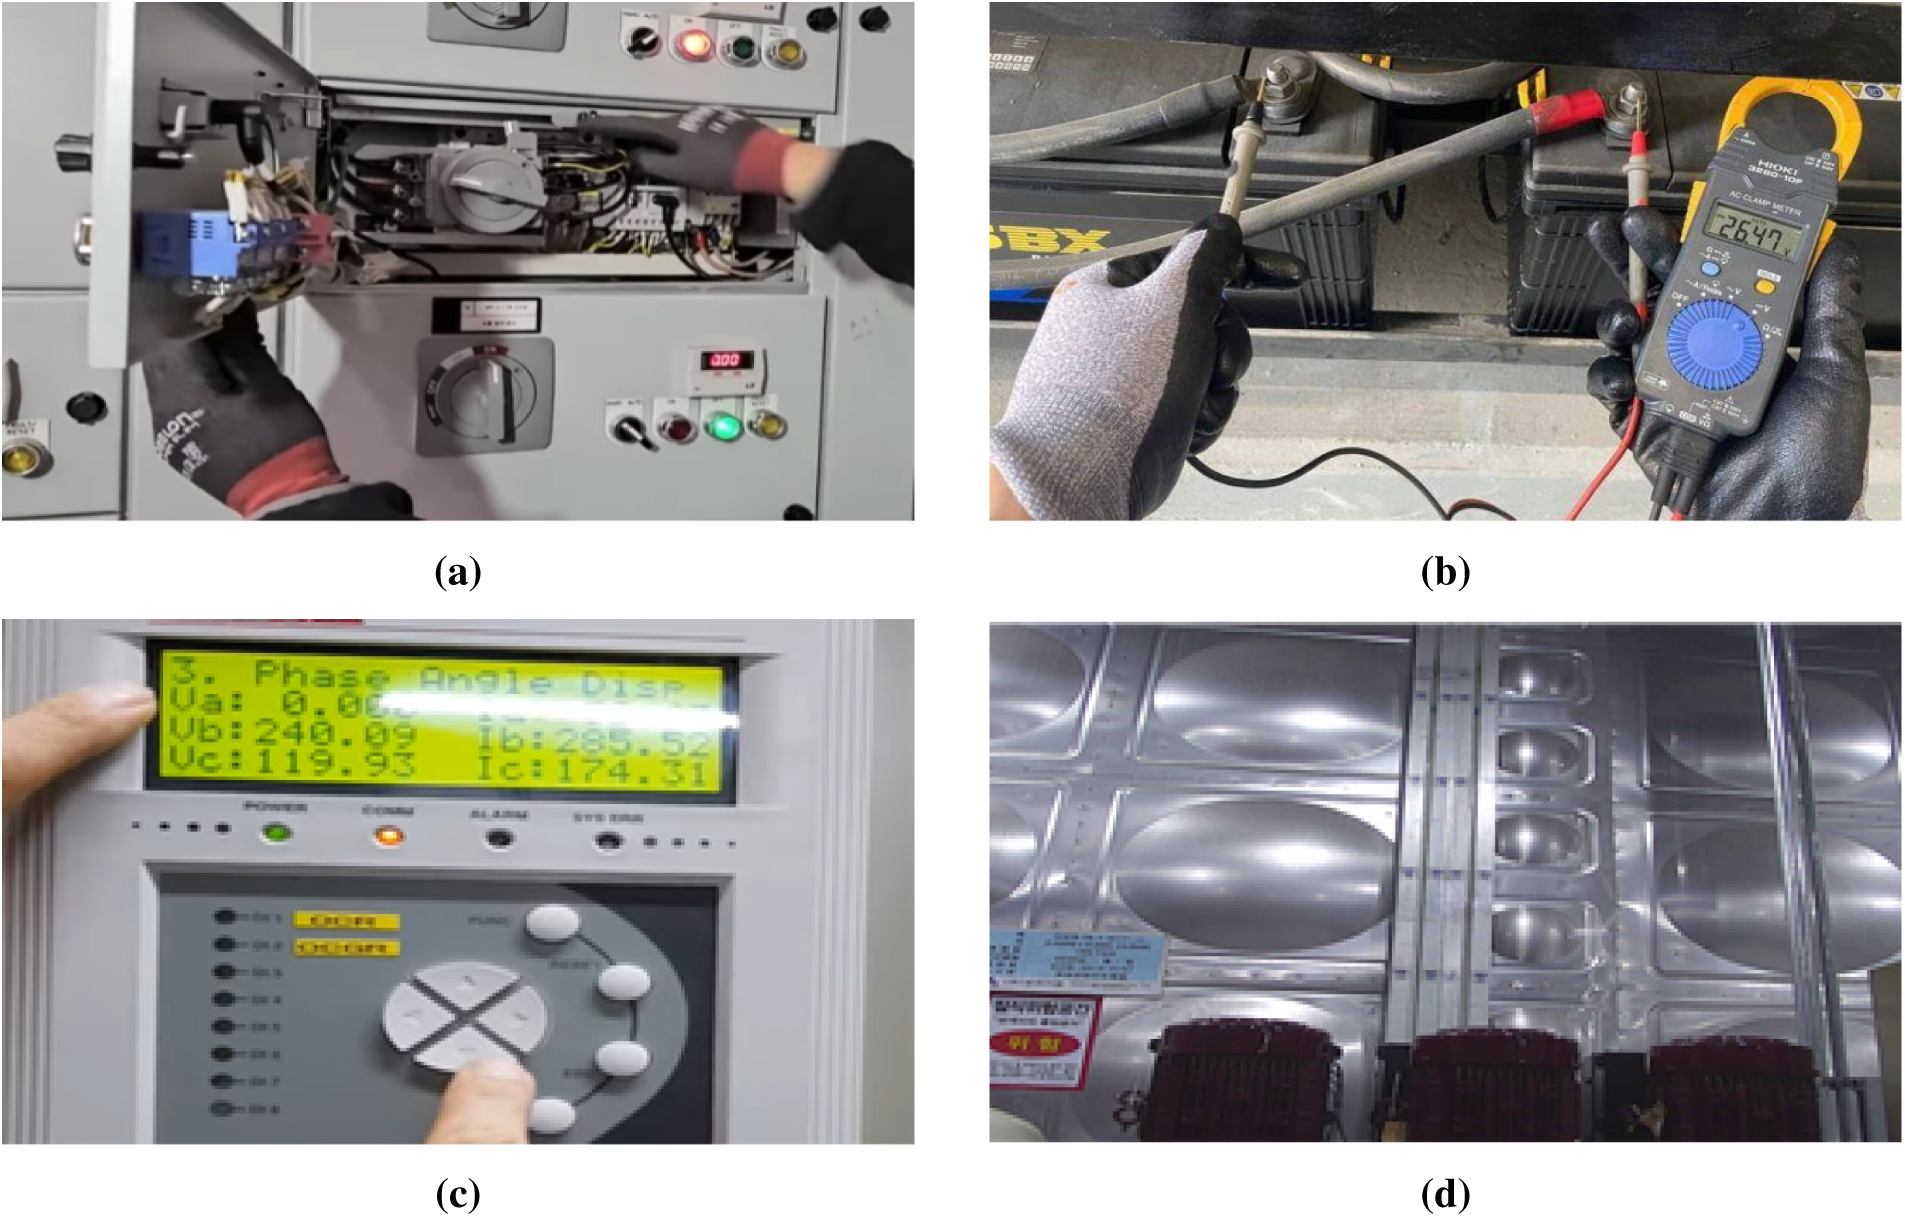
Figure 4: Key uninspectable inspection items. (a) Panel internal inspection (b) Direct measurement (c) Button operation (d) Long-range inspection.
3.1.3 Prioritization of Robot Application and Definition of Inspection Targets
Based on the inspection point classification, we established the priority of robot deployment and defined the scope of automation targets through a phased strategy that considers not only technological feasibility but also on-site effectiveness and operational efficiency. Robot deployment was first prioritized for immediately inspectable items, which account for approximately 57.8% of the total inspection points. Among these, priority went to items with high inspection frequency, items difficult to perform during nighttime or under limited manpower conditions, and items involving hazardous or low-accessibility environments, where automation yields substantial safety benefits.
We defined development-required points as mid-to-long-term targets and divided them into two phases: a technology-supplemented implementation phase, covering items resolvable through relatively simple improvements such as adding sensors or improving imaging conditions, and an environment-improvement-based expansion phase, covering items that require facility-side changes such as automatic opening and closing devices, interface improvements, and structural accessibility for robots.
Uninspectable items were excluded from the current automation scope and remain human-centric inspection areas; their automation feasibility will be continuously reviewed alongside future technological advancements and structural improvements of the facilities.
3.1.4 Inspection Scope and Coverage Analysis
The seven zones selected for robotic inspection (Fig. 2) each follow different inspection items and management standards depending on the function and operational purpose of their equipment.
The underground infrastructure exhibits high equipment density and distinct environmental characteristics for each zone. Some zones may experience high-temperature, high-humidity conditions or generate gas and noise, and tight clearances between equipment or cramped passageways are common. These structural characteristics directly influence mobility and accessibility during inspection. Because inspection locations vary—including panel interiors, floors, and the upper parts of equipment—inspection requires repetitive movement and diverse viewpoints.
We classify the inspection targets of the KEPCO Power ICT Center underground infrastructure by equipment type, as presented in Table 4. Among the total 1240 inspection points, 717 (57.8%) were set as autonomous robot inspection targets, while the remaining 523 (42.2%) are inspected in parallel by human operators due to physical access constraints (e.g., inside sealed cabinets and high-altitude equipment).
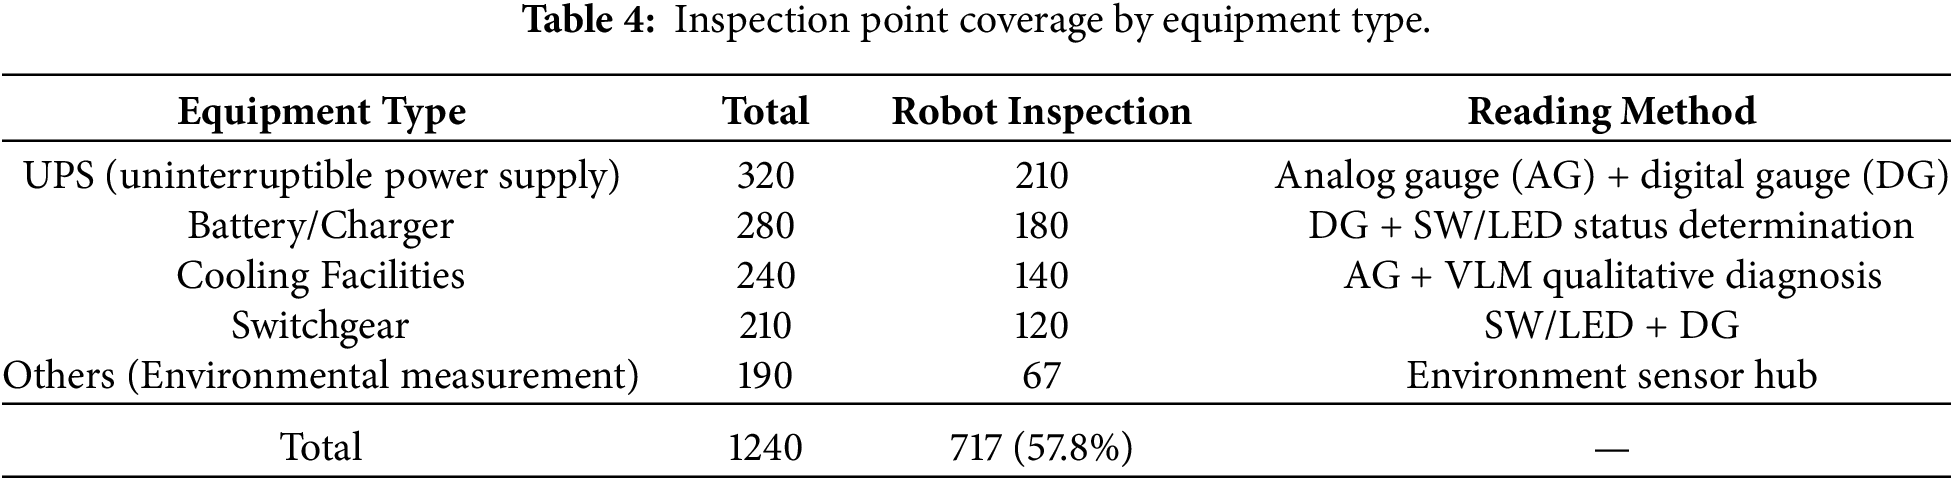
The KEPCO Power ICT Center is equipped with a monitoring system in the disaster prevention room that allows remote verification of operational information and status data for some equipment. However, in actual operations, patrol inspections to directly verify on-site conditions based on these data are performed concurrently, and inspection results are managed manually or using spreadsheet software. In addition, on-site inspections include items that are difficult to verify solely through the central monitoring system, such as equipment appearance anomalies, signs of leakage, corrosion and contamination, and the status of instruments and indicators, going beyond simple numerical checks. Consequently, numerous inspection items are still performed through direct visual inspection and judgment by operators.
As described above, the underground infrastructure of the KEPCO Power ICT Center has a structure where diverse equipment and complex environmental conditions coexist, characterized by clearly distinguished scopes and attributes of the inspection targets. Furthermore, a complementary equipment status inspection system is maintained through an operating framework where the central monitoring system and on-site patrol inspections are executed in parallel.
3.2 KEP-ROS: Open Multi-Robot Operating Framework
Although commercial quadruped robot platforms offer high mobility performance, proprietary payload policies and overseas-dependent maintenance create practical barriers to customized functional expansion and long-term cost efficiency on-site. To overcome the limitations of such closed operational structures, we designed and implemented KEP-ROS (KEPCO Robot Operating System), an open multi-robot operating framework.
KEP-ROS is built around three core design principles and remains independent of specific robot platforms. The first, protocol abstraction, integrates the heterogeneous communication protocols of gRPC-based quadruped robots and ROS2-based general-purpose robots into a single layer, enabling upper applications to operate regardless of the robot type. The second, mission lifecycle automation, automates the entire process from inspection schedule registration to robot navigation, data collection, and result storage via a distributed asynchronous task pipeline, thereby minimizing human intervention. The third, field-customized scalability, designs all AI inspectors and sensor modules as independent components that can be replaced or added, allowing flexible adaptation to changes in the equipment environment.
To position these design principles against a representative commercial platform, Table 5 compares the key functional differences between the Boston Dynamics Spot platform and KEP-ROS.
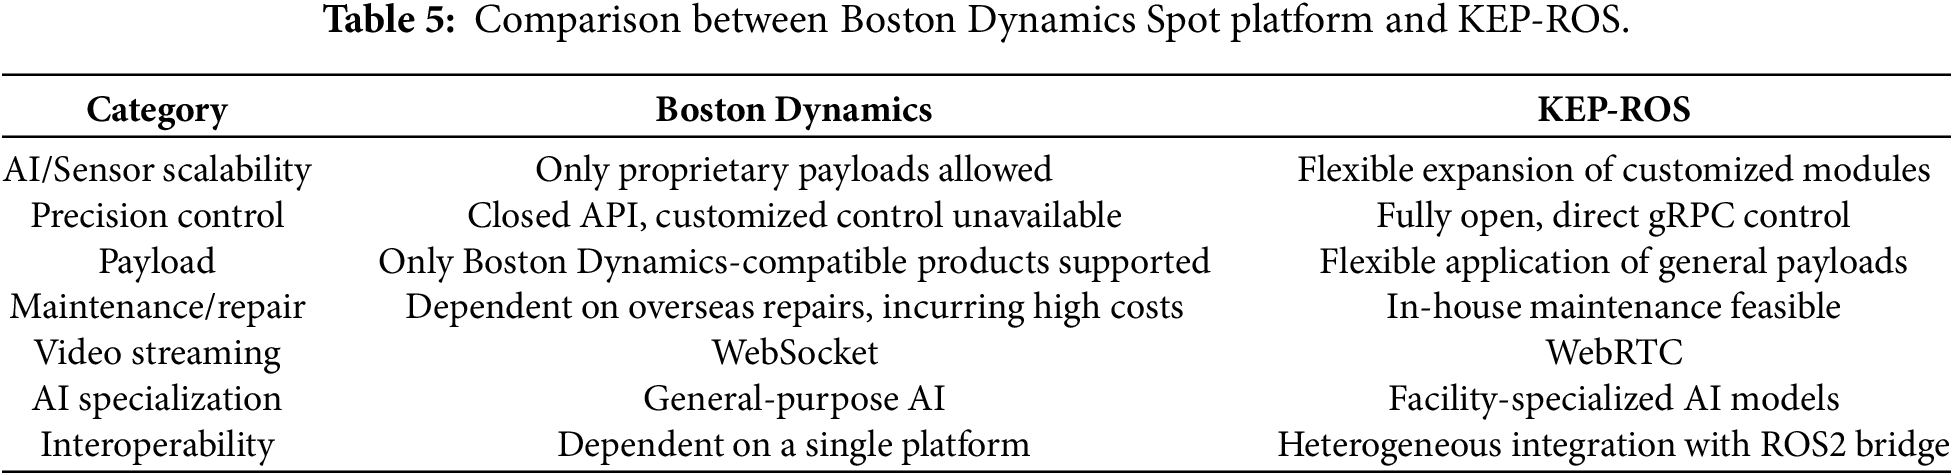
The primary differences between the two platforms lie in scalability and cost structure. While the Boston Dynamics Spot officially supports only manufacturer-specific payloads, which leads to a rapid increase in cost when adding customized sensors and AI modules, KEP-ROS achieves equivalent functionality by using customized payloads. By providing a fully open control interface, KEP-ROS enables precision control essential for on-site inspections—such as waypoint stops, pan-tilt-zoom (PTZ) control, and data acquisition triggers—and its low-latency streaming supports immediate situational awareness in remote monitoring environments. By replacing the structural vulnerability of relying on overseas repairs in the event of failures with an in-house maintenance system, KEP-ROS secures operational continuity for the long-term operation of the power infrastructure.
The implementation of the KEP-ROS system comprises five core components. The technology stack includes a FastAPI + Celery/Redis backend, Spot SDK (gRPC) and ROS Bridge dual-protocol robot control, a React 19 + Three.js 3D dashboard, a relational database, and Docker Compose container orchestration. The operational workflow follows an eight-stage circular structure: mission planning
4 Computational Modeling and Methodology
4.1 AI Diagnosis Pipeline Architecture
We propose a three-layer AI diagnosis architecture that links inspection standard definition, data distribution, detailed diagnosis, and result storage in a single flow. The overall structure is divided into three layers: the Directive Layer, Orchestration Layer, and Execution Layer, which are functionally separated such that the inspection standards of the upper layer are sequentially transmitted to the actual analysis of the lower layer. In particular, this architecture is designed to maximize the reliability and maintainability of the system by clearly separating deterministic logic and probabilistic AI inference. The overall AI diagnosis pipeline consists of eight steps, as illustrated in Fig. 5.
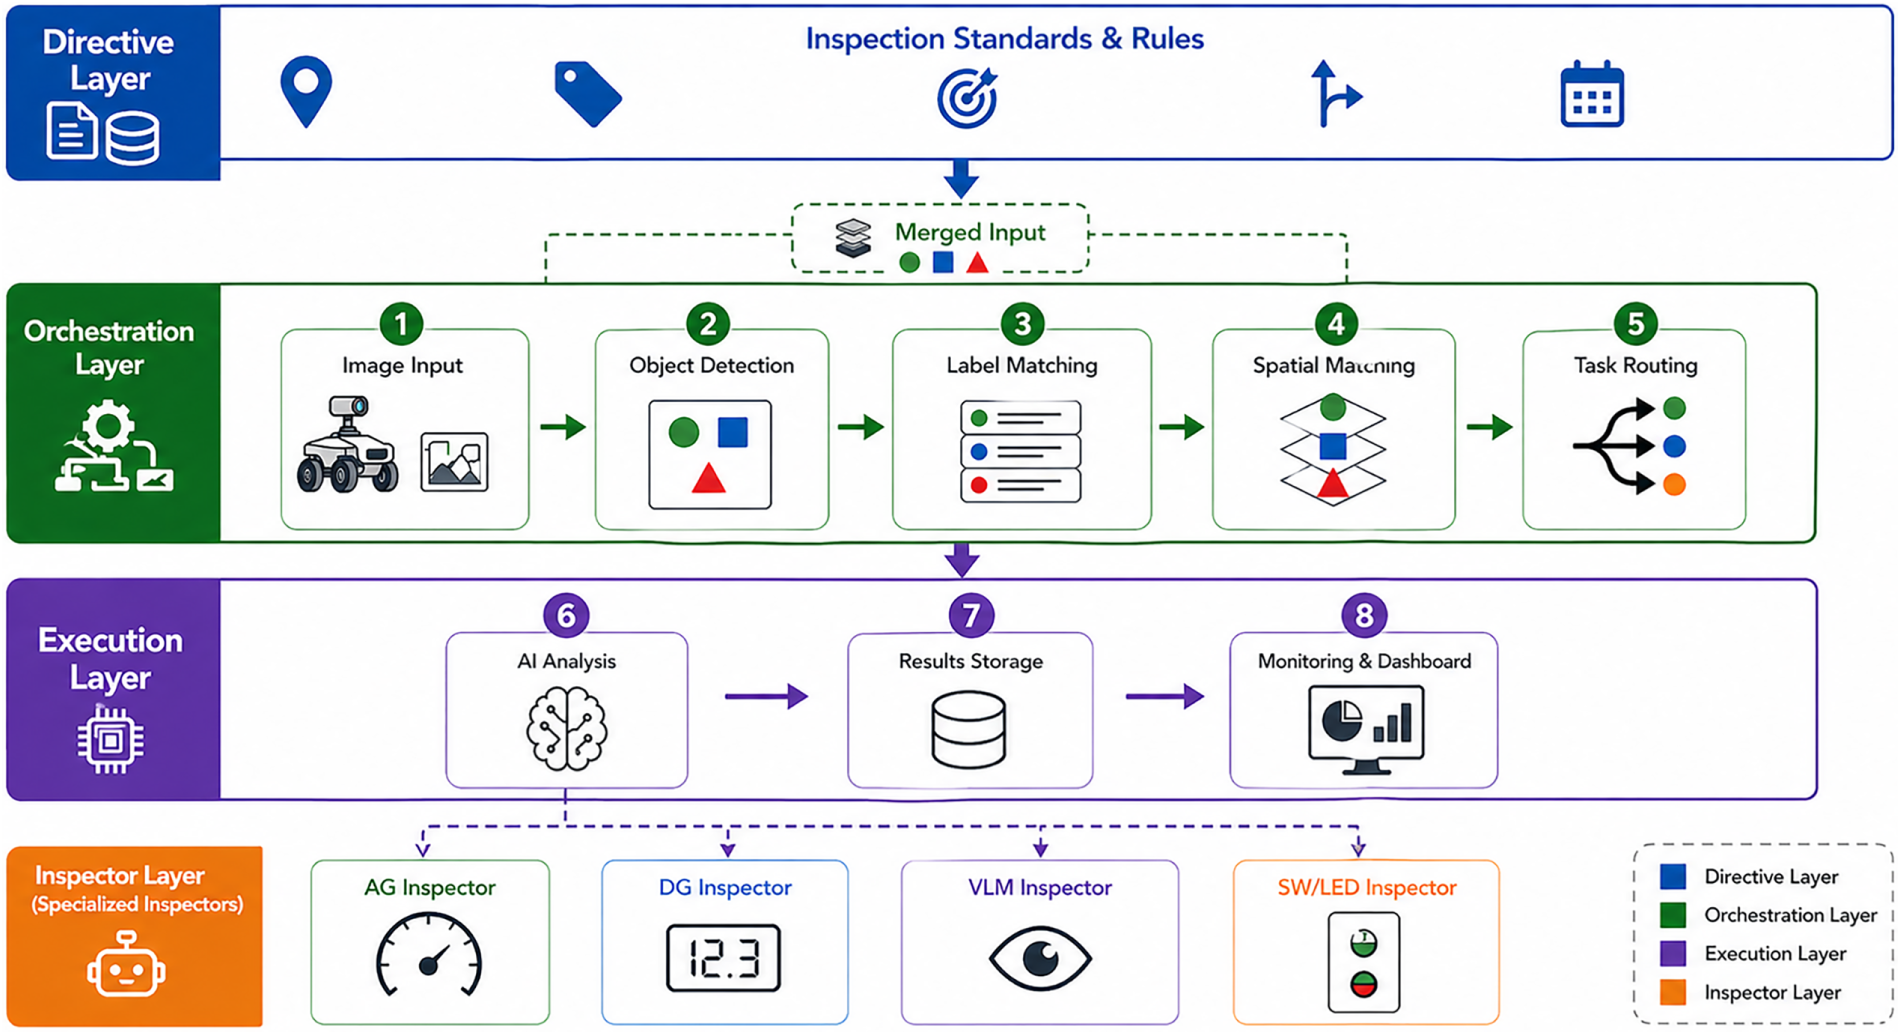
Figure 5: Overall flow of the AI inspection and diagnosis pipeline.
The Directive Layer is the highest-level command layer that defines customized inspection standards and acts as a trust anchor for the entire inspection process. Standard information, such as missions for each inspection zone, diagnostic items for each location, inspection types, and normal ranges, is stored in this layer, while inspection points, missions, and schedule information for each site are maintained and referenced by the system. The inspection standards defined in this layer are directly transmitted to the task routing of the Orchestration Layer and the threshold values of the inspectors in the Execution Layer, thereby establishing a deterministic control foundation for the entire pipeline.
While safety inspections in industrial sites require strict rule-based operations that exclude non-deterministic elements, AI models derive results based on statistical probabilities and therefore carry inherent uncertainty. By clearly separating these two elements, the Directive Layer provides the following system engineering advantages:
First, regarding the centralized management of operational standards, without this layer the threshold values would have to be hardcoded inside each AI model. For instance, if the normal range of a pressure gauge needs to shift from 1.2–1.8 to 1.0–1.6 MPa under equipment degradation, conventional architectures would require modifying the hardcoded logic and redeploying the entire system. In contrast, in the proposed architecture, modifications to the normal range in the Directive Layer are immediately reflected, requiring no changes to the AI models or robot control codes. In industrial environments where baseline adjustments occur frequently on-site, this architecture directly reduces operational costs and downtime.
Second, the architecture also preserves platform independence: if inspection missions are structurally dependent on a specific robot platform, replacing hardware would require redefining the inspection point locations, baseline values, inspection types, and the entire routing logic according to the new platform. In this architecture, because each inspection point
Third, system scalability benefits as well. Conventional approaches require direct insertion of custom detection logic into the code when new equipment is added to the site. In this structure, simply adding the metadata of a new inspection point (e.g., location, inspection type, and normal range) as a row in the database allows the Orchestration Layer to automatically recognize and process the point, without further code-level intervention.
Fourth, overcoming AI black-box limitations is another advantage: AI models can produce probabilistically different outputs even for the same input, making it difficult to trace the grounds of decision-making retrospectively. By externalizing the reference data governance (
where
The spatial and viewpoint information (
The orchestration layer serves as an intermediate layer that converts the inspection specifications of the directive layer into executable analysis tasks. It ensures that the images collected by the robot are transmitted to the appropriate AI inspectors based on the correct sequence and reference values. In the absence of this layer, operations such as image acquisition, object detection, inspection point matching, and agent allocation would be distributed across independent scripts, which would fail to ensure data consistency between consecutive stages. This layer integrates asynchronous task queues and spatial intelligence logic to process Stages 1–5 of the pipeline.
In Stage 1 (image input), when the robot arrives at the inspection point, measurement data, including visible light and thermal images, are transmitted to the analysis server. Immediately upon detecting the arrival of a new image, the corresponding data are registered as the QUEUED state and inserted into the task queue. Since the status from the queue registration to the completion of processing is recorded, pending tasks can be resumed upon reconnection despite communication failures.
In Stage 2 (object detection), the diagnostic system sequentially polls tasks in the QUEUED state to detect objects. Bounding boxes and class names of facility components, such as gauges, switches, LEDs, and valves, are extracted from the input image. These results serve as the input for the subsequent Stages 3–5. In environments with densely packed small-scale equipment, such as underground switchgear, the detection rate for small objects using the standard YOLO model decreases. To address this issue, we additionally trained a P2 head leveraging high-resolution feature maps to enhance small-object detection performance.
In Stage 3 (label matching), vocabulary discrepancies between the detection model’s class names and the inspection framework structurally occur in typical industrial environments. To resolve this, we designed a four-tier cascade label matching engine; its rationale, algorithm, and ablation results are described in Section 4.2.1.
In Stage 4 (spatial matching), in scenes where front and rear components coexist, sorting based solely on 2D coordinates mixes foreground and background objects, causing the checklist’s 1:1 mapping to fail. We resolve this with an area-based Z-depth approximation followed by grid sorting, as detailed in Section 4.2.2.
In Stage 5 (task routing), once label matching is completed, the cropped ROI images are automatically allocated to one of four analysis agents according to the routing key defined in
The execution layer performs the actual diagnosis through four specialized inspectors categorized by the characteristics of the inspection items, consistent with the task-specific partitioning rationale described in Stage 5.
In Stage 6 (AI analysis), each inspector operates as follows. The AG Inspector reads analog gauges through five-keypoint pose estimation, followed by homography projection correction and angle-to-value conversion (Section 4.3). The DG Inspector reads digital gauges, including seven-segment displays, via an sVLM (structured-prompt VLM; Qwen3-VL:8B) (Section 4.5). The Qualitative Inspector rates appearance states, such as corrosion, oil leakage, contamination, and insulation anomalies, on a five-point rubric scale (Section 4.6). The SW/LED Inspector determines the discrete On/Off, Auto/Manual, and illumination states of switches and LEDs through class-based object recognition (Section 4.4).
In Stage 7 (result storage), the readings of each inspector are stored as numerical and textual state values. The original and result image paths are recorded together to facilitate post-analysis and historical traceability.
In Stage 8 (monitoring and dashboard), the stored readings are visualized in real-time on a result verification dashboard, and items exceeding thresholds automatically trigger alarms.
4.2 Label Matching and Spatial Alignment
4.2.1 Four-Tier Hierarchical Label Matching
In industrial field deployments, the object detection model and the inspection framework that consumes its outputs are frequently developed by different teams at different times, or externally developed models are integrated retroactively. Because each model represents the same facility with a different class name, a vocabulary discrepancy in item names between the object detection model and the inspection framework is a structural problem that inevitably arises in the system design phase. This discrepancy does not stem from a single cause but originates from three structurally distinct issues.
First, for components such as LEDs and switches where the current state is embedded in the class name, the equipment item itself must be identifiable regardless of the detected state. For instance, knob switch objects may include state information such as Auto (SW_Knob_Auto) or Manual (SW_Knob_Manual); however, from an operational standpoint, the switch state changes dynamically over time. Thus, the item should be matched if it conforms to a generic SW_Knob_* template. If the inspection checklist defines the target simply as SW_Knob, matching fails for both states unless the state suffixes are removed, leading to a missing diagnosis.
Second, even if gauges perform the same function (having the same measured physical quantity and scale start/end points), class names representing the same equipment vary across models if class name notations differ by manufacturer or if different object detection models are trained with disparate naming conventions. In this scenario, recognizing identical equipment through simple string comparison is infeasible, rendering the distribution of diagnostic agents impossible.
Third, accumulated typographical errors or notation inconsistencies occurring during database registration of inspection points manifest as latent defects where matching for specific items persistently fails during field operations. Regardless of the underlying cause, a matching failure implies the omission of diagnostic results for the corresponding inspection point, and repeated omissions degrade the operational reliability of the entire inspection system.
However, because these three problems require different solutions, they cannot be addressed simultaneously using a single matching rule.
Accordingly, we designed a four-tier cascade method that sequentially applies rules starting from the highest precision. Because applying low-precision rules first can lead to mismatching among similar items, each tier is strictly configured to proceed to the next stage only when unresolved in the preceding step.
The first tier, exact match, verifies full matching after lowercase conversion and special character removal, prioritizing identical cases post-conversion to prevent redundant operations in subsequent stages. The second tier, suffix tolerance, verifies matching after removing state suffixes (such as _on and _off), identifying the inspection item itself regardless of the status at detection and thereby preventing matching failures for LED and switch components. The third tier, LABEL_MAP lookup, performs explicit transformation using a predefined mapping table, resolving structural discrepancies between gauges performing the same function under different manufacturer notations or between labels trained across different YOLO models. The fourth tier, stem containment, absorbs human errors or notation inconsistencies originating from the directive layer and is applied only to items that remain unresolved in the preceding three stages.
Once a match is confirmed in any stage, subsequent stages are bypassed immediately, preventing the application of lower-precision rules to already resolved items. This maintains matching precision while systematically processing the three causes of discrepancy, each with different characteristics, within a single pipeline.
The contribution and quantitative results of each stage are described in detail in Section 5.2.
4.2.2 Spatial Alignment: Z-Depth Approximation and Grid Sorting
In control panels within underground power ICT infrastructure, switches and indicator lights of the same type are occasionally arranged in overlapping front and rear rows. In this scenario, because the foreground and background objects are projected onto a single 2D image plane, determining the relative depth of each component using only YOLO-generated bounding boxes is challenging.
This issue stems primarily from the perspective effects and camera viewing angles when 3D physical space is projected onto a 2D plane. Owing to the viewpoint characteristics where the robot captures the facility either horizontally or from a lower angle looking upward, background equipment located far in the 3D space is projected near the vanishing point at the top of the image (corresponding to smaller
This study addresses the issue through a three-step process. First, we partition detected objects into front and rear pools using Z-depth approximation, with the bounding box area serving as a surrogate variable for the inverse perspective relationship. Subsequently,
In a pinhole camera model, objects of identical physical size are projected with larger areas on the image plane as they are positioned closer to the camera. Since control panel environments with repeating layouts of identical switches and indicator lights satisfy this condition, we estimate the relative depth of objects using only the bounding box area
Here,
The separation of front and rear pools is performed as follows. Because a
Within each pool where the front/rear separation is completed, objects are grouped into rows according to the grid layout of the panel, and sorted along the
This tolerance is designed to accommodate practical scenarios where objects in the same row do not align exactly along the
The quantitative comparison results are described in detail in Section 5.3.
Consequently, the entire spatial alignment pipeline achieves a 1:1 mapping of checklist items in multi-layered layouts using solely 2D bounding box information, without relying on depth sensors or 3D reconstruction.
4.3 Analog Gauge Inspector (AG Inspector)
Although analog gauges serve as crucial indicators for intuitively conveying the operational state of power systems, implementing automated reading using autonomous robots faces two fundamental bottlenecks. First, conventional polar unwrapping techniques are effective only under frontal viewing conditions; they introduce non-linear scale errors on elliptically distorted dials during oblique imaging, which frequently occurs along robot paths. Second, the axis-aligned bounding box (AABB) employed in standard object detection exhibits structural limitations, as the proportion of background noise increases significantly during the rotation of thin, elongated pointers [16].
To overcome these limitations simultaneously, this study redefines gauge reading as a Structural Pose Estimation problem rather than simple object detection, and deploys an end-to-end pipeline consisting of three stages: keypoint detection, geometric calibration, and physical value conversion.
The geometric structure of the gauge is modeled as a topological skeleton
Based on YOLOv11-Pose, we optimized the network architecture by incorporating a high-resolution P2 feature layer with stride 4 and eliminating the P5 layer (stride 32) designed for large object detection. Because the minimum stride of standard YOLOv11 is 8, the resolution of the P3 feature map for a 1280
SW/LED Inspector: YOLO Class-Based Discrete State Determination
Selector switches and LED indicator lights are discrete inspection points distributed across power facilities and switchboard panels, indicating the operating states of the equipment. Instead of introducing separate color analysis or classification models, this study employs a scheme that encodes state information directly into the class names returned by the YOLO detection model. Since the detection classes are structured in the format of {type}_{state} (e.g., LED_Red_on and SW_Knob_on), both object detection and state classification are performed simultaneously.
We determine state by comparing the class name specified during label matching with the inspection criteria type defined in the directive layer. To account for notational variations across state suffixes (on/off/opened/closed/left/right/center), the suffix-tolerance rule of the label matching engine (Section 4.2.1) is applied. The final PASS/FAIL decision is determined by comparing the target state value specified for the object in the directive layer with the label returned by the detected object.
4.5 Digital Gauge Inspector (DG Inspector)
DG Inspector: sVLM-Based Numerical Reading of Digital Gauges
Numerical reading of digital gauges and variable-frequency drive panels faces structural limitations that are difficult to resolve using general-purpose OCR engines alone. A preliminary performance evaluation conducted during the design phase using PaddleOCR revealed two fundamental issues. First, because PaddleOCR indiscriminately detects all text within the input image, numbers on nameplates (e.g., 3/380/60) or model labels (e.g., H—0060) are misidentified as target inspection values. Second, because there is no mechanism to specify the reading target (e.g., cooling water temperature or booster pressure), domain-irrelevant text is incorporated into the reading results. With 1240 inspection points at this site, manually specifying target value locations for each point is highly impractical. This indicated that practical field deployment requires an additional ROI detector and a post-processing pipeline. We evaluated PaddleOCR in the design phase as a representative baseline for general-purpose OCR, and confirmed the validity of adopting the final sVLM through multi-backend comparison experiments involving five OCR engines and three VLMs (
To address these issues, Qwen3-VL:8B, the sVLM, is adopted as the core reading engine. The sVLM is explicitly instructed on the values to read and the output format through structured prompts predefined according to the type of equipment under inspection. For instance, for a booster pump, the system provides a type-specific prompt that describes the target values and output format, such as: “Read the actual Set Pressure and Current Pressure…Output format: (Set—Current)”. This approach disregards domain-irrelevant text while supplying the visual context required for recognizing seven-segment fonts and decimal points.
During preprocessing, low-resolution cropped images are enlarged by a factor of four using bicubic interpolation before model input to enhance pixel details. The backend supports multiple local and remote inference options for deployment flexibility. The response post-processing stage performs output formatting, such as separator standardization (pipe
Qualitative Inspector: Qualitative Appearance State Diagnosis
Among the equipment inspection items, appearance-based conditions—such as cleanliness, corrosion, oil leakage, and pipe insulation—are difficult to quantify. To process these qualitative items, the Qualitative Inspector uses a vision-language model based on Qwen3-VL:8B.
The system configuration (VLM_PROMPTS) maps each inspection type to a structured VQA prompt. The prompts are designed to strictly constrain the output format; for example, the specific VQA output requirements applied during image analysis are as follows:
(1) Cleanliness (1: Poor/contaminated ~5: Clean)
(2) Water leakage (1: Severe leakage ~5: No leakage)
(3) Oil leakage (1: Severe leakage ~5: No leakage)
(4) Corrosion/rust (1: Severe corrosion ~5: No corrosion)
(5) Insulation condition (1: Damaged/exposed sheath ~5: Undamaged)
The model infers the aging and damage state of the equipment based on the rubric-defined five-point scale. By processing the input image and prompt concurrently, the model goes beyond simple object detection, returning semantically interpreted state results in a structured format. The inference backend offers similar deployment flexibility as the DG Inspector. In this study, we predominantly used Ollama.
Because the Qualitative Inspector performs direct inference on individually captured images without passing through the YOLO detection pipeline, its diagnostic reliability is not constrained by detection coverage; it is instead assessed through a three-way validation scheme. The rubric design, the four-expert blind evaluation protocol, and the quantitative validation results are detailed in Section 5.6.
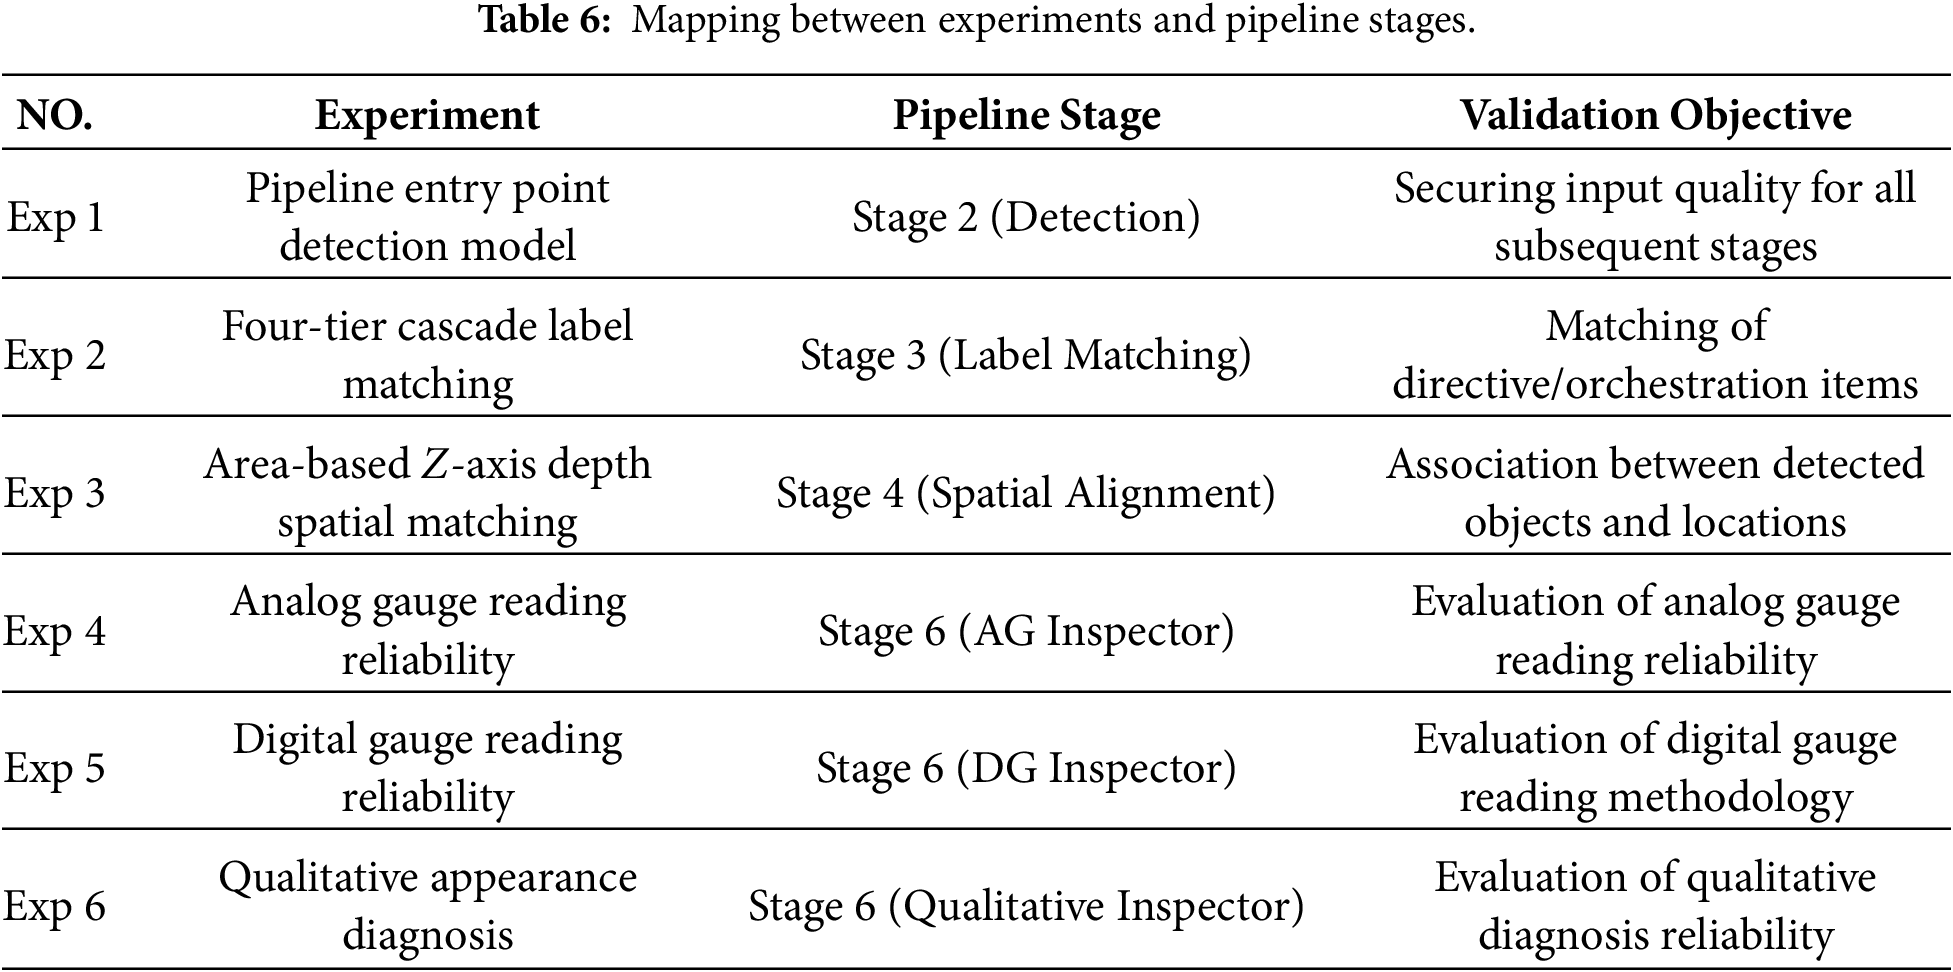
Since the AI diagnostic pipeline sequentially couples object detection (Stage 2), label matching (Stage 3), spatial alignment (Stage 4), and inspector reading (Stage 6), errors from preceding stages propagate and accumulate through all subsequent stages, ultimately degrading the reliability of the final decision. Accordingly, we divide the evaluation into stage-wise validation (Experiments 1–3) to independently verify each pipeline stage, and inspector-specific validation (Experiments 4–6) to assess the reading accuracy of each inspector. Table 6 outlines the mapping between each experiment and its target pipeline stage, along with the respective validation objectives.
We conducted all experiments in the underground environment of the KEPCO Power ICT Center. We employed Boston Dynamics’ Spot as the robot (maintaining a battery state of charge (SOC)
Camera and lighting conditions: We employed a SpotCam PTZ (payload) camera with a resolution of 1920
Annotation procedure: AG GT values were obtained by manually reading the analog gauge values from Spot-captured on-site images. DG GT values were obtained by manually reading the digital display values from Spot-captured on-site images and recording them in Excel. GT labels for qualitative inspection items were generated using the five-point rubric as a structured scoring guideline. SW/LED GT labels were finalized after independent review by two annotators.
Train/validation split (YOLO): The total dataset was randomly split into training and validation sets at an 80:20 ratio. No separate held-out test split was reserved, and the reported mAP is based on the validation split.
Inference hardware: NVIDIA Jetson Thor (JetPack 7.1-b112, CUDA 12.6). We calculated the latency as the average of 20 runs under a warm model state.
In Stage 2 of the pipeline (object detection), objects are detected at the orchestration layer, and different detection paths operate independently for each inspector type according to the information from the directive layer. Table 7 summarizes the detection paths for each inspector.

The AG Inspector uses the common model for object detection and subsequently extracts keypoints using P2-YOLO-Pose [16]. As the Qualitative Inspector operates independently of the YOLO detection pipeline (Section 4.6), this evaluation targets only the common entry model, YOLOv8n (68 classes). The detection accuracy of this model dictates the input quality for subsequent label matching (Stage 3), spatial alignment (Stage 4), and inspector reading (Stage 6). Because undetected objects cannot be recovered in any subsequent stage, the entry model’s performance directly establishes the upper bound of the overall coverage for each inspector path.
The training dataset comprises approximately 11,000 images (68 classes) of switches, LEDs, and gauge panels from the underground facility of the KEPCO Power ICT Center. In the training curves of Fig. 6, the mAP@0.5 converged rapidly after 20 epochs and showed a stable learning curve through the best epoch. The key performance metrics at the best epoch (60) are as follows:
• mAP@0.5: 97.31%
• mAP@0.5:0.95: 86.26%
• Precision: 90.41%, Recall: 96.85%
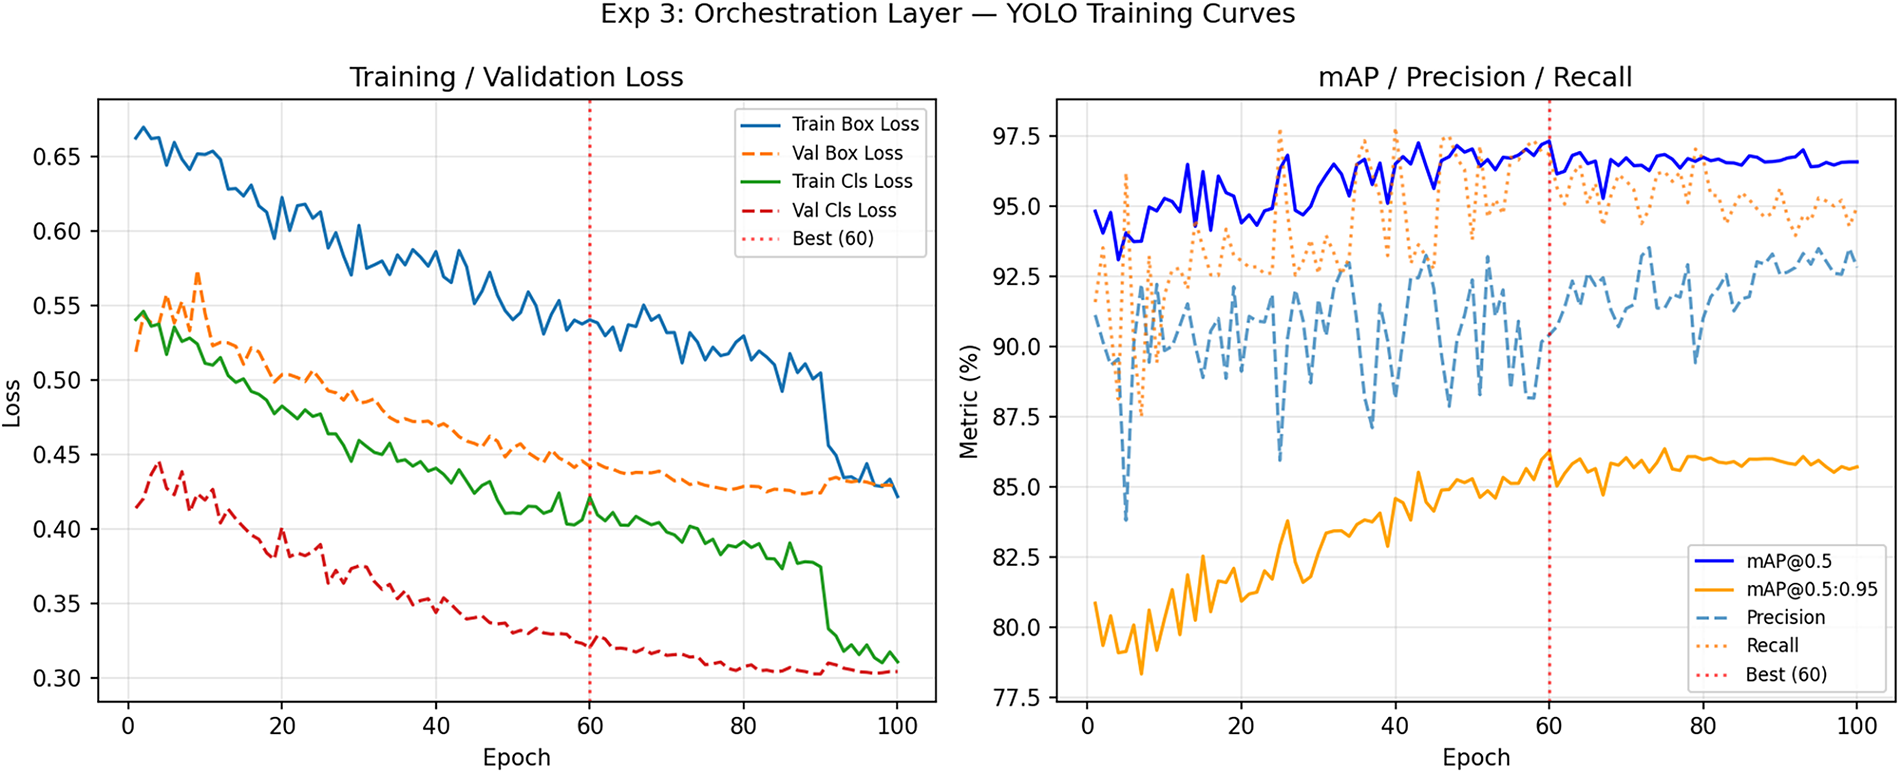
Figure 6: Classifier (YOLO) training curves.
Because unresolved lexical mismatches between the orchestration and directive layers block inspector assignment and propagate as omissions through all subsequent stages, we evaluated the step-by-step contribution of the proposed four-tier cascade matching strategy (Table 8).
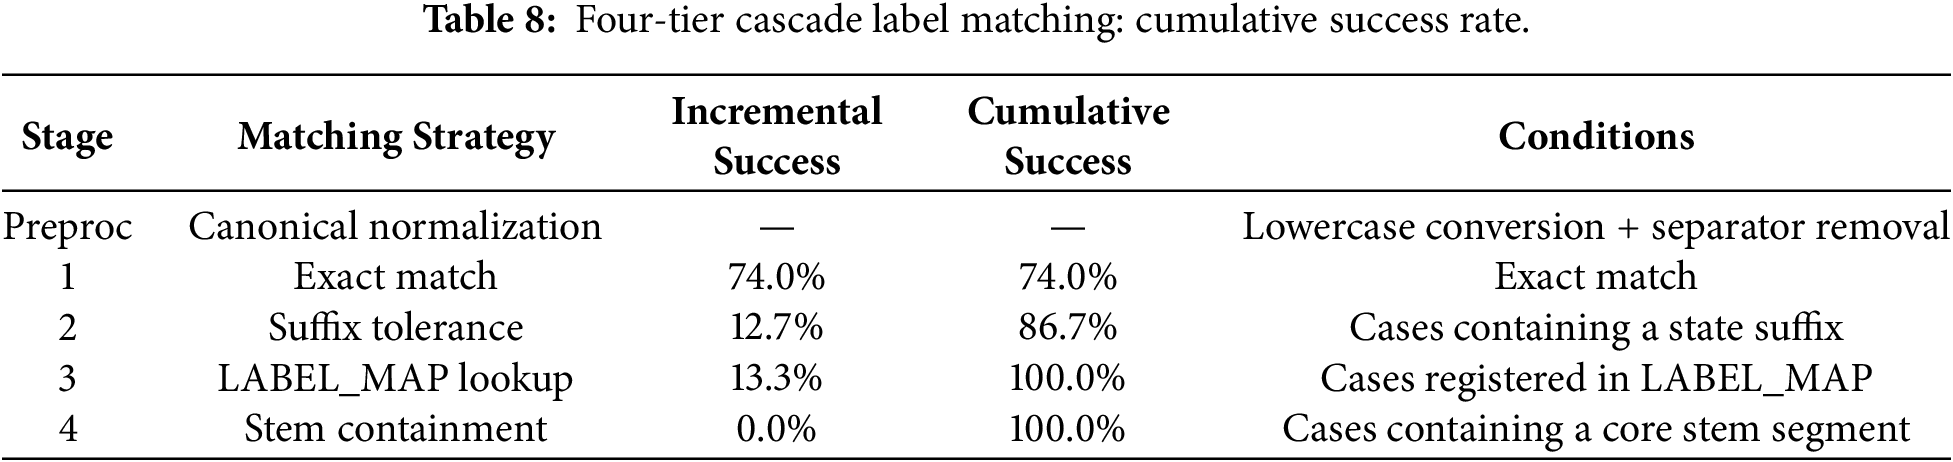
The four-tier cascade achieved a 0% match error rate: Tier 1 (exact match) alone resolved 74.0% of cases, and the remaining 12.7% and 13.3% were sequentially absorbed by Tier 2 (suffix tolerance) and Tier 3 (LABEL_MAP lookup), respectively. Tier 4 (stem containment) was not applied in any actual cases as all discrepancies were successfully resolved in the preceding stages, thus functioning purely as a safety net. These results demonstrate that all three causes of discrepancy identified in Section 4.2.1 are systematically absorbed within a single cascaded pipeline.
We validated the area-based Z-depth approximation at four inspection points containing mixed front/rear layouts within the operational database. We applied three methods to perform spatial matching on the objects detected by YOLO at each inspection point (total
In panel environments with co-located front and rear equipment, mismapped objects invalidate the inspection results even when detection and label matching succeed; the accuracy of spatial alignment (Stage 4) must therefore be evaluated separately from detection accuracy. This ablation study quantifies the reliability of each method under these conditions, as summarized in Table 9.
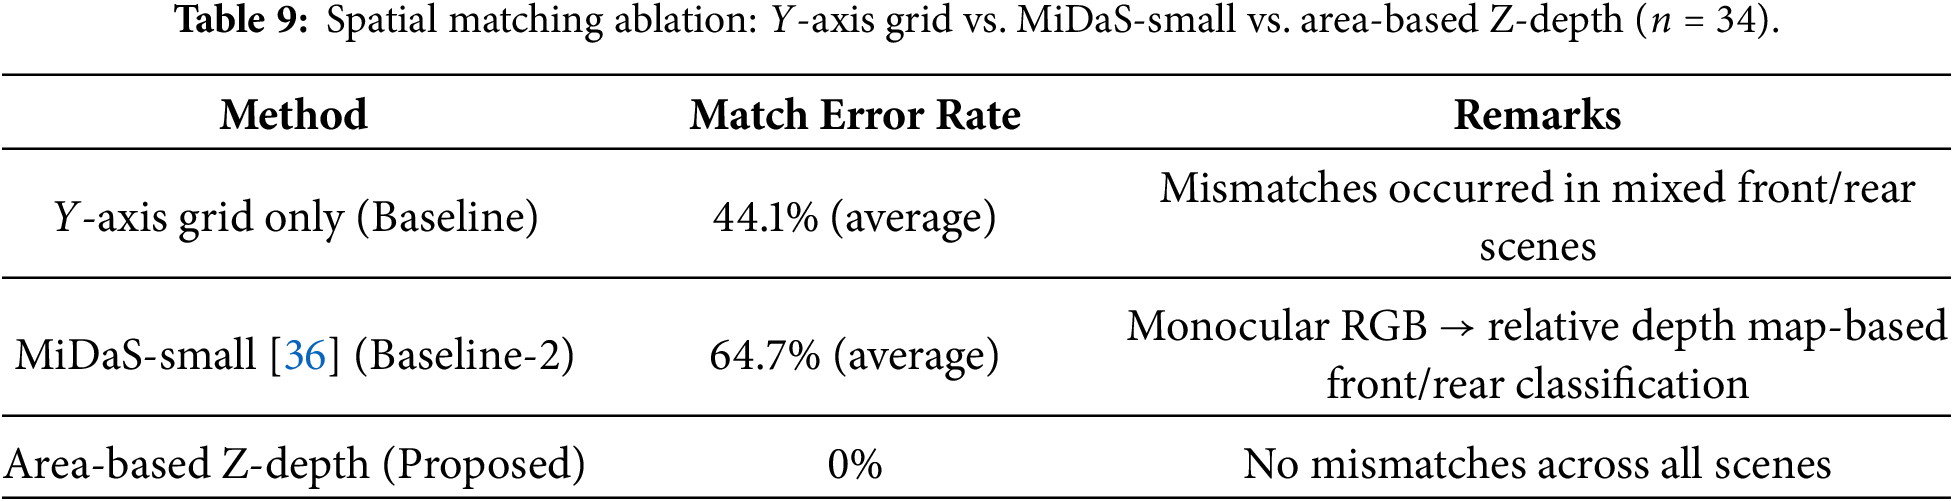
As an additional baseline, we employed the monocular camera-based depth estimation model MiDaS-small [36]. In MiDaS-small, a relative depth map is estimated from a single RGB image, and the front/rear order is determined based on the average depth value within each bounding box. Across the four scenes (
When analyzing the results for each scene in Fig. 7, we observe two distinct patterns.
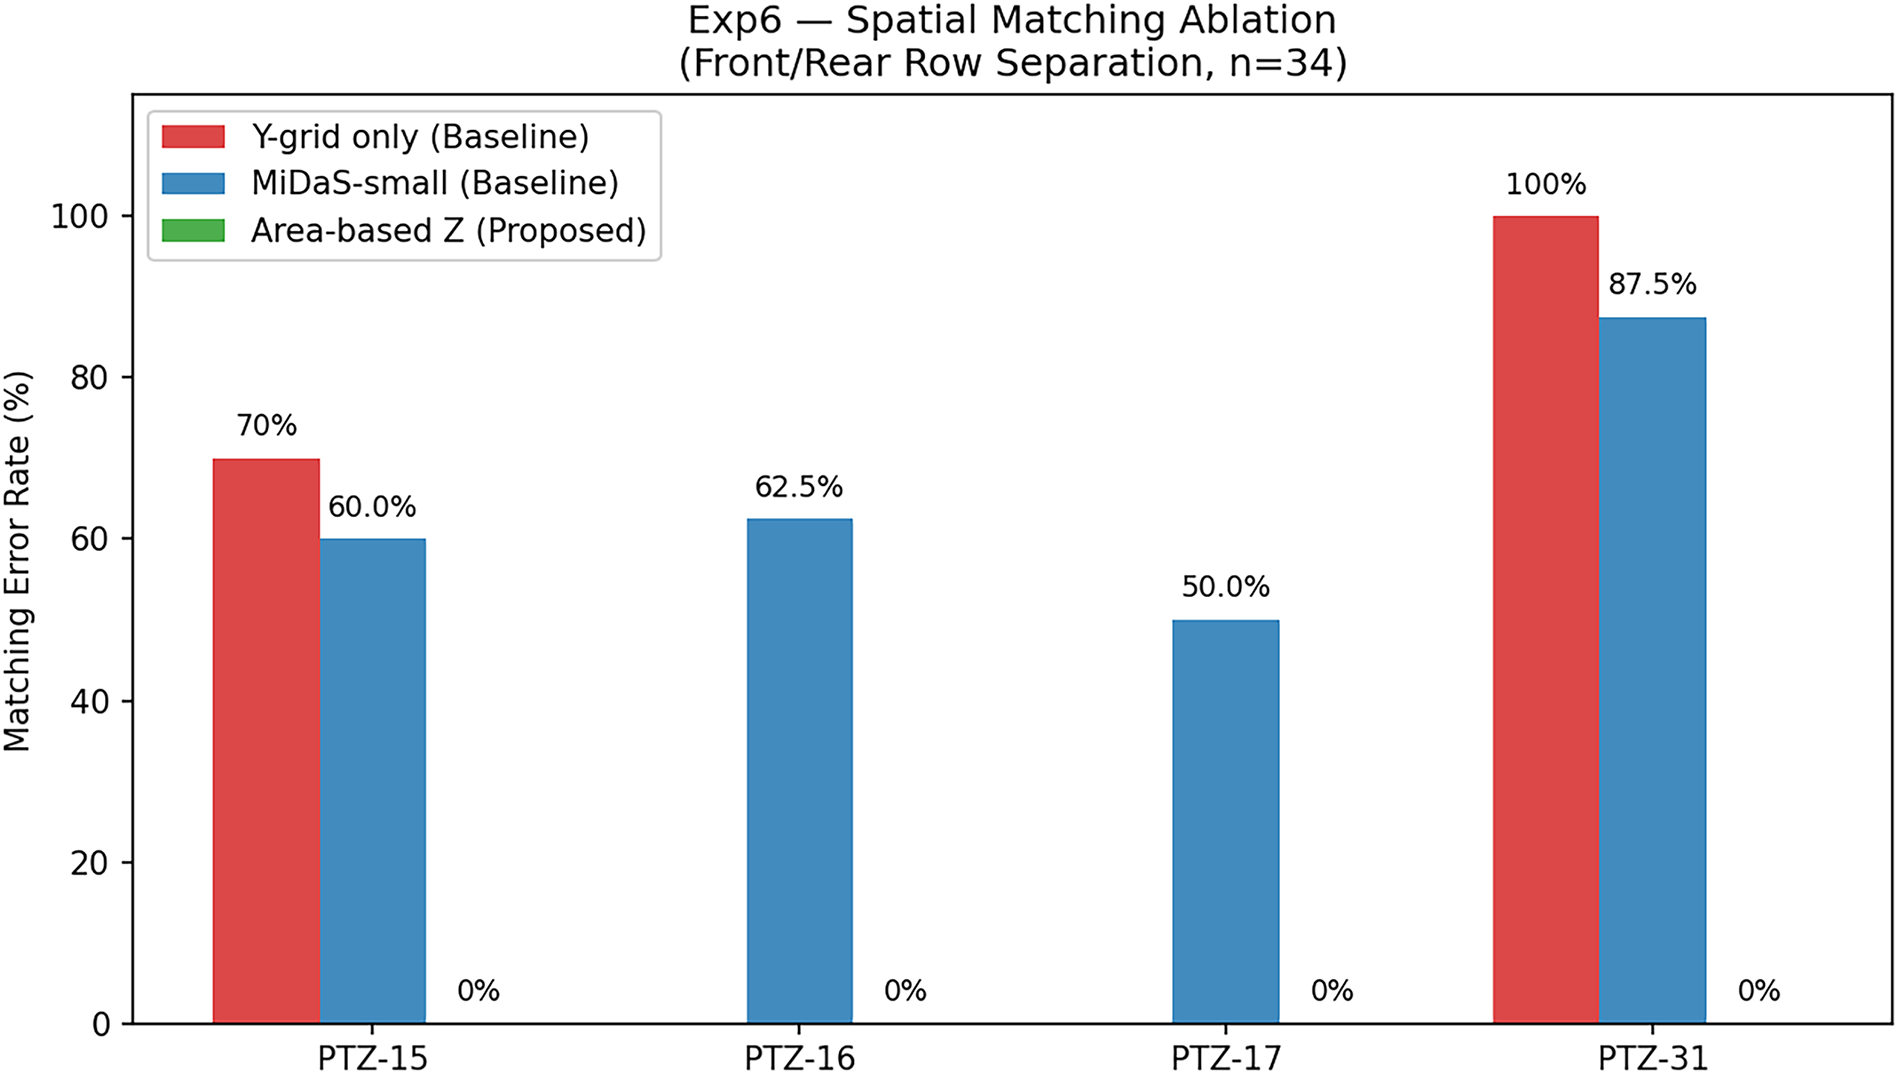
Figure 7: Spatial match error rates by scene (
At inspection points PTZ-16 and PTZ-17, the front and rear objects were sufficiently separated along the Y-axis, resulting in a 0% match error rate for both the Y-axis grid Baseline and the Proposed method. This result implies that the Y-axis alignment method is not inherently unreliable; rather, it fails only under specific conditions where the Y-coordinates of the front and rear objects overlap. However, MiDaS-small recorded mismatch rates of 62.5% and 50.0% in the same PTZ-16 and PTZ-17 scenes, respectively. This failure occurs because MiDaS-small relies solely on its estimated depth map for alignment, without leveraging the domain-specific geometric regularity of Y-axis separation. The reliability of the depth map degraded on metallic pipes and black insulation surfaces, leading to mismatches even in scenes with sufficient Y-axis separation.
In contrast, at inspection point PTZ-15, the Baseline recorded a match error rate of 70%, and at PTZ-31, it exhibited a 100% error rate, indicating that all items in the scene were incorrectly matched. Because both scenes are characterized by overlapping Y-coordinate ranges between the front and rear equipment, the alignment order in the depth direction could not be distinguished using simple Y-axis alignment alone. The average error rate of the Y-axis grid Baseline across all four scenes combined was 44.1%, resulting in nearly half of the inspection points being assigned to incorrect equipment.
The proposed method maintained this 0% error rate even in the more challenging PTZ-15 and PTZ-31 scenes. Because the area-based front/rear pool partitioning (Section 4.2.2) precedes the X-axis alignment, this reliance on purely 2D bounding box information allows integration into the existing YOLO-based pipeline without requiring additional hardware and with a negligible increase in inference cost.
However, because this validation is limited to four scenes (
Fig. 8 presents a qualitative comparison of the three methods on the PTZ-15 and PTZ-31 scenes, where the quantitative differences of Table 9 are most pronounced.
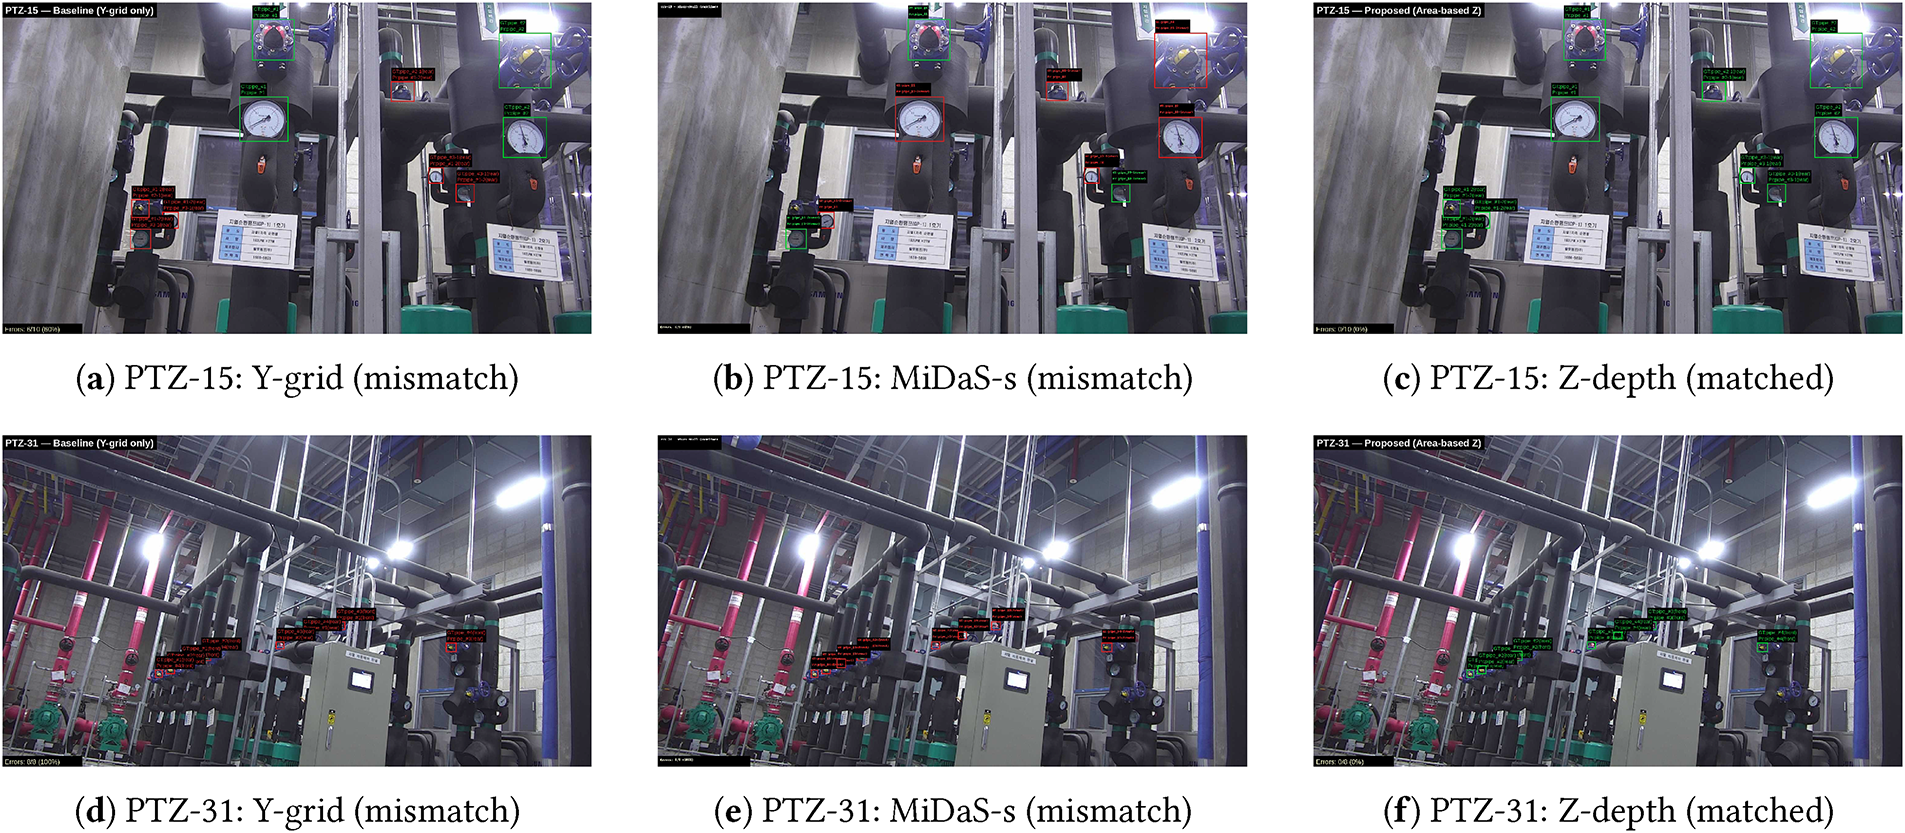
Figure 8: Qualitative comparison of front/rear matching (Y-grid/MiDaS-small/Z-depth).
The AG Inspector detects the pointer tip (
The experimental dataset consists of 200 analog gauge images collected from an actual underground power ICT facility. Because the mean absolute percentage error exhibits numerical instability, diverging when the GT value approaches zero, we selected the percentage of full scale (%FS), which normalizes the error against the full scale of the gauge range, as the evaluation metric.
We used bootstrap resampling (
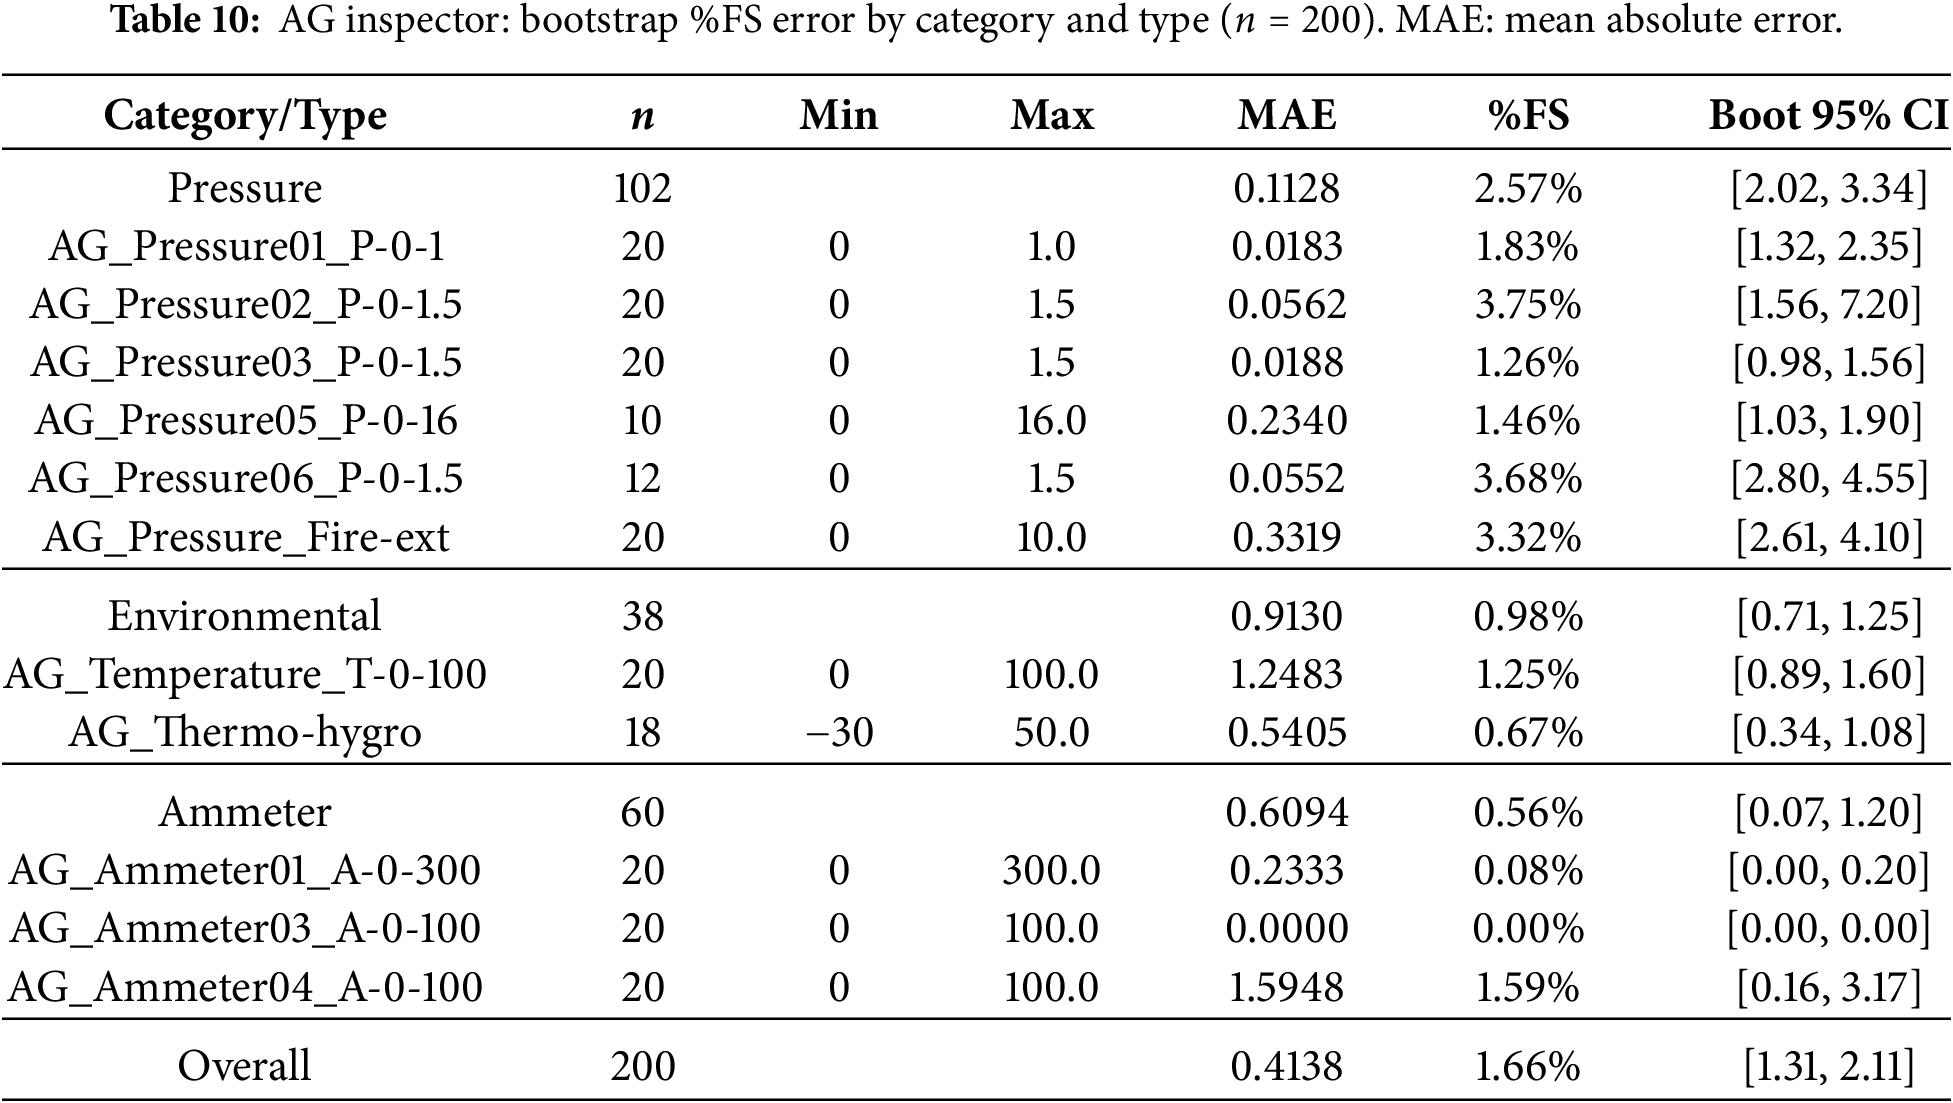
The top row of Fig. 9 presents representative reading examples for a thermometer (Fig. 9a) and a pressure gauge (Fig. 9b). Among the three categories, the pressure category (
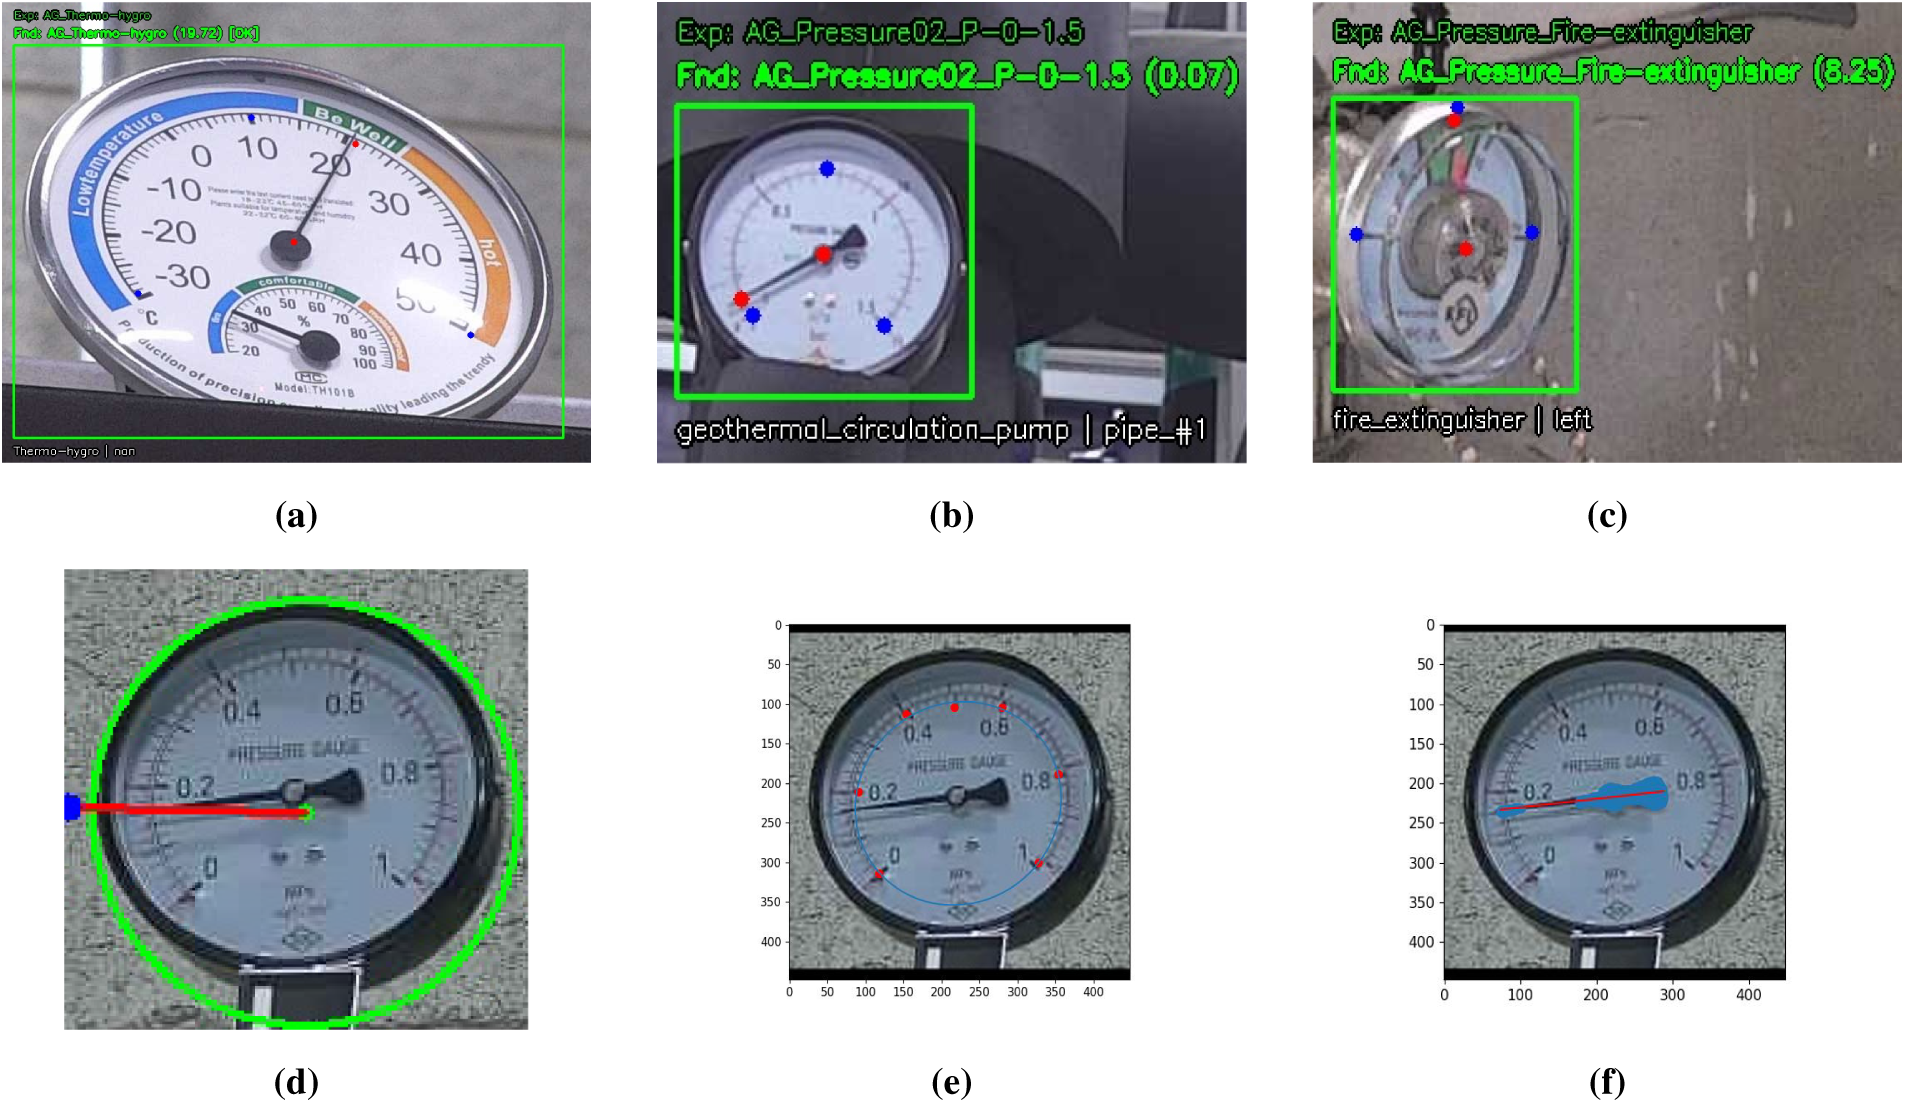
Figure 9: Examples of analog gauge readings and comparison with baselines. (a) Thermometer reading (b) Pressure gauge reading (c) Fire extinguisher pressure gauge (d) Hough-Circle (e) ETH scale keypoints (f) ETH needle segmentation.
The ammeter category (
The bottom row of Fig. 9 shows the detection results of the baseline methods for the same pressure gauge. Although the Hough-Circle method detected the gauge boundary as a circle and estimated the needle direction (Fig. 9d), it failed to detect both the needle and the scale simultaneously in most cases. The ETH analog_gauge_reader detected the scale using circle fitting and marked the scale keypoints with red dots (Fig. 9e). Fig. 9f shows the needle segmentation result, which segments the needle region and estimates its central axis; however, both the needle and the scale were detected successfully in only 6.7% of cases.
For baseline comparison, we applied Hough-Circle [17] and ETH analog_gauge_reader [12] to the same dataset (
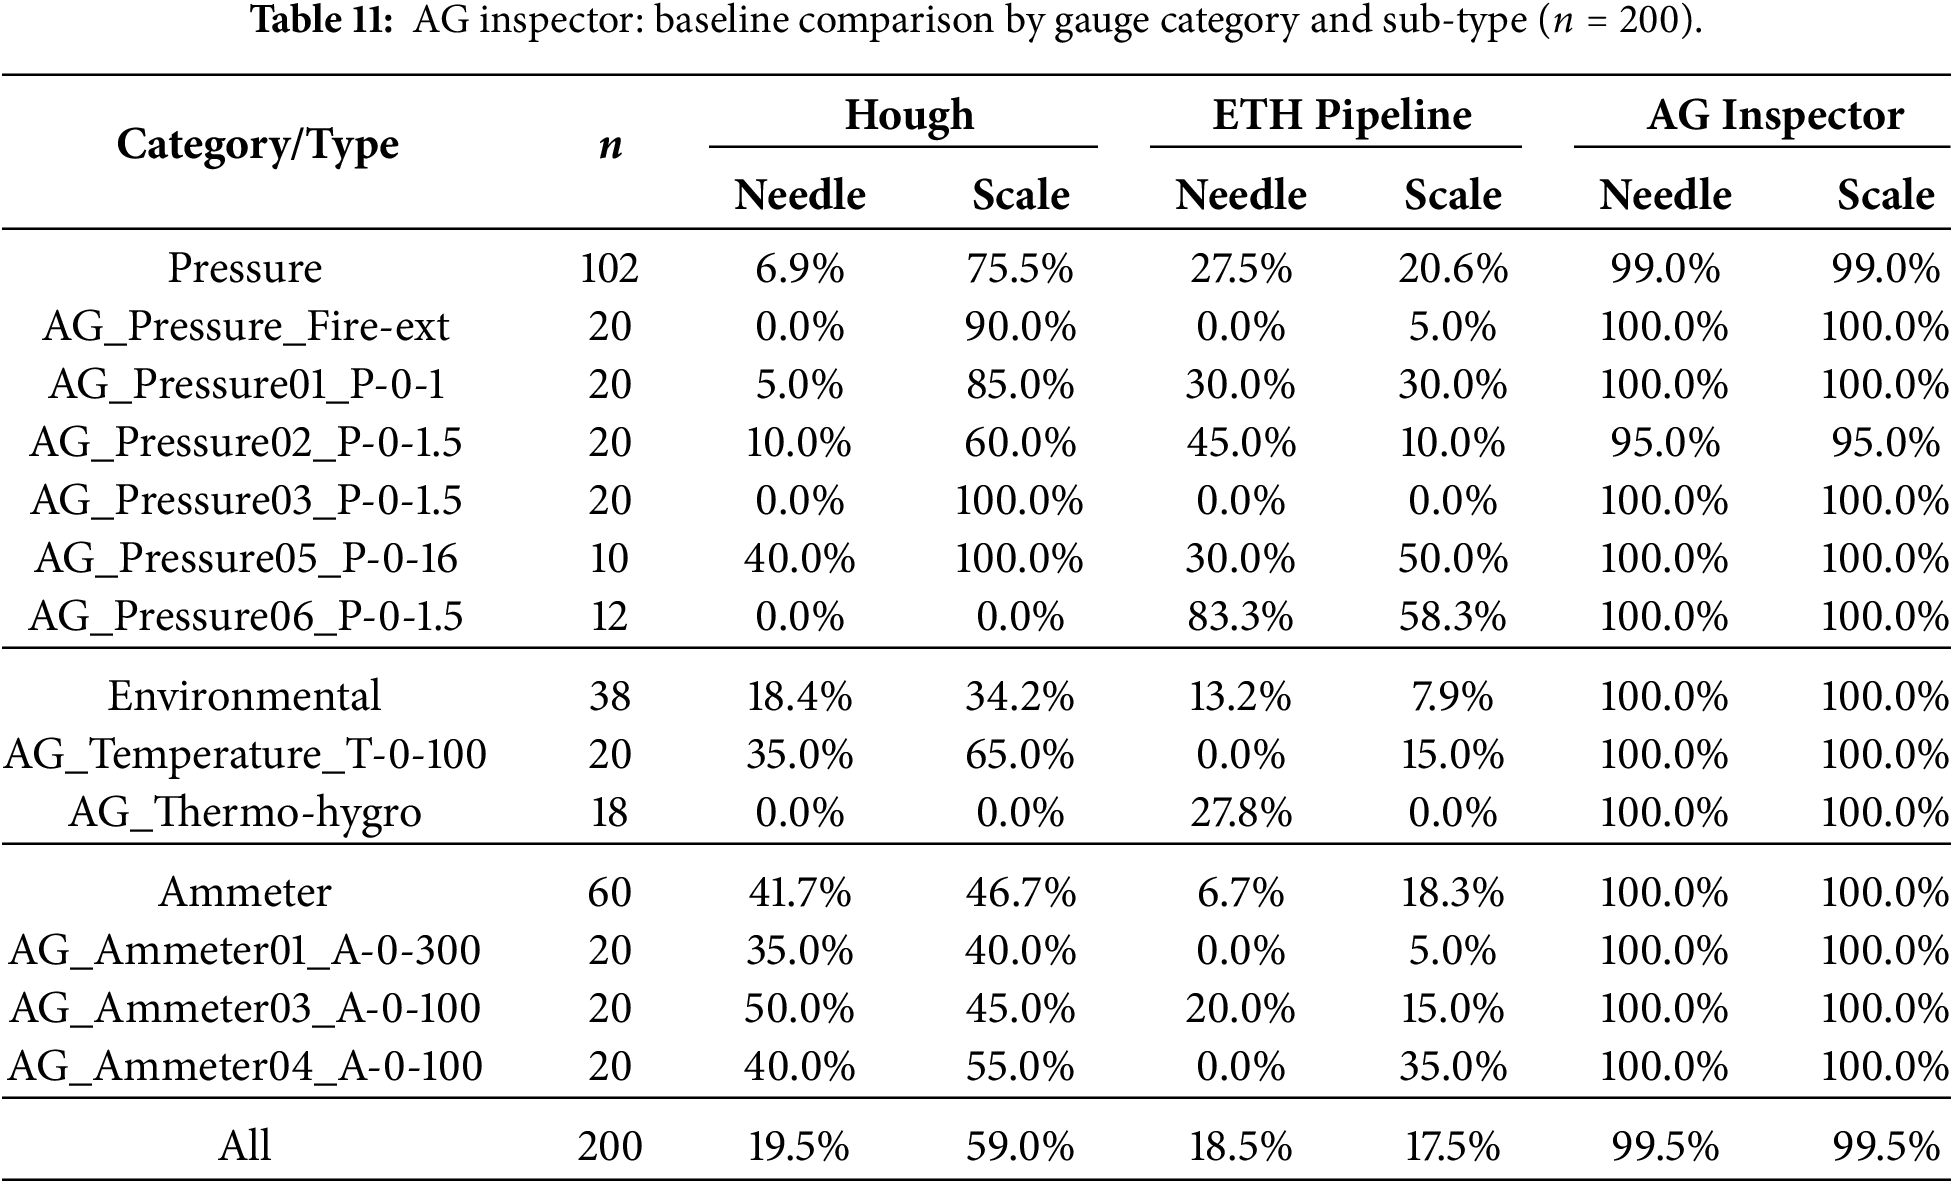
In the “All” row of Table 11, Hough-Circle exhibits a success rate discrepancy of 39.5%p between scale detection (59.0%) and needle detection (19.5%).
Although identifying the gauge boundary using Hough circle detection is partially effective, needle angle estimation relies on simple line detection, making it difficult to distinguish the needle from background line segments. The ETH analog_gauge_reader exhibited low success rates for both needle detection (18.5%) and scale detection (17.5%). AG_Pressure06 exhibited 0% Hough scale detection due to an unusual gauge face geometry, yet ETH attained 83.3% needle detection on the same type, illustrating complementary failure modes. The AG Inspector recorded 99.5% for both needle and scale keypoint detection across all gauge types, and a fallback mechanism produced readings even when keypoint detection failed, yielding outputs for all 200 samples.
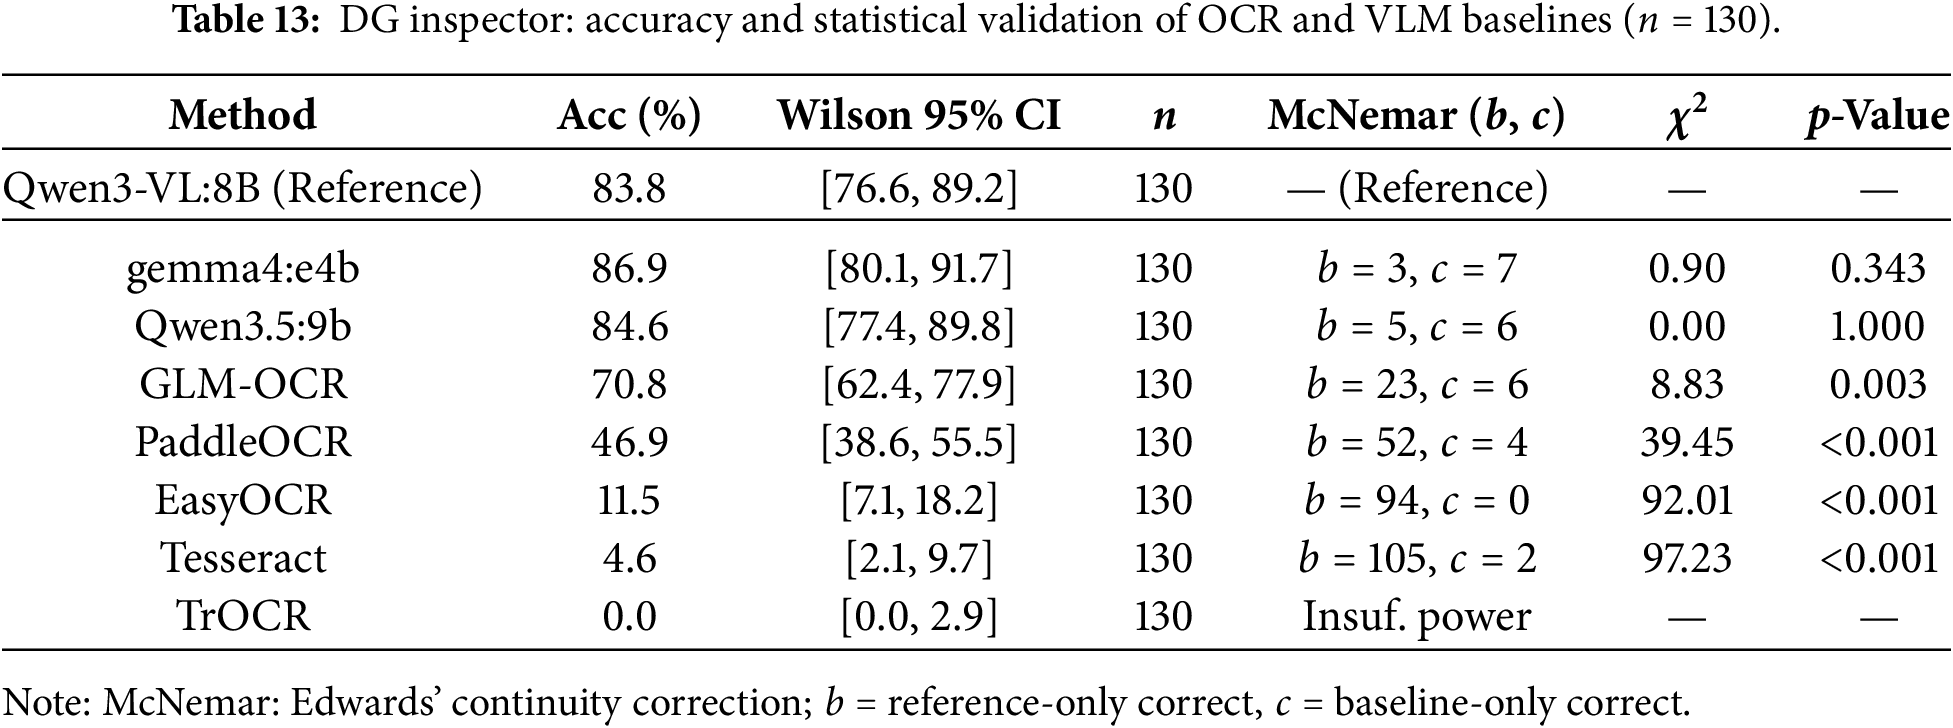
The DG Inspector reads numeric values from the digital gauge ROIs detected by YOLOv8n. For a fair comparison, we applied identical bounding box (bbox) ROI cropping to all methods. A reading was scored correct if a number within ±10% of the manually parsed GT value appeared anywhere in the response (any-in-response,
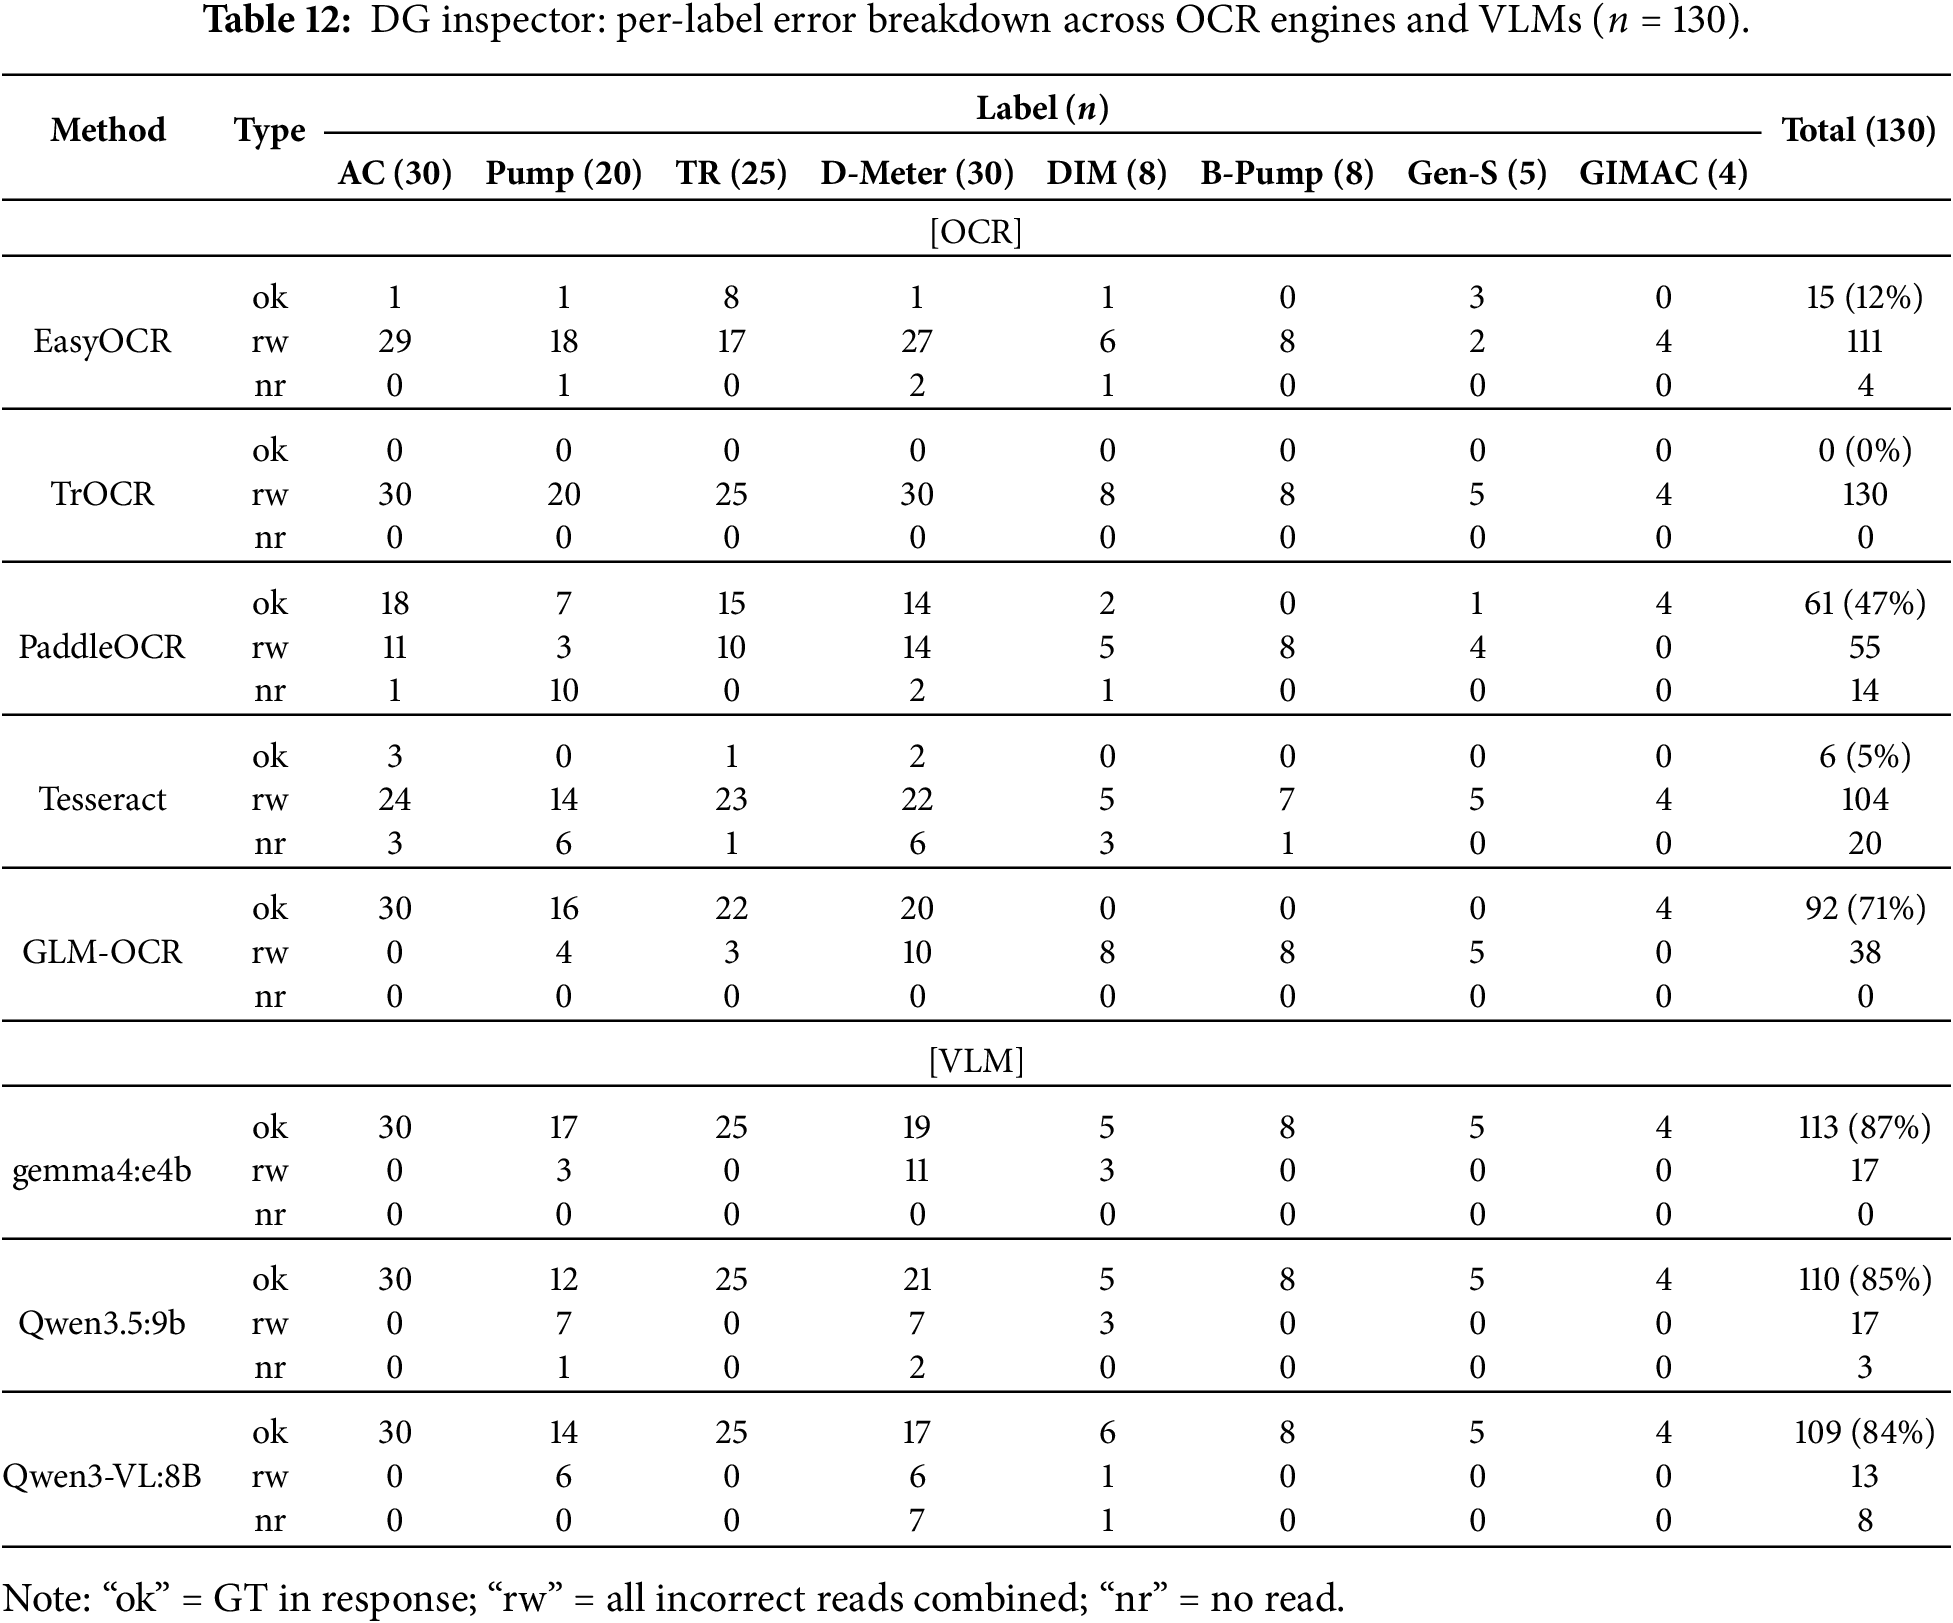
Consistent with the structural limitation identified in Section 4.5—indiscriminate recognition of all text within the ROI—OCR-based methods failed to distinguish target measurements from SCADA timestamps and panel labels; even with ROI cropping, PaddleOCR reached only 46.9%. By semantically specifying the target measurement through structured prompts, the current production sVLM (Qwen3-VL:8B) achieved 83.8%. Under the same evaluation criteria, gemma4:e4b (86.9%) and Qwen3.5:9b (84.6%) showed numerically higher accuracy, though the difference was not statistically significant, as detailed below; further improvements via backbone replacement are left for future work. The representative digital gauge reading results for each type are illustrated in Fig. 10.
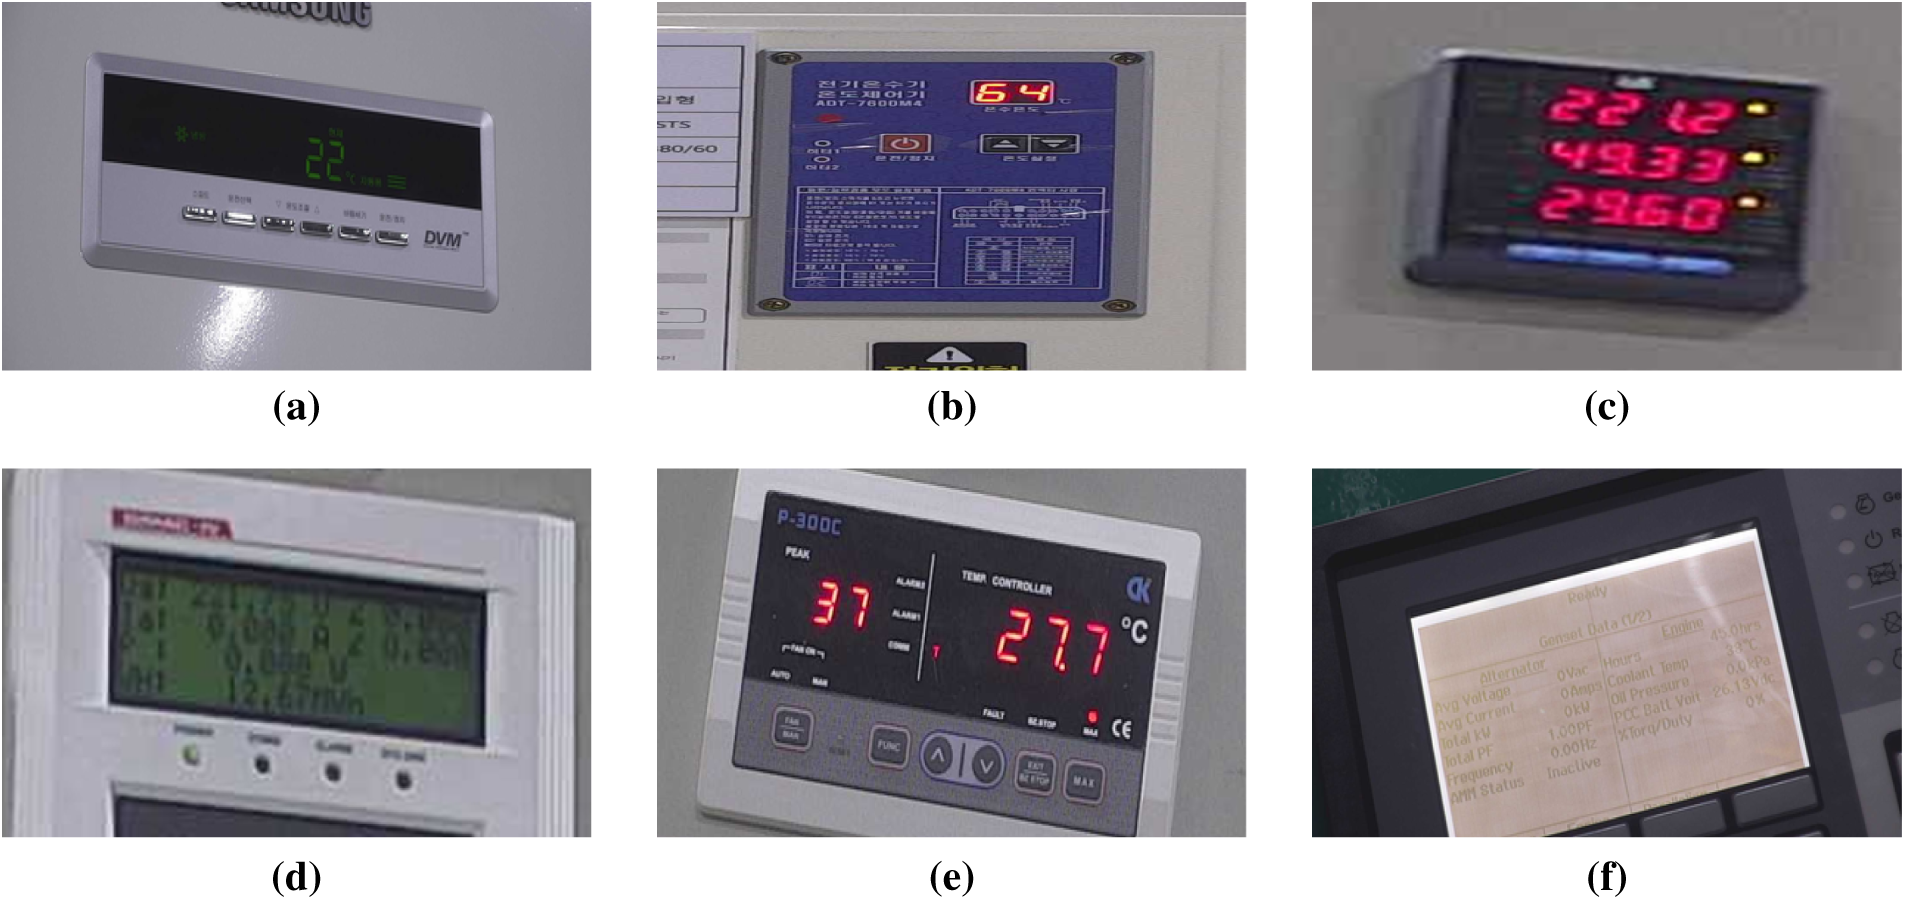
Figure 10: Digital gauge reading results of representative samples by type. (a) Air conditioner GT: 22/sVLM: 22 (b) Water heater GT: 64/sVLM: 64 (c) Pump GT: 221.2/sVLM: 221.2 (d) Integrated meter GT: 221.75/sVLM: 221.25 (e) Transformer temperature GT: 37/sVLM: 37 (f) On-site detection error GT: 38/sVLM: Unreadable.
We used Cochran’s Q test and pairwise McNemar tests (Edwards’ continuity correction) to statistically validate performance across all
To ensure the evaluation reliability of the Qualitative Inspector, we introduced a three-way validation framework, establishing a five-point rubric for six categories—including cleanliness, water leak, oil leak, combined water/oil leak, corrosion, and insulation damage—and illustrating the evaluation criteria with 30 anchor images (Fig. 11). The combined leak (WO) category aggregates cases involving concurrent water and oil leakage for evaluation purposes; it is not an independent VQA output dimension. The full text of the rubric is provided in Appendix A. Subsequently, the
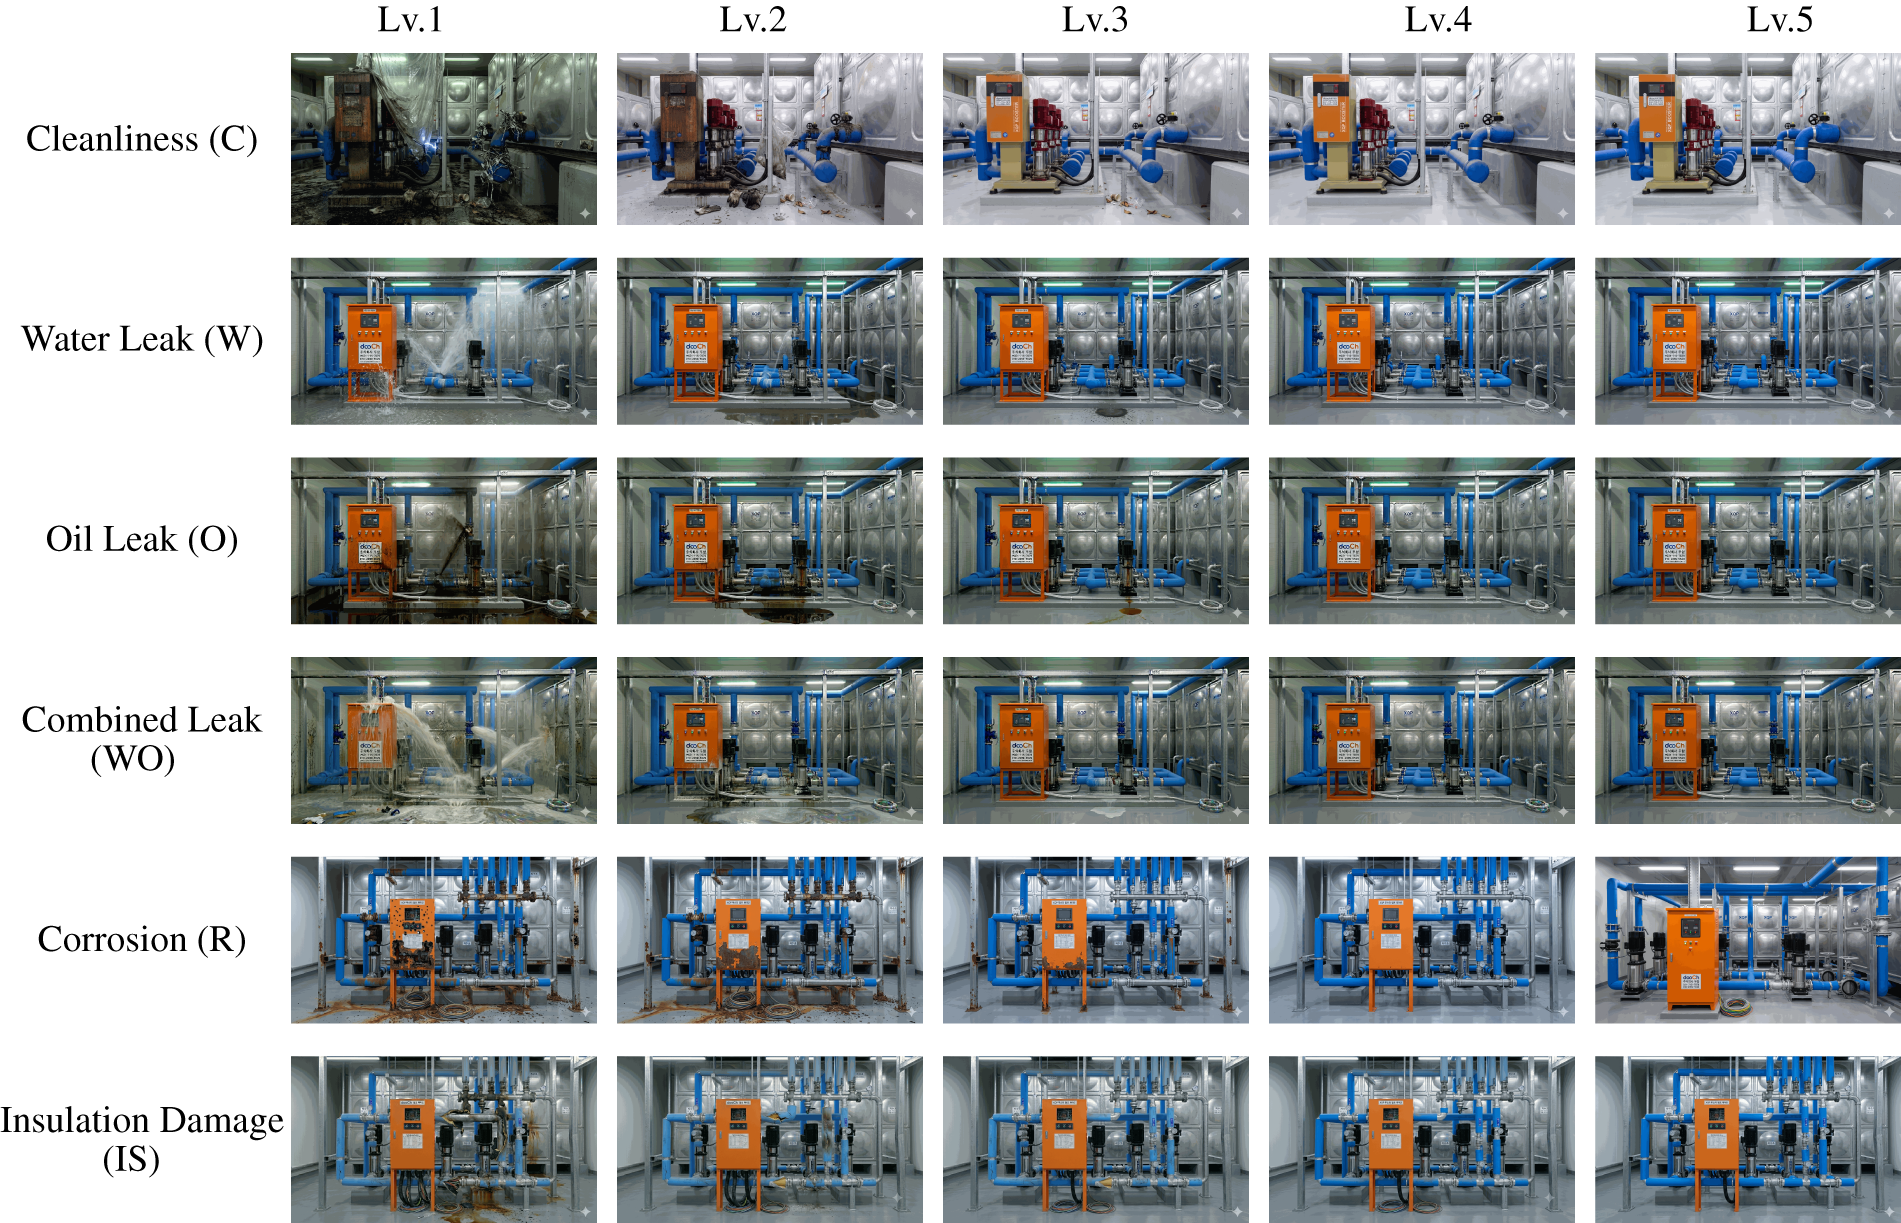
Figure 11: Rubric anchor images used for three-way validation (
The analysis results of the three validation legs are presented in Table 14. In Leg A (inter-expert agreement), an average pairwise weighted kappa of 0.793 was obtained among the four experts, indicating the high reliability of the GT. Leg B (expert group vs. GT), which measures the agreement between the rounded average of the four experts’ scores and the GT, achieved an overall
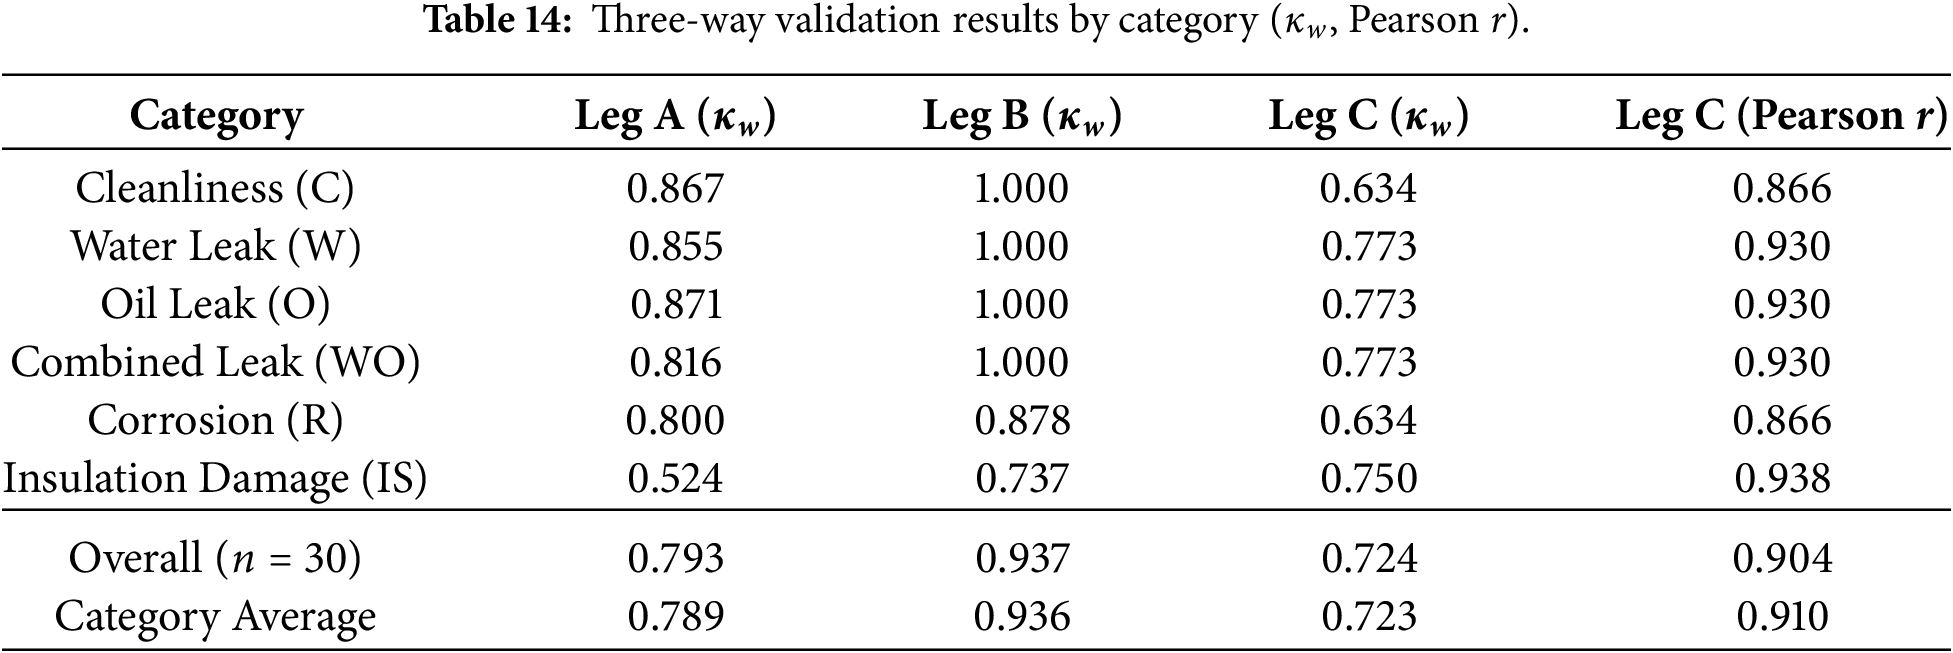
In a preliminary comparison, prompting without the five-point rubric yielded
5.7 Overall System Performance Summary and Coverage
Taken together, these experimental results indicate that system reliability is determined by the cumulative accuracy secured independently at each pipeline stage. In the detection stage, the pipeline’s input quality is ensured with an mAP@0.5 of 97.31%. By achieving a matching error rate of 0% in both label matching and spatial alignment, detection results are transferred to the inspectors without any item mismatch.
In the inspector stage, we verified the reliability of the AG Inspector (%FS 1.66%, n = 200), the DG Inspector (83.8%, n = 130), the Qualitative Inspector (
Table 15 summarizes the key performance indicators for the four types of inspectors, and Table 16 presents the overall inspection status of a total of 11,692 inspection trials.

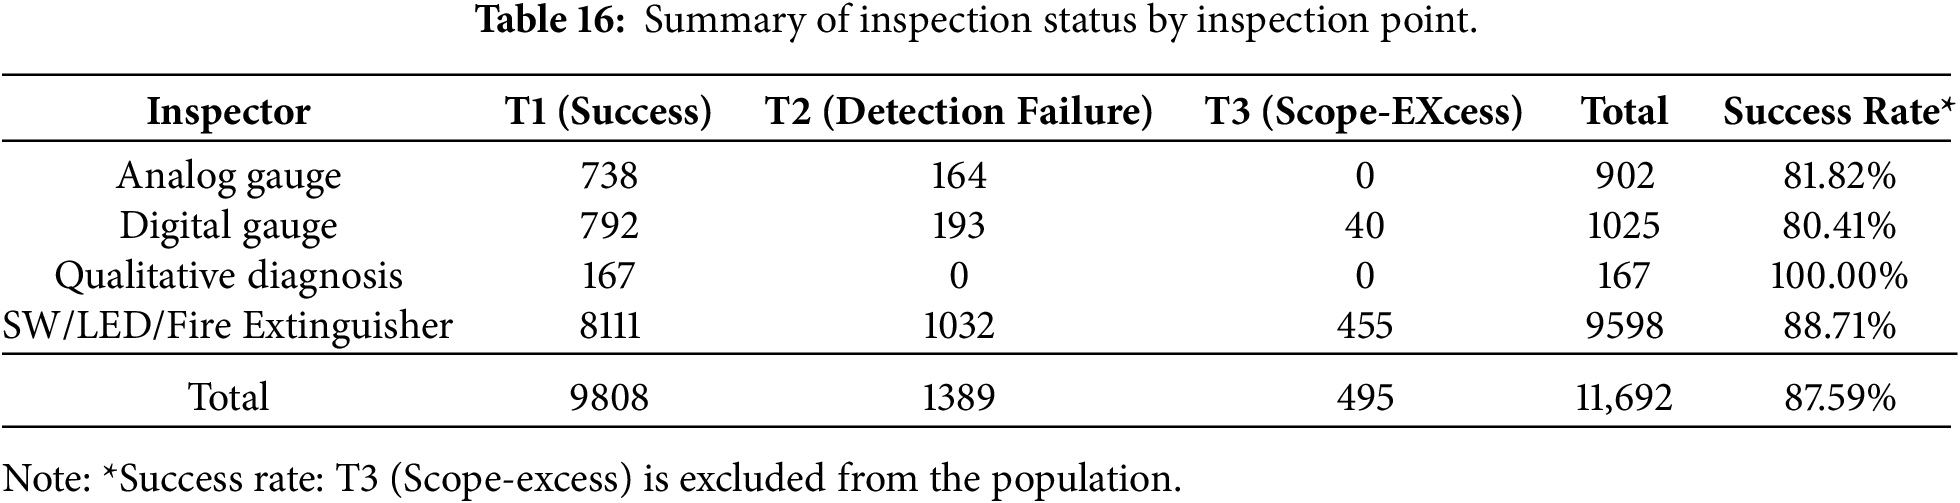
The 11,692 patrol inspections, accumulated across seven inspection zones over approximately one month of operational deployment, are classified into 9808 cases of T1 (automated inspection success), 1389 cases of T2 (detection failure), and 495 cases of T3 (scope-excess detection), yielding a success rate of 87.6% based on the registered inspection points (T1 + T2).
T1 denotes cases where the registered inspection points in the database were correctly detected and the readings were successfully obtained. T2 represents instances where the detector failed to locate the registered points, resulting in a ‘Not Found’ record. T3 corresponds to cases where the detection model successfully detected the object, but the object was excluded from evaluation as unregistered equipment in the database. Because T3 is attributed to the absence of management database entries rather than AI detection failure, it is excluded from the denominator of the success rate calculation.
The observed causes of T2 are as follows. First, owing to deviations in measured illuminance across zones (ranging from a minimum of 15 lx to a maximum of 366 lx), high-illuminance areas such as battery rooms (366 lx) and electrical rooms (211 lx) suffer from direct reflection of fluorescent lights on the front protective cover of digital gauges. This lighting variation and reflection lead to failures in boundary detection.
Second, positioning errors of the robot (approximately 10–20 cm) during waypoint stops cause targets to either fall outside the field of view or be occluded by surrounding structures. For certain facilities, consecutive ‘Not Found’ records accumulated over time because targets remained occluded by materials stacked over an extended period.
Third, in confined zones such as machine rooms and generator rooms (passage width of approximately 1.5 m), oblique lateral image capture causes aspect ratio distortion, which leads to failures in YOLO anchor matching and subsequent drops in confidence scores below the threshold.
Fourth, resolution limitations for small objects: those measuring a few centimeters or less, such as LED_Green-dot_on (83 cases) and SW_Knob_Left (75 cases), fail to be detected due to degraded image contrast and pixel sparsity in low-illuminance environments, including fuel tank rooms (15 lx) and UPS rooms (60 lx).
By zone, structural occlusion is the primary cause of failures in generator rooms (270 cases, 19.44%), whereas panel reflection interference is the dominant cause in electrical rooms (250 cases, 18.00%). As for reading-stage reliability, no VLM hallucinations were observed (0 cases) during the operational period; however, because they cannot be entirely eliminated, an operator verification process is recommended.
To verify the real-time applicability on edge devices, we empirically measured the inference latency and resource utilization of each module on the NVIDIA Jetson Thor over 20 runs (Table 17). The DG Inspector and Qualitative Inspector latencies reported in the table were measured under warm conditions, with models preloaded in memory. Under cold-start conditions (reloading the model after Ollama TTL expiration), the process could exceed 55 s; this latency is mitigated in operational environments by deploying keep-alive configurations or executing periodic warm-up calls.
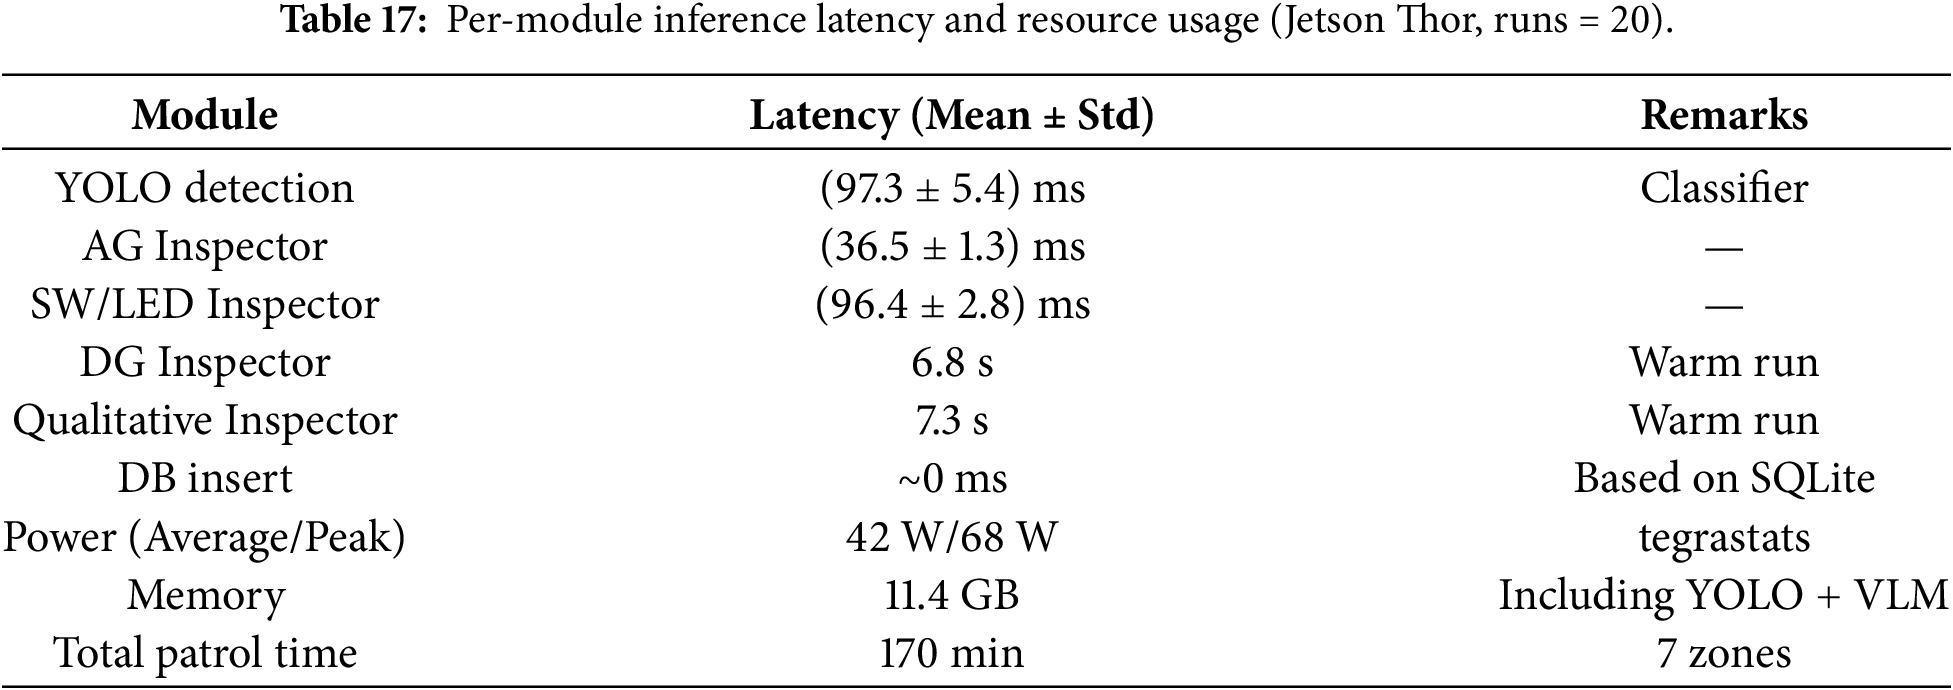
6.1 Effect of Multi-Expert Agent Collaborative Design
This study proposes distributing roles among expert agents equipped with algorithms optimized for specific tasks, rather than processing heterogeneous inspection tasks with a single general-purpose model. The performances of the AG Inspector (%FS 1.66%), DG Inspector (83.8%), SW/LED Inspector (mAP@0.5 97.31%), and Qualitative Inspector (Leg C
Second: Validation in a real operational environment. We validated the proposed system using 11,692 autonomous patrol cases accumulated over approximately one month of operational deployment across seven inspection zones in an underground power ICT infrastructure. Under real-world conditions including illumination variation, physical occlusion, and deployment-induced noise, an autonomous inspection success rate of 87.6% was achieved based on the registered inspection points (
Third: Structured database output and edge-autonomous execution. The inspection output is not a simple classification label but a relational database record structured at the inspection-point unit level, providing a continuous, auditable data stream for downstream PHM time-series trend analysis. The entire pipeline runs autonomously on a single edge board (NVIDIA Jetson Thor) without cloud dependency—a deployment constraint rarely addressed in cloud-dependent VLM-based inspection studies, but required for real-time operation in network-constrained underground environments.
The accuracy discrepancy between the general-purpose OCR (PaddleOCR) and the sVLM (Qwen3-VL:8B) in the DG Inspector (46.9% vs. 83.8%, under the identical ROI condition with n = 130; Section 5.5) does not merely reflect a difference in model performance; it originates from their contrasting design philosophies. The sVLM’s semantic reasoning capability, reinforced by structured prompting, is key to overcoming the disambiguation limitation—distinguishing target measurements from SCADA timestamps and panel labels—that constrains OCR-based approaches.
6.2 Practical Implications of Area-Based Z-Depth Approximation
The reliable scene separation achieved by the proposed area-based Z-depth approximation across all scenes in the spatial alignment experiment (Exp3) carries two practical implications.
First, computationally, separating the foreground and background solely by calculating the bounding box area, without deploying a separate depth estimation model (e.g., MiDaS-small or Depth Anything 3), offers a computational advantage in real-time edge environments. Although deep learning-based monocular depth estimation entails an inference latency of tens to hundreds of milliseconds per frame, the area-based alignment requires only a sorting operation of
Notably, the area-based Z-depth approximation is a site-specific methodology whose validity rests on the two conditions above—regular front/back-row grid arrangement and comparable equipment sizes—together with a camera viewpoint that captures both rows simultaneously. Porting the system to sites with modified camera positions, atypical arrangements, or heterogeneous equipment sizes therefore requires separately verifying these prerequisites, making immediate generalization challenging.
6.3 Qualitative Diagnostic Reliability of Small VLMs and GT Design Issues
The three-way validation of the Qualitative Inspector (Leg C,
These issues offer important implications for the future construction of qualitative diagnostic systems. Before evaluating AI model reliability, the reliability of expert annotations must itself be validated: the cleanliness item’s high inter-expert agreement (Leg A
6.4 Implications for AI-Based PHM Pipelines
The experimental results of this study demonstrate that the proposed AIIE constitutes a viable and scalable data acquisition and condition monitoring layer for AI-based PHM of underground power ICT infrastructure.
Within the PHM pipeline, the proposed system is responsible for the first two stages, namely data acquisition and condition monitoring, while simultaneously generating structured and timestamped health records required for subsequent prognostics and maintenance decision support. The quantitative readings generated by the AG Inspector and DG Inspector represent time-series operational parameters that can be directly input into anomaly detection or RUL prediction models. The discrete state output of the SW/LED Inspector provides binary health indicators suitable for fault diagnosis logic, and the rubric-based five-point scale qualitative scores generated by the Qualitative Inspector encode degradation severity in a structured format that facilitates trend analysis.
Specific PHM scenarios implementable using the proposed system are as follows. Through multiple autonomous patrol cycles, the AIIE accumulates a longitudinal database of heterogeneous equipment health indicators. Statistical process control or machine learning-based anomaly detection models applied to this database can identify gradual degradation trends (e.g., a continuous rise in coolant pressure gauge readings or a progressive deterioration of the insulation appearance score) and trigger preventive maintenance actions before functional failure occurs. The three-layer Directive–Orchestration–Execution architecture ensures that these monitoring scenarios can be reconfigured or extended to new equipment without modifying the underlying sensing agents. This supports PHM strategies that evolve as the infrastructure ages.
With these capabilities, the AIIE functions as a mobile sensing backbone for AI-based PHM in environments where dense stationary sensor deployment is impractical, extending beyond its role as an inspection tool.
6.5 Limitations and Future Work
We conducted this study at a single facility, the KEPCO Power ICT Center. The generalizability of the proposed system to various facility types, lighting conditions, and equipment configurations therefore requires further validation. Furthermore, deploying the system to new sites requires registering inspection points in the database and reconstructing patrol routes.
In addition, the following limitations exist: (i) performance validation under systematic low-light conditions was not conducted; (ii) manual inspection was maintained for 42.2% (523 points) of the total inspection points due to physical inaccessibility, structural constraints of the equipment, or the characteristics of the operational and environmental measurement items; (iii) a risk of VLM hallucination remains, which is mitigated through structured prompts but cannot be entirely eliminated, necessitating an operator verification process.
In particular, the reliability of the area-based Z-depth approximation requires separate validation in environments with different equipment densities and depth distributions, which we identify as a direction for future work.
It remains a future challenge to incorporate manipulative inspection capabilities—such as contact-based measurements or panel-opening and- closing operations—by modifying the robot’s operating environment or deploying additional payloads.
Fig. 12 shows the challenges encountered during field deployment and directions for future improvement.
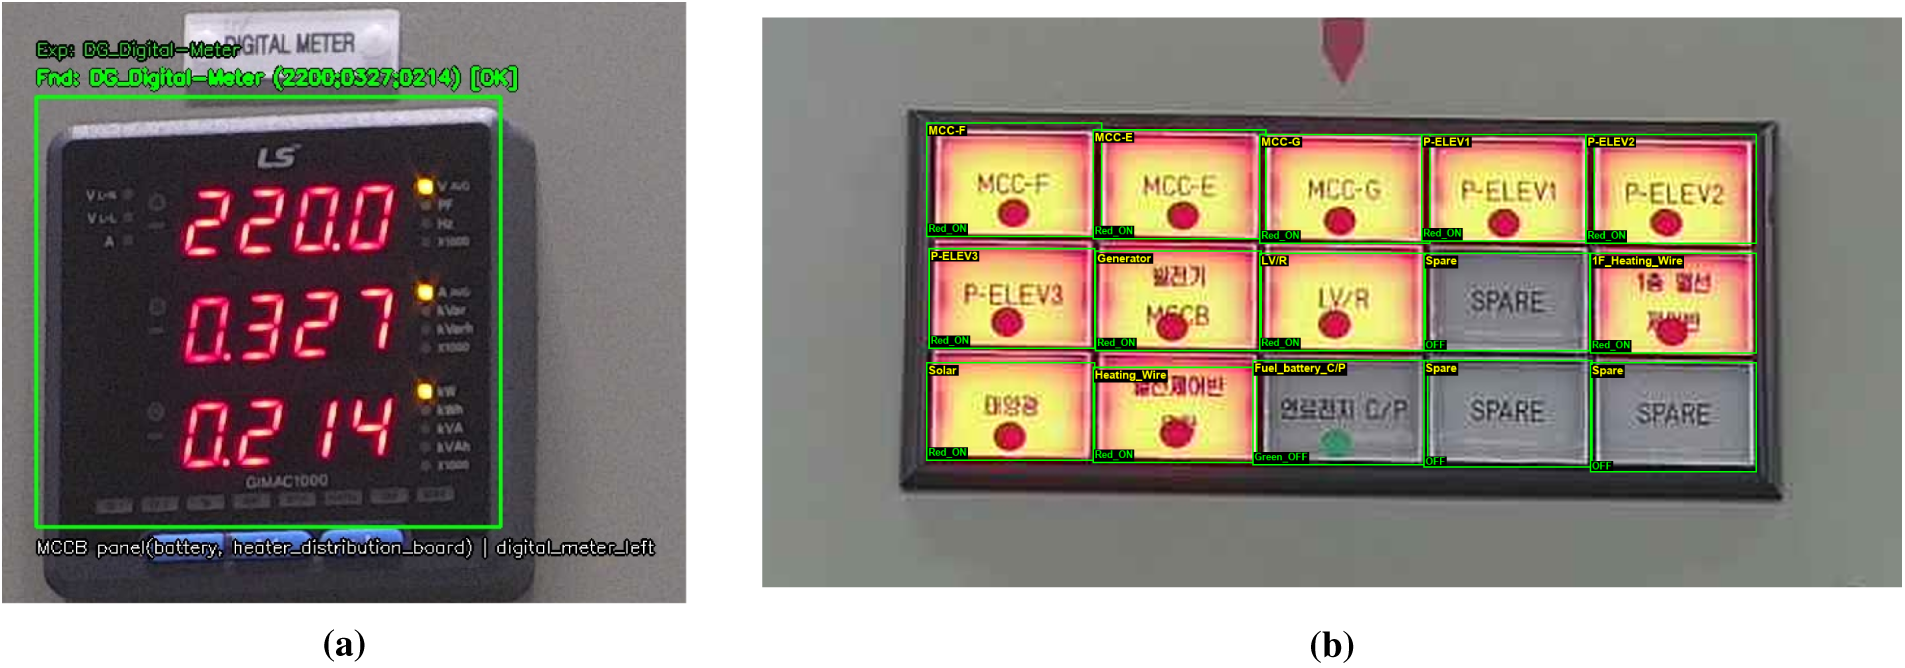
Figure 12: Challenges and directions for future improvement in field deployment (a) Digital gauge readout error (GT: 220.0, 0.327, 0.214/sVLM: 2200, 0327, 0214) (b) Semantic linking of detected LED panel locations.
Analysis of the data collected in the operating environment revealed two major misrecognition patterns when reading 7-segment digital gauges, as illustrated in Fig. 12a. The first is the failure to recognize decimal points. Due to changes in illumination or subtle camera shake, the light-emitting decimal points of LEDs are either treated as noise or not clearly distinguished from the background, resulting in scale errors such as misreading ‘220.0’ as ‘2200’. The second pattern is the over-segmentation error for characters with a narrow physical width, such as the digit ‘1’. In 7-segment fonts, the digit ‘1’ occupies a very narrow pixel region compared to other digits and is displayed close to the right margin. The model therefore misidentifies it as a space rather than a continuous character, causing adjacent digits to be segmented into separate data fragments. These limitations remain to be resolved in future work through prompt engineering and preprocessing techniques specialized for gauge displays.
Another major limitation of the current implementation, shown in Fig. 12b, is the substantial human effort required to associate the physical locations of detected LED panels with the semantic information of the equipment.
The current implementation of the directive layer relies on a labor-intensive process in which administrators manually input metadata to map the operational states of each target panel to its corresponding text label (e.g., MCC-F and P-ELEV3). This manual mapping approach severely degrades maintenance efficiency when the inspection facilities are expanded or when panel layouts are modified.
Consequently, an approach employing VLMs is required to simultaneously interpret spatial layouts and visual text information contained in images. By utilizing VLMs to automatically recognize OCR information and equipment states on panels and link them to the semantic structure of a digital twin or an inspection database, the system can achieve intelligent semantic linking while minimizing manual definitions in the predefined directive layer.
This automated pipeline would therefore provide a foundation for generating and delivering high-level contextual information, such as “Anomaly detected in the solar indicator on panel P-ELEV3,” eliminating the need for manual intervention when reporting inspection results to operators.
This paper proposed AIIE, a Physical-AI-based, PHM-enabling autonomous health monitoring platform for underground power ICT infrastructure, and validated its effectiveness in real operating environments including machine and electrical rooms. By integrating four specialized inspectors—AG, DG, SW/LED, and qualitative diagnosis—into a three-layer Directive–Orchestration–Execution microservice architecture, the system functions as a PHM sensing backbone that can be deployed in heterogeneous industrial environments without architectural redesign.
To address spatial matching challenges, this study proposed an area-based Z-depth approximation that separates front and rear equipment rows using only the reciprocal of the bounding box area (
The individual inspectors achieved the following quantitative performance: the AG Inspector recorded a %FS error of 1.66% with a 95% bootstrap CI of [1.31, 2.11] (
At the system level, a successful automated inspection rate of 87.6% was attained based on the 11,197 inspection cases involving registered inspection points (T1 + T2), collected among 11,692 real-world autonomous patrol cases. The remaining T2 cases are non-detections caused by constraints in patrol viewpoints and path coverage. This reflects a system coverage metric rather than classification errors of the detection models.
However, 523 of the 1240 inspection points (42.2%) still require manual inspection, and this validation remains restricted to a single site. Future research directions include: (i) expanding physical coverage; (ii) applying the area-based Z-depth approximation to heterogeneous sites and validating adaptive calibration; (iii) replacing the DG Inspector backbone with alternative VLMs such as gemma4:e4b (86.9%); and (iv) integrating anomaly trend analysis and preventive maintenance subtasks using long-term patrol data.
Acknowledgement: None.
Funding Statement: This work was supported by the Korea Electric Power Corporation (KEPCO) (Project No. R25IA04).
Author Contributions: The authors confirm contribution to the paper as follows: Conceptualization: Jaekyung Lee and Wonhee Kim; Methodology: Jaekyung Lee and Byungsung Ko; Software: Jaekyung Lee and Byungsung Ko; Validation: Jaekyung Lee, Taewon Kim, Seoktae Kim, Jaeheon Park and Jiwon Lee; Formal Analysis: Jaekyung Lee and Byungsung Ko; Investigation: Jaekyung Lee, Byungsung Ko and Taewon Kim; Data Curation: Jaekyung Lee, Jaeheon Park and Jiwon Lee; Original Draft: Jaekyung Lee; Review and Editing: Jaekyung Lee, Jaeheon Park, Taewon Kim and Wonhee Kim; Supervision: Wonhee Kim. All authors reviewed and approved the final version of the manuscript.
Availability of Data and Materials: The datasets used and/or analyzed during the current study are not publicly available due to confidentiality agreements with the Korea Electric Power Corporation (KEPCO), but can be obtained from the corresponding author upon reasonable request and with the approval of KEPCO.
Ethics Approval: Not applicable.
Conflicts of Interest: The authors declare no conflicts of interest.
Supplementary Materials: The supplementary material is available online at https://www.techscience.com/doi/10.32604/cmc.2026.085203/s1.
Appendix A Experimental Reproducibility Information
Appendix A.1 Dataset and AnnotationThe training dataset (68 classes) consists of approximately 11,000 images of switches, LEDs, and gauge panels captured in the underground facilities at the KEPCO Power ICT Center, and the resulting detector achieved mAP@0.5 = 97.31%. The training and validation datasets were split in an 80:20 ratio. A single trained annotator performed image annotation using the X-AnyLabeling tool [48], excluding objects with less than 30% visibility.
Appendix A.2 Image Acquisition Equipment and Field IlluminationThe acquisition equipment comprised a Boston Dynamics SpotCam Plus IR PTZ camera (2 MP, 1920
The inference hardware and VLM deployment configuration follow Section 5.1. We deployed the VLM using Qwen3-VL:8B (Q4 GGUF, 8.8B parameters) through Ollama.
Appendix A.4 VLM Prompt TemplateA representative example of the rubric-based VLM prompt used in the Qualitative Inspector (Class_Clean_Water_Oil_Rust):
Rate each item 1–5. RULE: 1 = worst problem, 5 = no problem.
Output format: (score|score|score|score). No other text.
(1) Cleaning State: 5 = Pristine, zero dust/debris
(2) Water Leakage: 5 = Completely dry, no water
(3) Oil Leakage: 5 = Completely dry, no oil
(4) Corrosion/Rust: 5 = Zero rust, paint perfect
When evaluating a single category, only the prompt for the corresponding item is used. The rubric for Insulation State is as follows:
(5) Insulation State—look at ALL pipes/cables, score the WORST one: 5 = Perfect, smooth, intact, zero damage
Below is the pseudocode for the markerless homography correction and angle-to-value conversion of AG Inspector Stage 3.
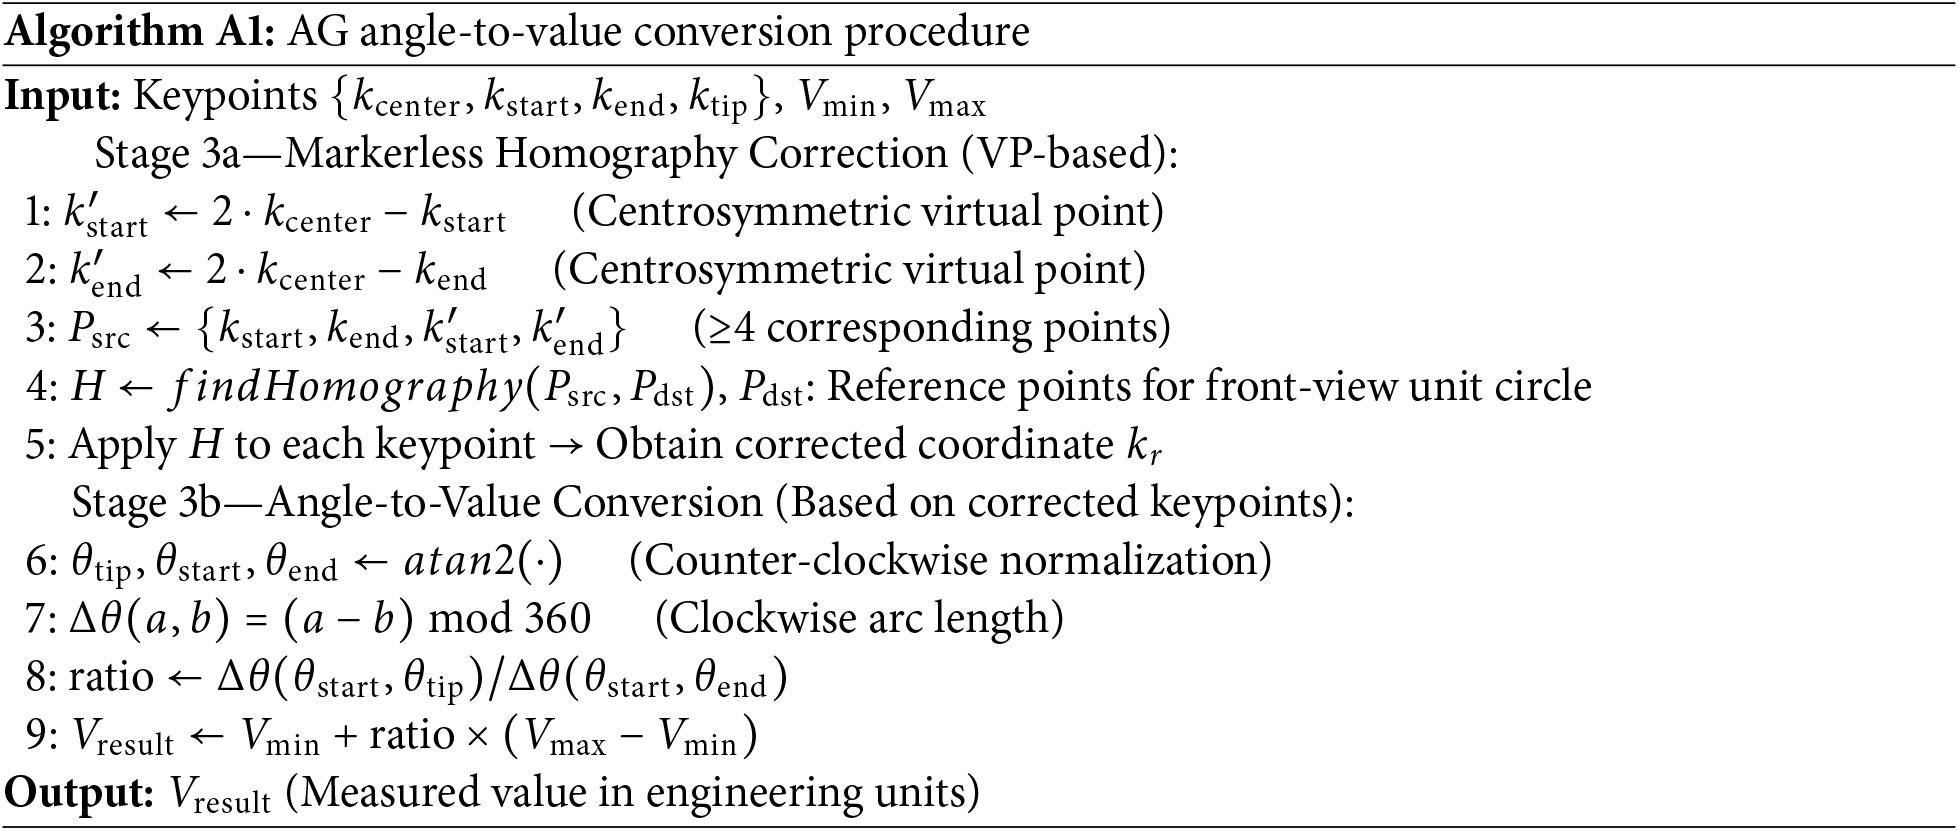
Appendix A.6 Z-depth Approximation Procedure: Below is the pseudocode for the area-based Z-depth approximation to resolve front/rear row ambiguity in spatial matching.
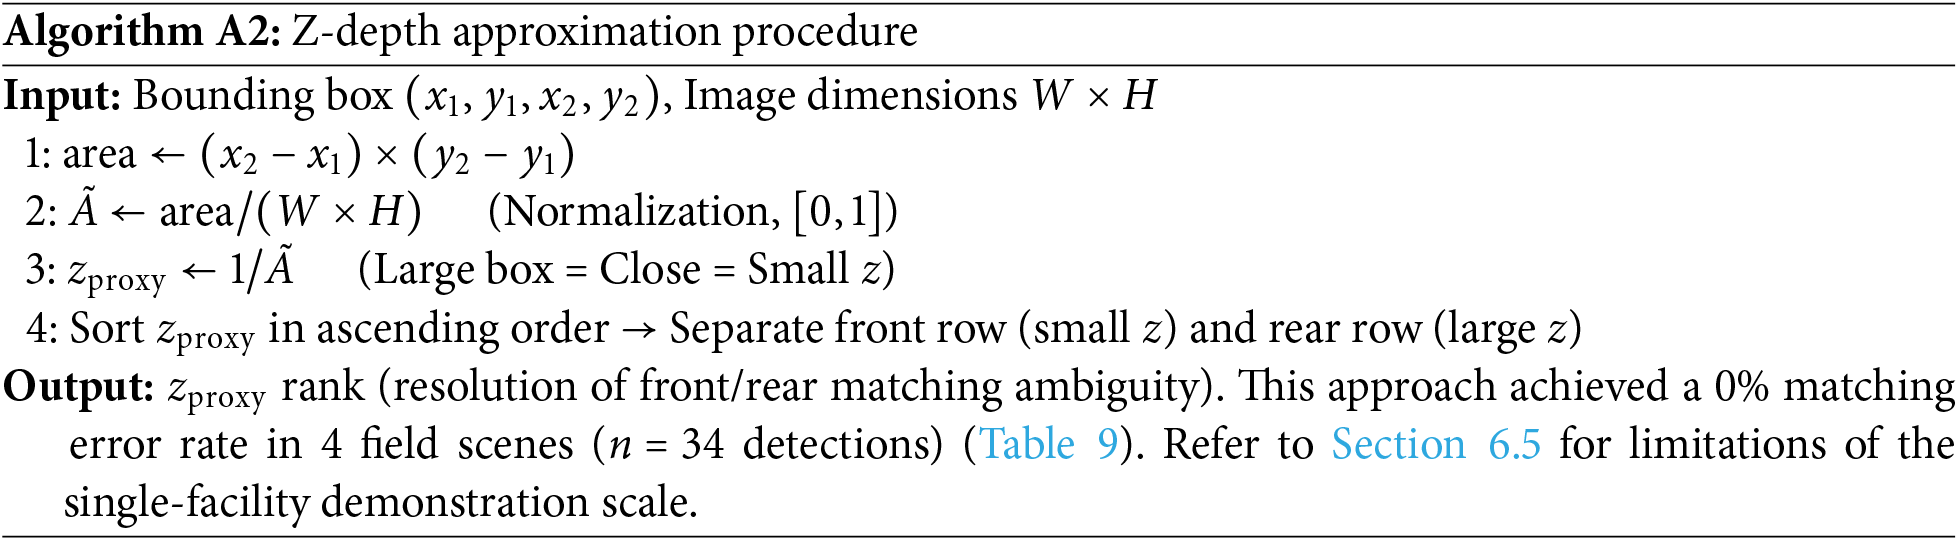
References
1. Halder S, Afsari K. Robots in inspection and monitoring of buildings and infrastructure: a systematic review. Appl Sci. 2023;13(4):2304. doi:10.3390/app13042304. [Google Scholar] [CrossRef]
2. Lee AJ, Song W, Yu B, Choi D, Tirtawardhana C, Myung H. Survey of robotics technologies for civil infrastructure inspection. J Infrastruct Intell Resil. 2023;2(1):100018. doi:10.1016/j.iintel.2022.100018. [Google Scholar] [CrossRef]
3. Wei X, Rey WP. Advancements in substation inspection robots: a review of research and development. E3S Web Conf. 2024;528(4):02017. doi:10.1051/e3sconf/202452802017. [Google Scholar] [CrossRef]
4. Mineo C, Cerniglia D, Poole A. Autonomous robotic sensing for simultaneous geometric and volumetric inspection of free-form parts. J Intell Robot Syst. 2022;105(3):54. doi:10.1007/s10846-022-01673-6. [Google Scholar] [CrossRef]
5. Konstantinidis FK, Balaska V, Symeonidis S, Mouroutsos SG, Gasteratos A. AROWA: an autonomous robot framework for Warehouse 4.0 health and safety inspection. In: Proceedings of the 30th Mediterranean Conference on Control and Automation (MED); 2022 Jun 28–Jul 1; Athens, Greece. p. 494–9. [Google Scholar]
6. Gehring C, Fankhauser P, Isler L, Diethelm R, Bachmann S, Potz M, et al. ANYmal in the field: solving industrial inspection of an offshore HVDC platform. In: Field and service robotics. Cham, Switzerland: Springer; 2021. p. 247–60. [Google Scholar]
7. Hutter M, Gehring C, Lauber A, Gunther F, Bellicoso CD, Tsounis V, et al. ANYmal—toward legged robots for harsh environments. Adv Robot. 2017;31(17):918–31. doi:10.1080/01691864.2017.1378591. [Google Scholar] [CrossRef]
8. DeepRobotics. Industrial solutions for quadruped robots: digital power and infrastructure inspection. 2026 [cited 2026 Jan 1]. Available from: https://www.deeprobotics.cn/en/index/industry.html#part1. [Google Scholar]
9. Energy Robotics. Automating industrial inspection rounds with autonomous mobile robots. 2024 [cited 2026 Jan 1]. Available from: https://www.energy-robotics.com/post/automating-industrial-inspection-rounds-with-autonomous-mobile-robots. [Google Scholar]
10. Dong Z, Gao Y, Yan Y, Chen F. Vector detection network: an application study on robots reading analog meters in the wild. arXiv:2105.14522. 2021. [Google Scholar]
11. Milana E, Ramírez-Agudelo OH, Estevam Schmiedt J. Autonomous reading of gauges in unstructured environments. Sensors. 2022;22(17):6681. doi:10.3390/s22176681. [Google Scholar] [PubMed] [CrossRef]
12. Reitsma M, Keller J, Blomqvist K, Siegwart R. Under pressure: learning-based analog gauge reading in the wild. In: Proceedings of the 2024 IEEE International Conference on Robotics and Automation (ICRA); 2024 May 13–17; Yokohama, Japan. p. 14–20. doi:10.1109/icra57147.2024.10610793. [Google Scholar] [CrossRef]
13. Leon-Alcazar J, Alnumay Y, Zheng C, Trigui H, Patel S, Ghanem B. Learning to read analog gauges from synthetic data. arXiv:2308.14583. 2023. [Google Scholar]
14. Zhang N, Yang G, Hu F, Yu H, Fan J, Xu S. A novel adversarial deep learning method for substation defect image generation. Sensors. 2024;24(14):4512. doi:10.3390/s24144512. [Google Scholar] [PubMed] [CrossRef]
15. Xu W, Yi W, Tan Y. Generative AI-driven data augmentation and object-guided vision-language reasoning for PPE compliance analysis in work-at-height. Adv Eng Inform. 2026;71:104364. doi:10.1016/j.aei.2026.104364. [Google Scholar] [CrossRef]
16. Lee J, Kim Y, Ko B, Kim T, Park J, Lee J, et al. Robust analog gauge reading via virtual point-based geometric rectification and P2-YOLO-pose. Comput Model Eng Sci. 2026;147(1):35. doi:10.32604/cmes.2026.080624. [Google Scholar] [CrossRef]
17. Bradski G. The OpenCV library. Dr Dobb’s J Softw Tools. 2000;25(11):120–3. [Google Scholar]
18. Long S, Ruan J, Zhang W, He X, Wu W, Yao C. TextSnake: a flexible representation for detecting text of arbitrary shapes. In: Computer Vision—ECCV 2018. Cham, Switzerland: Springer; 2018. p. 19–35. doi:10.1007/978-3-030-01216-8_2. [Google Scholar] [CrossRef]
19. Smith R. An overview of the tesseract OCR engine. In: Proceedings of the Ninth International Conference on Document Analysis and Recognition (ICDAR 2007) Vol 2; 2007 Sep 23–26; Curitiba, Brazil. p. 629–33. doi:10.1109/icdar.2007.4376991. [Google Scholar] [CrossRef]
20. JaidedAI. EasyOCR: ready-to-use OCR with 80+ languages supported. GitHub repository. 2020 [cited 2026 Jan 1]. Available from: https://github.com/JaidedAI/EasyOCR. [Google Scholar]
21. Du Y, Li C, Guo R, Yin X, Liu W, Zhou J, et al. PP-OCR: a practical ultra lightweight OCR system. arXiv:2009.09941. 2020. doi:10.48550/arXiv.2009.09941. [Google Scholar] [CrossRef]
22. Li M, Lv T, Chen J, Cui L, Lu Y, Florencio D, et al. TrOCR: transformer-based optical character recognition with pre-trained models. arXiv:2109.10282. 2021. [Google Scholar]
23. Duan S, Xue Y, Wang W, Su Z, Liu H, Yang S, et al. GLM-OCR technical report. arXiv:2603.10910. 2026. doi:10.48550/arXiv.2603.10910. [Google Scholar] [CrossRef]
24. Lin F, Liu Y, Xu H, Chen Y, He Z, Zhao M, et al. Do vision-language models measure up? Benchmarking visual measurement reading with MeasureBench. In: Proceedings of the IEEE/CVF Conference on Computer Vision and Pattern Recognition (CVPR); 2026 Jun 3–7; Denver, CO, USA. [Google Scholar]
25. Zhang J, Huang J, Jin S, Lu S. Vision-language models for vision tasks: a survey. arXiv:2304.00685. 2024. [Google Scholar]
26. Awais M, Naseer M, Khan S, Anwer RM, Cholakkal H, Shah M, et al. Foundational models defining a new era in vision: a survey and outlook. arXiv:2307.13721. 2023. [Google Scholar]
27. Adil M, Ahmed M, Aqib M, Gonzalez VA, Lee G, Mei Q. Integration of object detection and small VLMs for construction safety hazard identification. arXiv:2604.05210. 2026. [Google Scholar]
28. Ueno S, Hayashi Y, Nakatsuka S, Yamada Y, Aizawa H, Kato K. Vision-language in-context learning driven few-shot visual inspection model. In: Proceedings of the 20th International Conference on Computer Vision Theory and Applications (VISAPP); 2025 Feb 26–28; Porto, Portugal. p. 253–60. [Google Scholar]
29. Cao Q, Chen Y, Lu L, Sun H, Zeng Z, Yang X, et al. Generalized domain prompt learning for accessible scientific vision-language models. Nexus. 2025;2(2):100069. doi:10.1016/j.ynexs.2025.100069. [Google Scholar] [CrossRef]
30. Giedra H, Matuzevičius D, Sledevič T, Shubitidze G, Serackis A. Benchmarking large language model inference on limited-resource edge systems. Electronics. 2026;15(11):2451. doi:10.3390/electronics15112451. [Google Scholar] [CrossRef]
31. Bai J, Bai S, Yang S, Wang S, Tan S, Wang P, et al. Qwen-VL: a versatile vision-language model for understanding, localization, text reading, and beyond. arXiv:2308.12966. 2023. [Google Scholar]
32. Qwen Team. Qwen3-VL technical report. Model: qwen3-vl:8b via Ollama. arXiv:2511.21631. 2025. doi:10.48550/arXiv.2511.21631. [Google Scholar] [CrossRef]
33. Qwen Team. Qwen3.5-Omni technical report. arXiv:2604.15804. 2026. doi:10.48550/arxiv.2604.15804. [Google Scholar] [CrossRef]
34. Google DeepMind. Gemma 4 model card. Model: gemma4:e4b via Ollama. 2025 [cited 2026 Jan 1]. Available from: https://ai.google.dev/gemma/docs/core/model_card_4. [Google Scholar]
35. Fan C, Li Z, Ding W, Zhou H, Qian K. Integrating artificial intelligence with SLAM technology for robotic navigation and localization in unknown environments. Appl Comput Eng. 2024;67(1):8–13. doi:10.54254/2755-2721/67/2024ma0056. [Google Scholar] [CrossRef]
36. Ranftl R, Lasinger K, Hafner D, Schindler K, Koltun V. Towards robust monocular depth estimation: mixing datasets for zero-shot cross-dataset transfer. IEEE Trans Pattern Anal Mach Intell. 2022;44(3):1623–37. doi:10.1109/TPAMI.2020.3019967. [Google Scholar] [PubMed] [CrossRef]
37. Lin H, Chen S, Liew J, Chen DY, Li Z, Shi G, et al. Depth anything 3: recovering the visual space from any views. arXiv:2511.10647. 2025. doi:10.48550/arXiv.2511.10647. [Google Scholar] [CrossRef]
38. Ataei ST, Zadeh PM, Ataei S. Vision-based autonomous structural damage detection using data-driven methods. arXiv:2501.16662. 2025. [Google Scholar]
39. Khanam R, Hussain M. YOLOv11: an overview of the key architectural enhancements. arXiv:2410.17725. 2024. [Google Scholar]
40. Redmon J, Divvala S, Girshick R, Farhadi A. You only look once: unified, real-time object detection. In: Proceedings of the 2016 IEEE Conference on Computer Vision and Pattern Recognition (CVPR); 2016 Jun 27–30; Las Vegas, NV, USA. p. 779–88. doi:10.1109/cvpr.2016.91. [Google Scholar] [CrossRef]
41. Sousa G, Lima R, Trojahn C. Complex ontology matching with large language model embeddings. arXiv:2502.13619. 2025. [Google Scholar]
42. Bojanowski P, Grave E, Joulin A, Mikolov T. Enriching word vectors with subword information. Trans Assoc Comput Linguist. 2017;5(1):135–46. doi:10.1162/tacl_a_00051. [Google Scholar] [CrossRef]
43. Lei Y, Li N, Guo L, Li N, Yan T, Lin J. Machinery health prognostics: a systematic review from data acquisition to RUL prediction. Mech Syst Signal Process. 2018;104:799–834. doi:10.1016/j.ymssp.2017.11.016. [Google Scholar] [CrossRef]
44. Si XS, Wang W, Hu CH, Zhou DH. Remaining useful life estimation—a review on the statistical data driven approaches. Eur J Oper Res. 2011;213(1):1–14. doi:10.1016/j.ejor.2010.11.018. [Google Scholar] [CrossRef]
45. Zhao R, Yan R, Chen Z, Mao K, Wang P, Gao RX. Deep learning and its applications to machine health monitoring. Mech Syst Signal Process. 2019;115(1):213–37. doi:10.1016/j.ymssp.2018.05.050. [Google Scholar] [CrossRef]
46. Zhang W, Yang D, Wang H. Data-driven methods for predictive maintenance of industrial equipment: a survey. IEEE Syst J. 2019;13(3):2213–27. doi:10.1109/jsyst.2019.2905565. [Google Scholar] [CrossRef]
47. Serradilla O, Zugasti E, Rodriguez J, Zurutuza U. Deep learning models for predictive maintenance: a survey, comparison, challenges and prospects. Appl Intell. 2022;52(10):10934–64. doi:10.1007/s10489-021-03004-y. [Google Scholar] [CrossRef]
48. Wang W. Advanced auto labeling solution with added features. GitHub; 2023 [cited 2026 Jan 1]. Available from: https://github.com/CVHub520/X-AnyLabeling. [Google Scholar]
Cite This Article
 Copyright © 2026 The Author(s). Published by Tech Science Press.
This work is licensed under a Creative Commons Attribution 4.0 International License , which permits unrestricted use, distribution, and reproduction in any medium, provided the original work is properly cited.
 Downloads
 Citation Tools
