
 Login
Login Register
 Submit a Paper
 Propose a Special lssue
 Open Access
ARTICLE
A Multi-Level Equivalent Driving Force Framework for Fatigue Life Prediction of Nickel-Based Single-Crystal Superalloys under Stress Ratio and Notch Effects
1 School of Mechanics and Transportation Engineering, Northwestern Polytechnical University, Xi’an, China
2 School of Civil Aviation, Northwestern Polytechnical University, Xi’an, China
3 Northwest Institute of Mechanical and Electrical Engineering, Xianyang, China
4 Science and Technology on Electromechanical Dynamic Control Laboratory, Xi’an, China
* Corresponding Authors: Yeda Lian. Email: ; Leike Yang. Email:
Computers, Materials & Continua 2026, 89(2), 17 https://doi.org/10.32604/cmc.2026.087556
Received 18 June 2026; Accepted 17 August 2026; Issue published 15 September 2026
 View Full Text
 Download PDF
Abstract
Hot-section nickel-based single-crystal superalloy components under isothermal cyclic loading often exhibit systematic life shifts when datasets span different stress ratios and notch severities, making it difficult to maintain a globally consistent parameter set using conventional models. Because the effects of temperature, stress ratio, and stress concentration on cyclic response and damage evolution are typically nonlinear and coupled, this study proposes a multi-level equivalent driving force framework for fatigue life prediction, in which condition-induced life differences are represented as comparable shifts on a unified engineering driving-force scale. The proposed framework links the nominal cyclic response, the notch-root equivalent response, and crystallographic orientation weighting. Nominal responses from stress-controlled and strain-controlled tests are first unified using the cyclic Ramberg–Osgood relation, and the notch-root elastoplastic response is estimated using Neuber localization. The obtained notch-root equivalent stress response is then combined with the crystallographic Schmid factor to define an equivalent shear-type driving parameter for life correlation. Stress-ratio and notch corrections are introduced sequentially on a baseline master-curve framework to construct an equivalent driving force and identify one parameter set for each alloy–temperature combination. The validation results demonstrate that, at a fixed temperature, the proposed approach provides a unified description across multiple stress ratios and notch severities and maintains stable predictive consistency for combined conditions not included in calibration, with controlled prediction scatter.Keywords
Nickel-based superalloys, benefiting from a multi-mechanism strengthening architecture dominated by the γ/γ′ system, can retain excellent high-temperature strength over the service window of 650°C–1100°C [1–4]. They therefore constitute key structural materials for load-bearing hot-section components in aero-engines and gas turbines [5–8]. Under realistic service conditions, such components are typically subjected to coupled thermal–mechanical cyclic loading, where fatigue life is governed by pronounced interactions among temperature (T), stress ratio (Rσ), and geometric discontinuities characterized by the stress concentration factor (Kt) [9–11]. Temperature can shift the dominant damage mechanisms through its influence on cyclic deformation, time-dependent creep, microstructural evolution, and environmental effects [12–14]; stress ratio modifies the cyclic mean stress level and tension–compression asymmetry [15,16]; meanwhile, notches, fillets, and holes introduce multiaxial constraint and stress redistribution near the notch root, accelerating damage accumulation and complicating unified life assessment.
Across the effects of temperature, stress ratio, material defects, and stress concentration, prior studies have established substantial experimental evidence and mechanistic understanding [17–19]. Regarding temperature effects, He et al. reported a characteristic life maximum and turning point in the intermediate-temperature range for a directionally solidified nickel-based alloy tested from 550°C to 850°C, accompanied by systematic changes in fracture morphology and crack-growth characteristics [20]. For single-crystal systems, Wang et al. further showed that cyclic deformation mechanisms and crack-growth tendencies are strongly temperature-sensitive, highlighting the role of temperature in altering the dominant slip and damage paths [21]. Regarding stress-ratio effects, Gupta et al. demonstrated that increasing Rσ from −1 to higher positive values reduces the fatigue strength at 107 cycles and shifts the S–N curves downward overall for directionally solidified CM247LC at 650°C, reflecting the systematic influence of mean stress at elevated temperatures [22]. The coupling between mean stress and high-temperature oxidation may further deteriorate fatigue performance, potentially amplifying the apparent Rσ dependence through oxidation and stress-relaxation processes [23,24]. Rσ effects are commonly treated using the Walker model and the Smith–Watson–Topper (SWT) parameter and their variants, although the associated correction parameters are often material- and life-regime-dependent and require calibration for target conditions [25]. For notch effects, Shi et al. showed via in situ observations at 850°C that Kt markedly alters crack initiation location and life partitioning in U-shaped notched DZ125 specimens, closely related to the local principal stress and the position of peak equivalent stress in the notch region [26]. Notch-life conversion based on the critical distance theory has also been applied to high-temperature notched low-cycle fatigue (LCF), demonstrating the feasibility of linking local fields to life through a characteristic length [27,28], while Neuber’s rule remains widely used for engineering approximations of notch-root elastoplastic response and preprocessing in life assessment [29].
From a modeling perspective, fatigue life prediction for nickel-based superalloys can be broadly divided into macroscopic parameter-based approaches and mechanistic approaches. At the macroscopic level, classical stress–life and strain–life relations form the basis, including the Basquin law for high-cycle fatigue (HCF) [30], the Coffin relation for plastic strain-controlled fatigue [31], and the Manson total-strain framework bridging different life regimes [32]. Mean-stress effects are typically incorporated via SWT [33], and notch effects are often addressed through localization schemes such as Neuber’s rule [34]. In contrast, mechanistic approaches link life to crystal plasticity and micro-deformation mechanisms by formulating fatigue indicator parameters on favorably oriented slip planes, thereby improving interpretability of orientation anisotropy and life scatter for single-crystal and directionally solidified superalloys [35]. Further coupling of damage evolution with crystal viscoplasticity, including slip-system-level damage accumulation and applications to notched specimens, has also been explored, for example in the framework proposed by Levkovitch et al. [36]. Comparative studies, such as that by Arakere et al., have shown that classical macroscopic parameters including Brown–Miller, Fatemi–Socie, and SWT can exhibit markedly different predictive capabilities for single-crystal superalloys, with accuracy varying strongly with loading conditions [37–39].
Although existing critical-plane and energy-based approaches can improve the physical interpretation of fatigue damage, they often still require recalibration or grouped fitting when stress ratio and notch severity vary simultaneously. This makes it difficult to describe multi-
2 Experimental Methods and Data Sources
2.1 Materials and Fatigue Tests
The material used in the strain-controlled LCF tests was the second-generation nickel-based single-crystal superalloy DD6. Its nominal chemical composition was Ni–6.4Cr–9.1Co–0.6Mo–6.4W–1.0Ti–6.5Ta–3.0Re–0.1Hf–5.6Al, in wt.%, with Ni as the balance. The material was subjected to a standard heat-treatment procedure consisting of solution treatment at 1320°C for 3 h followed by air cooling, aging at 1140°C for 4 h followed by air cooling, and final aging at 870°C for 16 h followed by air cooling. The specimen loading axes were nominally parallel to the [001] crystallographic direction, and the orientation deviations were within
Smooth cylindrical specimens with a gauge length of 15 mm and a gauge diameter of 5 mm were used. The LCF tests were conducted using an Instron hydraulic servo fatigue testing system under total-strain control. An extensometer attached to the gauge section was used to measure and control the axial strain. The specimens were heated using a resistance furnace, and the temperature was monitored using thermocouples. The temperature fluctuation during testing was maintained within
A fully reversed triangular waveform was applied under total-strain control with a strain ratio of
Two valid tests were obtained for each temperature–strain-amplitude condition. Each data point in Fig. 1a represents the mean fatigue life of the two valid specimens and is used only to illustrate the overall temperature-dependent fatigue-life trends. The scatter between the two replicate tests was characterized using the maximum-to-minimum fatigue-life ratio and is discussed in Section 3.1.
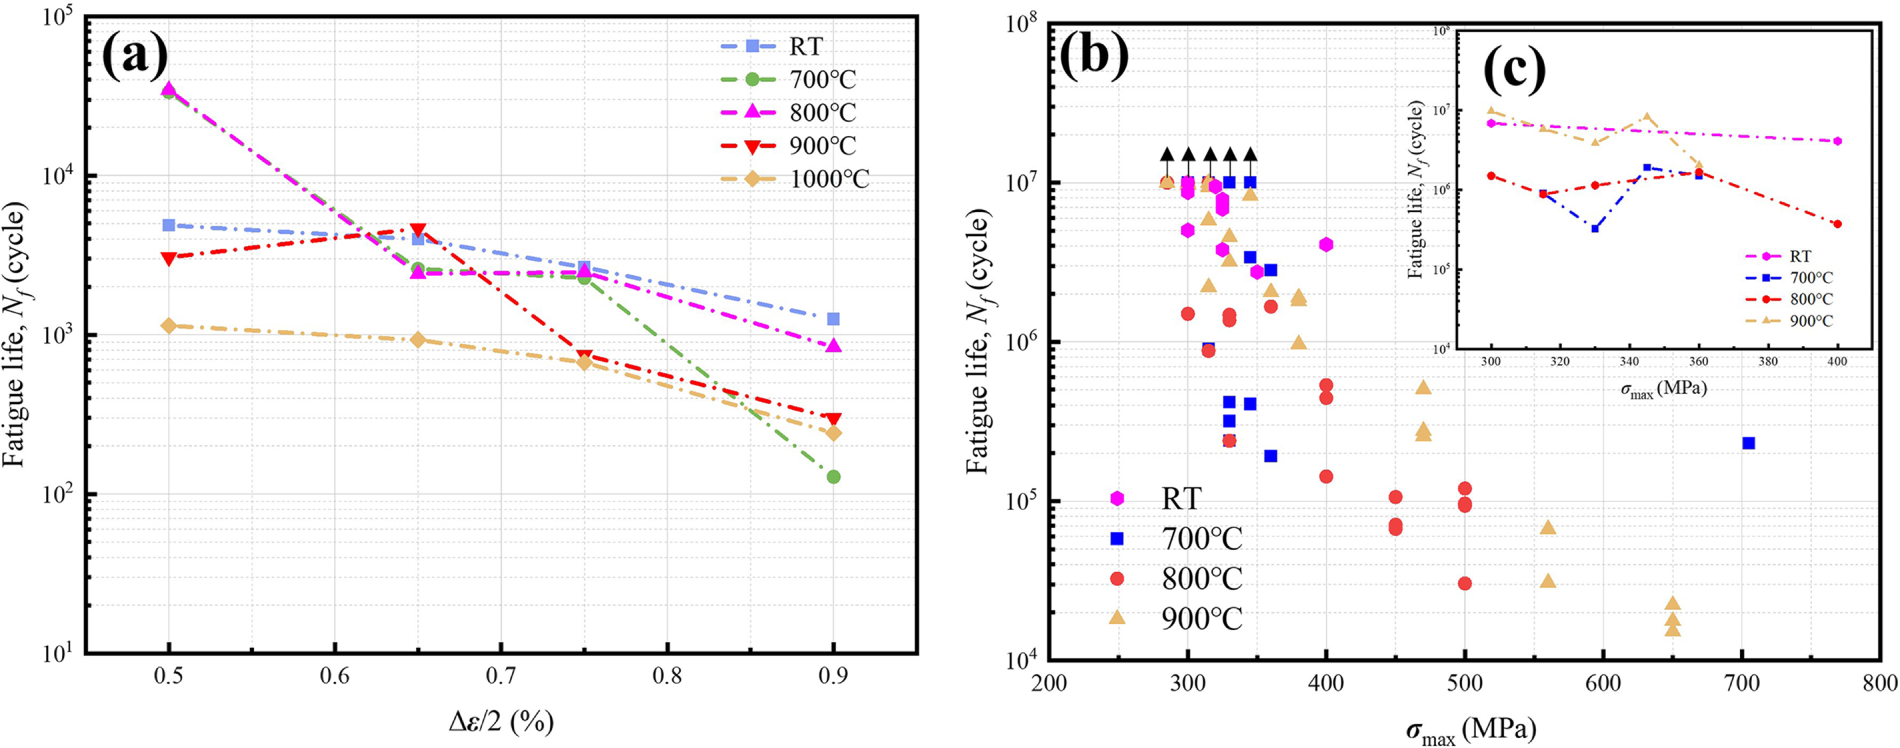
Figure 1: Fatigue life at different temperatures: (a) LCF, (b) HCF, (c) Nf at the same σmax.
Stress-controlled HCF tests were also conducted using smooth cylindrical DD6 single-crystal superalloy specimens. The material and heat-treatment condition were the same as those described above for the LCF tests. The loading axes were nominally parallel to the [001] crystallographic direction. The specimens had a nominal gauge diameter of approximately 4.5 mm, with the measured minimum diameters ranging from approximately 4.32 to 4.54 mm. The tests were performed at room temperature, 700°C, 800°C, and 900°C under fully reversed loading with a stress ratio of
Fatigue life was defined as the number of cycles to fracture within the gauge section. Tests that did not fracture after
2.2 Literature Fatigue Datasets
The strain-controlled LCF and stress-controlled HCF datasets described in Section 2.1 were generated in the present study. These experimental datasets were used to examine the effects of temperature, strain or stress level, and loading mode on fatigue-life trends. They were not used for parameter calibration or quantitative evaluation of the proposed stress-ratio and notch-correction framework.
The datasets selected for model development and evaluation cover DD6, DZ125, IC10, and SRR99 single-crystal superalloys with nominal [001] orientations. Table 1 summarizes the conditions directly relevant to the present model, including alloy, temperature, stress ratio
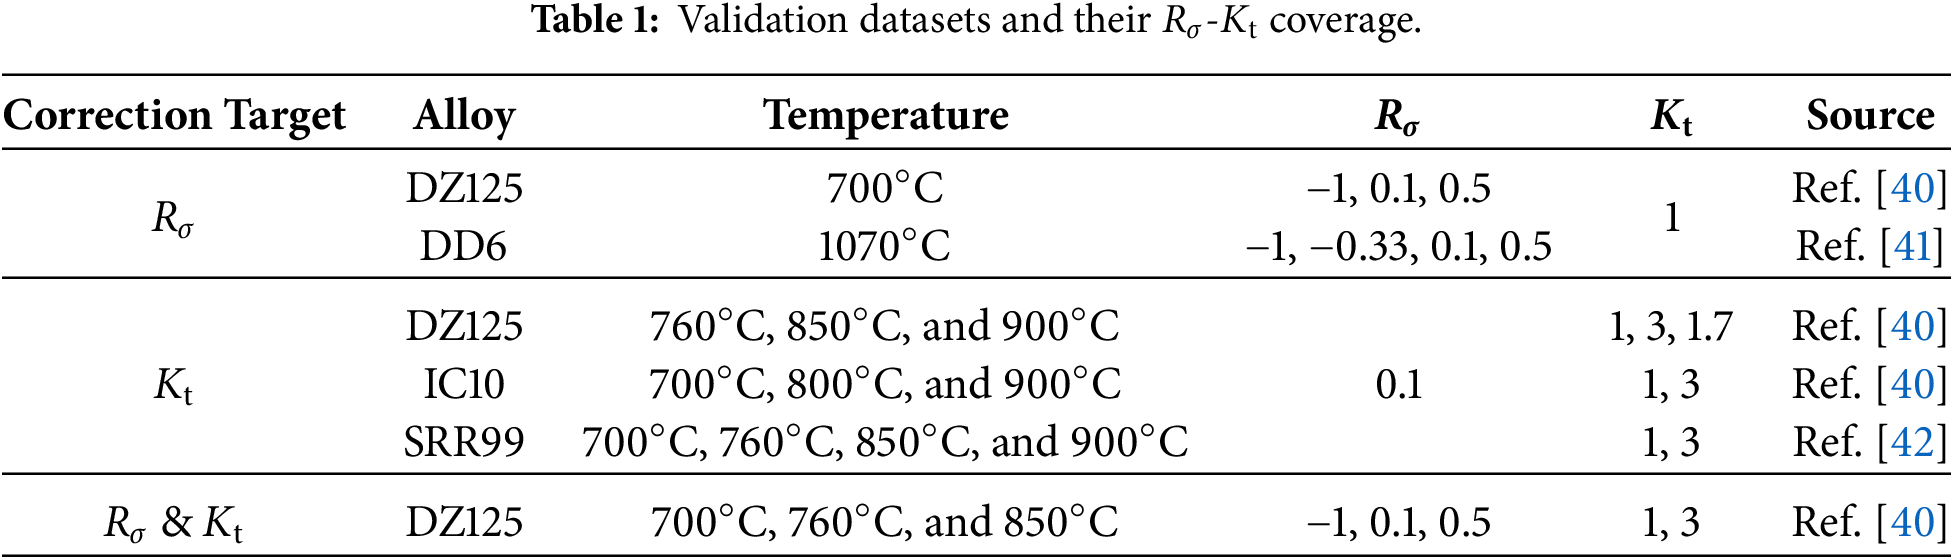
Data from different alloy–temperature combinations were treated separately during parameter identification. Runout data, where available, were excluded from ordinary failure-data calibration.
3 Observed Effects and Motivation for the Proposed Framework
3.1 Effects of Temperature on Nickel-Based Superalloys
Fig. 1a shows the dependence of LCF life on the total strain amplitude at different temperatures. Each data point represents the mean fatigue life obtained from two valid specimens tested under the same condition. Some scatter was observed between the replicate specimens. Except for the condition at 800°C and a total strain amplitude of 0.65%, the maximum-to-minimum fatigue-life ratios ranged from 1.06 to 1.69. A larger ratio of 3.40 was observed under this specific condition. Despite this scatter, the overall effects of temperature and strain amplitude remained consistent. At all temperatures, fatigue life generally decreased with increasing total strain amplitude. However, pronounced intersections occurred among the temperature-dependent curves within the investigated strain-amplitude range, indicating that the relative life ranking varied with the strain level. At lower strain amplitudes, the fatigue life at some intermediate temperatures exceeded that at room temperature, whereas the relative ordering among temperatures changed at higher strain amplitudes. These results demonstrate that, under strain-controlled loading, the temperature dependence of LCF life cannot be described by a fixed monotonic relationship.
Fig. 1b presents the relationship between HCF life and the maximum stress at different temperatures. The fatigue-life data at different temperatures overlap over certain stress intervals and exhibit mutual surpassing, without a consistent monotonic trend. It should be noted that Fig. 1b shows the full HCF datasets, whereas Fig. 1c extracts the fatigue lives at identical maximum-stress levels from the overlapping stress range for a more direct comparison of temperature effects. The comparison indicates that, even at the same
In summary, the influence of temperature on both LCF and HCF life is strongly load-level dependent, as evidenced by curve intersections and changes in life ranking. Such behavior cannot be adequately captured by a single linear or monotonic relationship, underscoring the nonlinear and non-monotonic effects of temperature on fatigue life.
The nonlinear temperature dependence observed in fatigue life is also reflected in the tensile strength parameters. Fig. 2a,b shows the variations of the ultimate tensile strength
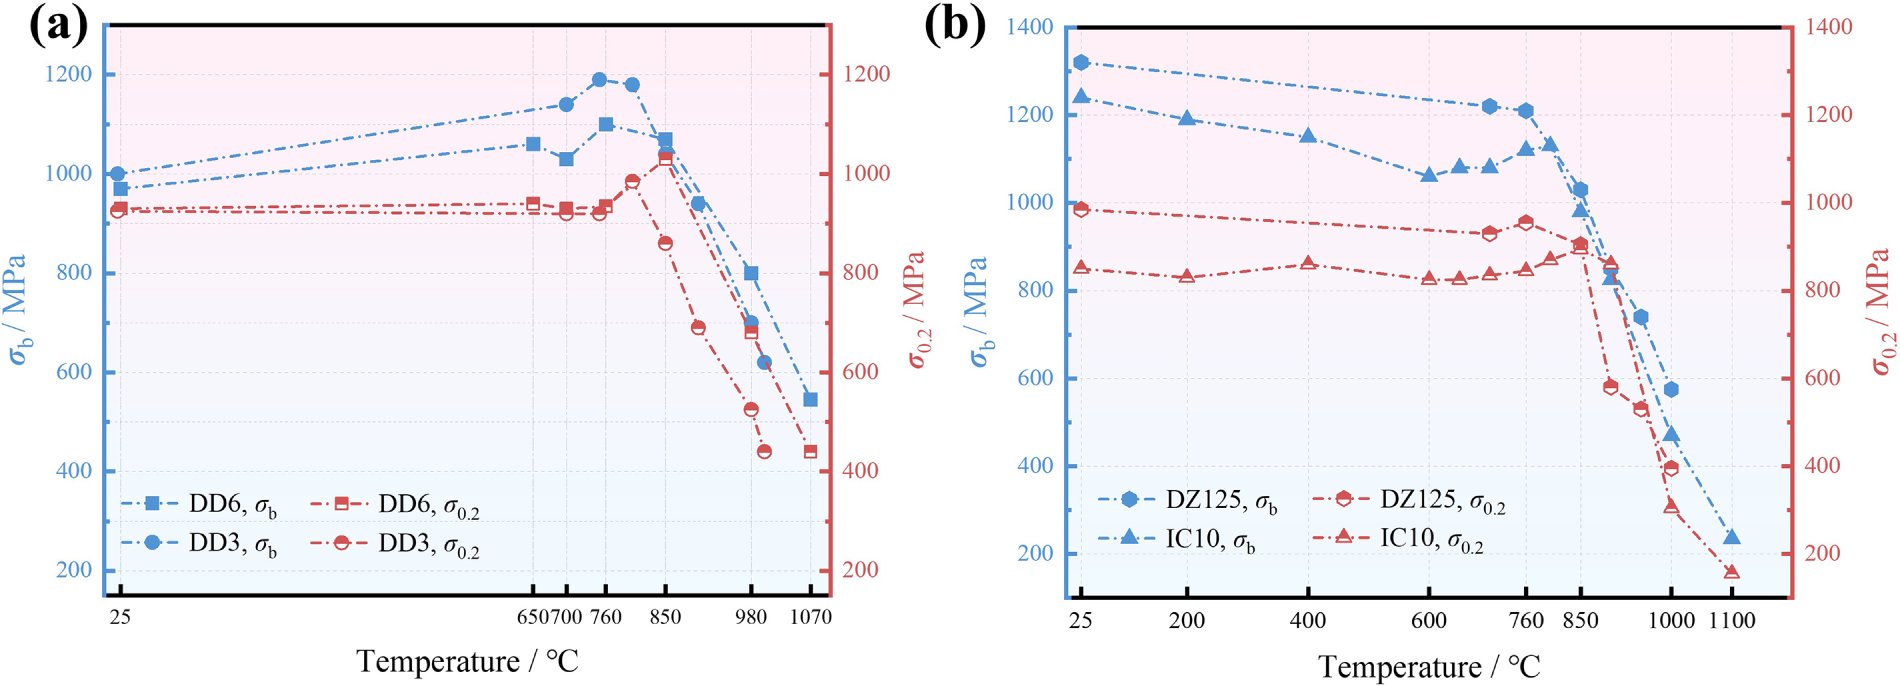
Figure 2:
At higher temperatures, both
3.2 Effect of Loading Frequency on the Fatigue Behavior of Nickel-Based Superalloys
Fig. 3a–d compares the stress–life distributions of the second-generation single-crystal superalloys PWA1484 and CMSX-4 under different stress ratios, loading frequencies, and stress levels, with the data taken from the literature [43,44]. Fig. 3a,c expresses life in terms of cycles to failure,
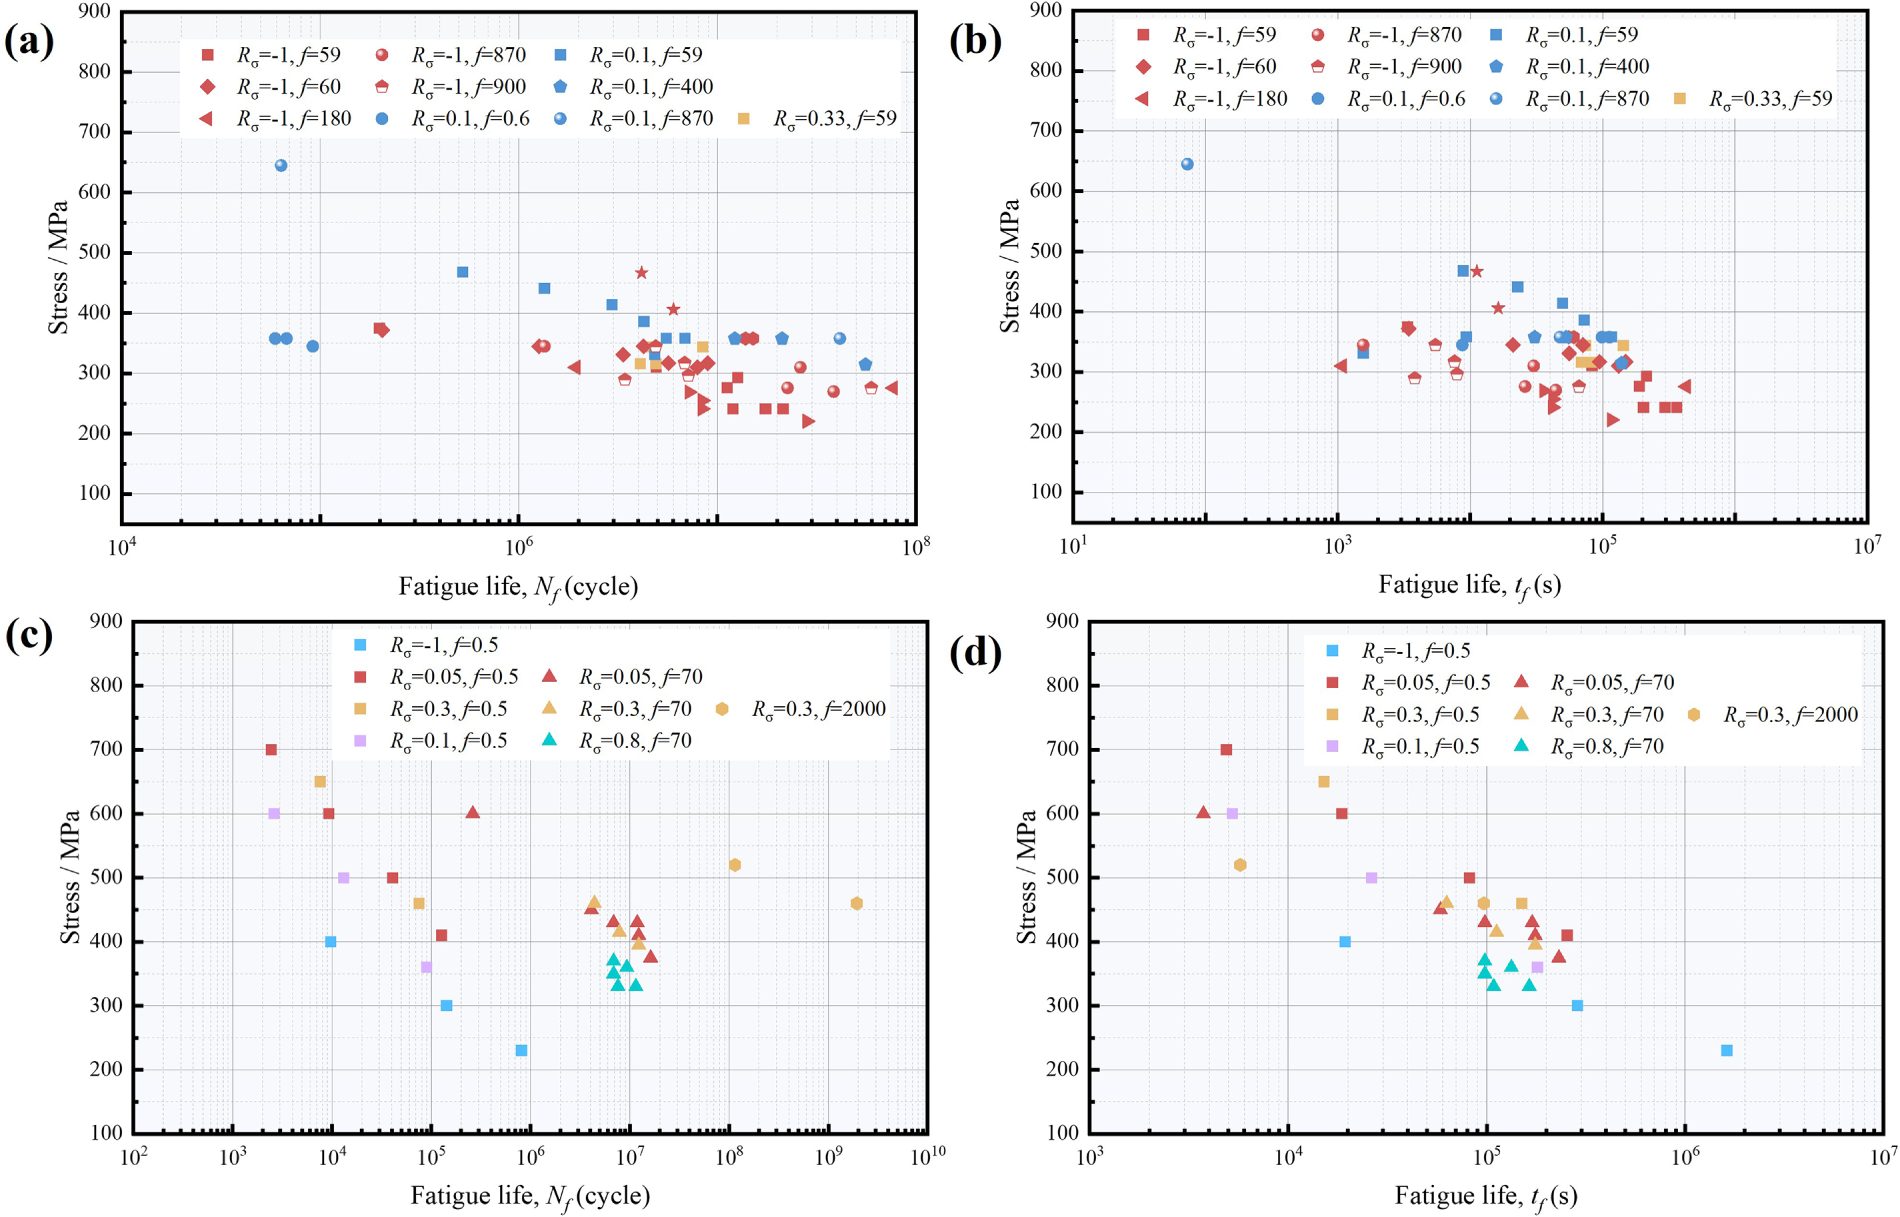
Figure 3: Stress–life data of PWA1484 and CMSX-4 at different Rσ and f: (a,c) Nf (cycles); (b,d) tf (s).
When life is represented by Nf, the datasets at different frequencies exhibit a more pronounced separation. In particular, CMSX-4 shows an overall shift of data points toward higher Nf with increasing frequency, while PWA1484 also displays noticeable frequency-dependent differences. In contrast, after converting life to the time domain, the separation between different-frequency datasets is substantially reduced and the distributions become more overlapped. Overall, frequency grouping is more evident on the cycle-based scale, whereas it largely converges on the time-based scale, indicating that the apparent frequency effect depends on whether life is characterized by Nf or by tf.
It should be emphasized that the conversion from cycles to failure to time to failure using
3.3 Effect of
Fig. 4 illustrates the stress-ratio effect under iso-life conditions reported in the literature [40]. Fig. 4a,b presents the iso-life stress–stress-ratio relationships obtained from different literature datasets and temperature ranges. In both subfigures, the curves correspond to fixed fatigue-life levels of
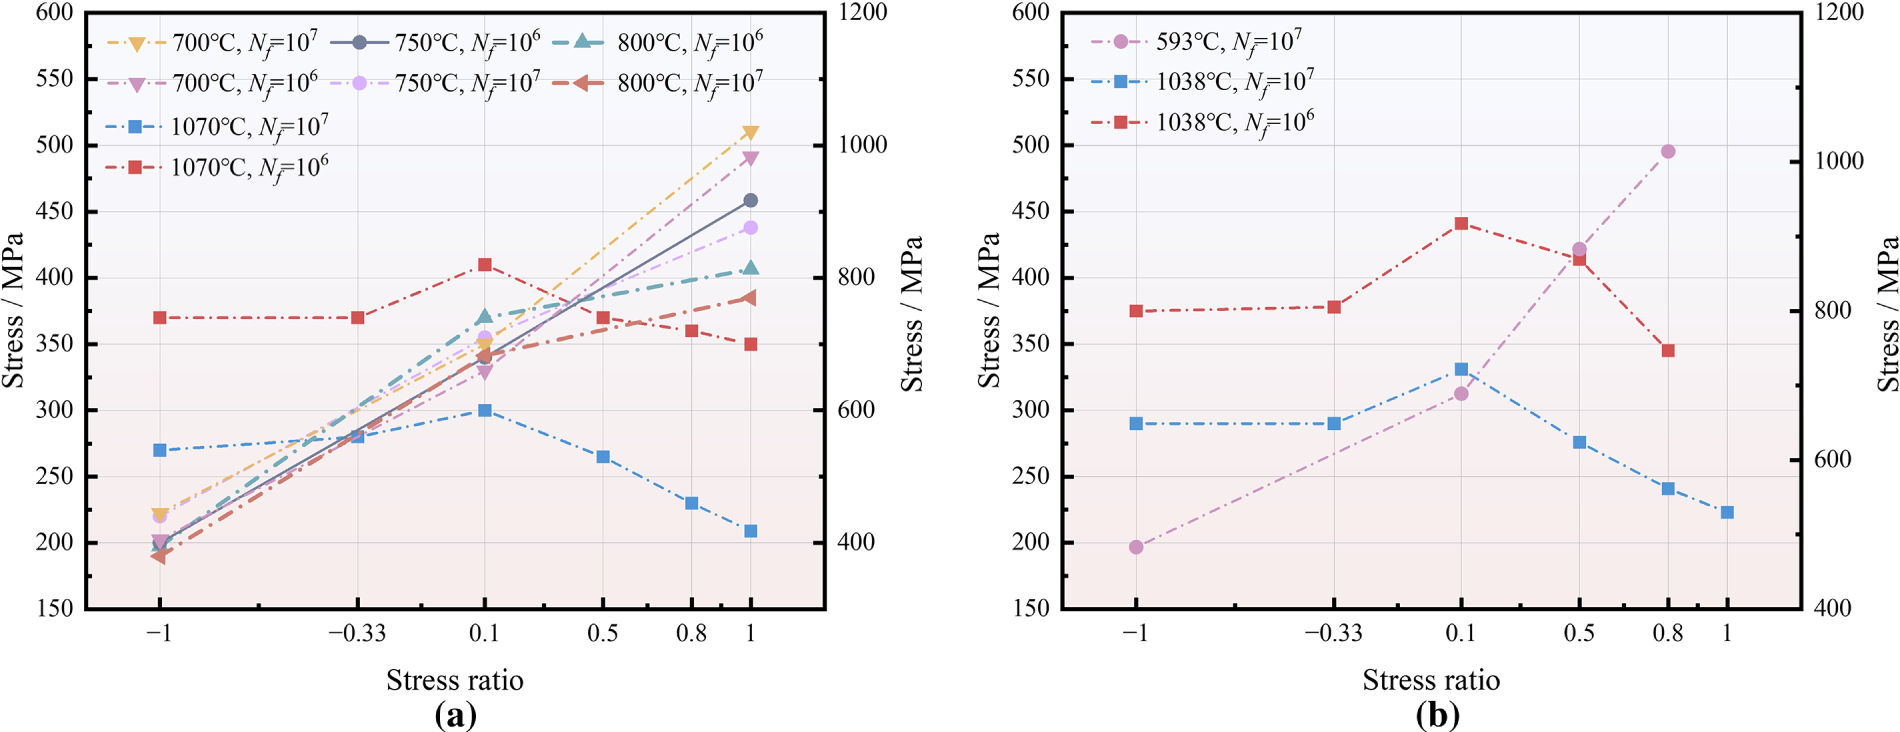
Figure 4: Literature iso-life stress as a function of stress ratio Rσ at different temperatures for Nf = 106 and 107 cycles: (a) dataset covering 700°C–1070°C; (b) dataset covering 593°C and 1038°C. Data replotted from Ref. [40].
Overall, the iso-life stress increases with increasing stress ratio under most temperature conditions, whereas the curve shapes are not uniformly linear. In the low-to-moderate stress-ratio range, some curves exhibit a more pronounced increase; as the stress ratio further increases, the rise becomes less significant and tends to level off. Meanwhile, for certain high-temperature curves, a drop or an inflection point appears at high stress ratios, indicating a local non-monotonic behavior. In addition, both the slope and the stress-ratio range where the inflection occurs vary with temperature, suggesting that the iso-life stress response to stress ratio is temperature dependent.
3.4 Effect of Loading Kt on the Fatigue Behavior of Nickel-Based Superalloys
Fig. 5 shows the variation of fatigue life Nf with stress ratio Rσ under a complex stress state for different stress concentration factors Kt [24]. Distinct Nf-Rσ trends are observed for different Kt values, and curve intersections occur over certain Rσ ranges, indicating that the stress-ratio effect is modulated by the degree of stress concentration.
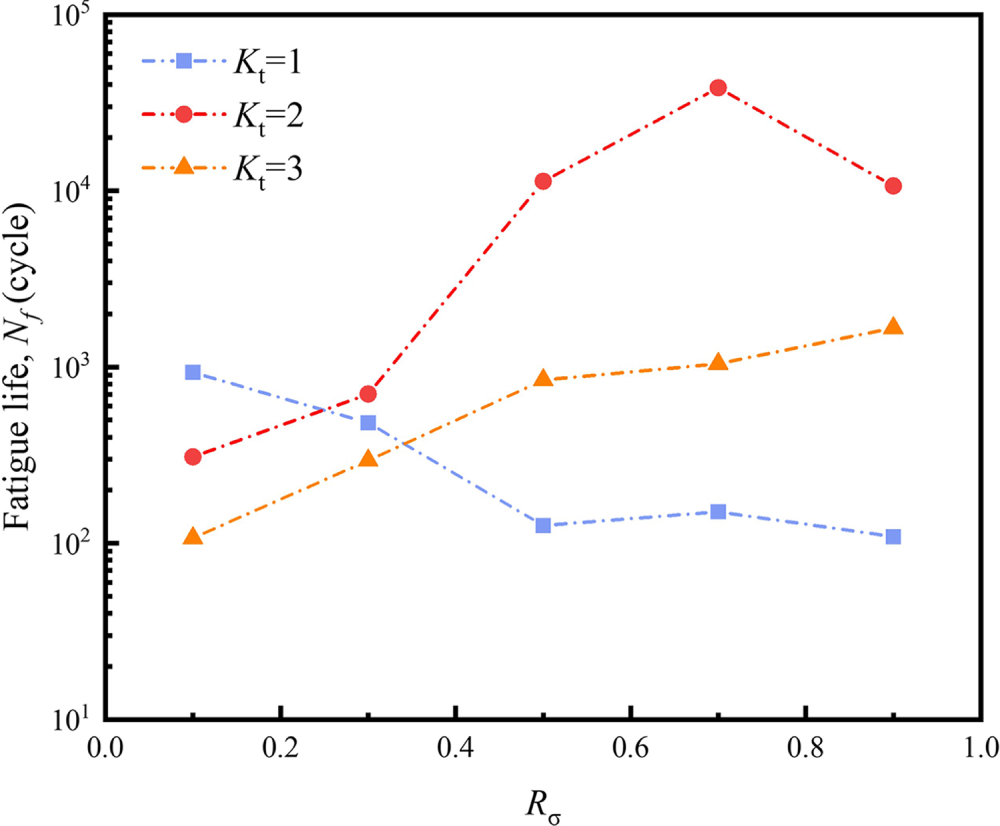
Figure 5: Fatigue life vs. stress ratio for Kt = 1, 2, and 3. Data replotted from Ref. [24].
For Kt = 1, the fatigue life generally decreases with increasing Rσ and remains at a low level in the intermediate-to-high Rσ range. For Kt = 2, Nf exhibits a non-monotonic trend, increasing first and then decreasing, with relatively higher life in the moderate-to-high Rσ range. For Kt = 3, the fatigue life overall increases with increasing Rσ and continues to rise toward the high-Rσ end. Overall, the life differences among Kt values are pronounced at the same Rσ, and the Rσ-dependence of Nf is not consistent across Kt, featuring curve crossings and non-monotonic behavior, which further reflects the nonlinear nature of the stress-ratio effect.
Section 3 shows that the effects of temperature, stress ratio, and notch severity on fatigue life are strongly nonlinear, featuring data crossings and reversals in life ranking. This indicates that temperature not only changes the nominal mechanical level but also alters the life sensitivity to Rσ and Kt. As a result, a single set of global constant parameters over the full temperature range would typically fit well at some temperatures but produce systematic bias at others.
The proposed framework links three engineering characterization levels: the nominal loading level, the notch-root equivalent response level, and the crystallographic-orientation-weighted equivalent shear level. The nominal loading level describes the overall cyclic loading amplitude, stress ratio, and mean stress state. The notch-root equivalent response level estimates the local elastoplastic response associated with stress concentration by using Neuber localization. The crystallographic-orientation-weighted level introduces the Schmid factor to convert the notch-root equivalent stress response into an equivalent shear-type driving parameter. Through this mapping, the effects of loading condition, notch severity, and crystallographic orientation are incorporated into a unified engineering equivalent driving force.
Based on the above considerations, baseline life model parameters are calibrated independently at each temperature. A stepwise variable separation scheme is then applied at the same temperature to correct the mean-stress effect and the notch effect separately, and to decouple and identify the influences of Rσ and Kt, enabling unified life prediction for multiple Rσ and multiple Kt conditions at a given temperature.
4.1 Unified Fatigue Life Prediction Framework
For stress-controlled fatigue tests, the nominal minimum stress can be obtained from the nominal maximum stress and the stress ratio Rσ as
For strain-controlled fatigue tests, the nominal minimum strain can be obtained from the nominal maximum strain and the strain ratio Rε as
The nominal stress extrema are back-calculated using the cyclic Ramberg–Osgood relation [45],
where E is the elastic modulus at the test temperature,
The two loading modes are finally unified in terms of the nominal stress range
For specimens with stress concentration, the local stress–strain state at the notch root governs fatigue crack initiation. In this study, the Neuber energy equivalence principle is adopted to relate the nominal elastic stress field to the elastoplastic response at the notch root.
The maximum elastic stress,
If
where
Substituting Eq. (8) into Eq. (7), and defining
here,
where the derivative
The iteration is initialized with
The material parameters used in the Ramberg–Osgood relation and Neuber localization, including
After obtaining the local stress range
The local maximum and minimum stresses are calculated as
Equivalently, both nominal stress extrema are scaled by the same localization factor,
The cyclic Ramberg–Osgood relation in Eq. (8) represents a Masing-type range approximation. Separate loading and unloading branches, cyclic mean-stress relaxation, and the evolution of the local stress ratio are not explicitly considered. Therefore,
The stress quantity used for crystallographic weighting is expressed as an equivalent axial notch-root stress vector in Voigt notation,
This vector should be interpreted as an engineering equivalent stress representation, rather than a complete multiaxial notch-root stress tensor. For the axial fatigue loading considered in this work, the scalar Neuber correction is used to estimate the dominant axial notch-root stress component. The transverse normal stresses and shear stresses are not independently solved in this simplified framework; therefore, only the axial component is retained in the slip-system projection, while the remaining components are taken as zero. The notch-root multiaxial constraint is considered phenomenologically through the notch correction term.
With the predefined Schmid factor matrix
The resolved shear stresses on each slip system at the stress extrema are obtained as
here,
Based on the Schmid-factor-weighted equivalent shear parameters obtained from Eq. (17), the equivalent shear-type driving parameter is defined as
here,
4.2 Correction of the Equivalent Shear-Type Driving Parameter
In this study, the equivalent shear-type driving parameter
To extract the overall trend from scattered experimental data and to describe the systematic differences among different conditions, a Basquin-type power-law regression is applied to each data group,
where A and B are obtained by least-squares fitting in the logarithmic domain. The dashed lines in the figures represent the corresponding main trend.
The literature data of DZ125 [40] are selected here to demonstrate and validate the proposed correction procedure, because this dataset covers two key variations within the same material system, namely the fatigue lives of smooth specimens under different stress ratios and those of specimens with different notch factors. Consequently, both the stress-ratio effect and the notch effect can be examined within a unified
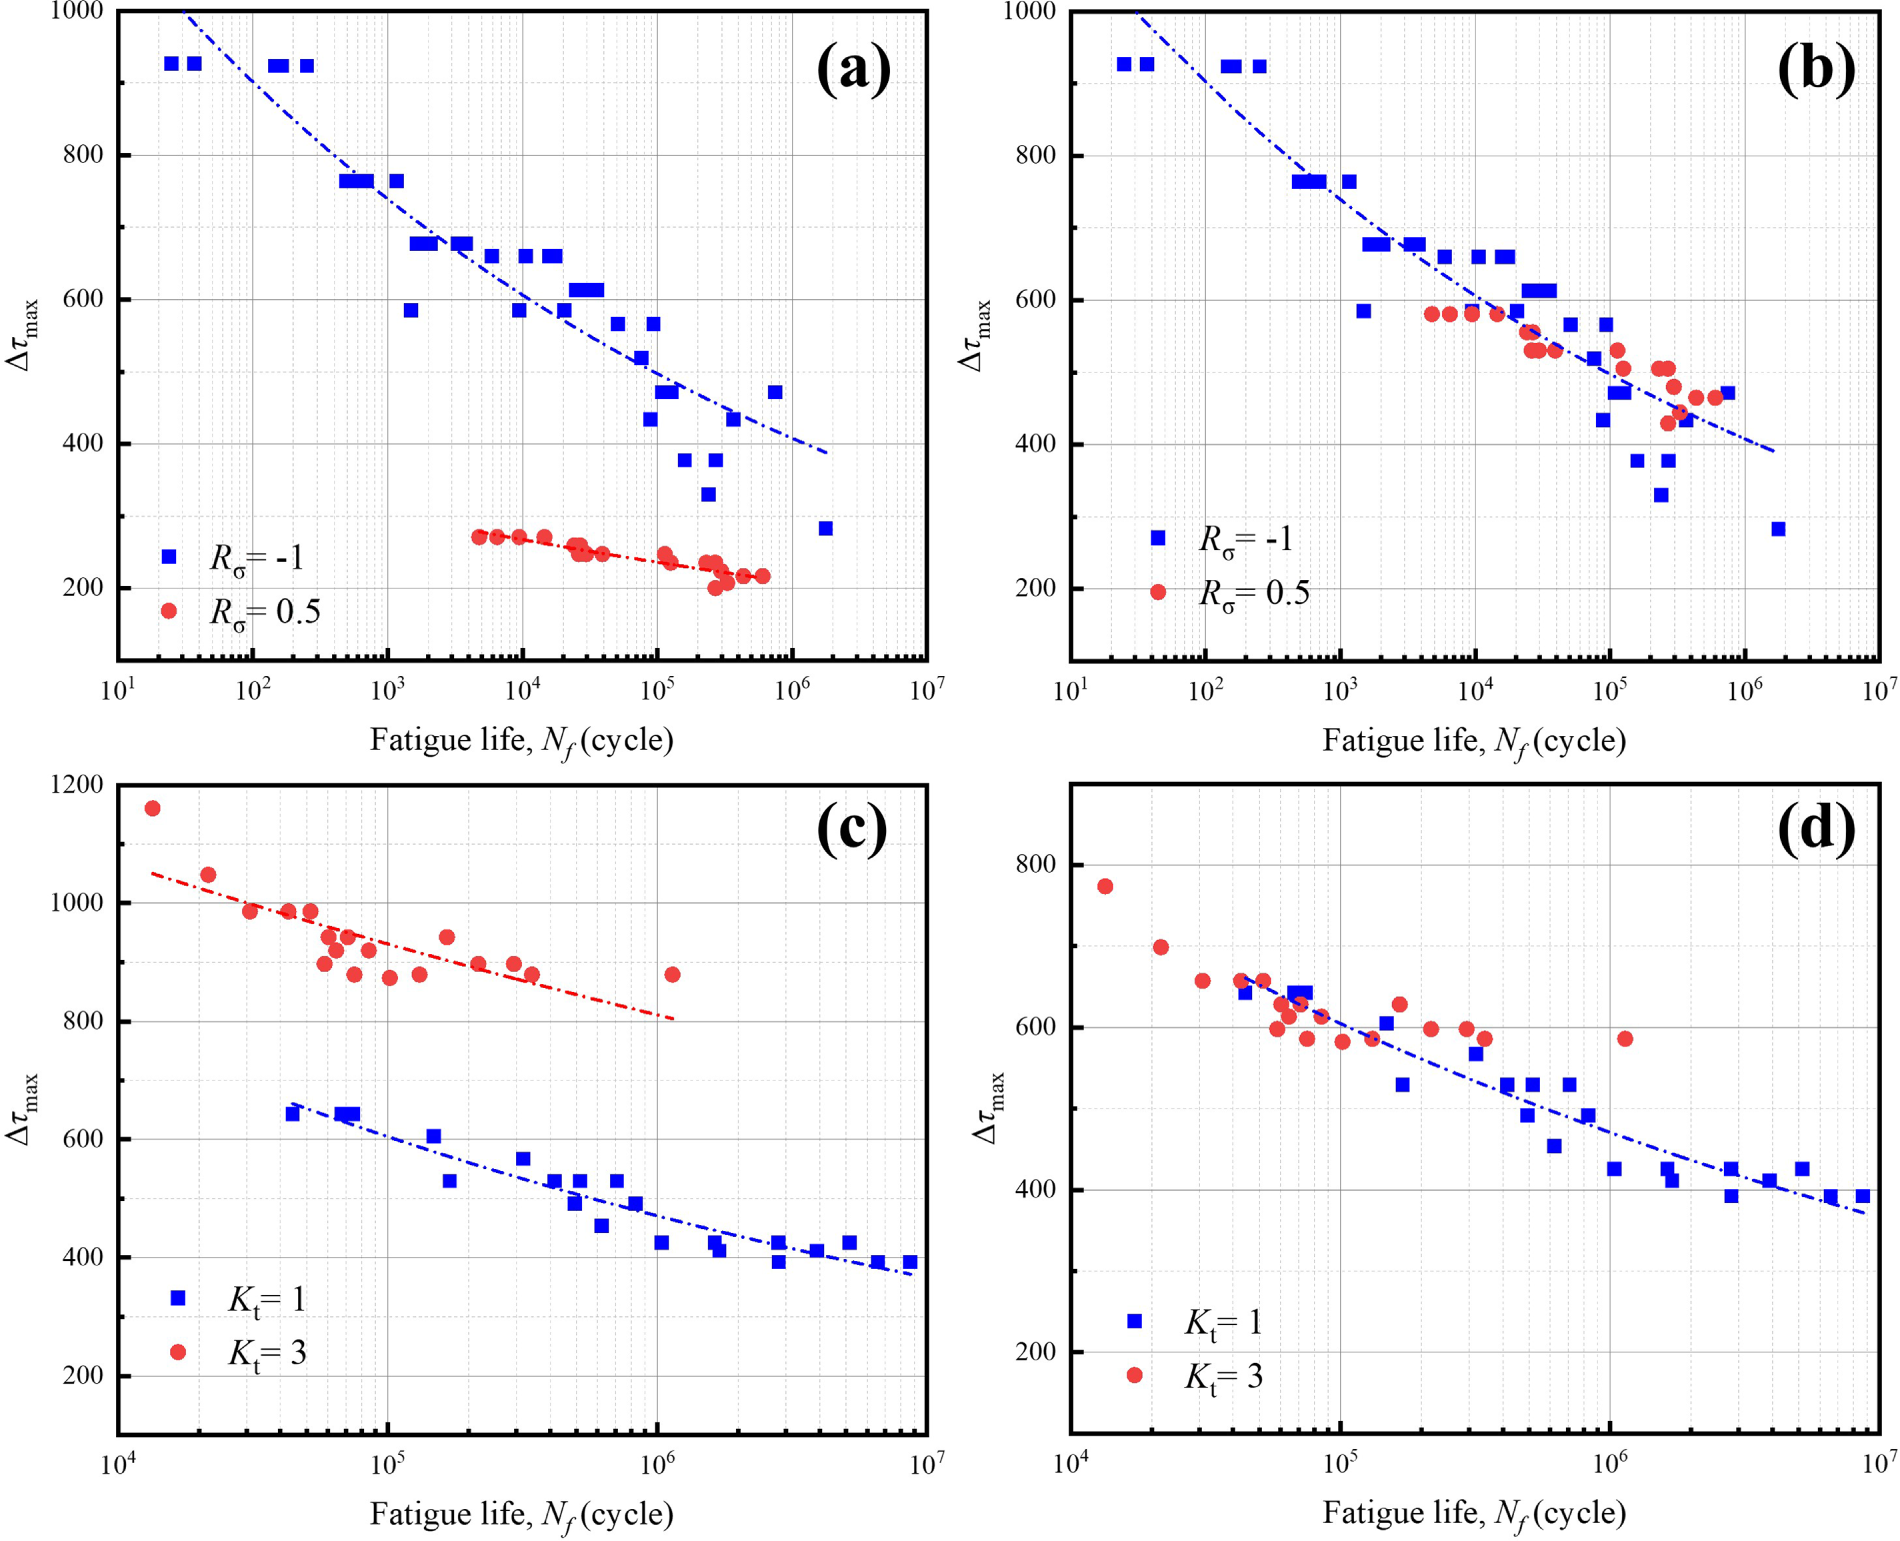
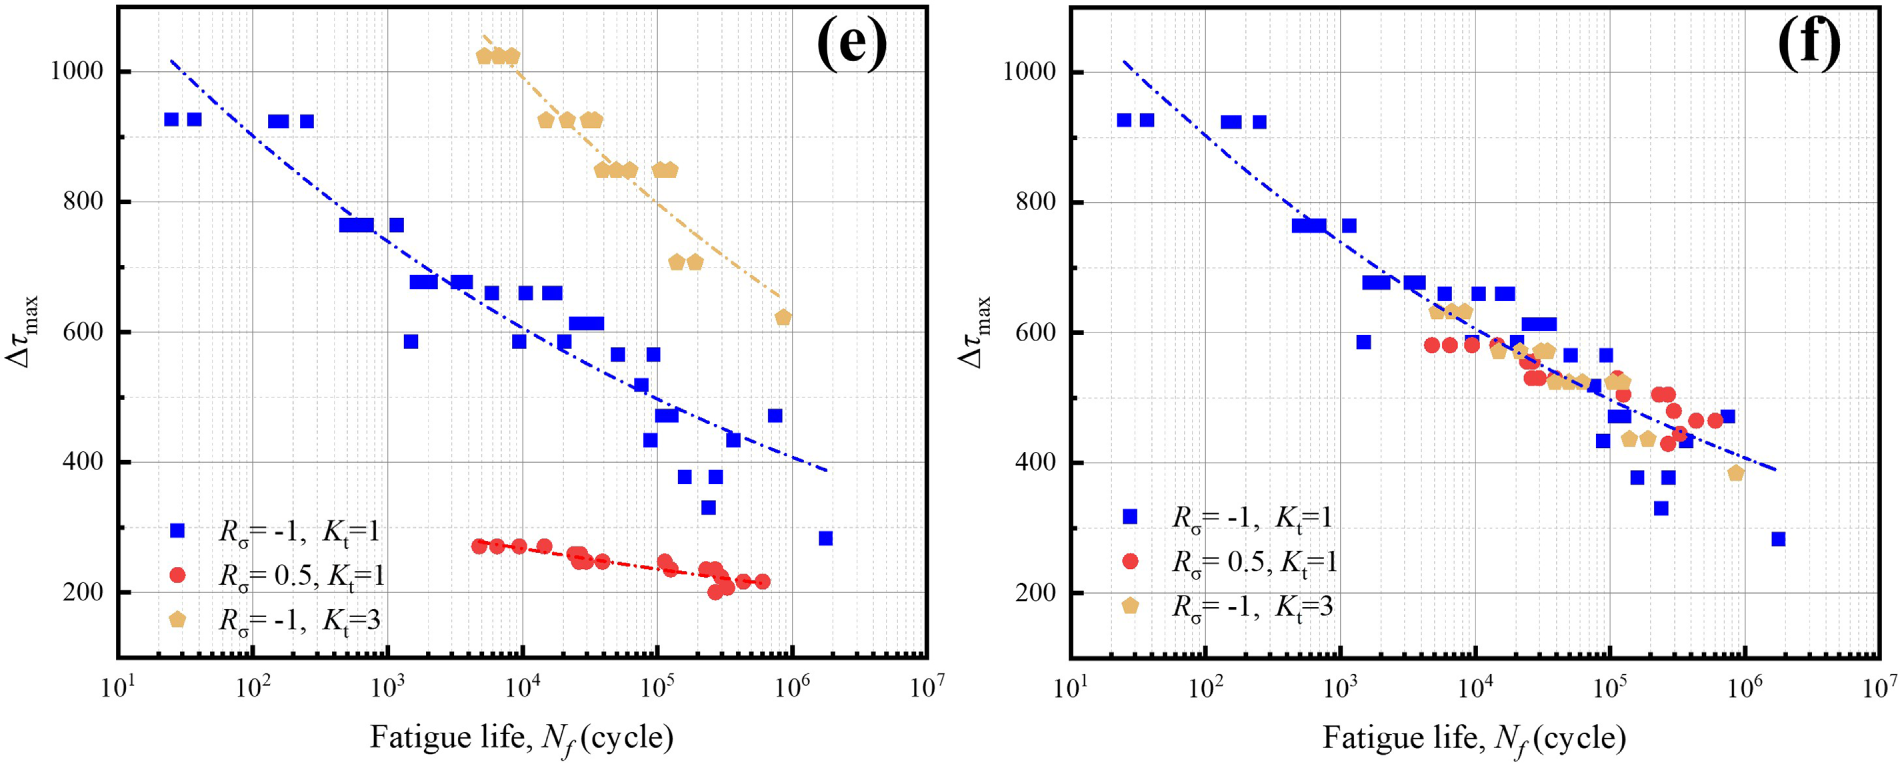
Figure 6:
Based on the above features, correction factors are introduced to perform an equivalent rescaling of the driving parameter without changing the shape of the reference master curve, so that datasets from different conditions become comparable in a unified reference frame. First, a reference master curve is obtained by fitting the baseline condition,
where
The correction is implemented in a stepwise manner. The stress-ratio effect is considered first. Fig. 6a shows the original
where,
The corrected results are shown in Fig. 6b. Compared with Fig. 6a, the stratification associated with different stress ratios is reduced, and the data exhibit an increased overlap around the reference trend band.
The notch effect is then considered. Fig. 6c shows the original
where
The correction factors
The corrected results are shown in Fig. 6d. Compared with Fig. 6c, the separation between different Kt datasets is reduced, and the data become closer to sharing a common trend band.
The three representative conditions in Fig. 6e are used to illustrate the calibration logic of the combined correction. The condition with
Based on this logic, the two correction factors are combined for a unified correction. Fig. 6e shows the multi-layer distribution and overall misalignment among the three representative conditions in the original coordinates. To simultaneously represent both systematic shifts within a unified framework, the combined corrected equivalent driving parameter is defined as
The parameters
With Rσ0 = −1, this expression becomes
The parameters
and the objective function is defined as
The optima
Fig. 6a,c,e demonstrates that, before correction, the datasets corresponding to different stress ratios and notch factors exhibit systematic stratification and condition-dependent offsets rather than random scatter around a single trend. Consequently, a single uncorrected
Established approaches, including Walker-type mean-stress corrections, SWT-based fatigue parameters, and Neuber-based local stress–strain estimation, provide alternative treatments of stress-ratio and notch effects. However, a consistent quantitative comparison requires additional information, such as stabilized cyclic stress–strain properties, local strain histories, detailed notch-root geometry, and stress-gradient data. These quantities were not consistently reported for the literature datasets used in the present study. Reconstructing them through additional assumptions would introduce uncontrolled uncertainty and could lead to an inequitable comparison. Therefore, the present study focuses on an internal comparison between the uncorrected baseline relation and the proposed correction framework. The results should not be interpreted as demonstrating the general superiority of the proposed method over established classical approaches.
5 Model Validation and Discussion
This section validates the proposed fatigue-life prediction framework under multiple operating variables. The focus is placed on evaluating the effectiveness of the stress-ratio correction and the notch-factor correction, and on assessing the consistency of the unified life prediction when the two corrections are combined. Ideally, the combined model should be calibrated and validated using a complete experimental matrix covering multiple stress ratios and multiple notch factors. However, due to limitations in test duration, cost, and specimen availability, the current dataset exhibits clear coverage gaps in the Rσ-Kt space, which precludes a large-scale, full-range validation.
Given these constraints, a stepwise validation strategy is adopted to maximize the use of available data while keeping the validation process interpretable and reproducible. First, single-variable validations are conducted. The stress-ratio correction is examined by varying Rσ while keeping Kt fixed, and the notch-factor correction is examined by varying Kt while keeping Rσ fixed. Within each alloy–temperature combination,
5.1 Validation of the Stress-Ratio Correction
Based on the stress-ratio correction model and the identified parameters, Fig. 7 compares the predicted life Npred with the experimental life Nexp for DZ125 and DD6 under different stress ratios Rσ. As shown in Fig. 7a,c, the data points from different Rσ levels distribute around the identity line Npred = Nexp, and no evident group-wise systematic shift is observed, indicating that the stress-ratio correction mitigates the systematic deviation induced by Rσ. Most points fall within the ±3× scatter band, and the overall scatter is largely bounded by the ±5× band.
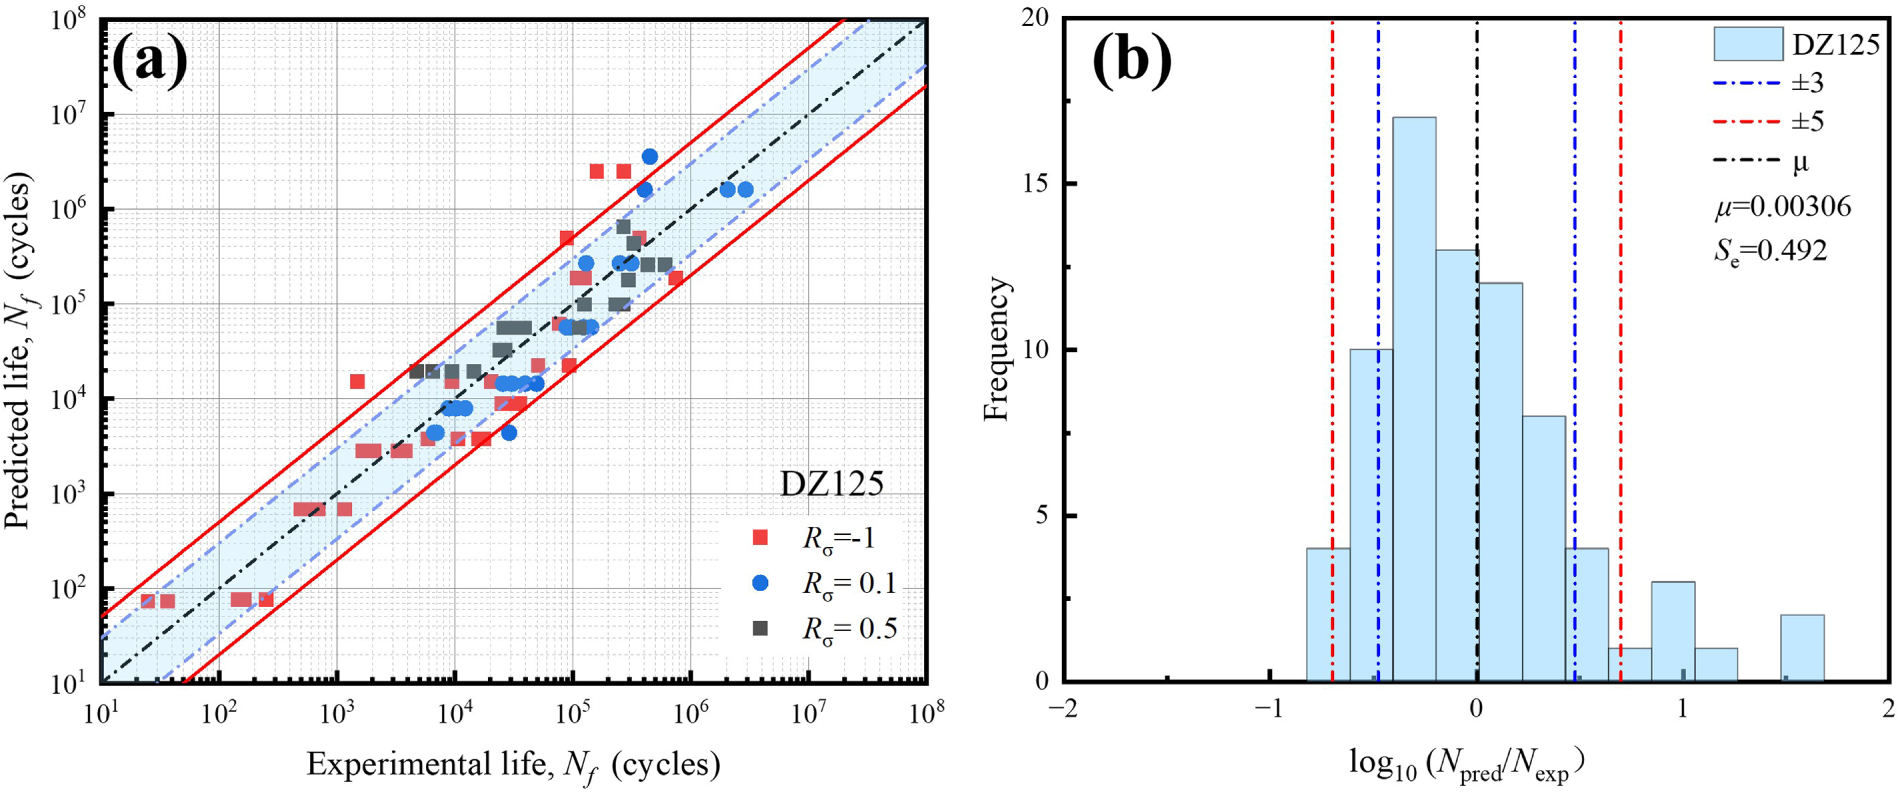
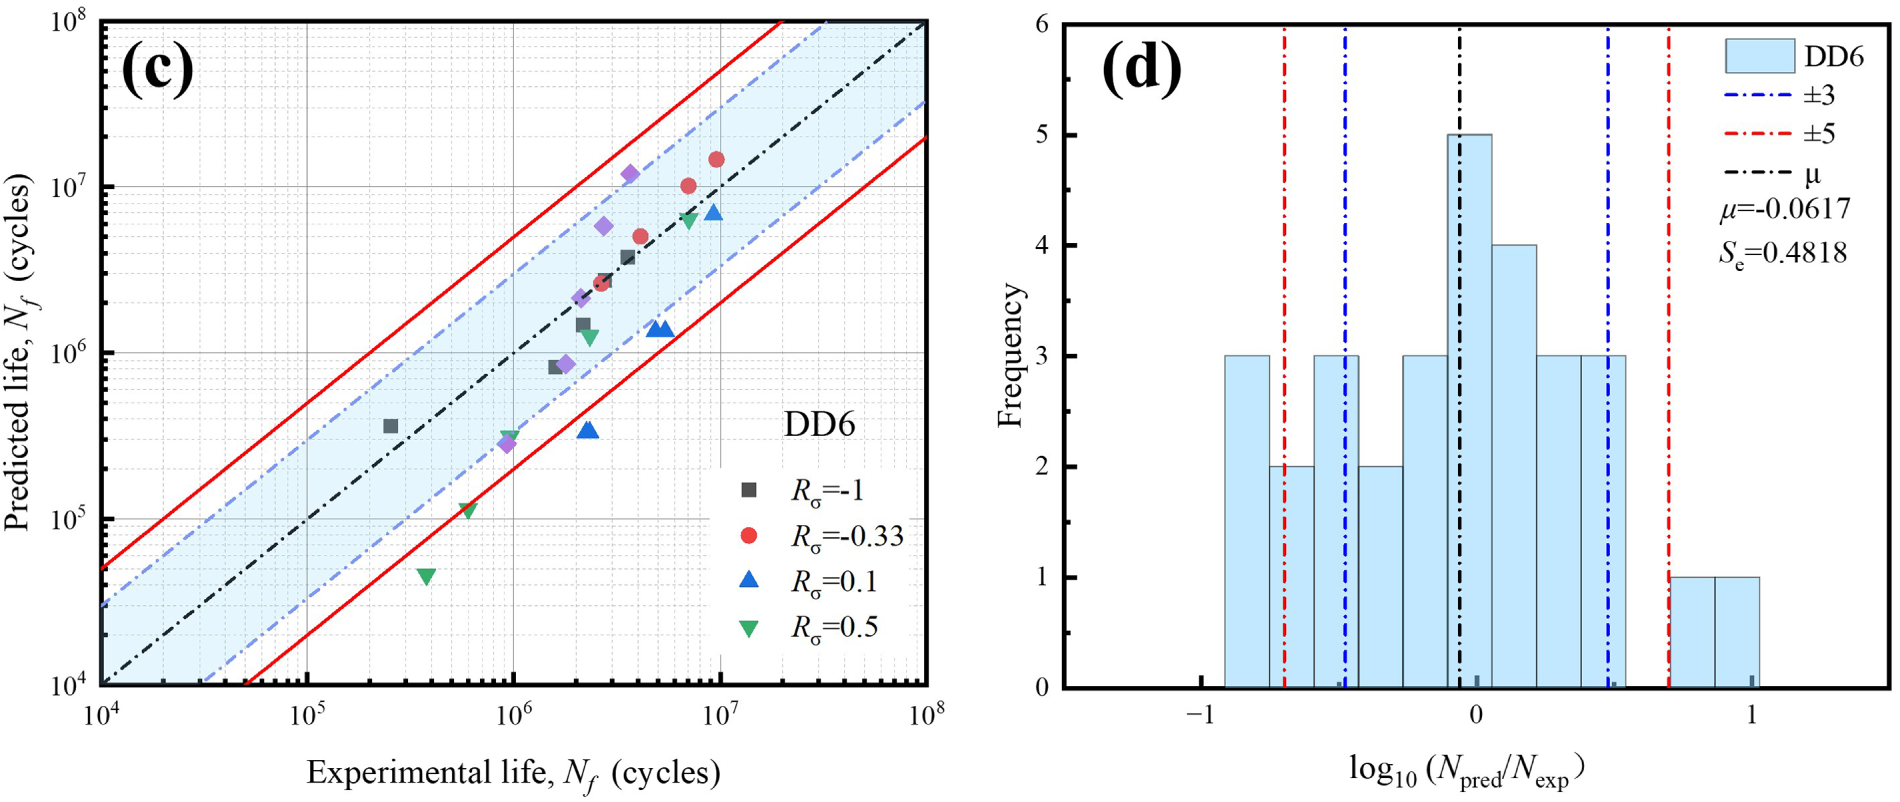
Figure 7: Stress-ratio correction validation. (a) DZ125 predicted and experimental lives; (b) DZ125 error histogram; (c) DD6 predicted and experimental lives; (d) DD6 error histogram.
To quantify the error distribution, the logarithmic error is defined as
here,
5.2 Validation of the Notch-Factor Correction
Based on the notch-factor correction model and the identified parameters, Fig. 8 presents the validation results for DZ125, IC10, and SRR99 under different temperatures and notch factors Kt. As shown in Fig. 8a,c,e, the data points generally cluster around the identity line, and no distinct group-wise shift is observed between different Kt levels, indicating that the notch-factor correction maps datasets with different notch severities onto a comparable scale. Most points lie within the ±3× band and the overall scatter remain largely within the ±5× band.
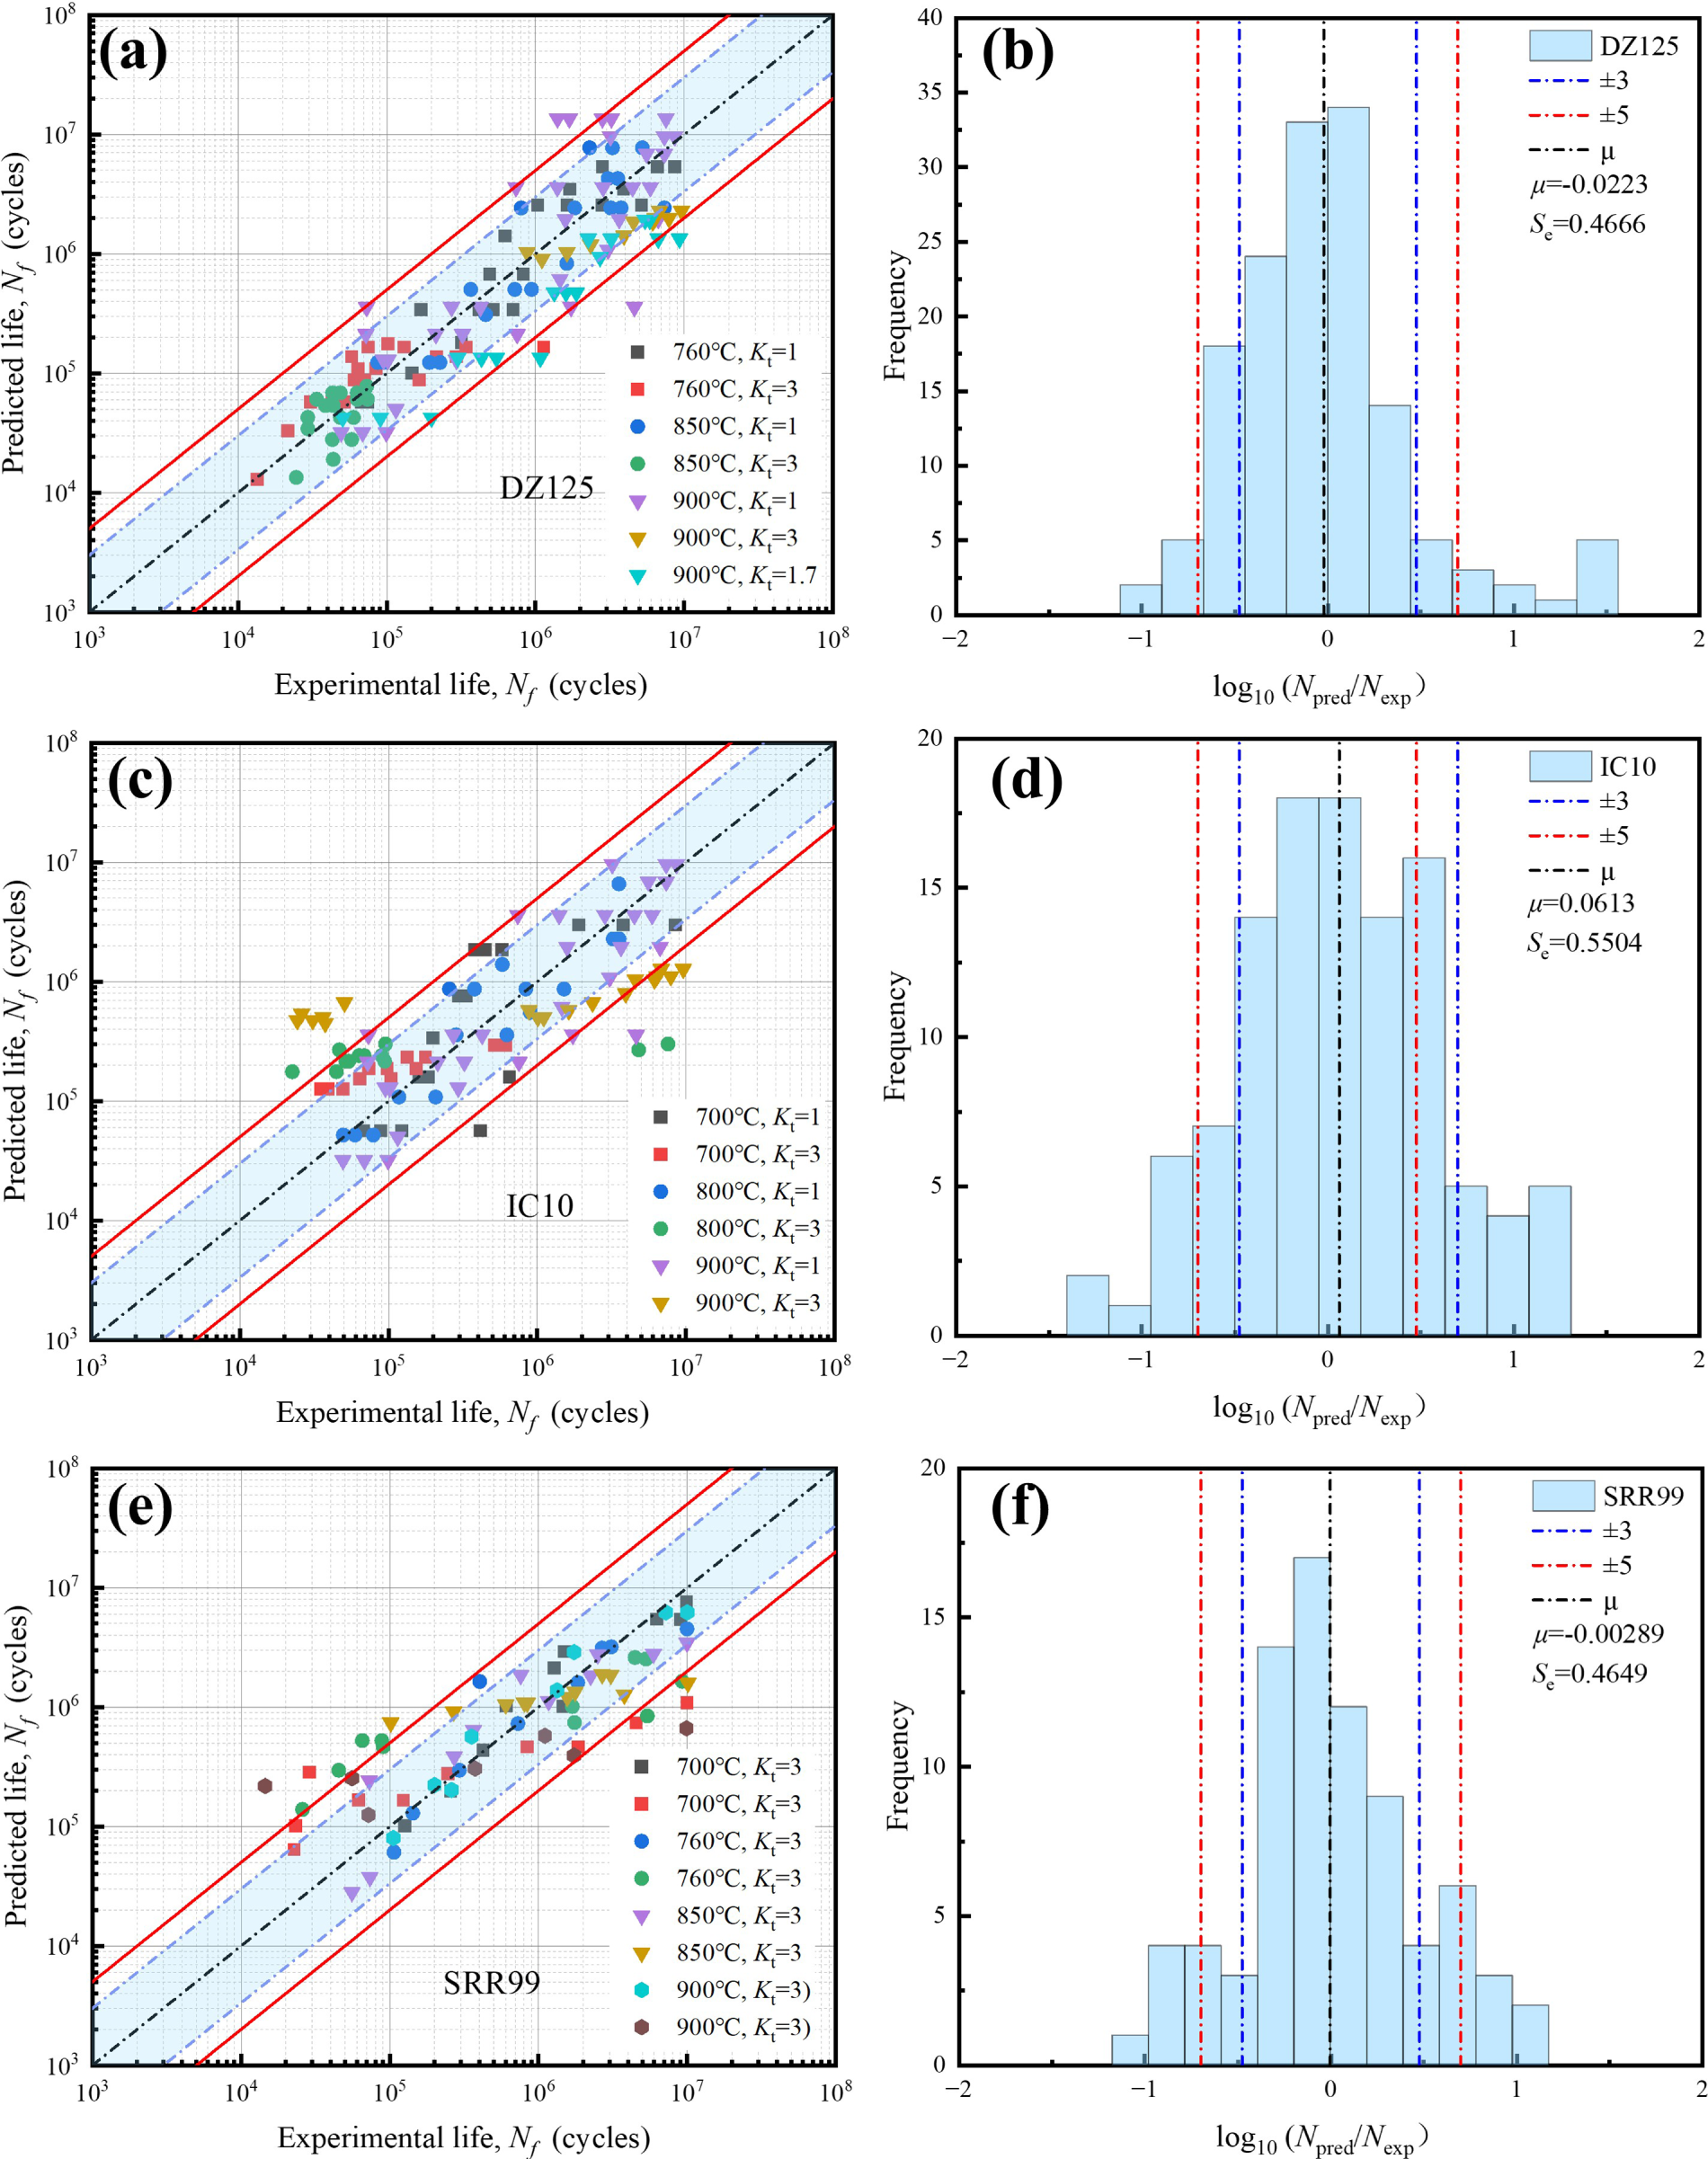
Figure 8: Notch-factor correction validation. (a) DZ125 predicted and experimental lives; (b) DZ125 error histogram; (c) IC10 predicted and experimental lives; (d) IC10 error histogram; (e) SRR99 predicted and experimental lives; (f) SRR99 error histogram.
The corresponding error histograms are shown in Fig. 8b,d,f. For DZ125, 146 predictions were evaluated, with
5.3 Validation of the Combined Correction
After establishing the stress-ratio and notch-factor correction forms, the correction exponents
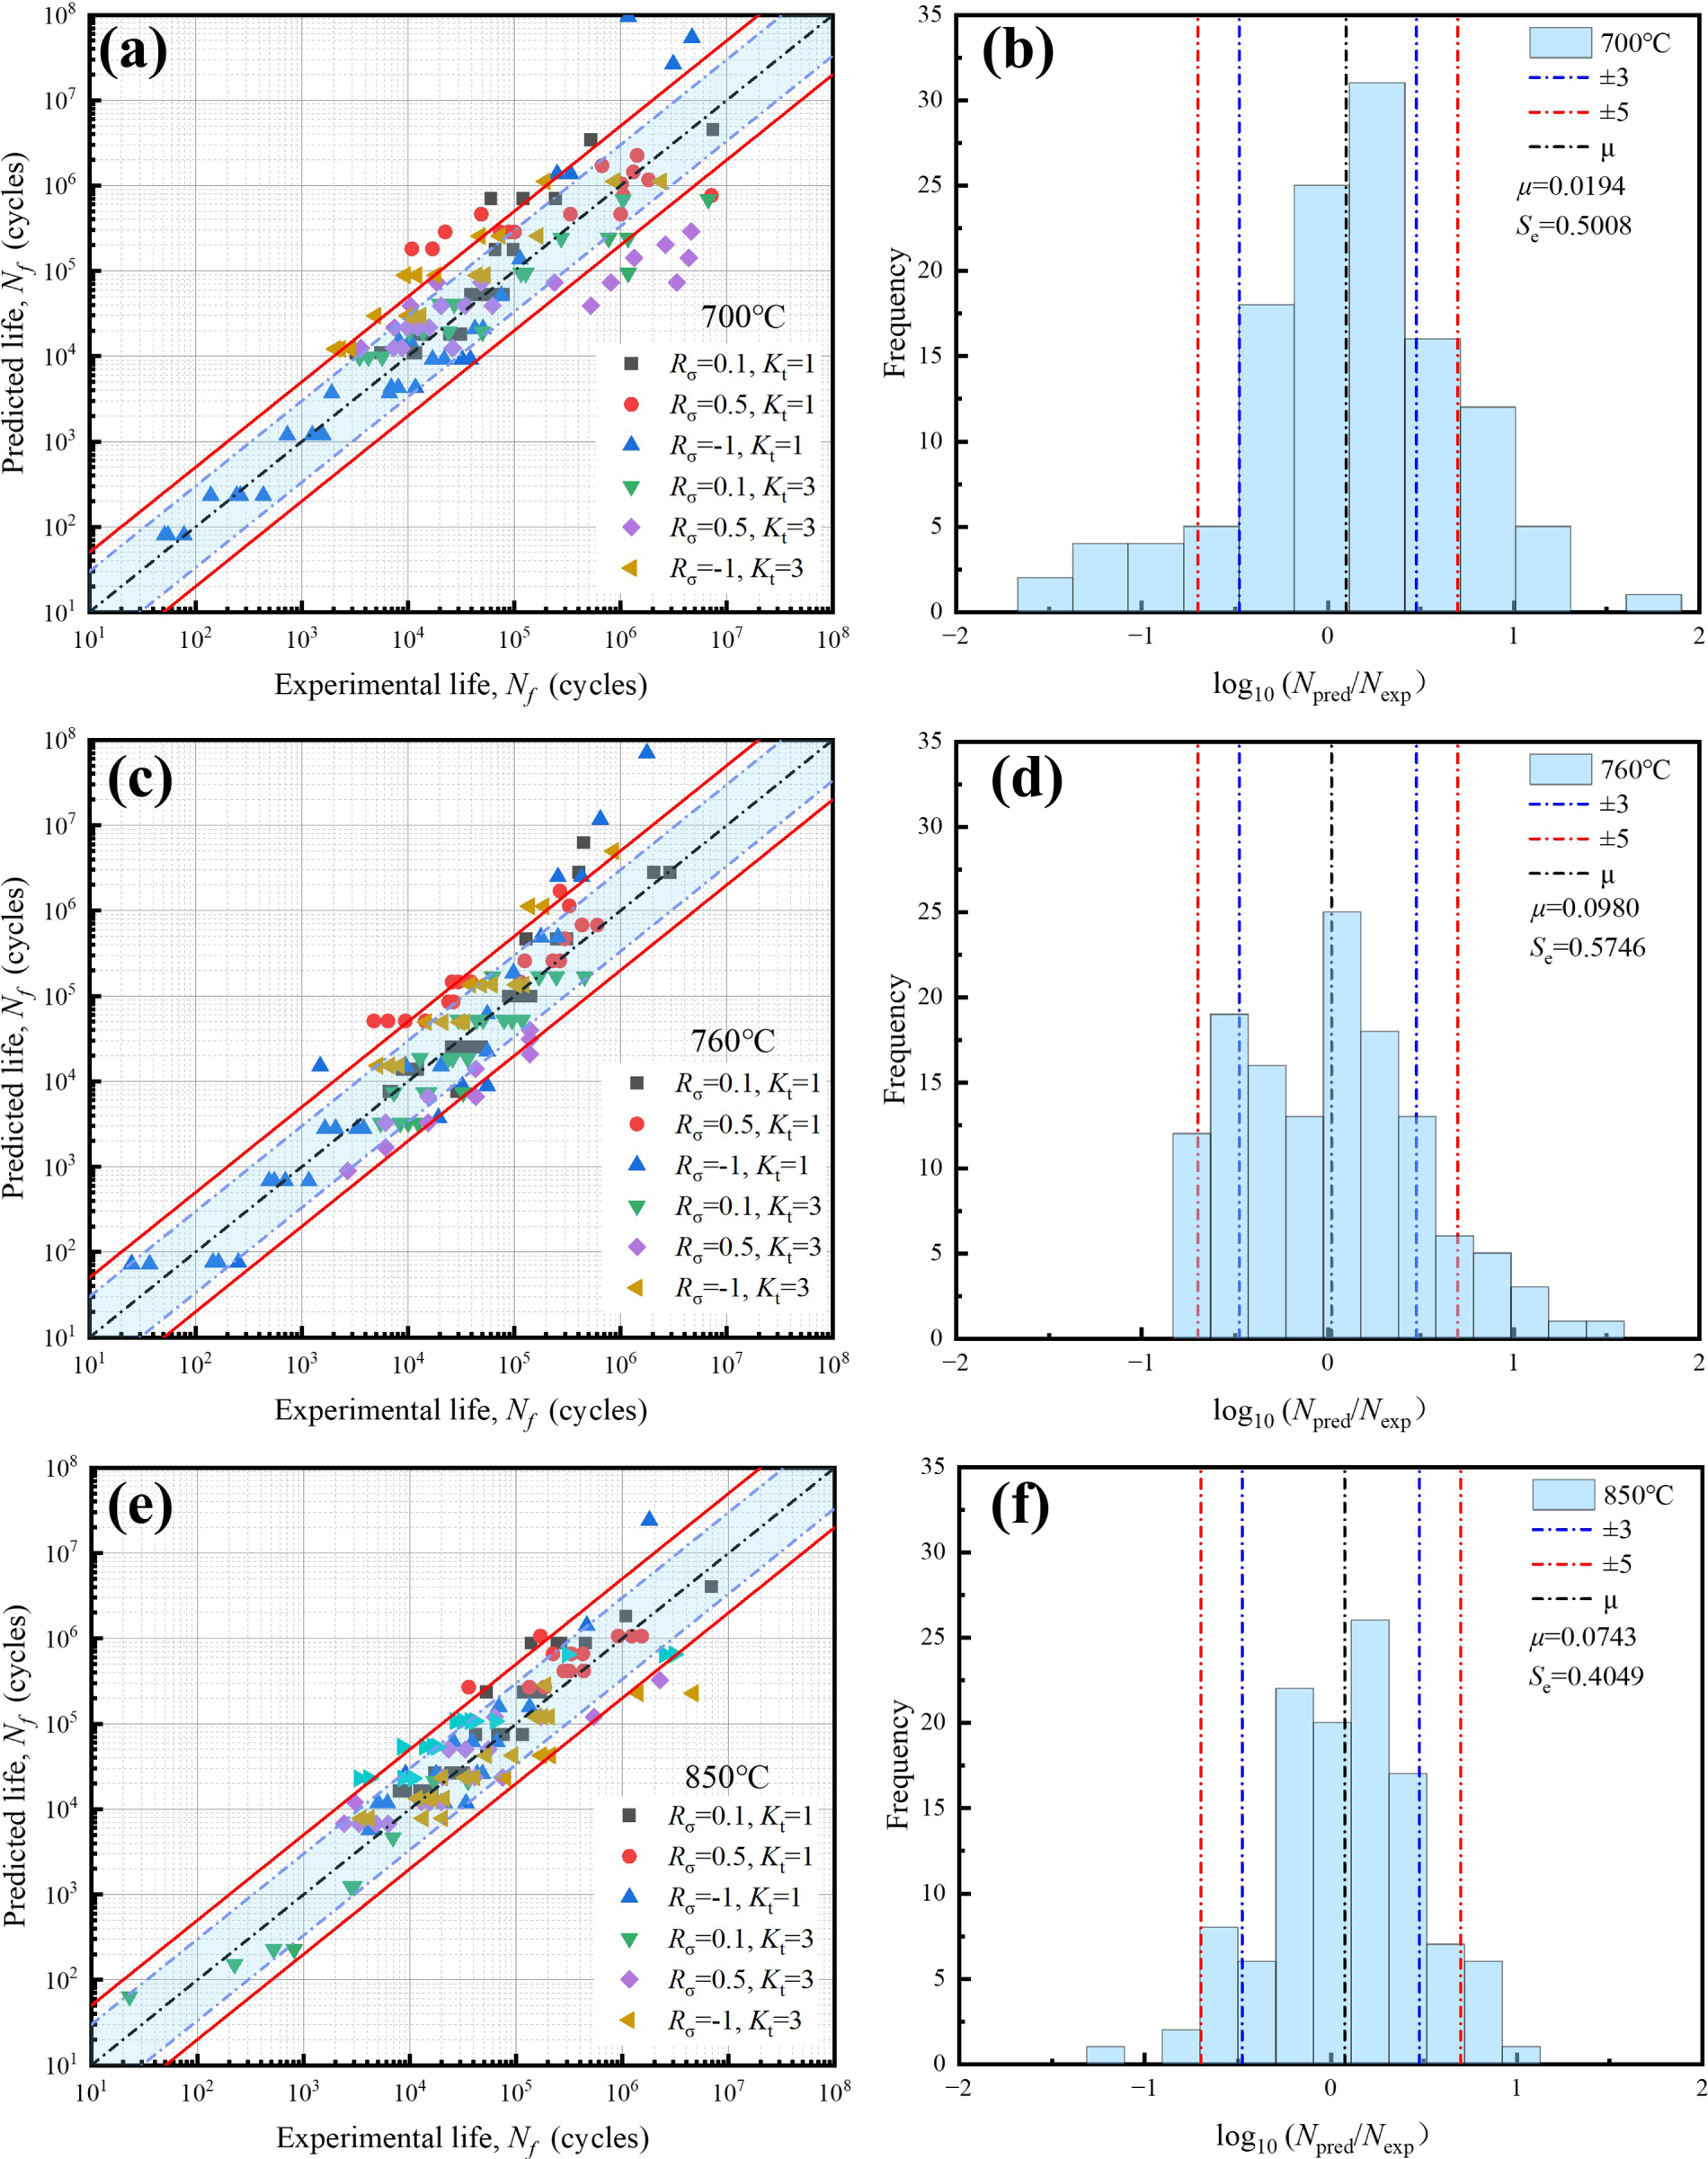
Figure 9: Combined correction validation for DZ125 at multiple temperatures. (a) 700°C predicted and experimental lives; (b) 700°C error histogram; (c) 760°C predicted and experimental lives; (d) 760°C error histogram; (e) 850°C predicted and experimental lives; (f) 850°C error histogram.
At each temperature, the DZ125 dataset contained six loading conditions formed by three stress ratios,
The remaining conditions
The partition was performed at the loading-condition level rather than by randomly separating individual observations. All observations belonging to the same fatigue curve were assigned entirely to either the calibration subset or the withheld prediction subset. Therefore, no individual observation or fatigue curve was shared between the two subsets. Although the baseline condition
The error histograms in Fig. 9b,d,f show that the logarithmic errors are generally distributed close to zero, although their scatter and bias vary among temperatures. At 700°C, 124 predictions were evaluated, with
In summary, the results in this section demonstrate that the proposed method provides a unified description of isothermal fatigue data under different stress ratios and notch severities, while maintaining reasonable predictive consistency for loading conditions withheld from calibration. Most predictions fall within the prescribed scatter bands, indicating reasonable condition-level prediction capability within the investigated range. Within each alloy–temperature combination, the ability to achieve a single parameter set across multiple stress ratios and notch severities primarily arises from transforming condition dependence from “groupwise parameter recalibration” into “equivalent driving force mapping”. Specifically, stress-ratio effects are incorporated into a unified driving force through an equivalence correction that accounts for cyclic mean stress and tension–compression asymmetry, whereas notch effects are represented through the notch-root equivalent stress response and a semi-empirical notch correction factor. These terms describe the systematic life shift associated with notch severity within the calibrated datasets.
Compared with crystal plasticity finite element (CPFE)-based approaches, the proposed method does not require full-field crystal plasticity simulations, but constructs an engineering equivalent fatigue driving parameter through nominal loading, notch-root equivalent response, and crystallographic Schmid-factor weighting. Compared with the Critical Distance Theory, it does not introduce an additional characteristic distance parameter. Instead, the notch effect is incorporated through the notch-root equivalent response and the semi-empirical notch correction, while the crystallographic effect is introduced through Schmid-factor weighting. Therefore, the proposed framework provides a simple and practical way to achieve engineering-level life prediction without requiring complex full-field simulations or additional length-scale parameters. For applications where local multiaxial stress gradients, notch-root radius effects, and anisotropic stress redistribution dominate fatigue damage, anisotropic finite element analysis or CPFE analysis is still required to obtain a more physically rigorous fatigue indicator parameter. In addition, since the present calibration and validation are based on [001]-oriented single-crystal superalloys, the correction parameters
This study develops a fatigue-life prediction framework for the unified treatment of stress-ratio and notch effects within fixed alloy–temperature conditions. By adopting an equivalent shear-type driving parameter based on notch-root equivalent response and crystallographic Schmid-factor weighting, and by introducing a stepwise, baseline-preserving correction strategy, multi-condition datasets are mapped into a consistent reference space for engineering life assessment. The main conclusions are as follows:
1. Strong nonlinear effects on fatigue life: Temperature, stress ratio, and notch severity exhibit coupled, non-separable influences on fatigue life, leading to nonlinear variations in the driving-parameter response and making a single uncorrected master curve inadequate for unified representation.
2. Unified engineering driving parameter via stepwise, baseline-preserving correction: The uncorrected
3. Model validation and condition-level forward-prediction capability: Validation results indicate stable predictive performance, with most predictions within the ±3× scatter band and generally constrained within ±5×. Once the baseline master curve and correction parameters are calibrated for a given alloy–temperature combination, the model can predict fatigue life for untested
Acknowledgement: Not applicable.
Funding Statement: This work was supported in part by the Science and Technology on Electromechanical Dynamic Control Laboratory, China (Grant No. 614260124010201), and in part by the National Basic Research Project (Grant No. JCKY2024208B002).
Author Contributions: The authors confirm contribution to the paper as follows: conceptualization, Gang Xu and Yeda Lian; methodology, Gang Xu and Yeda Lian; investigation, Gang Xu; data curation, Gang Xu; writing—original draft preparation, Gang Xu; writing—review and editing, Yeda Lian; formal analysis, Leike Yang and Hao Li; software, Leike Yang; visualization, Leike Yang; validation, Lanjie Niu and Leike Yang; resources, Yonggang Yang; supervision, Yeda Lian; project administration, Yeda Lian; funding acquisition, Yeda Lian. All authors reviewed and approved the final version of the manuscript.
Availability of Data and Materials: Data available on request from the authors.
Ethics Approval: Not applicable.
Conflicts of Interest: The authors declare no conflicts of interest.
Appendix A
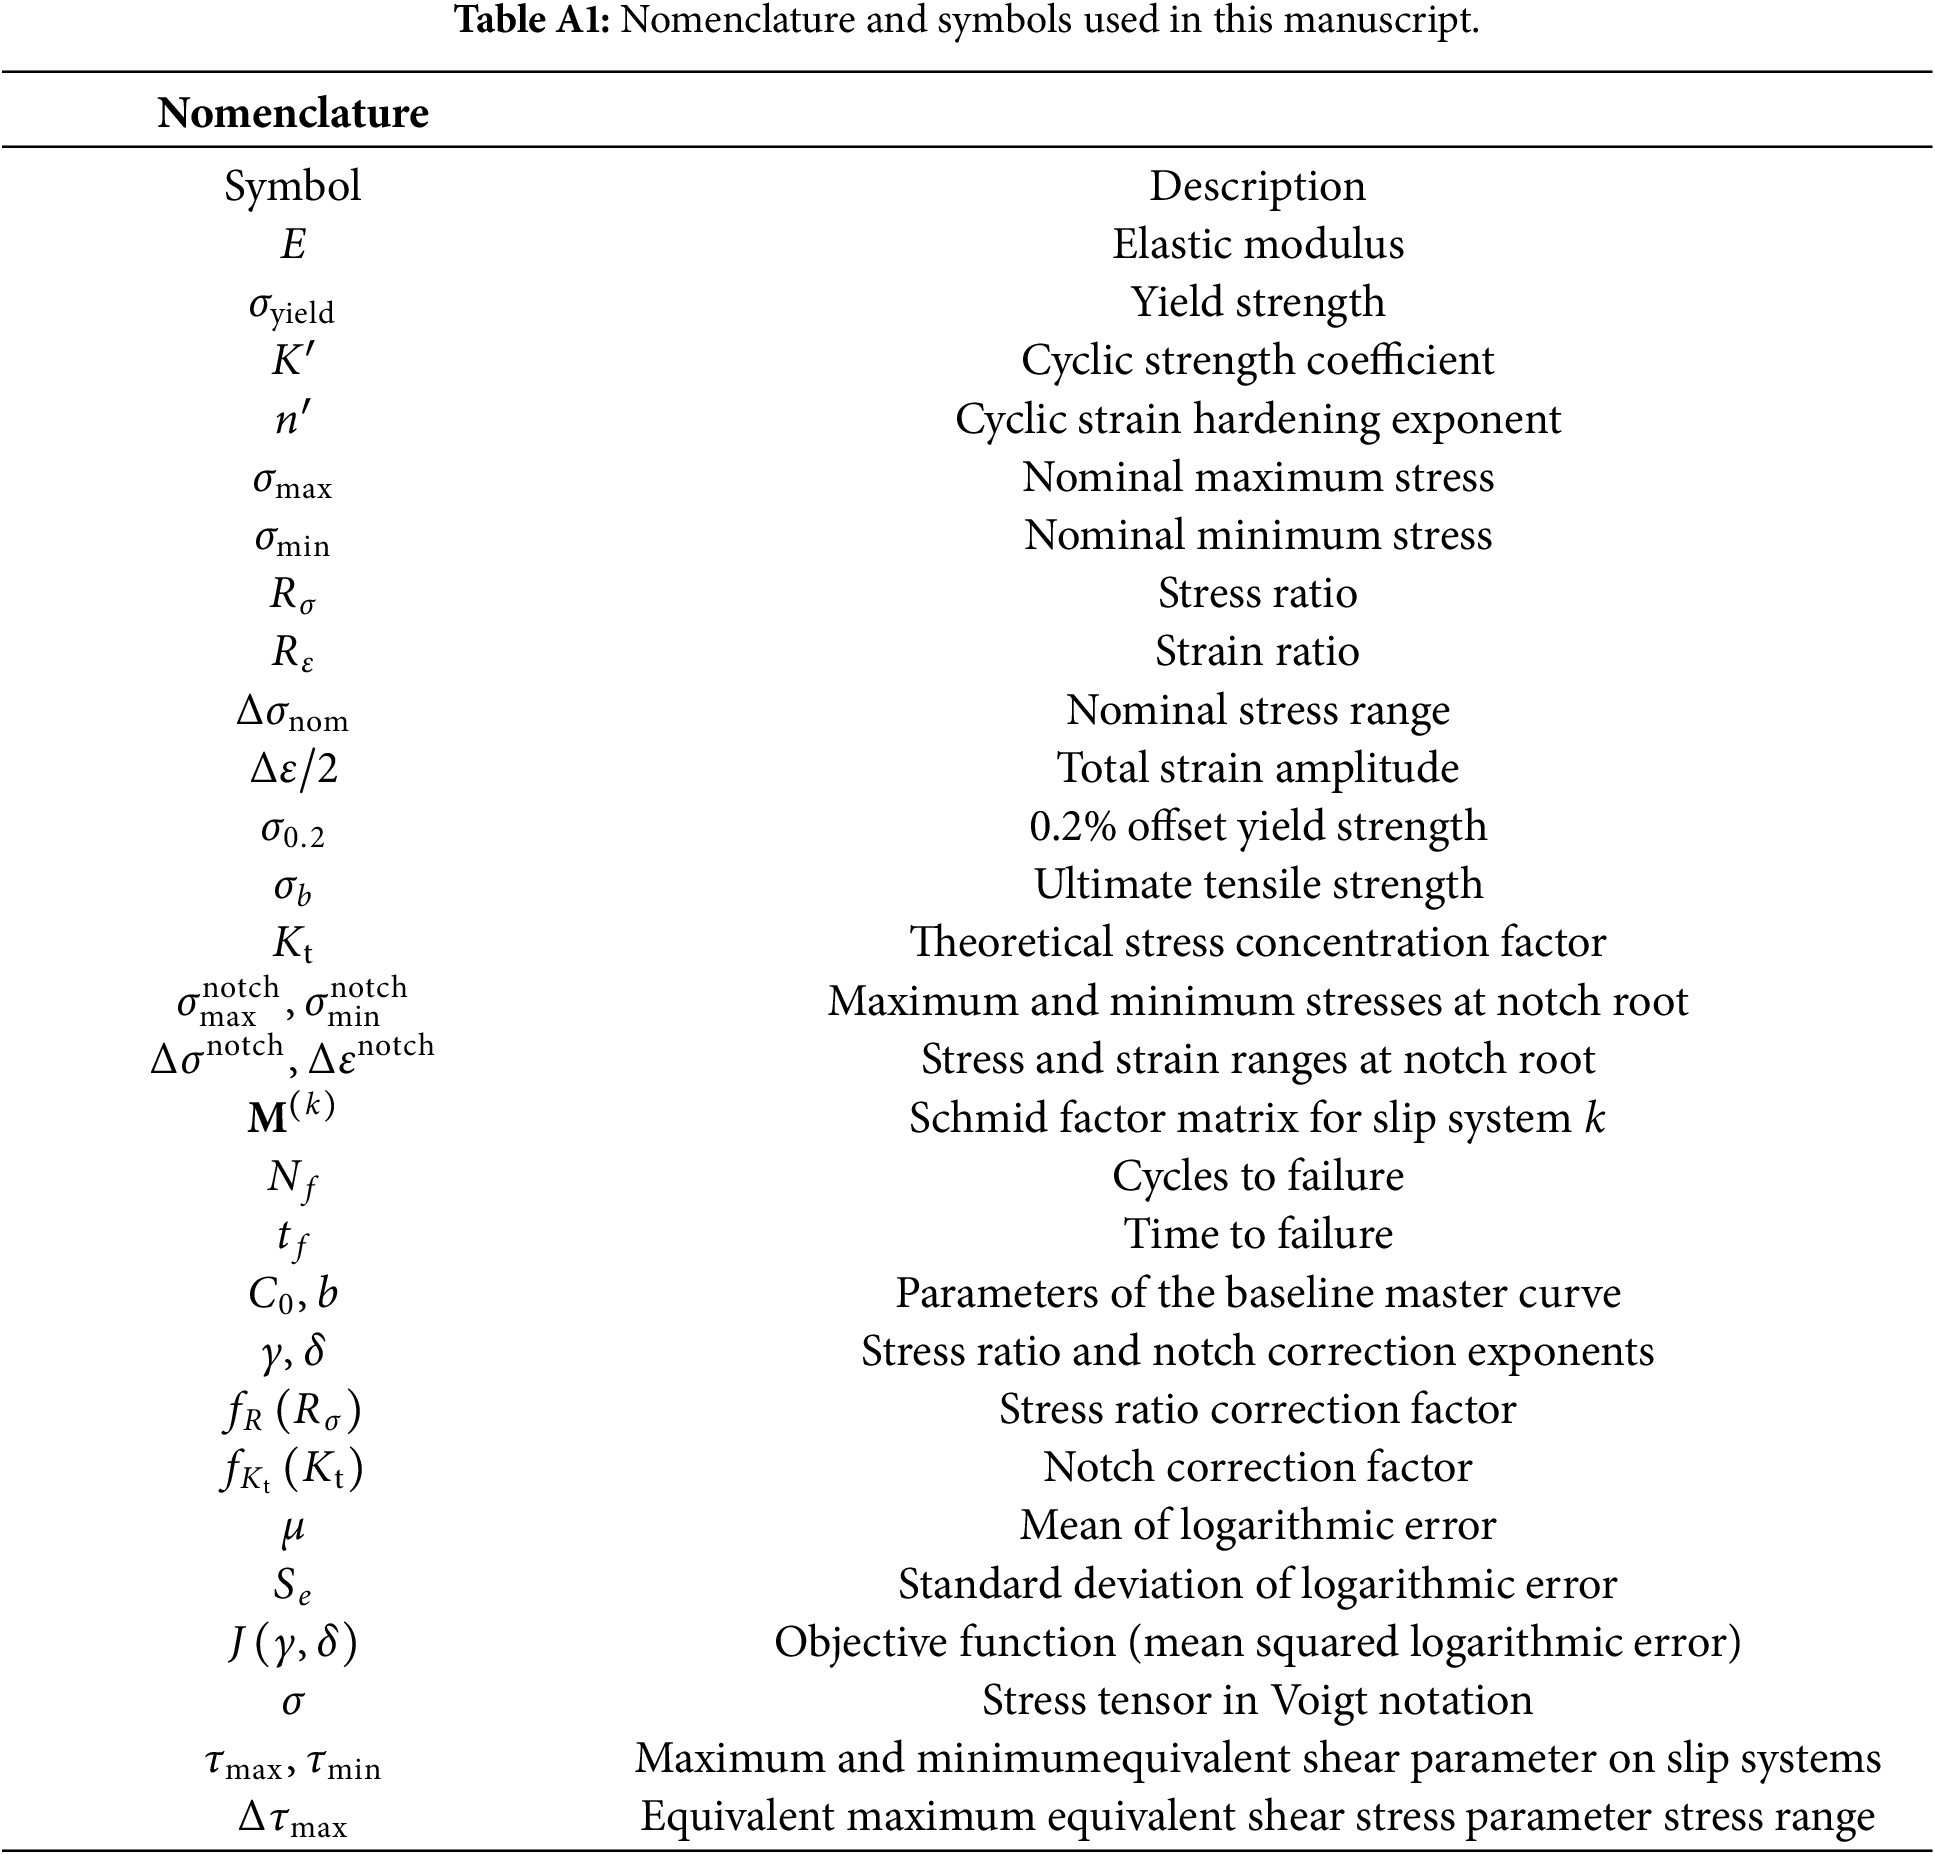
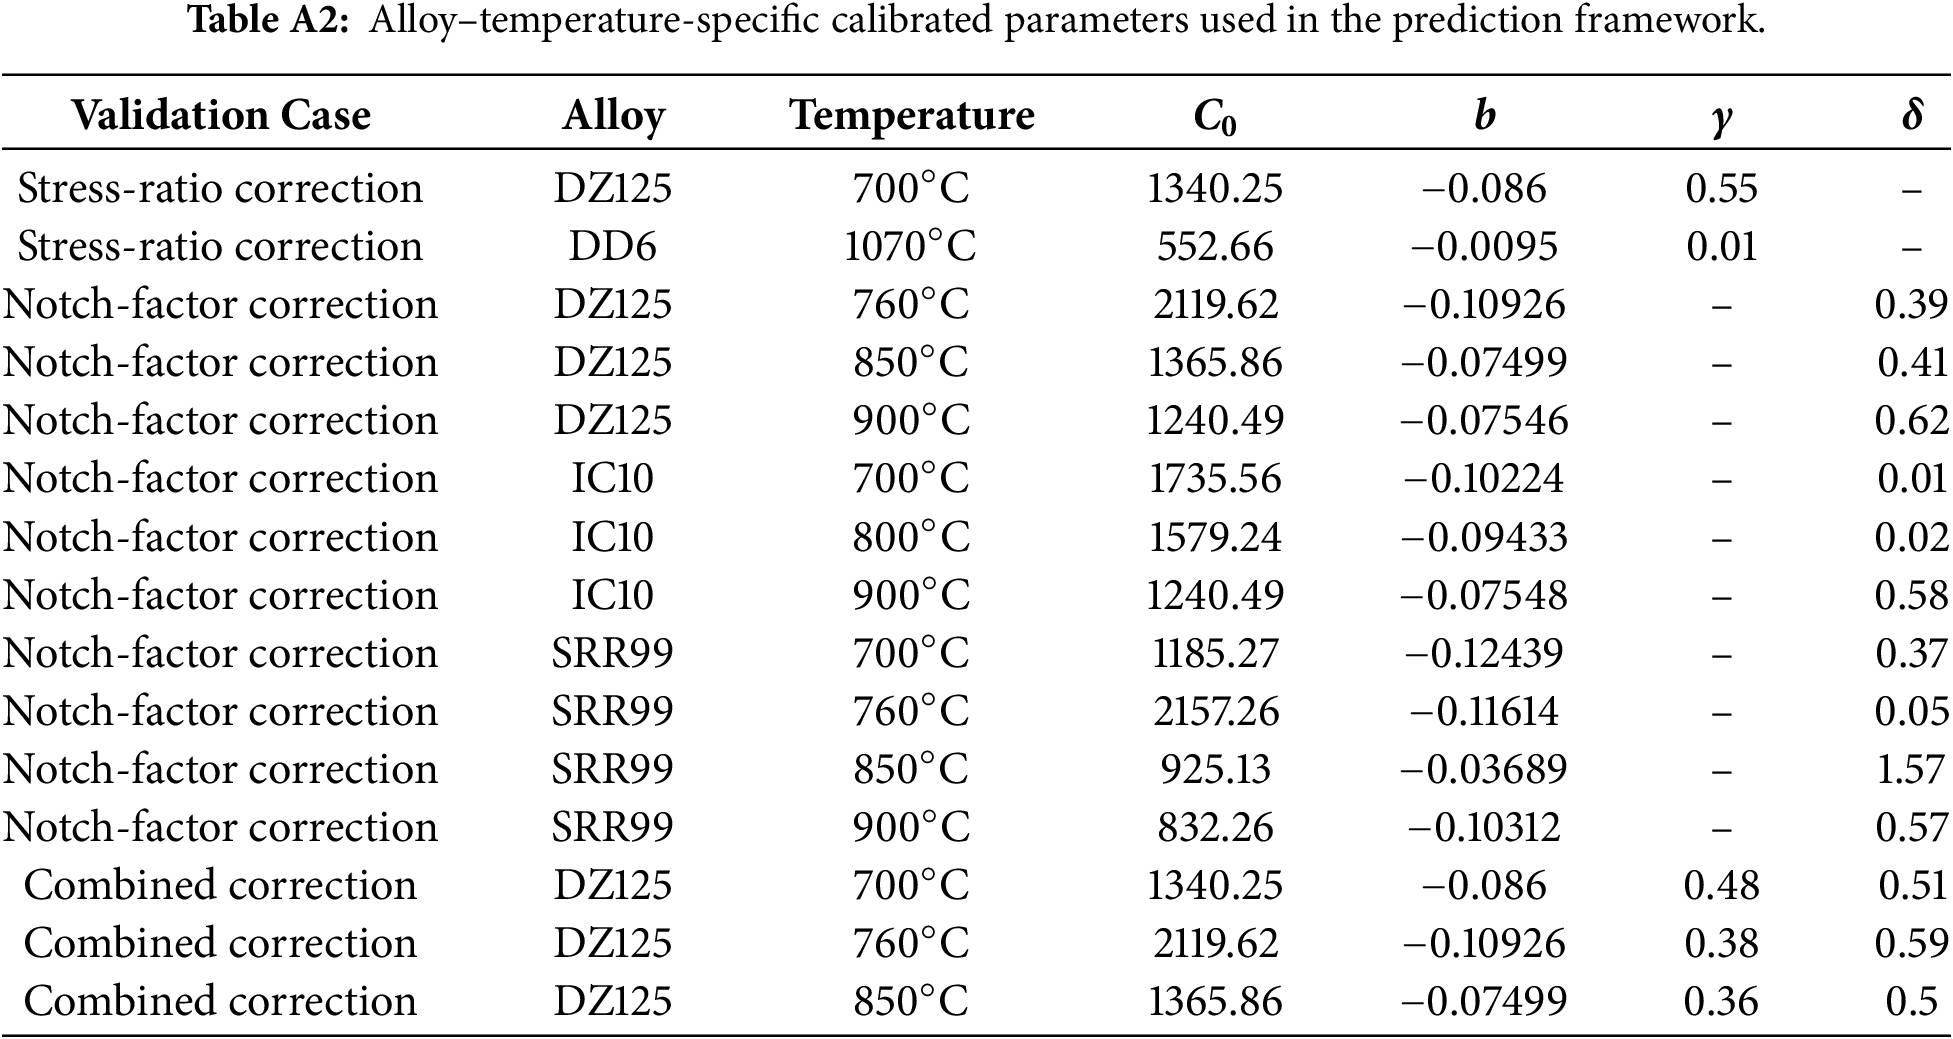
References
1. Shang Y, Zhang H, Hou H, Ru Y, Pei Y, Li S, et al. High temperature tensile behavior of a thin-walled Ni based single-crystal superalloy with cooling hole: in-situ experiment and finite element calculation. J Alloys Compd. 2019;782:619–31. doi:10.1016/j.jallcom.2018.12.232. [Google Scholar] [CrossRef]
2. Li R, Jia Z, Wang Z, Zhang P, Sun G, Han EH. Synergistic effects of γ′/γ″ precipitates and grain boundary engineering on high-temperature fatigue behavior in GH4169-CoZr superalloys: multiscale mechanisms. Int J Fatigue. 2026;206:109441. doi:10.1016/j.ijfatigue.2025.109441. [Google Scholar] [CrossRef]
3. Luo C, Yuan H. Life assessment of anisotropic low cycle fatigue of nickel-base single crystal superalloy. Int J Fatigue. 2023;167(8):107310. doi:10.1016/j.ijfatigue.2022.107310. [Google Scholar] [CrossRef]
4. Wang R, Jiang K, Jing F, Hu D. Thermomechanical fatigue failure investigation on a single crystal nickel superalloy turbine blade. Eng Fail Anal. 2016;66(3):284–95. doi:10.1016/j.engfailanal.2016.04.016. [Google Scholar] [CrossRef]
5. Wan JS, Yue ZF. A low-cycle fatigue life model of nickel-based single crystal superalloys under multiaxial stress state. Mater Sci Eng A. 2005;392(1–2):145–9. doi:10.1016/j.msea.2004.09.069. [Google Scholar] [CrossRef]
6. Kupkovits RA, Neu RW. Thermomechanical fatigue of a directionally-solidified Ni-base superalloy: smooth and cylindrically-notched specimens. Int J Fatigue. 2010;32(8):1330–42. doi:10.1016/j.ijfatigue.2010.02.002. [Google Scholar] [CrossRef]
7. Wang J, Zhang Y, Wang X, Wen Z, Yue Z. Thermodynamics-based method considering orientation and notch effect to predict the high cycle fatigue life of a nickel-based single crystal superalloy. Int J Fatigue. 2023;168(3):107452. doi:10.1016/j.ijfatigue.2022.107452. [Google Scholar] [CrossRef]
8. Wang J, Lu H, Wen Z, Lian Y, Wang Y, Yue Z. Crystal plasticity theory coupled with meso-damage to predict the ratchetting behavior of nickel-based single crystal superalloy. Int J Fatigue. 2022;165(5):107220. doi:10.1016/j.ijfatigue.2022.107220. [Google Scholar] [CrossRef]
9. Long X, Chong K, Su Y, Chang C, Zhao L. Meso-scale low-cycle fatigue damage of polycrystalline nickel-based alloy by crystal plasticity finite element method. Int J Fatigue. 2023;175(2):107778. doi:10.1016/j.ijfatigue.2023.107778. [Google Scholar] [CrossRef]
10. Gustafsson D, Lundström E. High temperature fatigue crack growth behaviour of Inconel 718 under hold time and overload conditions. Int J Fatigue. 2013;48(1):178–86. doi:10.1016/j.ijfatigue.2012.10.018. [Google Scholar] [CrossRef]
11. Ma X, Shi H, Gu J, Wang Z, Harders H, Malow T. Temperature effect on low-cycle fatigue behavior of nickel-based single crystalline superalloy. Acta Mech Solida Sin. 2008;21(4):289–97. doi:10.1007/s10338-008-0833-2. [Google Scholar] [CrossRef]
12. Wang J, Yang L, Lu H, Wen Z, Liu T, Yin Q, et al. Research on low cycle fatigue damage and macroscopic anisotropic constitutive model of Ni-based single crystal superalloy at different temperatures. Int J Fatigue. 2023;177(9):107918. doi:10.1016/j.ijfatigue.2023.107918. [Google Scholar] [CrossRef]
13. Wang J, Yang L, Lian Y, Wen Z, Lu H, Ma Z, et al. The low-cycle fatigue behavior and an entropy-based life prediction model for Nickel-based single crystal superalloy across an extensive temperature range. Eng Fract Mech. 2024;301(6):110022. doi:10.1016/j.engfracmech.2024.110022. [Google Scholar] [CrossRef]
14. Zhang L, Zhao L, Roy A, Silberschmidt V, McColvin G. Low-cycle fatigue of single crystal nickel-based superalloy–mechanical testing and TEM characterisation. Mater Sci Eng A. 2019;744(2):538–47. doi:10.1016/j.msea.2018.12.084. [Google Scholar] [CrossRef]
15. Zhang Y, Zhang X, Wang J, Ren X, Wang X, Chen R, et al. High cycle fatigue life prediction model based on crystal plasticity and continuum damage mechanics for Ni-based single crystal superalloys under a multiaxial stress state. Int J Plast. 2023;162:103526. doi:10.1016/j.ijplas.2023.103526. [Google Scholar] [CrossRef]
16. Chang L, Wen JB, Zhou CY, Zhou BB, Li J. Uniaxial ratcheting behavior and fatigue life models of commercial pure titanium. Fatigue Fract Eng Mater Struct. 2018;41(9):2024–39. doi:10.1111/ffe.12839. [Google Scholar] [CrossRef]
17. Li P, Li QQ, Jin T, Zhou YZ, Li JG, Sun XF, et al. Comparison of low-cycle fatigue behaviors between two nickel-based single-crystal superalloys. Int J Fatigue. 2014;63:137–44. doi:10.1016/j.ijfatigue.2014.01.018. [Google Scholar] [CrossRef]
18. Lashari MI, Li C, Liu G, Mahmood A, Li W. Novel crack hindrance analysis, fracture behavior, and life assessment of forged GH4169 superalloy under high and very high cycle fatigue conditions. J Mater Res Technol. 2024;33(8):1946–60. doi:10.1016/j.jmrt.2024.09.187. [Google Scholar] [CrossRef]
19. Sakaguchi M, Mase K, Sasakura I, Tanaami S, Fukuda T, Karato T. Anisotropic fatigue limit estimation for a notched single crystal superalloy based on the theory of critical distances. Int J Fatigue. 2026;203(2):109309. doi:10.1016/j.ijfatigue.2025.109309. [Google Scholar] [CrossRef]
20. He Z, Zhang Y, Qiu W, Shi HJ, Gu J. Temperature effect on the low cycle fatigue behavior of a directionally solidified nickel-base superalloy. Mater Sci Eng A. 2016;676:246–52. doi:10.1016/j.msea.2016.08.064. [Google Scholar] [CrossRef]
21. Wang XG, Liu JL, Jin T, Sun XF, Zhou YZ, Hu ZQ, et al. Deformation mechanisms of a nickel-based single-crystal superalloy during low-cycle fatigue at different temperatures. Scr Mater. 2015;99:57–60. doi:10.1016/j.scriptamat.2014.11.026. [Google Scholar] [CrossRef]
22. Gupta A, Bharti S, Singh V, Singh S, Paulose N, Mahobia GS. Effect of mean stress on high cycle fatigue strength of a directionally solidified nickel-based superalloy CM247LC at 650°C. Int J Fatigue. 2025;201(2):109137. doi:10.1016/j.ijfatigue.2025.109137. [Google Scholar] [CrossRef]
23. Chandra S, Paulose N, Rai RK. The coupling effects of oxidation and temperature on the low cycle fatigue deformation behavior of CM 247 DS LC alloy. Int J Fatigue. 2025;194:108858. doi:10.1016/j.ijfatigue.2025.108858. [Google Scholar] [CrossRef]
24. Wang J, Xu X, Lu H, Zhang L, Lian Y, Wen Z, et al. Fatigue notch strengthening effect of nickel-based single crystal superalloys under different stress ratios. Eur J Mech A/Solids. 2025;109:105471. doi:10.1016/j.euromechsol.2024.105471. [Google Scholar] [CrossRef]
25. Fang D, Berkovits A. Mean stress models for low-cycle fatigue of a nickel-base superalloy. Int J Fatigue. 1994;16(6):429–37. doi:10.1016/0142-1123(94)90458-8. [Google Scholar] [CrossRef]
26. Shi DQ, Hu XA, Wang JK, Yu HC, Yang XG, Huang J. Effect of notch on fatigue behaviour of a directionally solidified superalloy at high temperature. Fatigue Fract Eng Mater Struct. 2013;36(12):1288–97. doi:10.1111/ffe.12065. [Google Scholar] [CrossRef]
27. Louks R, Susmel L. The linear-elastic Theory of Critical Distances to estimate high-cycle fatigue strength of notched metallic materials at elevated temperatures. Fatigue Fract Eng Mater Struct. 2015;38(6):629–40. doi:10.1111/ffe.12273. [Google Scholar] [CrossRef]
28. Yang X, Wang J, Liu J. High temperature LCF life prediction of notched DS Ni-based superalloy using critical distance concept. Int J Fatigue. 2011;33(11):1470–6. doi:10.1016/j.ijfatigue.2011.05.018. [Google Scholar] [CrossRef]
29. Susmel L. The theory of critical distances: a review of its applications in fatigue. Eng Fract Mech. 2008;75(7):1706–24. doi:10.1016/j.engfracmech.2006.12.004. [Google Scholar] [CrossRef]
30. Basquin OH. The exponential law of endurance tests. Proc Am Soc Test Mater. 1910;10:625–30. [Google Scholar]
31. Coffin LF Jr. A study of the effects of cyclic thermal stresses on a ductile metal. J Fluids Eng. 1954;76(6):931–49. doi:10.1115/1.4015020. [Google Scholar] [CrossRef]
32. Manson SS. Fatigue: a complex subject—some simple approximations. Exp Mech. 1965;5(4):193–226. doi:10.1007/BF02321056. [Google Scholar] [CrossRef]
33. Ince A, Glinka G. A modification of Morrow and Smith–Watson–Topper mean stress correction models. Fatigue Fract Eng Mater Struct. 2011;34(11):854–67. doi:10.1111/j.1460-2695.2011.01577.x. [Google Scholar] [CrossRef]
34. Neuber H. Theory of notch stresses: principles for exact calculation of strength with reference to structural form and material. Berlin/Heidelberg, Germany: Springer-Verlag; 1958. [Google Scholar]
35. Wang J, Xu X, Wu J, Gu X, Wen Z, Yue Z. Stress or strain? Appropriate parameters for predicting the fatigue life of single-crystal nickel-based alloys. Eng Fail Anal. 2026;183(9):110254. doi:10.1016/j.engfailanal.2025.110254. [Google Scholar] [CrossRef]
36. Levkovitch V, Sievert R, Svendsen B. Simulation of deformation and lifetime behavior of a fcc single crystal superalloy at high temperature under low-cycle fatigue loading. Int J Fatigue. 2006;28(12):1791–802. doi:10.1016/j.ijfatigue.2005.12.006. [Google Scholar] [CrossRef]
37. Arakere NK, Swanson G. Effect of crystal orientation on fatigue failure of single crystal nickel base turbine blade superalloys. J Eng Gas Turbines Power. 2002;124(1):161–76. doi:10.1115/1.1413767. [Google Scholar] [CrossRef]
38. Arakere NK, Orozco E. Analysis of low cycle fatigue properties of single crystal nickel-base turbine blade superalloys. High Temp Mater Process. 2001;20(5–6):403–20. doi:10.1515/htmp.2001.20.5-6.403. [Google Scholar] [CrossRef]
39. Arakere NK. High-temperature fatigue properties of single crystal superalloys in air and hydrogen. J Eng Gas Turbines Power. 2004;126(3):590–603. doi:10.1115/1.1501075. [Google Scholar] [CrossRef]
40. Cheng R. Material manual for aero engine design. Beijing, China: Aviation Industry Press; 2019. (In Chinese). [Google Scholar]
41. Xie H, Li J, Han M. Effect of stress ratio on high cycle fatigue behavior of a single crystal superalloy. Rare Met Mater Eng. 2018;47(4):1054–8. doi:10.3724/sp.j.1037.2011.00433. [Google Scholar] [CrossRef]
42. Liu Y, Yu JJ, Xu Y, Sun XF, Guan HR, Hu ZQ. High cycle fatigue behavior of a single crystal superalloy at elevated temperatures. Mater Sci Eng A. 2007;454:357–66. doi:10.1016/j.msea.2006.11.045. [Google Scholar] [CrossRef]
43. Cervellon A, Yi JZ, Corpace F, Hervier Z, Rigney J, Wright PK, et al. Creep, fatigue, and oxidation interactions during high and very high cycle fatigue at elevated temperature of nickel-based single crystal superalloys. In: Superalloys 2020. Cham, Switzerland: Springer; 2020. p. 185–95. [Google Scholar]
44. Wright PK, Jain M, Cameron D. High cycle fatigue in a single crystal superalloy: time dependence at elevated temperature. In: Superalloys 2004. Warrendale, PA, USA: TMS; 2004. p. 657–66. [Google Scholar]
45. Zhang Z, Yu H, Dong C. LCF behavior and life prediction method of a single crystal nickel-based superalloy at high temperature. Front Mech Eng. 2015;10(4):418–23. doi:10.1007/s11465-015-0362-x. [Google Scholar] [CrossRef]
46. Wang LN, Liu Y, Yu JJ, Xu Y, Sun XF, Guan HR, et al. Orientation and temperature dependence of yielding and deformation behavior of a nickel-base single crystal superalloy. Mater Sci Eng A. 2009;505(1–2):144–50. doi:10.1016/j.msea.2008.12.039. [Google Scholar] [CrossRef]
47. Mücke R, Woratat P. A cyclic life prediction approach for directionally solidified nickel superalloys. J Eng Gas Turbines Power. 2010;132(5):052401. doi:10.1115/1.3205027. [Google Scholar] [CrossRef]
Cite This Article
 Copyright © 2026 The Author(s). Published by Tech Science Press.
This work is licensed under a Creative Commons Attribution 4.0 International License , which permits unrestricted use, distribution, and reproduction in any medium, provided the original work is properly cited.
 Downloads
 Citation Tools
