
 Submit a Paper
 Propose a Special lssue
 Open Access
ARTICLE

Improved Prediction of Slope Stability under Static and Dynamic Conditions Using Tree-Based Models
1
State Key Laboratory of Coastal and Offshore Engineering, Dalian University of Technology, Dalian, 116024, China
2
Key Laboratory of Geological Hazards on Three Gorges Reservoir Area, Ministry of Education, China Three Gorges University,
Yichang, 443002, China
3
Department of Civil Engineering, Faculty of Engineering, International Islamic University Malaysia, Jalan Gombak, Selangor,
50728, Malaysia
4
Department of Civil Engineering, University of Engineering and Technology Peshawar (Bannu Campus), Bannu, 28100, Pakistan
5
Faculty of Civil Engineering, Islamic Azad University, Varamin Pishva Branch, Tehran, 15914, Iran
* Corresponding Author: Jilei Hu. Email:
(This article belongs to the Special Issue: Computational Intelligent Systems for Solving Complex Engineering Problems: Principles and Applications)
Computer Modeling in Engineering & Sciences 2023, 137(1), 455-487. https://doi.org/10.32604/cmes.2023.025993
Received 09 August 2022; Accepted 23 December 2022; Issue published 23 April 2023
 View Full Text
 Download PDF
Abstract
Slope stability prediction plays a significant role in landslide disaster prevention and mitigation. This paper’s reduced error pruning (REP) tree and random tree (RT) models are developed for slope stability evaluation and meeting the high precision and rapidity requirements in slope engineering. The data set of this study includes five parameters, namely slope height, slope angle, cohesion, internal friction angle, and peak ground acceleration. The available data is split into two categories: training (75%) and test (25%) sets. The output of the RT and REP tree models is evaluated using performance measures including accuracy (Acc), Matthews correlation coefficient (Mcc), precision (Prec), recall (Rec), and F-score. The applications of the aforementioned methods for predicting slope stability are compared to one another and recently established soft computing models in the literature. The analysis of the Acc together with Mcc, and F-score for the slope stability in the test set demonstrates that the RT achieved a better prediction performance with (Acc = 97.1429%, Mcc = 0.935, F-score for stable class = 0.979 and for unstable case F-score = 0.935) succeeded by the REP tree model with (Acc = 95.4286%, Mcc = 0.896, F-score stable class = 0.967 and for unstable class F-score = 0.923) for the slope stability dataset The analysis of performance measures for the slope stability dataset reveals that the RT model attains comparatively better and reliable results and thus should be encouraged in further research.Keywords
In geotechnical engineering, slope stability analysis and prediction are critical. Along with earthquakes and volcanoes, slope instability has become one of the world’s three great geological disasters. To decrease or prevent landslide damage, slope stability analysis and stabilization are required. Nevertheless, accurate slope stability prediction is difficult due to the complexity of slope structures and the difficulty in identifying the relevant input data linked to significant geotechnical parameters [1–3].
Several approaches have been proposed to analyze or predict slope stability, among which are Limit Equilibrium Methods (LEMs) [4,5] and numerical methods (e.g., Finite-element Method (FEM)) [6–8] are the most widely employed methods [9,10]. Empirical equations [11,12] and limit analysis approaches based on lower and upper bound theorems [13] are other methods. All of the methods discussed above, however, have some drawbacks. Limit equilibrium methods, for example, cannot reflect the slip surfaces’ actual stress conditions [14], and as a result of simplifying assumptions, their accuracy is compromised [1]. The numerical methods are time-consuming, and their accuracy is strongly reliant on correct geotechnical and physical parameter estimation.
For the last few years, a recently developed approach based on data mining techniques has been increasingly used to solve real-world problems, particularly in the field of civil engineering [15–35]. Several practical problems have already been successfully solved with machine learning algorithms, paving the way for new prospects in civil engineering. Furthermore, a variety of machine learning algorithms, for example, Artificial Neural Networks (ANNs) and Support Vector Machine (SVM) have been developed for addressing technical issues, such as predicting slope stability [10,36]. Table 1 summarizes previous studies on slope stability prediction using soft computing techniques. ANN and SVM are the most widely used soft computing methods for predicting slope stability because they do not require prior knowledge of a specific model form and have flexible nonlinear modeling capabilities [37]. They also outperform traditional analytical and regression methods when it comes to predicting slope stability [38,39].
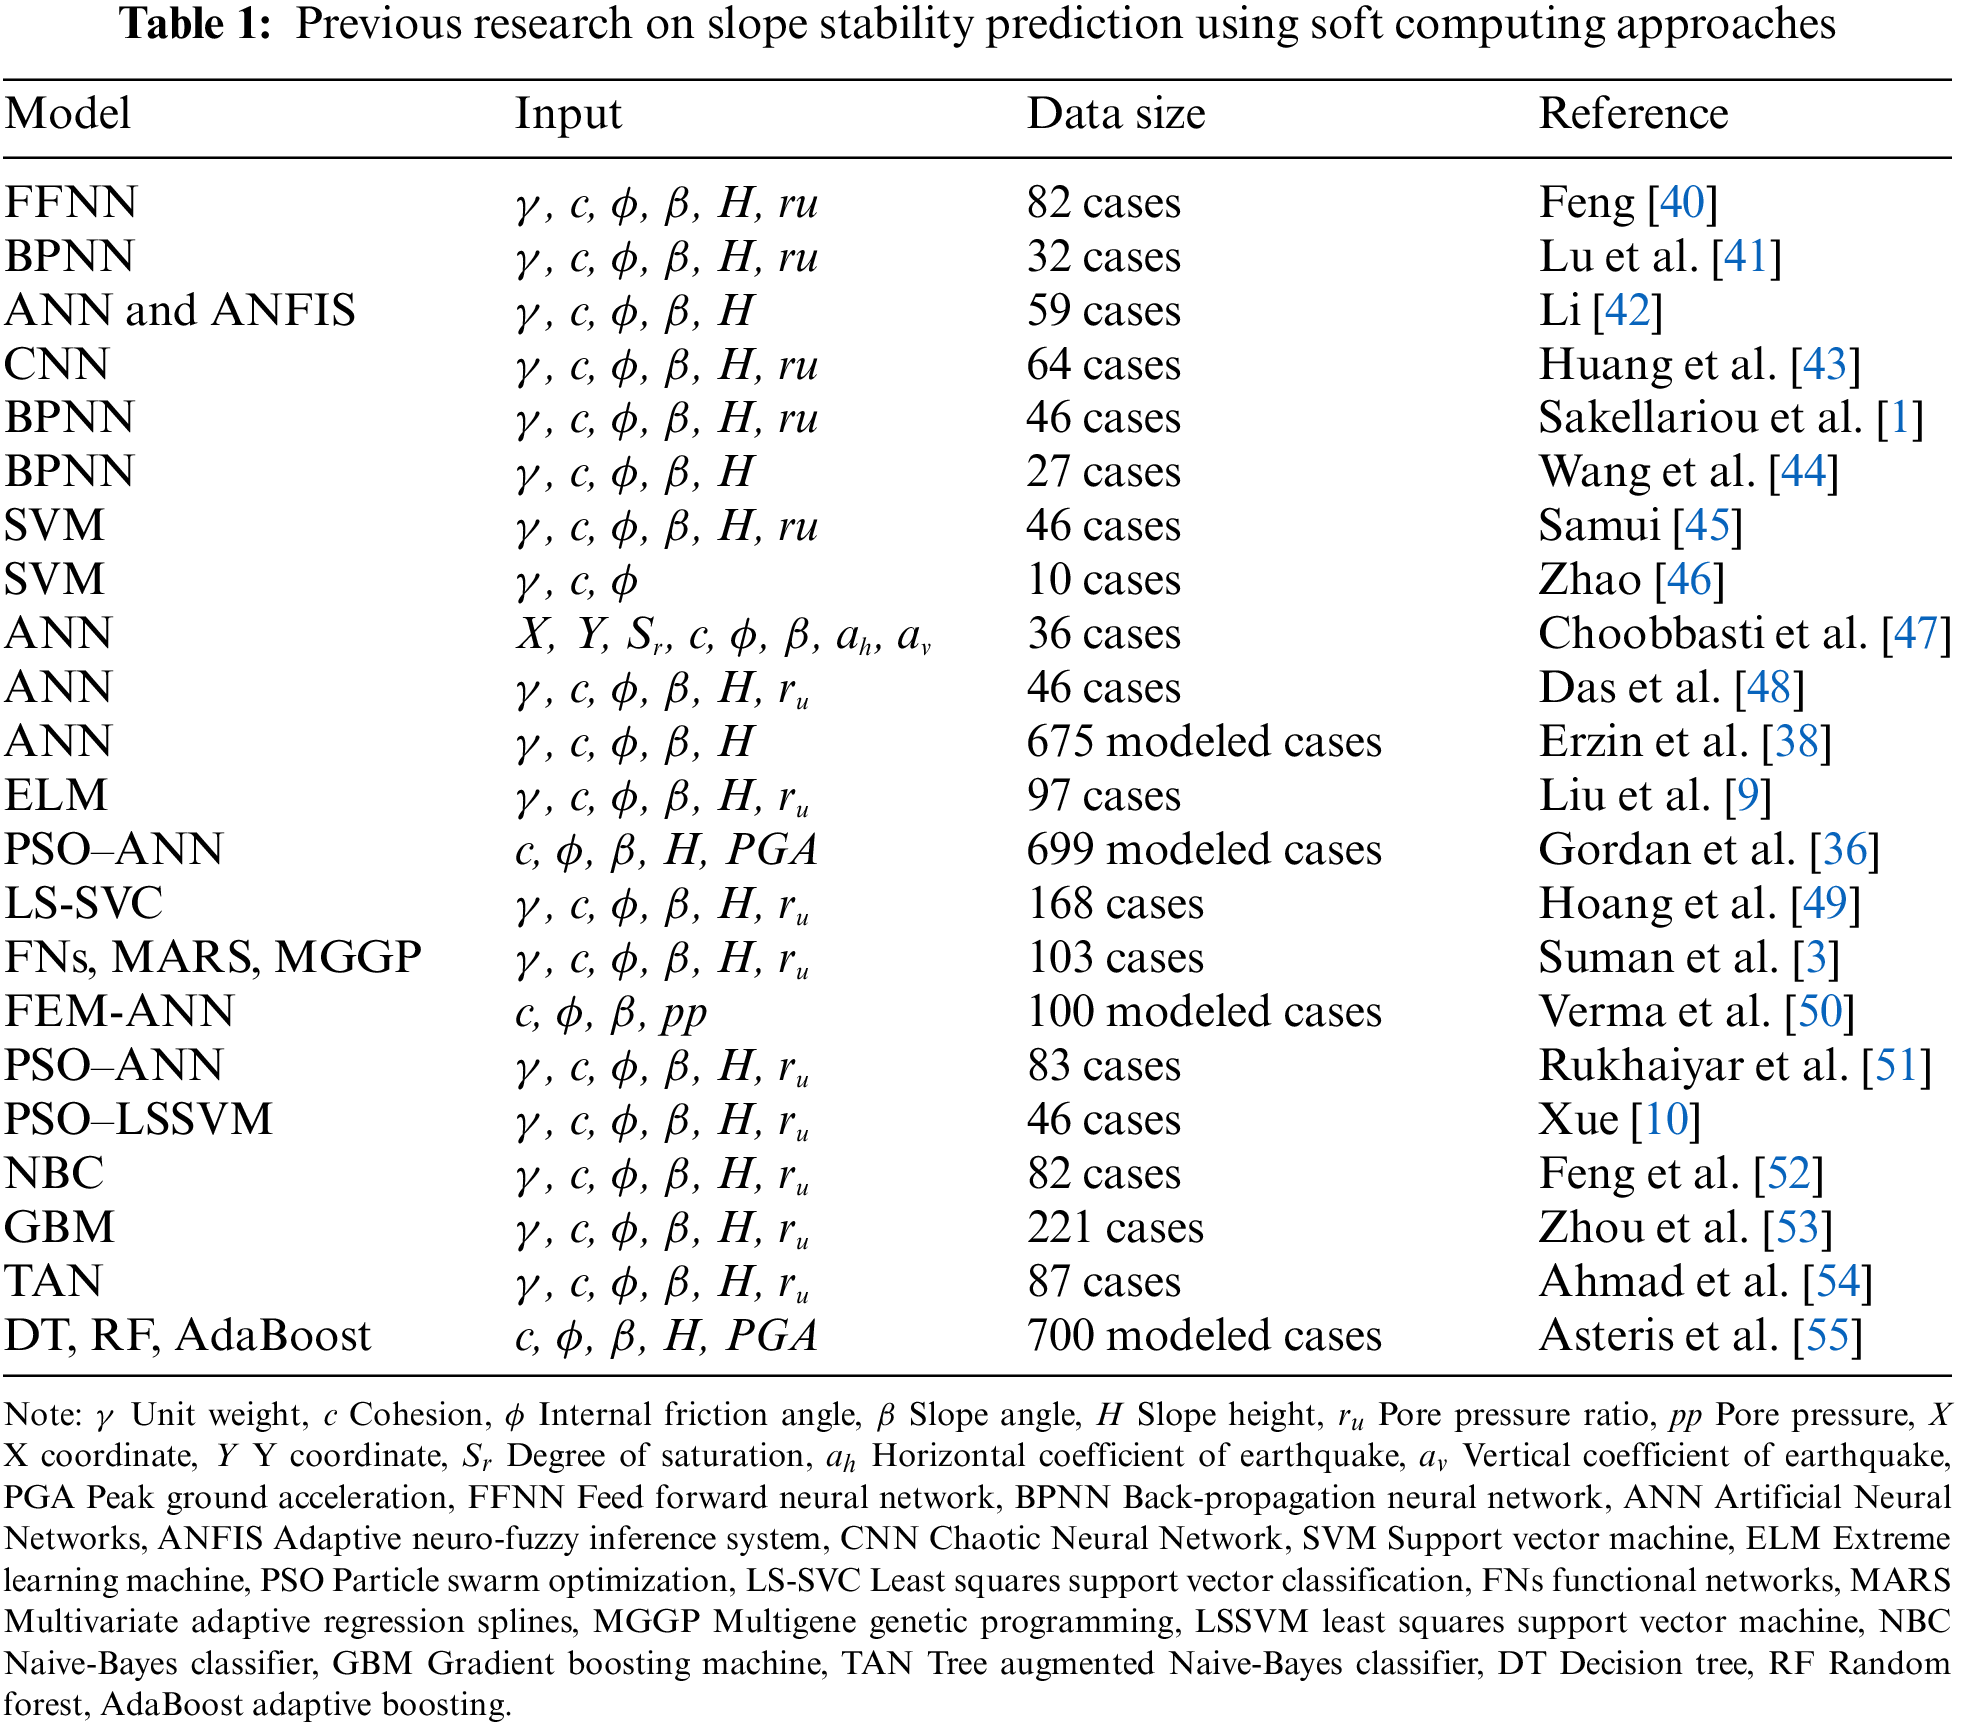
As shown in Table 1, various researches classified slope FoS under static conditions using essential factors such as slope height (H), cohesion (c), internal friction angle (ϕ), slope angle (β), and unit weight (γ). These studies presented novel ideas and methods for predicting slope stability. On the other hand, this field is still being researched. According to a critical review of the existing literature, despite the successful implementation of the reduced error pruning (REP) tree and random tree (RT) in various domains, e.g., [19,56], their application to predict slope stability in dynamic situations is scarcely explored. In the current study, the horizontal component of peak ground acceleration (PGA) is included in the input parameters.
This study has significance in several ways:
1. Decision tree models are developed for analyze and early detection of slope stability that able to learn the complex relationship between slope stability and its influencing factors with reasonable precision. Furthermore, the proposed models provide easily interpretable tree structures that can be used by geotechnical engineering professionals with the help of spreadsheets to predict the slope stability for future seismic events without going into the complexities of models development using RT and REP trees.
2. The performance of the proposed models is comparatively assessed with two commonly used soft computing models (RF and AdaBoost) published in the literature to validate the performance.
3. One of the major advantages of the presented models is the consideration and addition of dynamic conditions—the horizontal component of peak ground acceleration (PGA) to the database.
4. Data division for training and testing datasets was carried out with due regard for statistical aspects such as dataset range, mean, and standard deviation. The datasets are split to determine the predictive ability and generalization performance of developed models, which will and later helps in evaluating them better.
The following summarizes the rest of the paper: The data catalog is shown in Section 2. Section 3 describes the applied DT techniques and performance measures. The results and discussion are presented in Section 4. Finally, some concluding remarks are given.
In this study, 700 homogenous slope data (see Appendix A) were obtained from [55] and simulated using GeoStudio, which utilizes the LEM approach for the most important FoS parameters. Many homogenous slopes (in terms of material, γ = 18 kg/m3) with varied conditions were modeled to achieve FoS in the study. The slopes were created with heights of 15, 20, 25, and 30 m with slopes of 20°, 25°, 30°, and 35°. In terms of rigid behavior, all of the models were on bedrock. Furthermore, all models were supposed to have a crest width of 8 m. The failure criterion of Mohr-Coulomb was applied in this study’s analysis. Internal friction angles of 20°, 25°, 30°, 35°, and 40° were utilized in the tests, with cohesions of 20, 30, 40, and 50 kPa. All models were assumed to have a soil density of 18 kg/m3. According to Kramer [57], peak ground acceleration (PGA) is a measurement of earthquake acceleration on the ground. The PGA amplitudes were determined to be 0.1, 0.2, 0.3, and 0.4 g in this investigation. FoS values were determined for several slope scenarios. As slip surfaces, all of the slope models used thirty slices. This study used a grid and a radius slip surface to achieve FoS values. The computed FoS in the grid and radius technique should be almost in the grid’s center. Previous studies (e.g., [55]) show that slope stability under seismic excitation is a function of slope height (H), cohesion (c), internal friction angle (ϕ), slope angle (β), and peak ground acceleration (PGA). Therefore, in the current study, these input variables were used to develop the proposed models. Fig. 1 illustrates a generic limit equilibrium model for the simulated slope. Table 2 shows the statistics for all five input parameters (i.e., c, ϕ, β, H, and PGA) in the database, including their range, mean, standard deviation (Std. Dev), and coefficient of variation (COV). Fig. 2 is a heat map of a correlation matrix that highlights the correlation between parameters. It should be noticed that c, ϕ, and H have the highest variations.
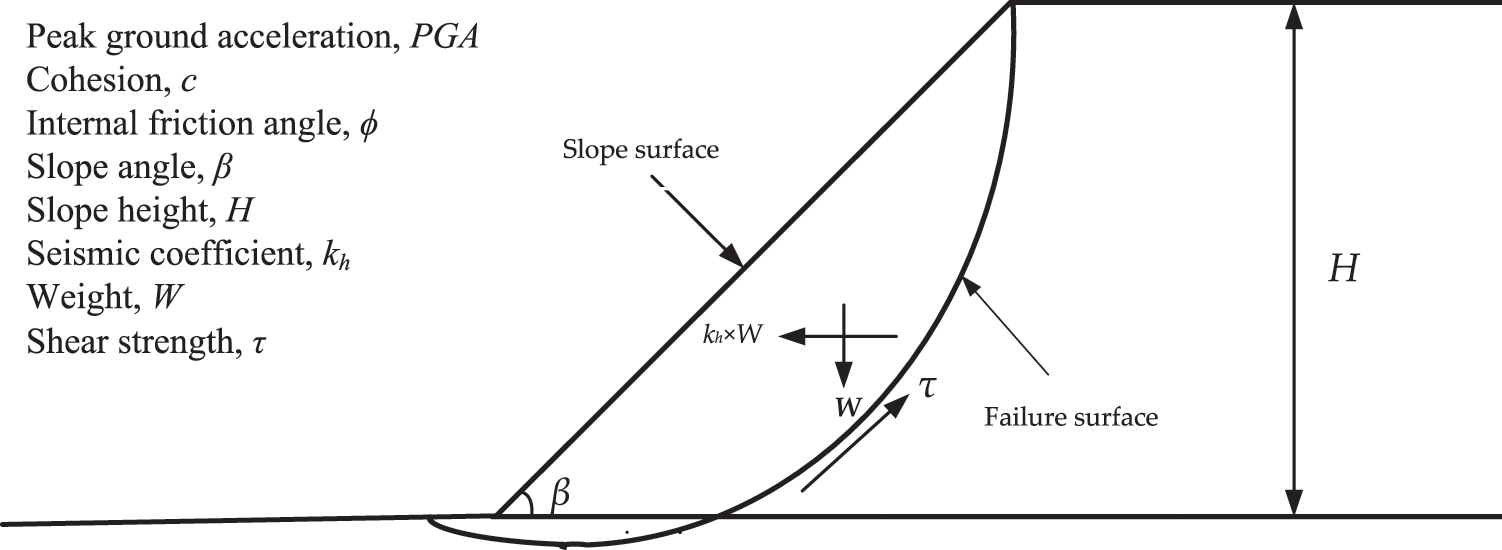
Figure 1: Limit equilibrium model for the stability analysis
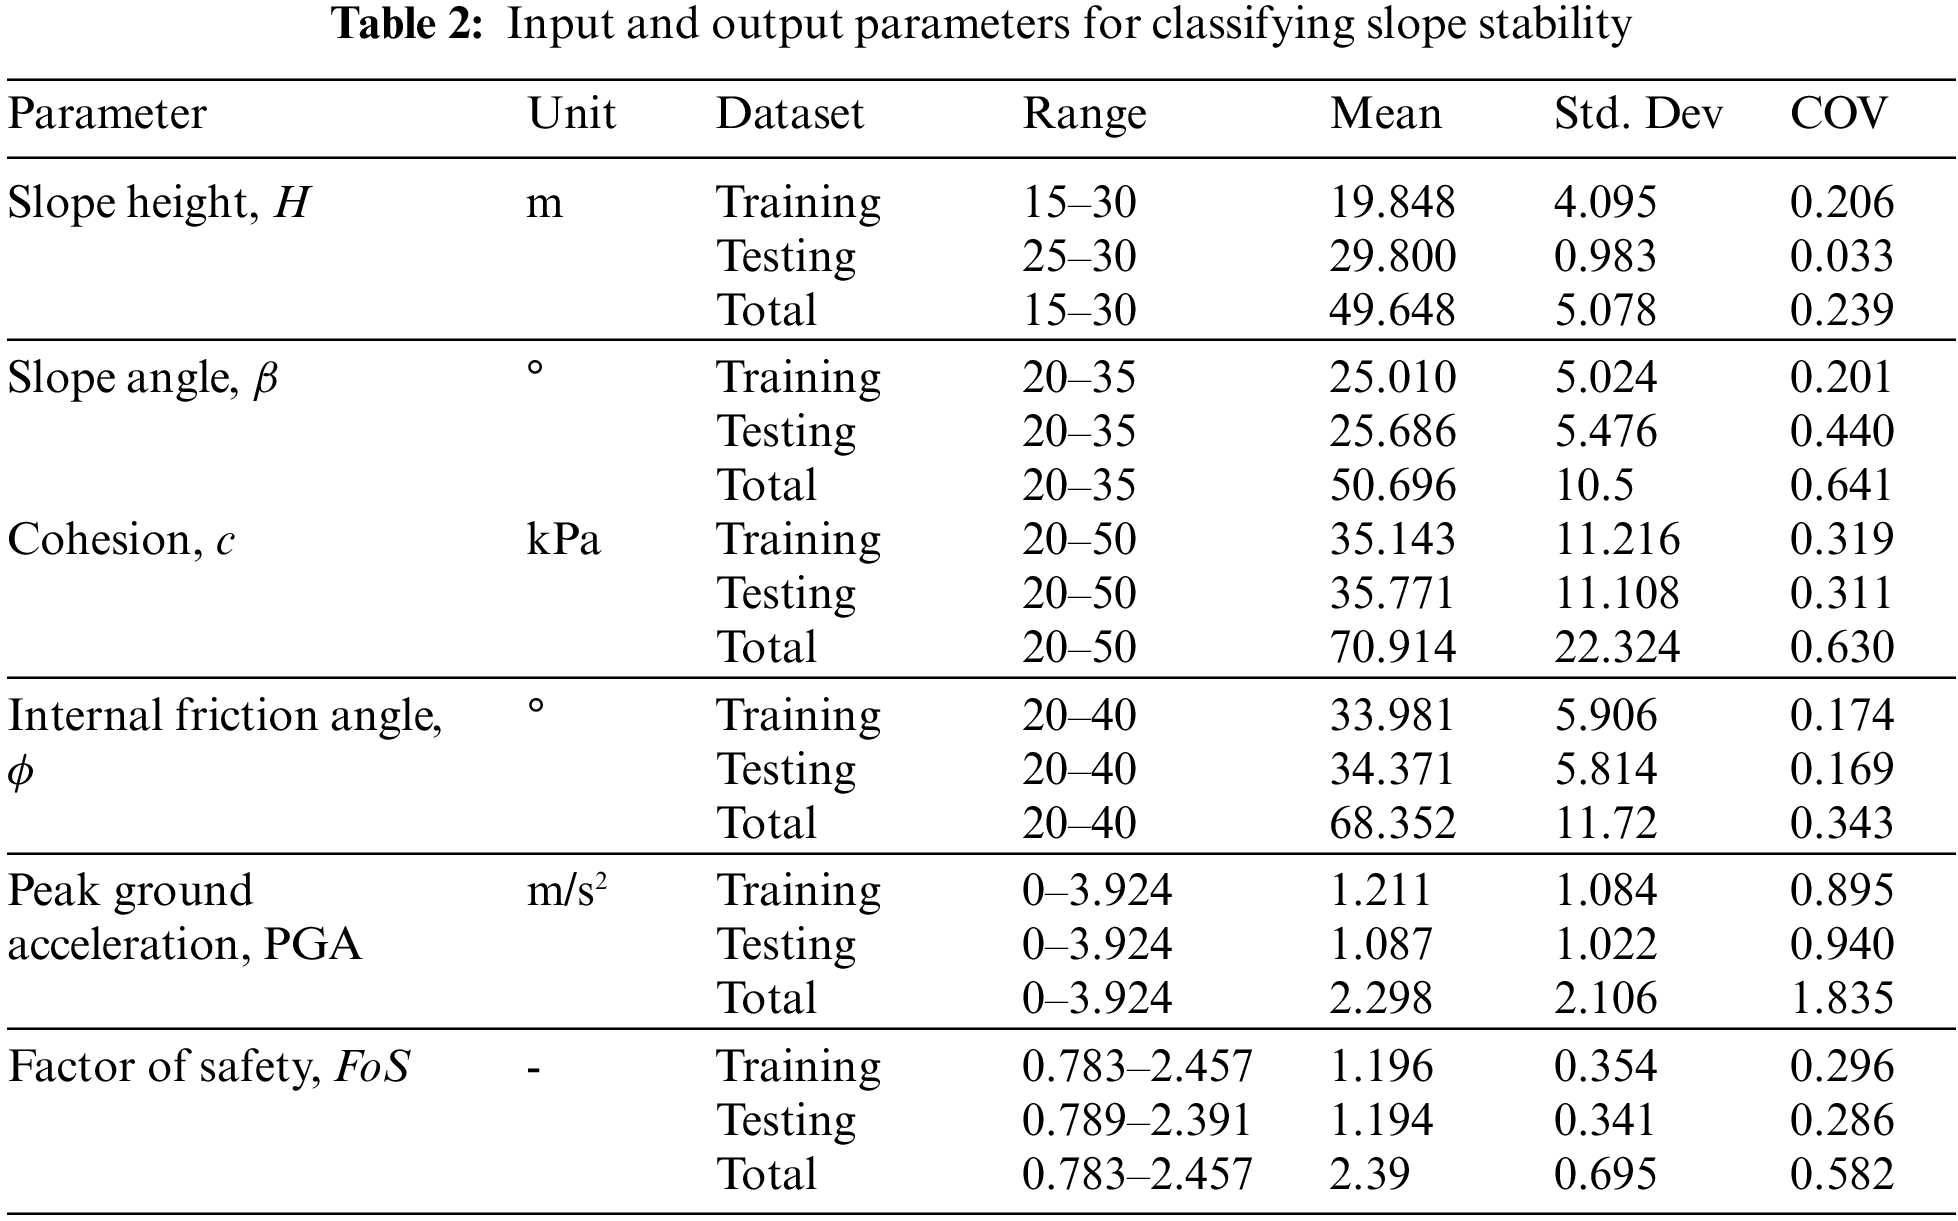
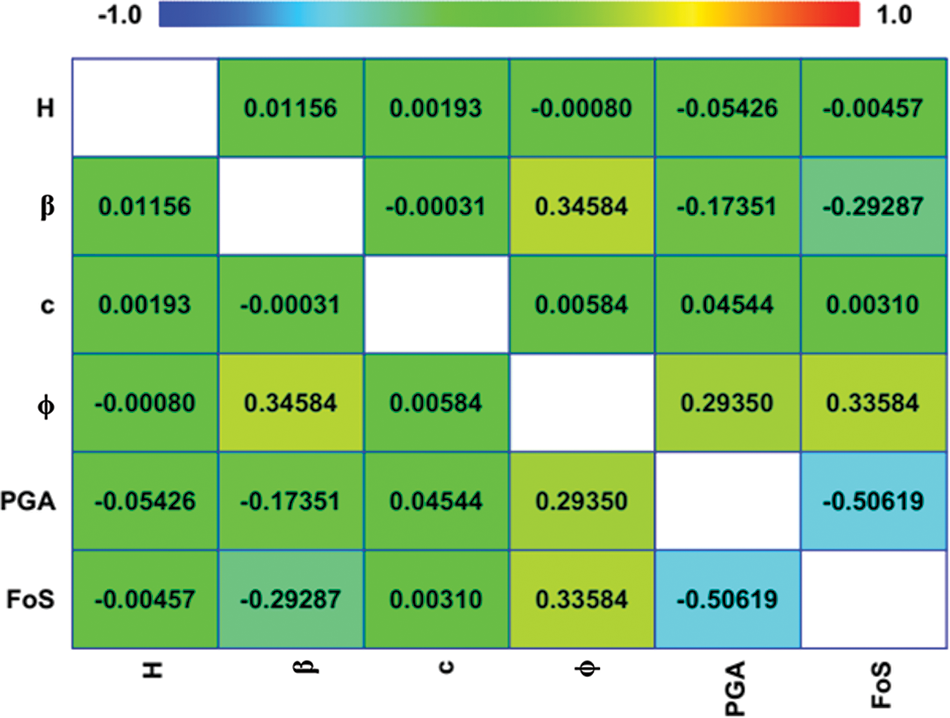
Figure 2: Heat map displaying the correlation matrix between five input variables and one output variable in the dataset
Random trees comprise a forest of predictor trees. The random tree is an algorithm halfway between a simple decision tree and a random forest. Random trees were initially proposed by Leo Breiman and Adele Cutler. The algorithm can address both regression and classification tasks [58,59]. The classification mechanisms include the following: The random tree classifier classifies the input vector of characteristics with each tree in the forest and then outputs the class label with the most “votes” [60].
A random tree is one that is randomly created from a set of possible trees, each of which has K random attributes at each node. In this context, “at random” indicates that any tree in the set has an equal chance of being chosen for sampling. Rapidly constructing random trees and integrating them with large sets of random trees typically yields accurate models. In recent years, there has been extensive research on random trees in the field of machine learning, e.g., [58]. The random tree approach is employed in order to achieve the highest level of accuracy in its numerous classifier parameters such as a minimum number of instances and the number of sets utilized for randomly chosen attributes. The decision tree must be basic and compact for improved classification. Otherwise, the level of precision will be diminished. To determine the maximum parameter value, one parameter was held constant while the other was adjusted to determine the parameter with the highest accuracy.
3.2 Reduced Error Pruning Tree
The REP Tree is an ensemble model consisting of the decision tree, and reduced error pruning (REP) approaches that are effective for classification and regression tasks [19]. One of the fastest decision tree classifier algorithms is the REP tree. It builds the decision tree utilizing the attribute’s entropy and information gain, as well as a reduced error pruning strategy. It generates many trees and chooses the best one from the resulting list. The back fitting method is used by the REP tree to prune the tree. The REP tree algorithm sorts all numeric fields in the dataset only once at the start and then splits the attributes at each tree node using the sorted list. The numeric attributes are classified by minimizing total variance. The non-numeric properties are categorized using a regular decision tree and a reduced error pruning algorithm.
The accuracy (Acc), Matthews correlation coefficient (Mcc), precision (Prec), recall (Rec), and F-score were used to evaluate the model’s performance. Table 3 shows the performance metrics, together with their formulations and definitions, based on the confusion matrix described in Table 4. Fig. 3 depicts the methodology used in the development of the proposed models.
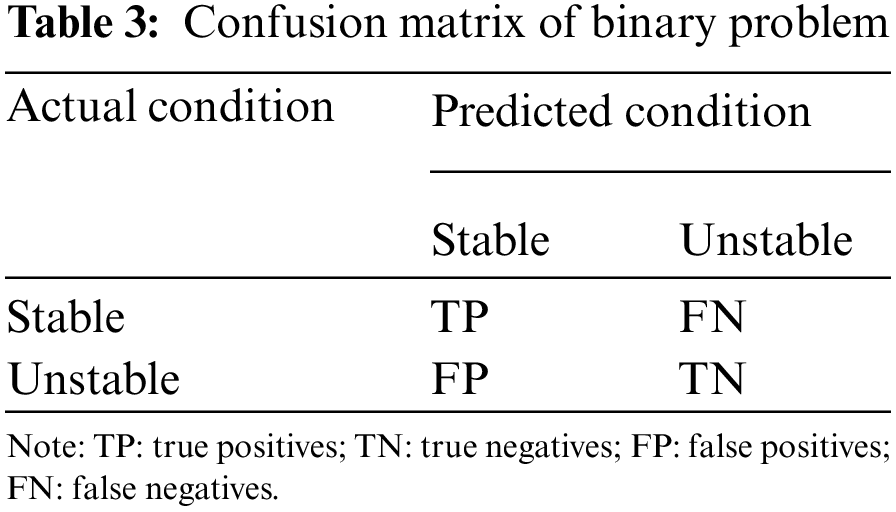
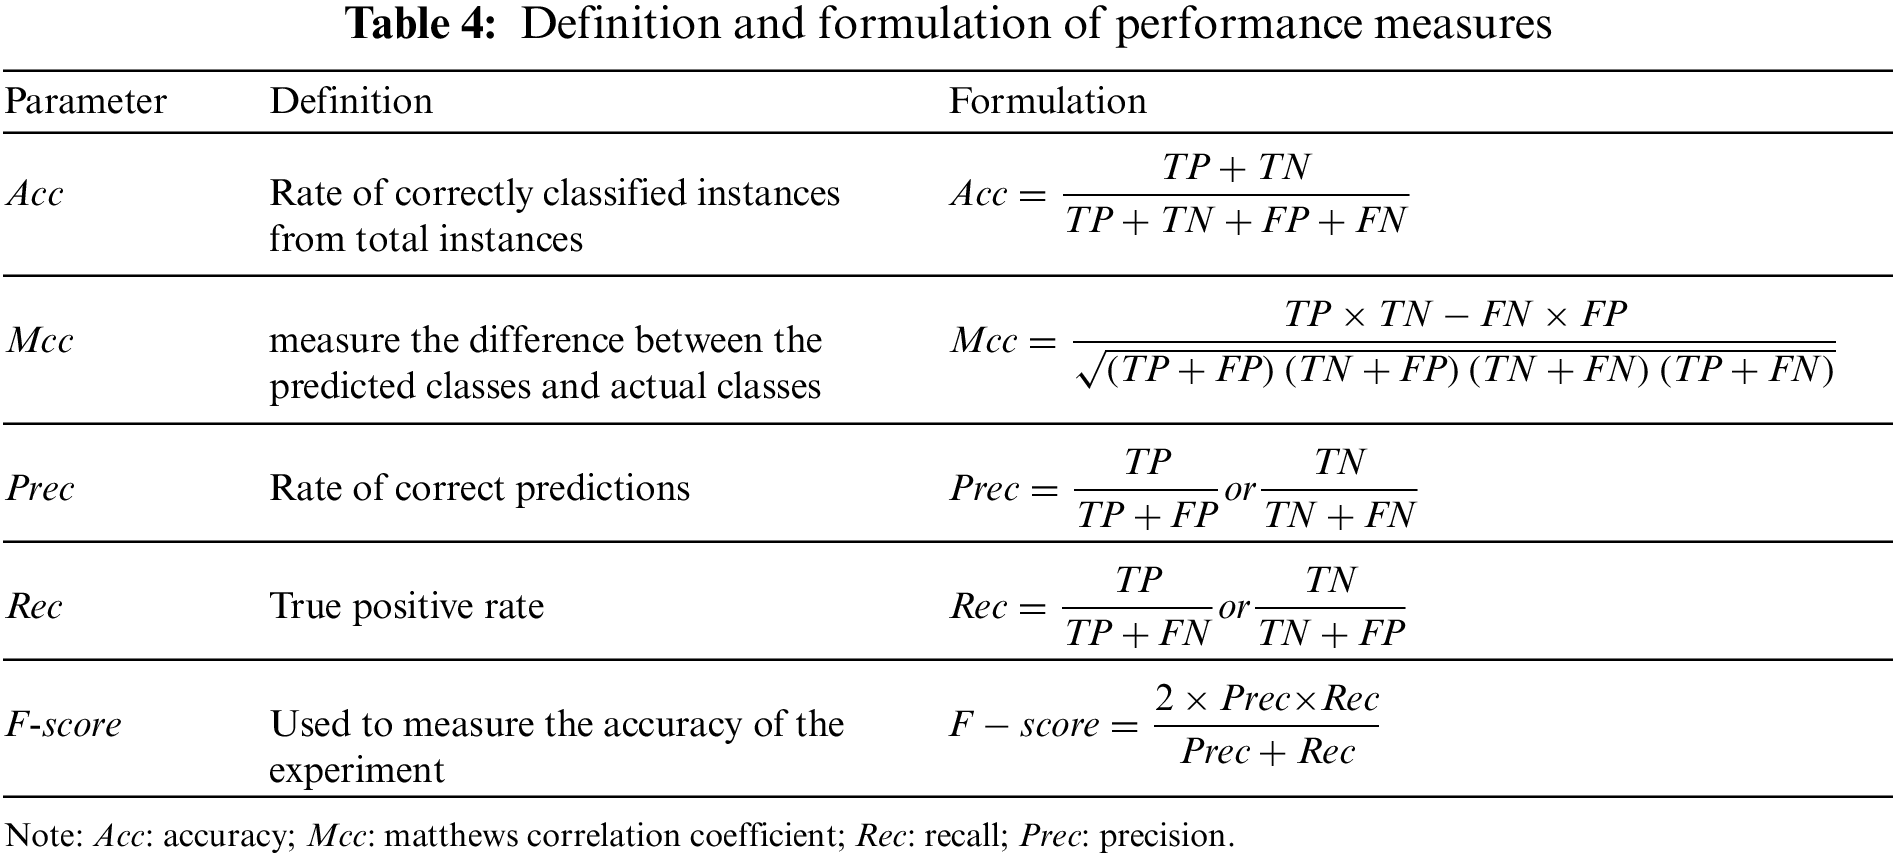
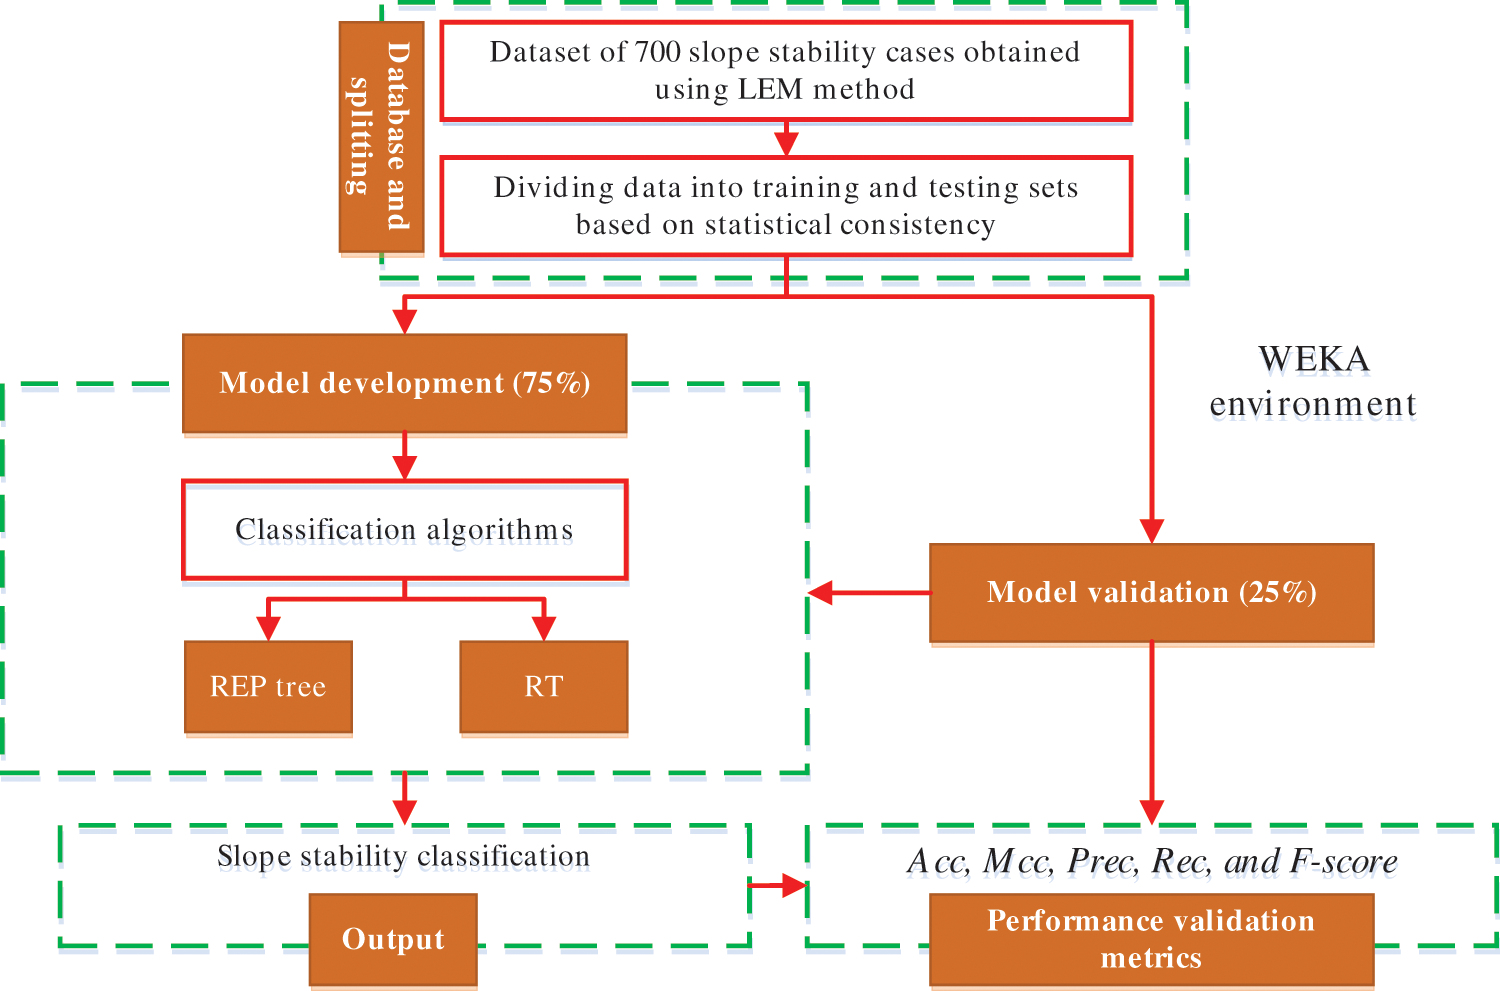
Figure 3: Flowchart depicting the general DT methodology
In this section, two models using a random tree and REP tree to predict slope stability experience circular failure mode were developed. Researchers have used a different percentage of the available data as the training set for different problems. For instance, Kurup et al. [61] used 63% of the data for training; Tang et al. [62] used 75%; while Padmini et al. [63] used 80%. In this study, 75% of the data was for training. The models were developed using Waikato Environment for Knowledge Analysis (WEKA) software [64]. WEKA is well-known and powerful data mining software developed at the New Zealand’s University of Waikato. It is a set of open-source machine learning algorithms for data mining tasks in the real world data mining tasks, including classification, regression, and clustering, among others. For its prediction, the RT and REP tree algorithms were used. The minimum number of instances per leaf (n) is a key effective parameter for the accuracy of RT and REP tree models. The trial and error method is used in WEKA to get the best value for this parameter. It means that different values of n are used to train the RT and REP tree models, and the value that yields the best accuracy is chosen as the best. Fig. 4 depicts the RT and REP tree models. The RT and REP tree are 95 and 35, respectively. At each leaf node, the numbers in parentheses represent the total number of instances and the number of incorrectly classified cases. It is clear that some instances are misclassified in some leaves. The number of misclassified instances is specified after a slash. In order to create the most accurate model, the optimal values for n in WEKA were obtained through trial and error. The RT and REP tree models were trained using various values of n, with the best values for these parameters being 2 and 3, respectively. The RT algorithm’s optimal value for K was 0.
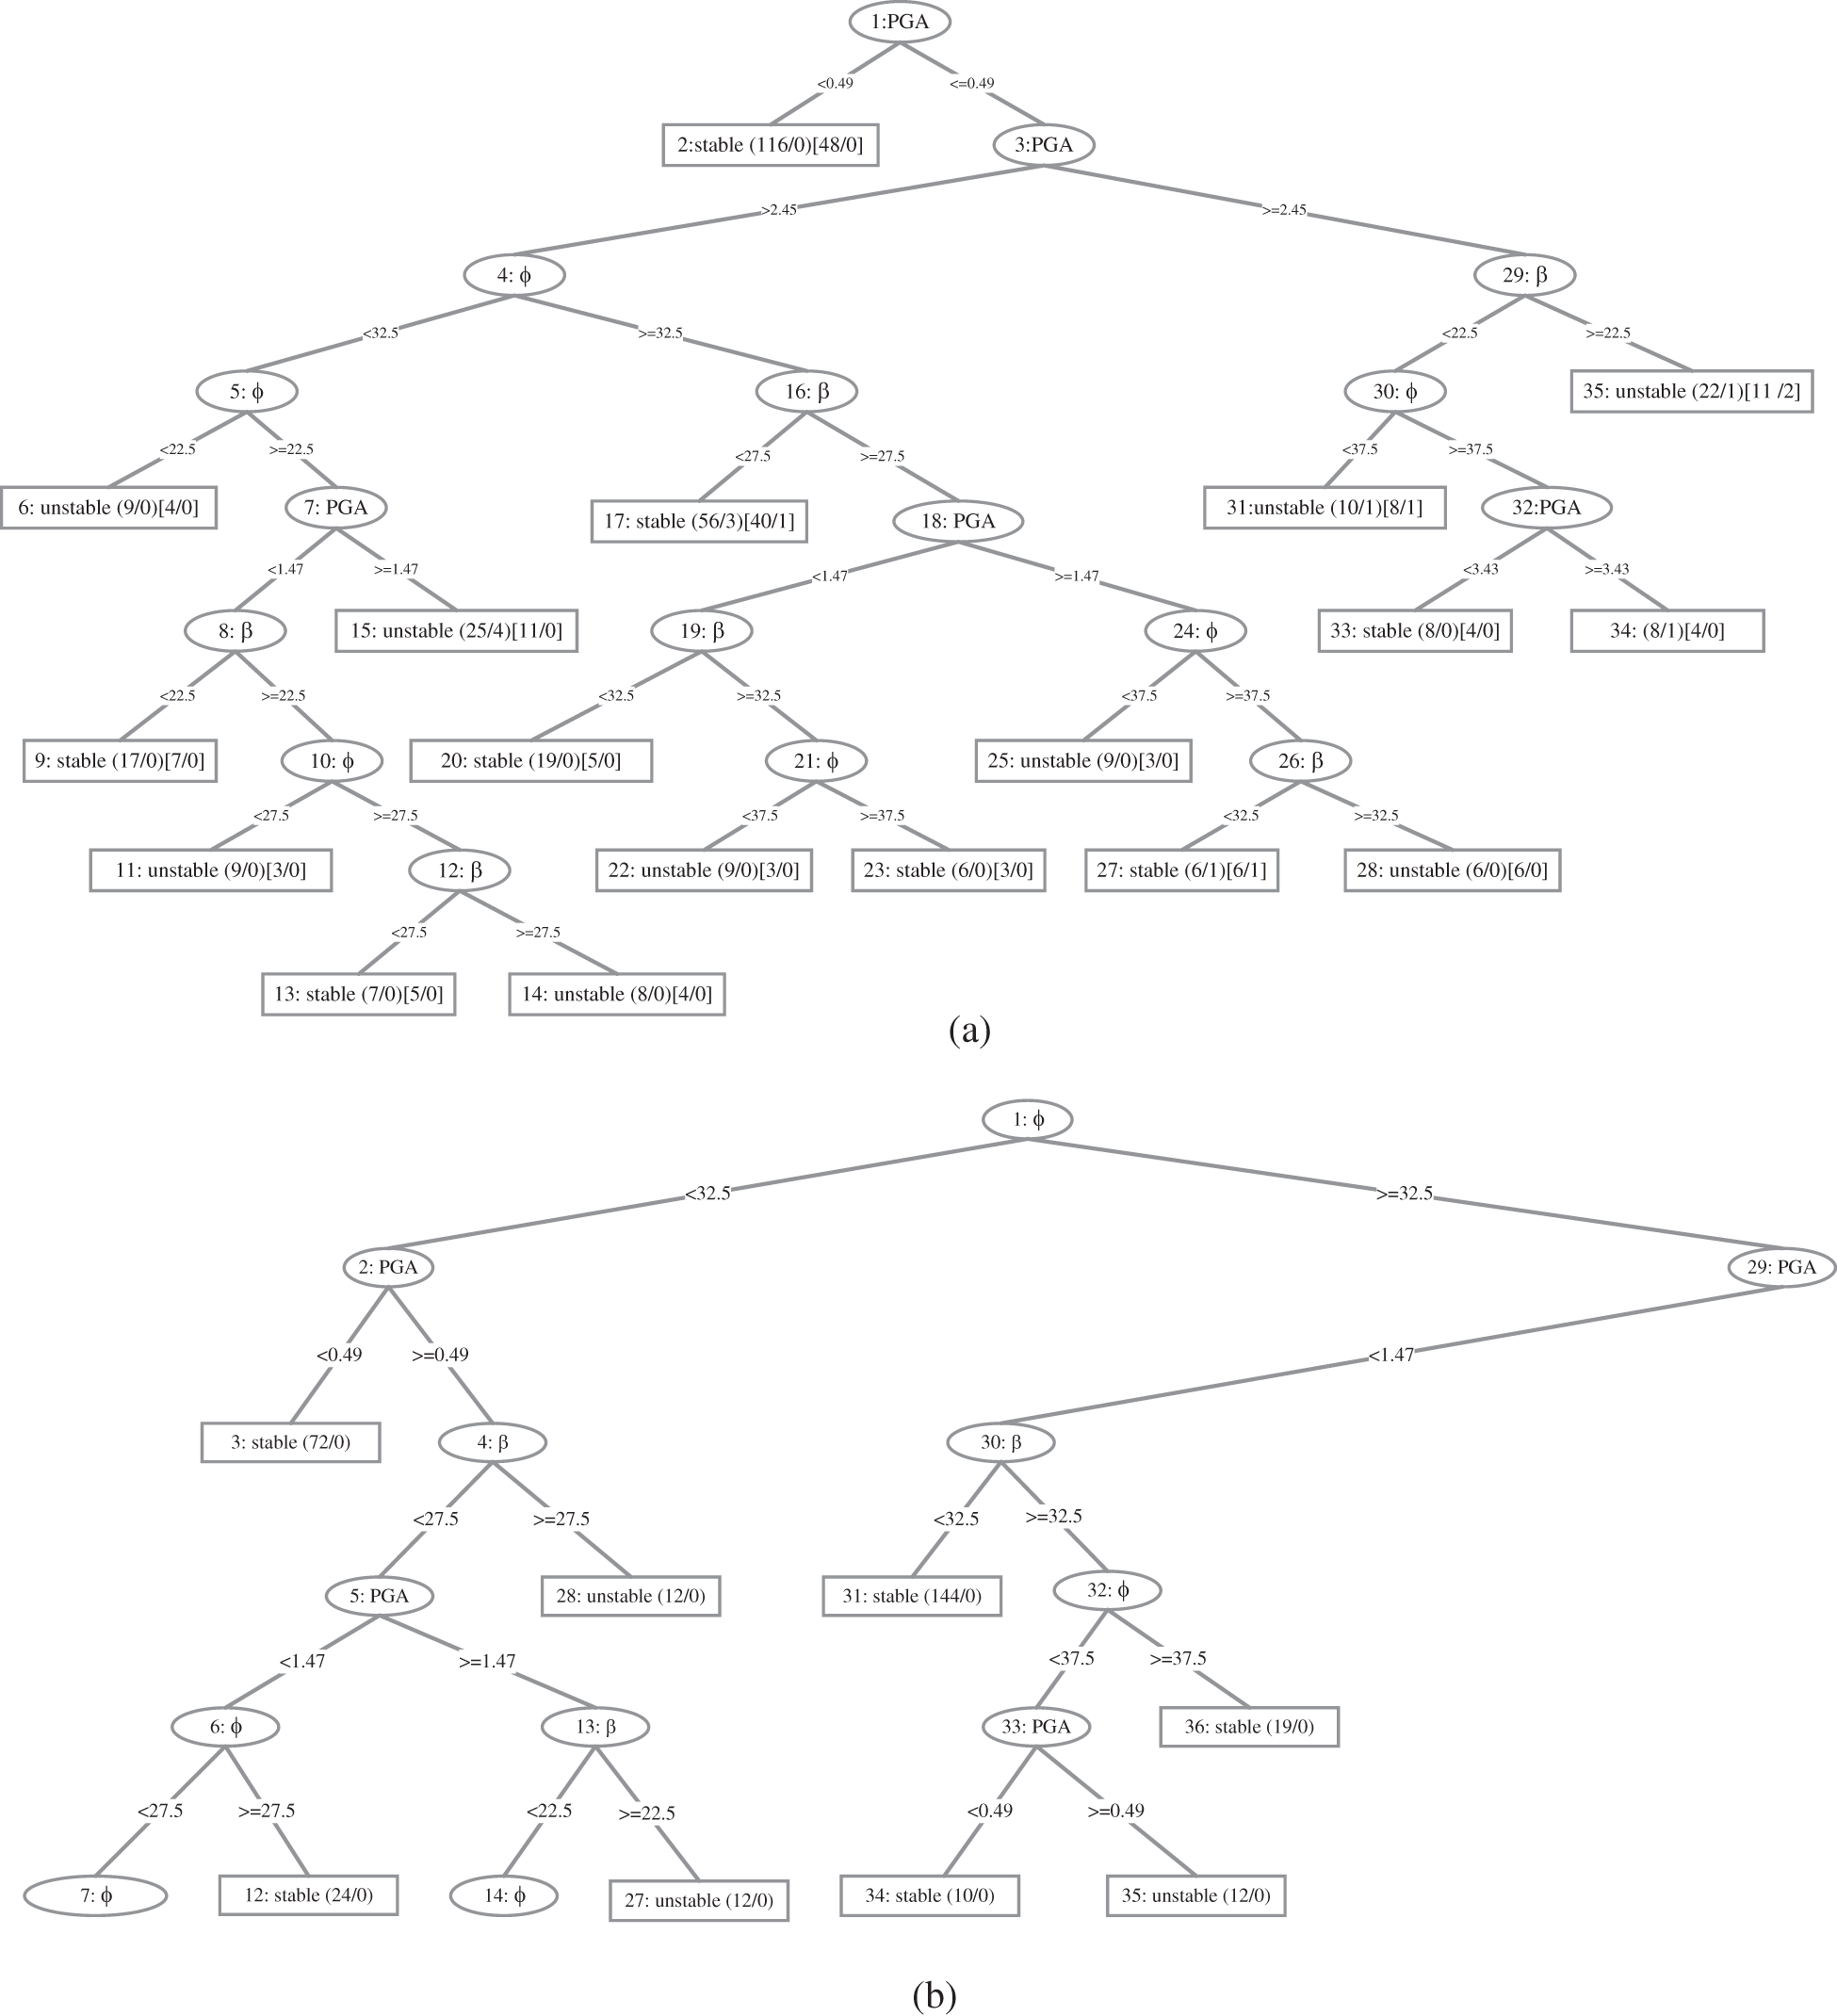
Figure 4: (a) REP tree and (b) part of RT
The performance of the models is validated using testing dataset that was not utilized during the model construction process. Validation is used to determine whether developed models may be generalized to conditions not experienced during the training phase. The results comparison of RT and REP tree models is shown in Table 5. Comparing the Acc and Mcc, the RT and REP tree models have the highest Acc and Mcc, whereas the RF model has the least value in the test phase. However, only the Acc and the Mcc cannot be used as indicators to judge the predictive performance for models. Therefore, stable and unstable classes are analyzed separately using Prec, Rec, and F-score. In the cases of stable class, the RT model has the highest Prec, and F-score comparison to the REPT model and the Rec values of RT and REP tree are at par, whereas the RF model presents the least value. Similarly, in the cases of unstable class, the RT model has the highest Rec, and F-score comparision to the REPT model and the Prec values of RT and REP tree are at par, whereas the RF model presents the least value. There are 5 and 8 unmatched prediction cases in the RT and REP tree models, respectively (see Fig. 4). In the test phase, the accuracy is 97.1429% and 95.4286%, respectively. These findings demonstrate that the developed RT and REP tree classification methods are useful and efficient in a practical point of view. Finally, the developed RT and REP tree models were compared to recently developed soft computing models in the literature to assess their accuracy. Table 5 shows the results of this comparison. Therefore, after comprehensive comparisons of the five measure indexes, the RT achieved a better prediction performance with (Acc = 97.1429%, Mcc = 0.935, F-score for stable class = 0.979 and for unstable case F-score = 0.935) succeeded by the REP tree model with (Acc = 95.4286%, Mcc = 0.896, F-score stable class = 0.967 and for unstable class F-score = 0.923) for the slope stability dataset in comparison to the AdaBoost (Acc = 93.1429%, Mcc = 0.830, F-score for stable class = 0.952 and for unstable class F-score = 0.878) and RF (Acc = 91.4286%, Mcc = 0.794, F-score = 0.939 and for unstable class F-score = 0.854) reported by Asteris et al. [55] for the test data. In general, the generalization and reliability of the developed models perform well, and a more balanced slope stability database can yield better prediction results. The primary advantage of the proposed models is a “white box” that reveals the clear relationship between input and output parameters. Consequently, using these models, the user (civil engineers) can easily compute slope stability.
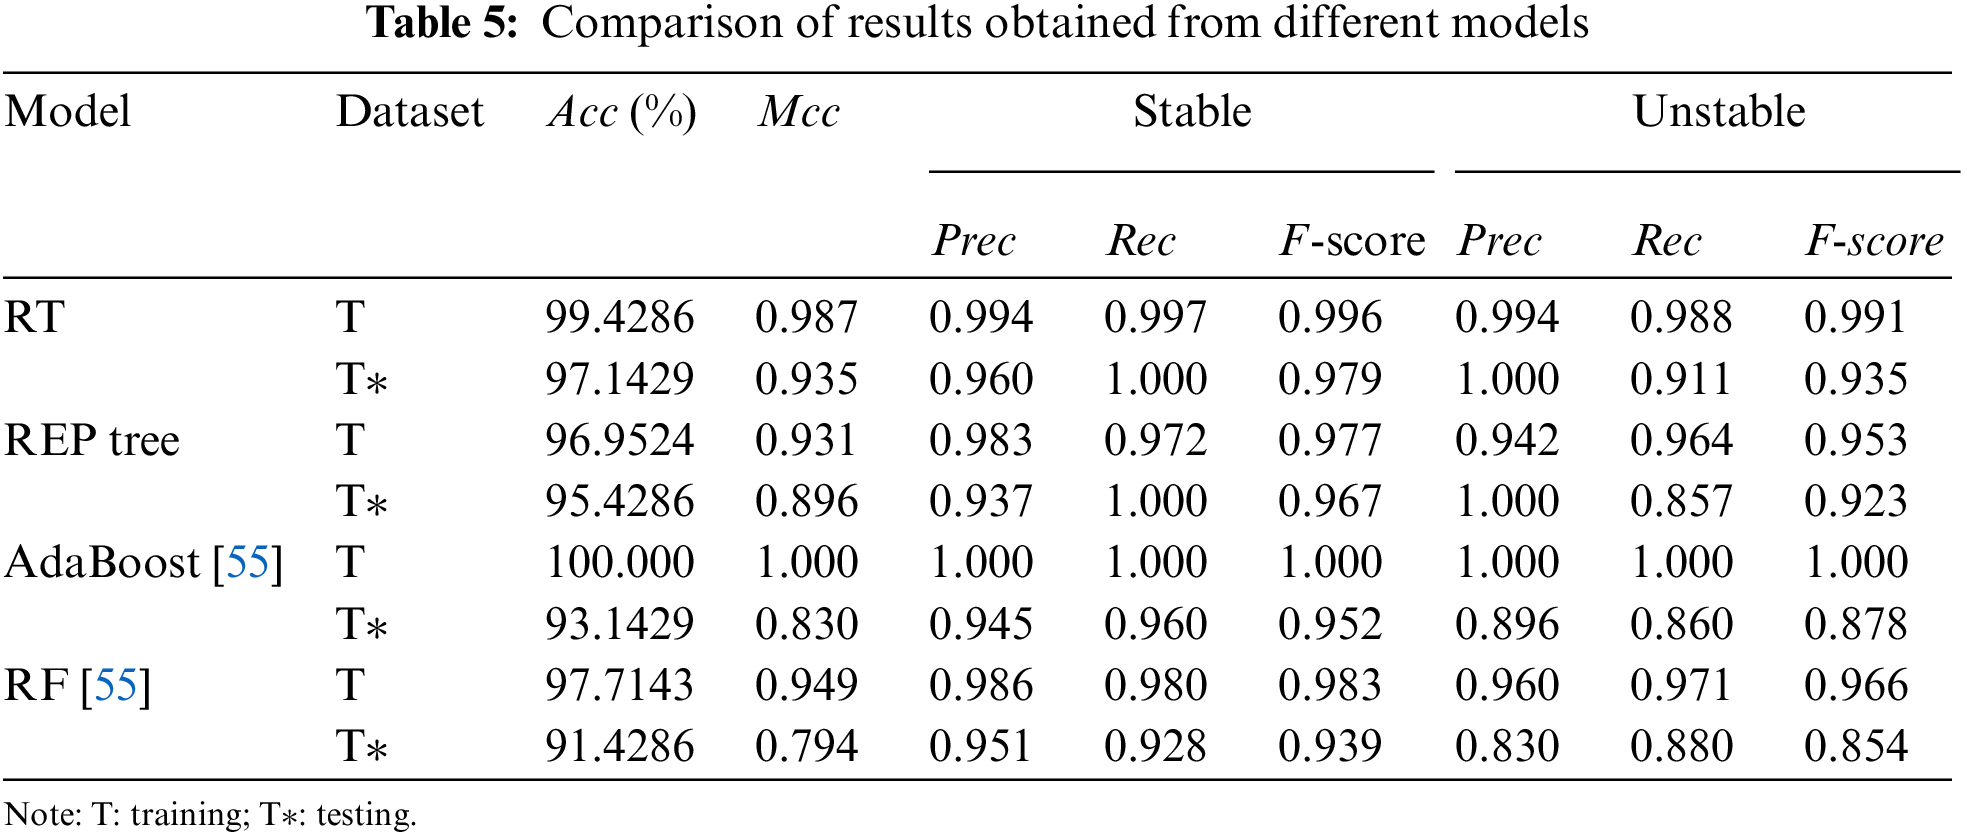
Fig. 5 compares the classification results of the RT, REP tree, AdaBoost, and RF models from the testing phase to the FoS results obtained with the GeoStudio software for a better comparison. As previously indicated, each model in the testing phase used 175 data samples, which constituted for 25% of the total data. Fig. 4 shows that the RT and REP tree techniques were able to achieve excellent results with the lowest number of unmatched cases. For RT, REP tree, AdaBoost, and RF, the matched and unmatched numbers were 170 and 5,167 and 8, 163 and 12, and 160 and 15, respectively, indicating the RT model’s superiority over the REP tree and other models reported in the literature for slope stability classification. The error rate throughout the testing phase was low, illustrating the RT model’s high performance. It was determined that the model with the best performance for slope stability classification was the RT, and that it could be utilized in this field for the same purpose of minimizing the associated risk.
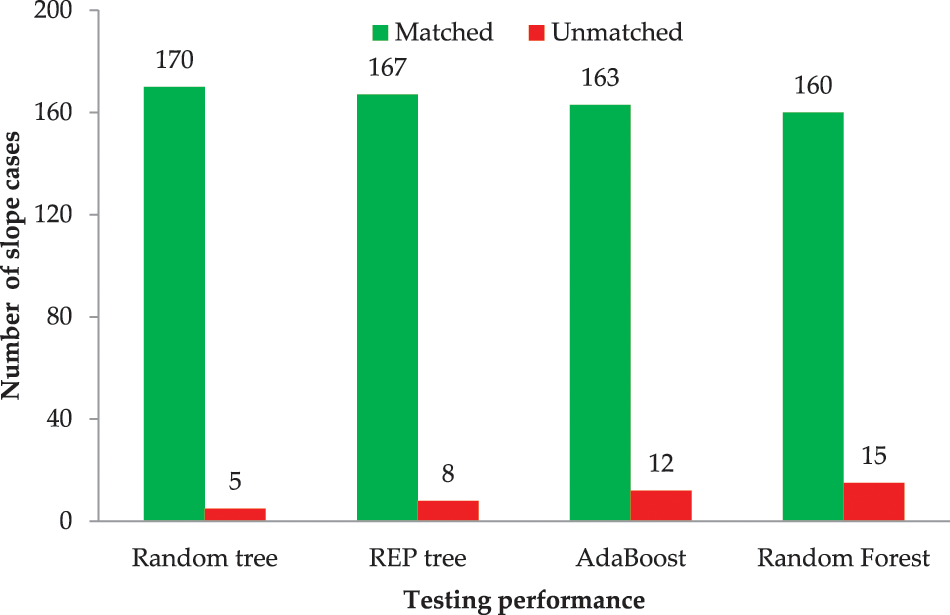
Figure 5: Comparison of results obtained from different models
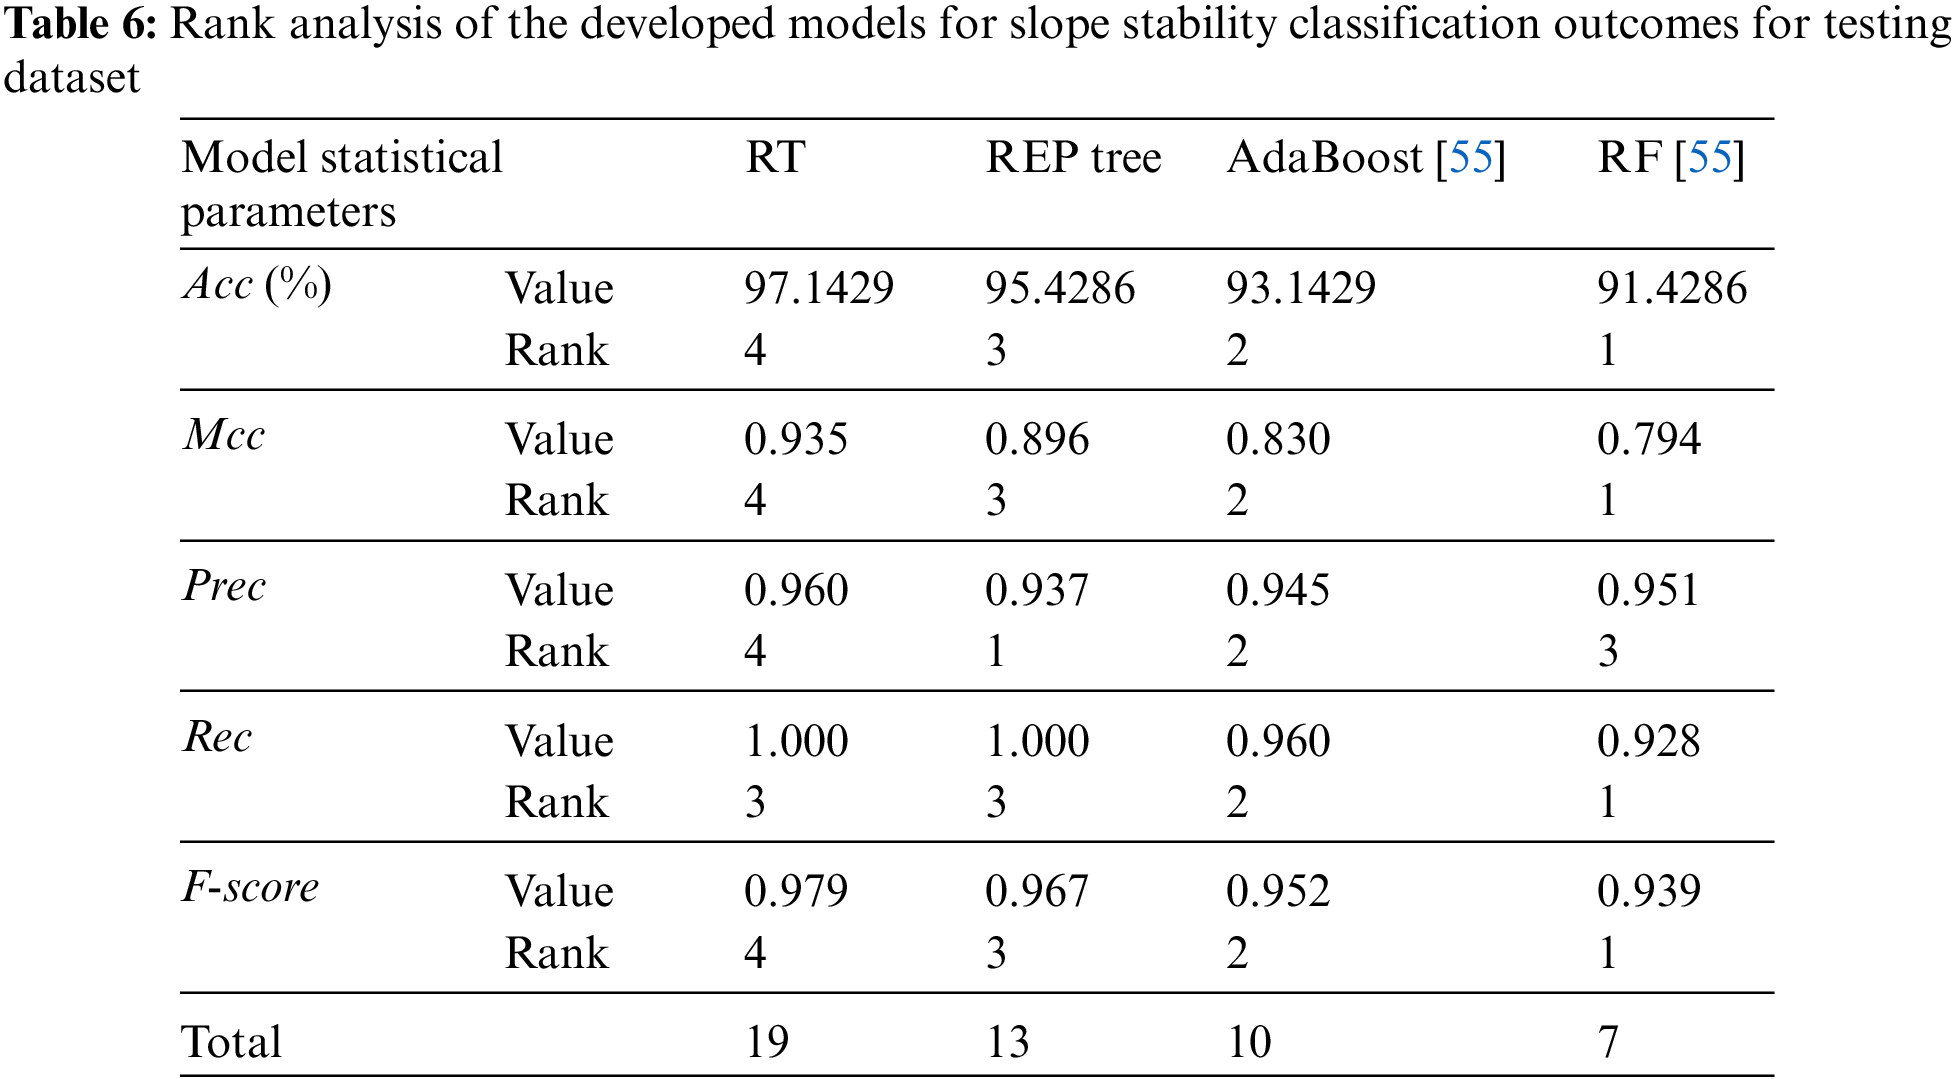
The rank analysis is the easiest and most extensively used method for evaluating and comparing the effectiveness of developed models. In this study, the statistical parameters are employed to determine the score value, with their ideal values serving as a benchmark. It is dependent on the number of models used. The best performing outcomes model receives the highest score, and vice versa. Two models with the same outcomes may have the same ranking ratings.
Table 6 compares the testing stage results obtained by the indicators: i.e., Acc, Mcc, Prec, Rec, and F-score. The score attained by RT is the highest in the testing phase (19), followed by the REP tree (13) and AdaBoost (10), and RF attains the most negligible score value in the testing phase (7). Except for the recall, RT achieved better accuracy and performance than the REP tree, AdaBoost, and RF models. It can be inferred from the rank values that the RT model has performances superior to the REP tree, AdaBoost, and RF and is the clear winner in terms of performance to the other applied models.
In this paper, a RT and REP tree models were applied to classify the stability of 700 slopes (464 stable slopes and 236 unstable slopes) under seismic conditions, which were modeled and analyzed in GeoStudio software. The variables of H, β, c, ϕ, and PGA were set as model inputs for the classification of slopes where FoS ≥ 1 and FoS < 1 were considered for stable and unstable slopes, respectively. To quantify the performance of the RT and REP tree models, accuracy, Matthews correlation coefficient, precision, recall, and F-score, performance indices were computed for both training and testing stages.
The following are the main important findings of this study:
1. The outcome of the developed models is two slope stability graphs that are very easy to use and do not require extensive training. Unlike most soft computing methods, these models explicitly indicate the relationship between input and output parameters. Based on the findings, these relationships are consistent with intuition and engineering judgment.
2. The RT and REP tree models classification accuracy in the test phase is 97.1429% and 95.4286%, respectively, demonstrating that both models are useful and efficient in practice. In addition, the Matthews correlation coefficient near to +1 indicates high values shows good agreement between actual and predicted classes.
3. Comparing models’ performance reveals that the RT model gives more accurate classifications than the REP tree model.
4. Compared to the random forest and AdaBoost models in the literature, the presented models have a better ability for prediction, and their use is facilitated by a clear graphical output.
Future research should utilize a more balanced slope stability database to evaluate the models’ reliability in predicting slope stability. Although the proposed models produce desired predictions and performed well with Acc greater than 95%, Additional rocks’ depth, soil type, and rainfall factors can all be considered in these models to improve the generalization and reliability.
Funding Statement: The work was supported by the National Key Research and Development Plan of China under Grant No. 2021YFB2600703.
Availability of Data and Materials: The authors declare that all data supporting the findings of this study are available within the article.
Conflicts of Interest: The authors declare that they have no conflicts of interest to report regarding the present study.
References
1. Sakellariou, M., Ferentinou, M. (2005). A study of slope stability prediction using neural networks. Geotechnical & Geological Engineering, 23(4), 419–445. https://doi.org/10.1007/s10706-004-8680-5 [Google Scholar] [CrossRef]
2. Duncan, J. M. (2000). Factors of safety and reliability in geotechnical engineering. Journal of Geotechnical and Geoenvironmental Engineering, 126(4), 307–316. https://doi.org/10.1061/(ASCE)1090-0241(2000)126:4(307) [Google Scholar] [CrossRef]
3. Suman, S., Khan, S., Das, S., Chand, S. (2016). Slope stability analysis using artificial intelligence techniques. Natural Hazards, 84(2), 727–748. https://doi.org/10.1007/s11069-016-2454-2 [Google Scholar] [CrossRef]
4. Thiebes, B., Bell, R., Glade, T., Jäger, S., Mayer, J. et al. (2014). Integration of a limit-equilibrium model into a landslide early warning system. Landslides, 11(5), 859–875. https://doi.org/10.1007/s10346-013-0416-2 [Google Scholar] [CrossRef]
5. Verma, D., Kainthola, A., Gupte, S., Singh, T. (2013). A finite element approach of stability analysis of internal dump slope in Wardha valley coal field, India, Maharashtra. American Journal of Mining and Metallurgy, 1(1), 1–6. [Google Scholar]
6. Cai, F., Ugai, K. (2004). Numerical analysis of rainfall effects on slope stability. International Journal of Geomechanics, 4(2), 69–78. https://doi.org/10.1061/(ASCE)1532-3641(2004)4:2(69) [Google Scholar] [CrossRef]
7. Dawson, E., Roth, W. H., Drescher, A. (1999). Slope stability analysis by strength reduction. Géoteclinique, 49(6), 835–840. https://doi.org/10.1680/geot.1999.49.6.835 [Google Scholar] [CrossRef]
8. Griffiths, D., Lane, P. (1999). Slope stability analysis by finite elements. Geotechnique, 49(3), 387–403. https://doi.org/10.1680/geot.1999.49.3.387 [Google Scholar] [CrossRef]
9. Liu, Z., Shao, J., Xu, W., Chen, H., Zhang, Y. (2014). An extreme learning machine approach for slope stability evaluation and prediction. Natural Hazards, 73(2), 787–804. https://doi.org/10.1007/s11069-014-1106-7 [Google Scholar] [CrossRef]
10. Xue, X. (2017). Prediction of slope stability based on hybrid PSO and LSSVM. Journal of Computing in Civil Engineering, 31(1), 04016041. https://doi.org/10.1061/(ASCE)CP.1943-5487.0000607 [Google Scholar] [CrossRef]
11. Bye, A., Bell, F. (2001). Stability assessment and slope design at sandsloot open pit, South Africa. International Journal of Rock Mechanics and Mining Sciences, 38(3), 449–466. https://doi.org/10.1016/S1365-1609(01)00014-4 [Google Scholar] [CrossRef]
12. Taheri, A., Tani, K. (2010). Assessment of the stability of rock slopes by the slope stability rating classification system. Rock Mechanics and Rock Engineering, 43(3), 321–333. https://doi.org/10.1007/s00603-009-0050-4 [Google Scholar] [CrossRef]
13. Chen, W. F., Baladi, G. Y. (1985). Soil plasticity: Theory and implementation. AE, Amsterdam, The Netherlands: Elsevier Science Publisher. [Google Scholar]
14. Lechman, J., Griffiths, D. (2000). Analysis of the progression of failure of earth slopes by finite elements. In: Slope stability, pp. 250–265. Denver, Colorado, USA. [Google Scholar]
15. Ahmad, M., Tang, X. W., Qiu, J. N., Gu, W. J., Ahmad, F. (2020). A hybrid approach for evaluating CPT-based seismic soil liquefaction potential using bayesian belief networks. Journal of Central South University, 27(2), 500–516. https://doi.org/10.1007/s11771-020-4312-3 [Google Scholar] [CrossRef]
16. Ahmad, M., Tang, X. W., Qiu, J. N., Ahmad, F. (2019). Evaluating seismic soil liquefaction potential using Bayesian belief network and C4.5 decision tree approaches. Applied Sciences, 9(20), 4226. https://doi.org/10.3390/app9204226 [Google Scholar] [CrossRef]
17. Ahmad, M., Tang, X., Qiu, J., Ahmad, F., Gu, W. (2019). LLDV-A comprehensive framework for assessing the effects of liquefaction land damage potential. 2019 IEEE 14th International Conference on Intelligent Systems and Knowledge Engineering (ISKE), pp. 527–533. Dalian, China, IEEE. [Google Scholar]
18. Ahmad, M., Tang, X. W., Qiu, J. N., Ahmad, F., Gu, W. J. (2020). A step forward towards a comprehensive framework for assessing liquefaction land damage vulnerability: Exploration from historical data. Frontiers of Structural and Civil Engineering, 14(6), 1476–1491. https://doi.org/10.1007/s11709-020-0670-z [Google Scholar] [CrossRef]
19. Ahmad, M., Tang, X., Ahmad, F. (2020). Evaluation of liquefaction-induced settlement using random forest and REP tree models: Taking Pohang earthquake as a case of illustration. In: Natural hazards-impacts, adjustments & resilience. London, UK: IntechOpen. [Google Scholar]
20. Ahmad, M., Al-Shayea, N. A., Tang, X. W., Jamal, A., M Al-Ahmadi, H. et al. (2020). Predicting the pillar stability of underground mines with random trees and C4.5 decision trees. Applied Sciences, 10(18), 6486. https://doi.org/10.3390/app10186486 [Google Scholar] [CrossRef]
21. Ahmad, M., Kamiński, P., Olczak, P., Alam, M., Iqbal, M. J. et al. (2021). Development of prediction models for shear strength of rockfill material using machine learning techniques. Applied Sciences, 11(13), 6167. https://doi.org/10.3390/app11136167 [Google Scholar] [CrossRef]
22. Noori, A. M., Mikaeil, R., Mokhtarian, M., Haghshenas, S. S., Foroughi, M. (2020). Feasibility of intelligent models for prediction of utilization factor of TBM. Geotechnical and Geological Engineering, 38(3), 3125–3143. https://doi.org/10.1007/s10706-020-01213-9 [Google Scholar] [CrossRef]
23. Dormishi, A., Ataei, M., Mikaeil, R., Khalokakaei, R., Haghshenas, S. S. (2019). Evaluation of gang saws’ performance in the carbonate rock cutting process using feasibility of intelligent approaches. Engineering Science and Technology, an International Journal, 22(3), 990–1000. https://doi.org/10.1016/j.jestch.2019.01.007 [Google Scholar] [CrossRef]
24. Mikaeil, R., Haghshenas, S. S., Hoseinie, S. H. (2018). Rock penetrability classification using artificial bee colony (ABC) algorithm and self-organizing map. Geotechnical and Geological Engineering, 36(2), 1309–1318. [Google Scholar]
25. Mikaeil, R., Haghshenas, S. S., Ozcelik, Y., Gharehgheshlagh, H. H. (2018). Performance evaluation of adaptive neuro-fuzzy inference system and group method of data handling-type neural network for estimating wear rate of diamond wire saw. Geotechnical and Geological Engineering, 36(6), 3779–3791. https://doi.org/10.1007/s10706-018-0571-2 [Google Scholar] [CrossRef]
26. Momeni, E., Nazir, R., Armaghani, D. J., Maizir, H. (2014). Prediction of pile bearing capacity using a hybrid genetic algorithm-based ANN. Measurement, 57, 122–131. https://doi.org/10.1016/j.measurement.2014.08.007 [Google Scholar] [CrossRef]
27. Xie, C., Nguyen, H., Choi, Y., Armaghani, D. J. (2022). Optimized functional linked neural network for predicting diaphragm wall deflection induced by braced excavations in clays. Geoscience Frontiers, 13(2), 101313. https://doi.org/10.1016/j.gsf.2021.101313 [Google Scholar] [CrossRef]
28. Armaghani, D. J., Mohamad, E. T., Narayanasamy, M. S., Narita, N., Yagiz, S. (2017). Development of hybrid intelligent models for predicting TBM penetration rate in hard rock condition. Tunnelling and Underground Space Technology, 63, 29–43. https://doi.org/10.1016/j.tust.2016.12.009 [Google Scholar] [CrossRef]
29. Yan, T., Shen, S. L., Zhou, A. (2023). Identification of geological characteristics from construction parameters during shield tunnelling. Acta Geotechnica, 18(1), 535–551. https://doi.org/10.1007/s11440-022-01590-w [Google Scholar] [CrossRef]
30. Amjad, M., Ahmad, I., Ahmad, M., Wróblewski, P., Kamiński, P. et al. (2022). Prediction of pile bearing capacity using XGBoost algorithm: Modeling and performance evaluation. Applied Sciences, 12(4), 2126. https://doi.org/10.3390/app12042126 [Google Scholar] [CrossRef]
31. Ahmad, M., Al-Mansob, R. A., Kashyzadeh, K. R., Keawsawasvong, S., Sabri Sabri, M. M. et al. (2022). Extreme gradient boosting algorithm for predicting shear strengths of rockfill materials. Complexity, 2022, 9415863. https://doi.org/10.1155/2022/9415863 [Google Scholar] [CrossRef]
32. Hasanipanah, M., Jamei, M., Mohammed, A. S., Amar, M. N., Hocine, O. et al. (2022). Intelligent prediction of rock mass deformation modulus through three optimized cascaded forward neural network models. Earth Science Informatics, 15(3), 1659–1669. https://doi.org/10.1007/s12145-022-00823-6 [Google Scholar] [CrossRef]
33. Hasanipanah, M., Monjezi, M., Shahnazar, A., Armaghani, D. J., Farazmand, A. (2015). Feasibility of indirect determination of blast induced ground vibration based on support vector machine. Measurement, 75, 289–297. https://doi.org/10.1016/j.measurement.2015.07.019 [Google Scholar] [CrossRef]
34. Koopialipoor, M., Jahed Armaghani, D., Hedayat, A., Marto, A., Gordan, B. (2019). Applying various hybrid intelligent systems to evaluate and predict slope stability under static and dynamic conditions. Soft Computing, 23(14), 5913–5929. https://doi.org/10.1007/s00500-018-3253-3 [Google Scholar] [CrossRef]
35. Mahdiyar, A., Hasanipanah, M., Armaghani, D. J., Gordan, B., Abdullah, A. et al. (2017). A monte carlo technique in safety assessment of slope under seismic condition. Engineering with Computers, 33(4), 807–817. https://doi.org/10.1007/s00366-016-0499-1 [Google Scholar] [CrossRef]
36. Gordan, B., Jahed Armaghani, D., Hajihassani, M., Monjezi, M. (2016). Prediction of seismic slope stability through combination of particle swarm optimization and neural network. Engineering with Computers, 32(1), 85–97. https://doi.org/10.1007/s00366-015-0400-7 [Google Scholar] [CrossRef]
37. Alimohammadlou, Y., Najafi, A., Gokceoglu, C. (2014). Estimation of rainfall-induced landslides using ANN and fuzzy clustering methods: A case study in saeen slope, Azerbaijan Province, Iran. Catena, 120, 149–162. https://doi.org/10.1016/j.catena.2014.04.009 [Google Scholar] [CrossRef]
38. Erzin, Y., Cetin, T. (2013). The prediction of the critical factor of safety of homogeneous finite slopes using neural networks and multiple regressions. Computers & Geosciences, 51, 305–313. https://doi.org/10.1016/j.cageo.2012.09.003 [Google Scholar] [CrossRef]
39. Samui, P., Bhattacharya, G., Das, S. K. (2008). Support vector machine and relevance vector machine classifier in analysis of slopes. In: International association for computer methods and advances in geomechanics (IACMAG), pp. 1–6. Goa, India. [Google Scholar]
40. Feng, X. T. (2000). Introduction of intelligent rock mechanics. In: Science. Beijing, China: Science Press. [Google Scholar]
41. Lu, P., Rosenbaum, M. (2003). Artificial neural networks and grey systems for the prediction of slope stability. Natural Hazards, 30(3), 383–398. https://doi.org/10.1023/B:NHAZ.0000007168.00673.27 [Google Scholar] [CrossRef]
42. Li, X. (2004). Comparative studies of artificial neural networks and adaptive neuro-fuzzy inference system based approach for the circular sliding slopes stability analysis (Doctoral Dissertation). University of South China. [Google Scholar]
43. Huang, Z. Q., Cui, J., Liu, H. (2004). Chaotic neural network method for slope stability prediction. Chinese Journal of Rock Mechanics and Engineering, 22, 015. [Google Scholar]
44. Wang, H., Xu, W., Xu, R. (2005). Slope stability evaluation using back propagation neural networks. Engineering Geology, 80(3–4), 302–315. https://doi.org/10.1016/j.enggeo.2005.06.005 [Google Scholar] [CrossRef]
45. Samui, P. (2008). Slope stability analysis: A support vector machine approach. Environmental Geology, 56(2), 255–267. https://doi.org/10.1007/s00254-007-1161-4 [Google Scholar] [CrossRef]
46. Zhao, H. B. (2008). Slope reliability analysis using a support vector machine. Computers and Geotechnics, 35(3), 459–467. https://doi.org/10.1016/j.compgeo.2007.08.002 [Google Scholar] [CrossRef]
47. Choobbasti, A., Farrokhzad, F., Barari, A. (2009). Prediction of slope stability using artificial neural network (case study: Noabad, Mazandaran, Iran). Arabian Journal of Geosciences, 2(4), 311–319. https://doi.org/10.1007/s12517-009-0035-3 [Google Scholar] [CrossRef]
48. Das, S. K., Biswal, R. K., Sivakugan, N., Das, B. (2011). Classification of slopes and prediction of factor of safety using differential evolution neural networks. Environmental Earth Sciences, 64(1), 201–210. https://doi.org/10.1007/s12665-010-0839-1 [Google Scholar] [CrossRef]
49. Hoang, N. D., Pham, A. D. (2016). Hybrid artificial intelligence approach based on metaheuristic and machine learning for slope stability assessment: A multinational data analysis. Expert Systems with Applications, 46, 60–68. https://doi.org/10.1016/j.eswa.2015.10.020 [Google Scholar] [CrossRef]
50. Verma, A., Singh, T., Chauhan, N. K., Sarkar, K. (2016). A hybrid FEM–ANN approach for slope instability prediction. Journal of the Institution of Engineers (IndiaSeries A, 97(3), 171–180. https://doi.org/10.1007/s40030-016-0168-9 [Google Scholar] [CrossRef]
51. Rukhaiyar, S., Alam, M., Samadhiya, N. K. (2018). A PSO-ANN hybrid model for predicting factor of safety of slope. International Journal of Geotechnical Engineering, 12(6), 556–566. [Google Scholar]
52. Feng, X., Li, S., Yuan, C., Zeng, P., Sun, Y. (2018). Prediction of slope stability using naive Bayes classifier. KSCE Journal of Civil Engineering, 22(3), 941–950. https://doi.org/10.1007/s12205-018-1337-3 [Google Scholar] [CrossRef]
53. Zhou, J., Li, E., Yang, S., Wang, M., Shi, X. et al. (2019). Slope stability prediction for circular mode failure using gradient boosting machine approach based on an updated database of case histories. Safety Science, 118, 505–518. https://doi.org/10.1016/j.ssci.2019.05.046 [Google Scholar] [CrossRef]
54. Ahmad, F., Tang, X. W., Qiu, J. N., Wróblewski, P., Ahmad, M. et al. (2022). Prediction of slope stability using tree augmented naive-bayes classifier: Modeling and performance evaluation. Mathematical Biosciences and Engineering, 19, 4526–4546. https://doi.org/10.3934/mbe.2022209 [Google Scholar] [PubMed] [CrossRef]
55. Asteris, P. G., Rizal, F. I. M., Koopialipoor, M., Roussis, P. C., Ferentinou, M. et al. (2012). Slope stability classification under seismic conditions using several tree-based intelligent techniques. Applied Sciences, 12(3), 1753. https://doi.org/10.3390/app12031753 [Google Scholar] [CrossRef]
56. Kiranmai, S. A., Laxmi, A. J. (2018). Data mining for classification of power quality problems using WEKA and the effect of attributes on classification accuracy. Protection and Control of Modern Power Systems, 3(1), 29. https://doi.org/10.1186/s41601-018-0103-3 [Google Scholar] [CrossRef]
57. Kramer, S. (1996). Geotechnical earthquake engineering, New Jersey: Prentice Hall Upper Saddle River. [Google Scholar]
58. Kalmegh, S., (2015). Analysis of weka data mining algorithm reptree, simple cart and randomtree for classification of Indian news. International Journal of Innovative Science, Engineering & Technology, 2(2), 438–446. [Google Scholar]
59. Hamsagayathri, P., Sampath, P. (2017). Performance analysis of breast cancer classification using decision tree classifiers. International Journal of Current Pharmaceutical Research, 9(2), 19–25. https://doi.org/10.22159/ijcpr.2017v9i2.17383 [Google Scholar] [CrossRef]
60. Witten, I., Frank, E., Hall, M. (2011). Data mining: Practical machine learning tools and techniques, 3rd edition. San Francisco: Morgan Kaufmann. [Google Scholar]
61. Kurup, P. U., Dudani, N. K. (2002). Neural networks for profiling stress history of clays from PCPT data. Journal of Geotechnical and Geoenvironmental Engineering, 128(7), 569–579. https://doi.org/10.1061/(ASCE)1090-0241(2002)128:7(569) [Google Scholar] [CrossRef]
62. Tang, Y., Zhang, Y. Q., Huang, Z., Hu, X. (2005). Granular SVM-RFE gene selection algorithm for reliable prostate cancer classification on microarray expression data. Fifth IEEE Symposium on Bioinformatics and Bioengineering (BIBE’05), Minneapolis, Minnesota, IEEE. [Google Scholar]
63. Padmini, D., Ilamparuthi, K., Sudheer, K. (2008). Ultimate bearing capacity prediction of shallow foundations on cohesionless soils using neurofuzzy models. Computers and Geotechnics, 35(1), 33–46. https://doi.org/10.1016/j.compgeo.2007.03.001 [Google Scholar] [CrossRef]
64. Witten, I. H., Frank, E., Hall, M. (2005). Data mining: Practical machine learning tools and techniques. San Francisco: Morgen Kaufmann. [Google Scholar]
Appendix A

Cite This Article
 Copyright © 2023 The Author(s). Published by Tech Science Press.
This work is licensed under a Creative Commons Attribution 4.0 International License , which permits unrestricted use, distribution, and reproduction in any medium, provided the original work is properly cited.
 Downloads
 Citation Tools