
 Submit a Paper
 Propose a Special lssue
 Open Access
ARTICLE

Photovoltaic Cell Panels Soiling Inspection Using Principal Component Thermal Image Processing
1 Arasu Engineering College, Kumbakonam, Tamilnadu, 612501, India
2 St. Joseph’s College of Engineering, Chennai, Tamilnadu, 600119, India
* Corresponding Author: A. Sriram. Email:
Computer Systems Science and Engineering 2023, 45(3), 2761-2772. https://doi.org/10.32604/csse.2023.028559
Received 12 February 2022; Accepted 17 June 2022; Issue published 21 December 2022
 View Full Text
 Download PDF
Abstract
Intended for good productivity and perfect operation of the solar power grid a failure-free system is required. Therefore, thermal image processing with the thermal camera is the latest non-invasive (without manual contact) type fault identification technique which may give good precision in all aspects. The soiling issue, which is major productivity affecting factor may import from several reasons such as dust on the wind, bird mucks, etc. The efficient power production sufferers due to accumulated soil deposits reaching from 1%–7% in the county, such as India, to more than 25% in middle-east countries country, such as Dubai, Kuwait, etc. This research offers a solar panel soiling detection system built on thermal imaging which powers the inspection method and mitigates the requirement for physical panel inspection in a large solar production place. Hence, in this method, solar panels can be verified by working without disturbing production operation and it will save time and price of recognition. India ranks 3rd worldwide in the usage use age of Photovoltaic (PV) panels now and it is supported about 8.6% of the Nation’s electricity need in the year 2020. In the meantime, the installed PV production areas in India are aged 4–5 years old. Hence the need for inspection and maintenance of installed PV is growing fast day by day. As a result, this research focuses on finding the soiling hotspot exactly of the working solar panels with the help of Principal Components Thermal Analysis (PCTA) on MATLAB Environment.Keywords
In the real world, all the countries are not only facing challenges in producing conventional energy sources like fossil fuels, coal, petroleum, etc. but also facing challenges in producing renewable energy sources like solar, wind, tidal and etc. The sun can radiate up to 1017 Watts of electrical power per square meter area to the earth. This 1017-watt electrical power may be obtained within one hour time by using a PV panel, the whole world’s annual power needs are about 22.3 trillion kilowatt-hours only. Undoubtedly, the greater part of the solar energy falls into the oceans, but still, massive land areas are available to generate the power source. Nowadays the electrical power production industries are using solar PV panels-based power grids for power production with greenhouse gases-free technology. This solar PV panel has various faults like imperfect [1] bypass diodes lead to short circuits, [2] soiling due to moisture; dirt & birds droppings, broken PV cells or cracking in the glasses [3], failed modules, shading or light sources are varied, uneven panels with different capacity and loose connection and electric wiring fault.
Here all PV panel fault has some appropriate fault inspecting technology except for one issue which is the PV panel soiling issue. PV panel Soiling issues possess from the failure in power production resulting from snowfall, mud, dirt, and another particle that may cover the surface area of the PV panel. Dirt is a thin layer that will cover the surface of the whole solar array, and the representative dirt particles are lower than 10 μm in diameter in size but it may depend upon the place and the environment. Basically, Dirt’s formed from many sources such as greenhouse gasses by wind, pedestrian volcanic eruption, and automotive vehicle movements along with many other sources. The accumulating dust over a period of time aggravates the soiling issues. In fact, the quantity of accumulated dirt particles on the surface of the solar PV module affects the overall energy generation on a daily, monthly, seasonal, and yearly basis.
The PV soiling inspection needs a technique that is of essential thing for solar power generation plants to reach sophisticated power generation capability and it will increase PV panel lifetime also. So, it prefers the thermal image processing technique which is suitable for finding the soiling issue. The various types of thermal image processing [4,5] techniques are Differential absolute contrast (DAC), Interpolated differential absolute contrast (IDAC), Skewness & kurtosis [6], Matched filters, Principal component thermography (PCT), [7] Thermal signal reconstruction (TSR) with derivatives, multi-scaleretinex enhancement, Markov error contrast, Thermal harmonic distortion and dynamic thermal topography [8].
The PCTA is used to convert a sequence of infrared images into a set of major components [9]. Then by keeping the lower principal components and ignoring the upper principal components, the test results can be obtained quickly. PCTA has been shown to effectively reduce non-destructive evaluation data from thermal imaging. Although PCTA is a reliable technique for improving the visibility of defects in thermal data, when applied to large data sets typically used in thermal imaging, the amount of computation is large and time-consuming [10]. is an effective method used for the investigation of the active thermal image, such as the evaluation of average temperatures from physically or automatically chosen regions of interest that are undeveloped and it will supply very limited things near temperature dynamics? This Principal component analysis [7] (PCA) method was applied to thermal image data gathered from the PV grid to identify high layer soiling sources with the help of changes in a thermal image temperature gradient. The PCT analysis used on a dynamic thermal imaging platform can be used to find the malfunctions or faults in the solar PV panels due to soiling effortlessly [11]. This method of inspection can provide a clear understanding of the PV panel soiling issue.
The mathematical logic behind PCTA can be considered an unsupervised learning problem. The entire process of obtaining principal components from the original data set can be simplified into six parts: 1 [12]. Take the entire dataset made up of d + 1 dimensions and ignore the labels, so that our new dataset becomes d-dimensional. 2. Find the average of each dimension for the entire data set. 3. Calculate the covariance matrix for the entire data set. 4. Find the eigenvector and the corresponding Eigenvalue [13]. 5. Sort the eigenvectors by reducing the Eigenvalues, and select the k eigenvectors with the largest Eigenvalues to form a dimensioned matrix d × k W. 6. Use this eigenvector matrix d × k to transform the samples into a new subspace.
2 Features of IR Thermography Measurements:
They are three major classes of IR (Infrared rays) thermography measurements: procedural, technical, and environmental. The primary concern is the [14] Un-manned Arial vehicle has done this inspection but those accuracy levels are very less and can reduce the fault problem by means of cleaning the panel rapidly. In addition, it concerns the Infra-red camera (technological conditions and adjustment), the emissivity just from the separation of the article continuously assessed. The 3rd identified with the help of surrounding meteorological data (temperature, dampness, downpour, wind, and sun-oriented irradiance). IR thermography has numerous points of interest, for example, non-demolition, non-contact, quick information securing, and huge scope use on PV plants at the greatest force creation state. Utilized warm cameras can be conveyed by an administrator who assesses physically every module, fixed at a static help or mounted thermal camcorder. Some current deformities can be distinguished relying upon the shape and the area of their warm examples. For instance, a whole module hotter than others demonstrates that it is open-circuited. On the size of a module, an interwoven example shows that the entire module is short-circuited. One cell obviously hotter than the others demonstrates a shadowing impact, an inadequate or delaminated cell.
Here Infrared radiation index is used as the quantitative index value. When an infrared thermal imager is used to record the surface temperature, the basic law of infrared radiation index is followed. The Stephen Boltzmann law is shown in the following formula: J* = βsbT4
According to the above analysis, if there is a problem, heat conduction and infrared radiation will both be affected, which is reflected in the data recorded by the thermal camera. By relying on anomalous temperature information, we can detect faults and assess the health of PV cells and modules. Thermal imaging only provides a qualitative diagnosis of the PV module’s health and may require specialized knowledge to do so correctly. The crystalline silicon photovoltaic cell acts as a light-emitting diode, where the semiconductor has an emission spectrum in the IR region (≈1000–1200 nm, and the peak, corresponding to the band gap, is 1150 nm) and is not located in the visible region. The emitted photons are detected only by a sensitive thermal camera. In this case, the image of the PV module is obtained by inducing current to flow through it in the opposite direction. The module image is then captured. The EL (Electric Logs) test begins with the application of forwarding bias to a low-radiation PV generator (R < 100 W/m2).
• IR cameras with adequate specifications are expensive.
• In the case of large power plants, a manual IRT inspection requires too much time and is expensive; thus, the use of an IR camera could be necessary.
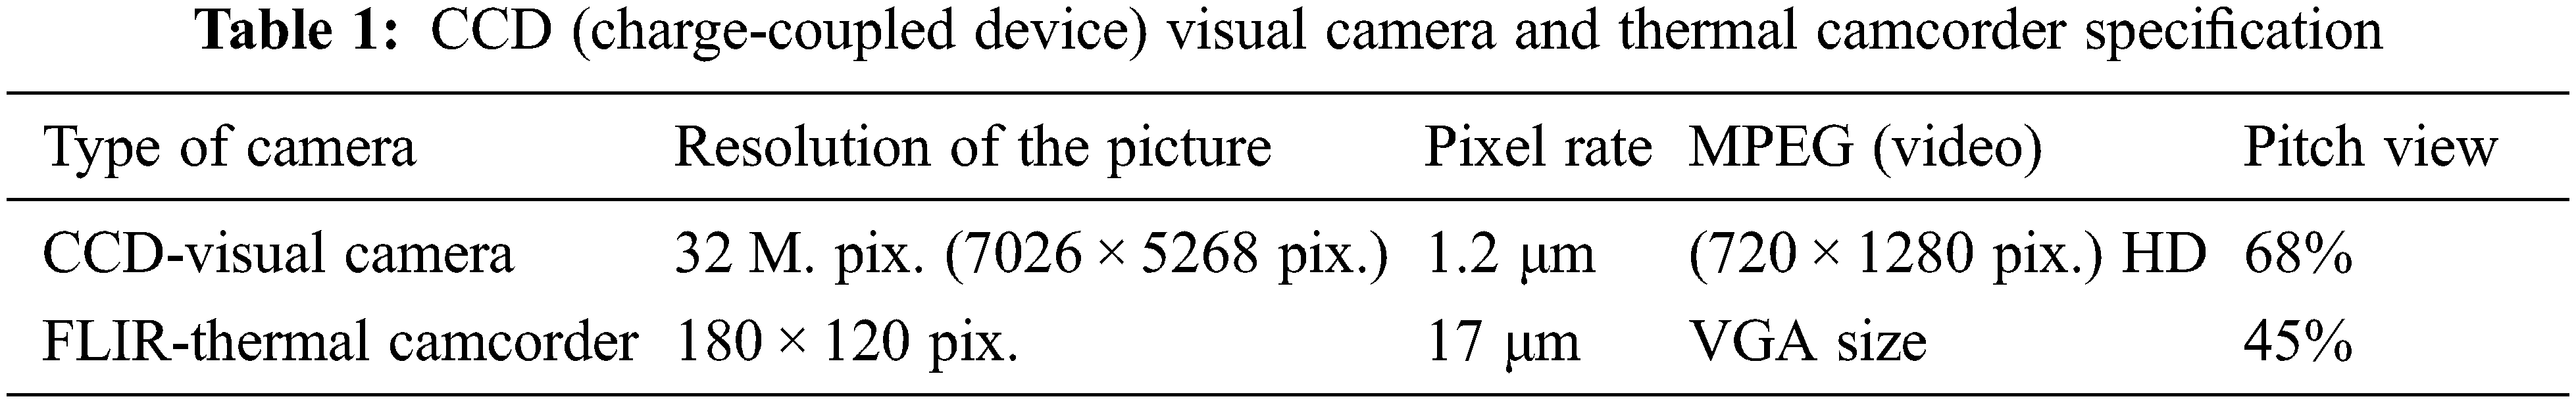
A hotter piece of a cell shows the nearness of breaks. Sharp warming shows a mostly shadowed zone because of a flying creature dropping for instance. Tab. 1 shows clearly the technical specifications of both the cameras and details are tabulated below.
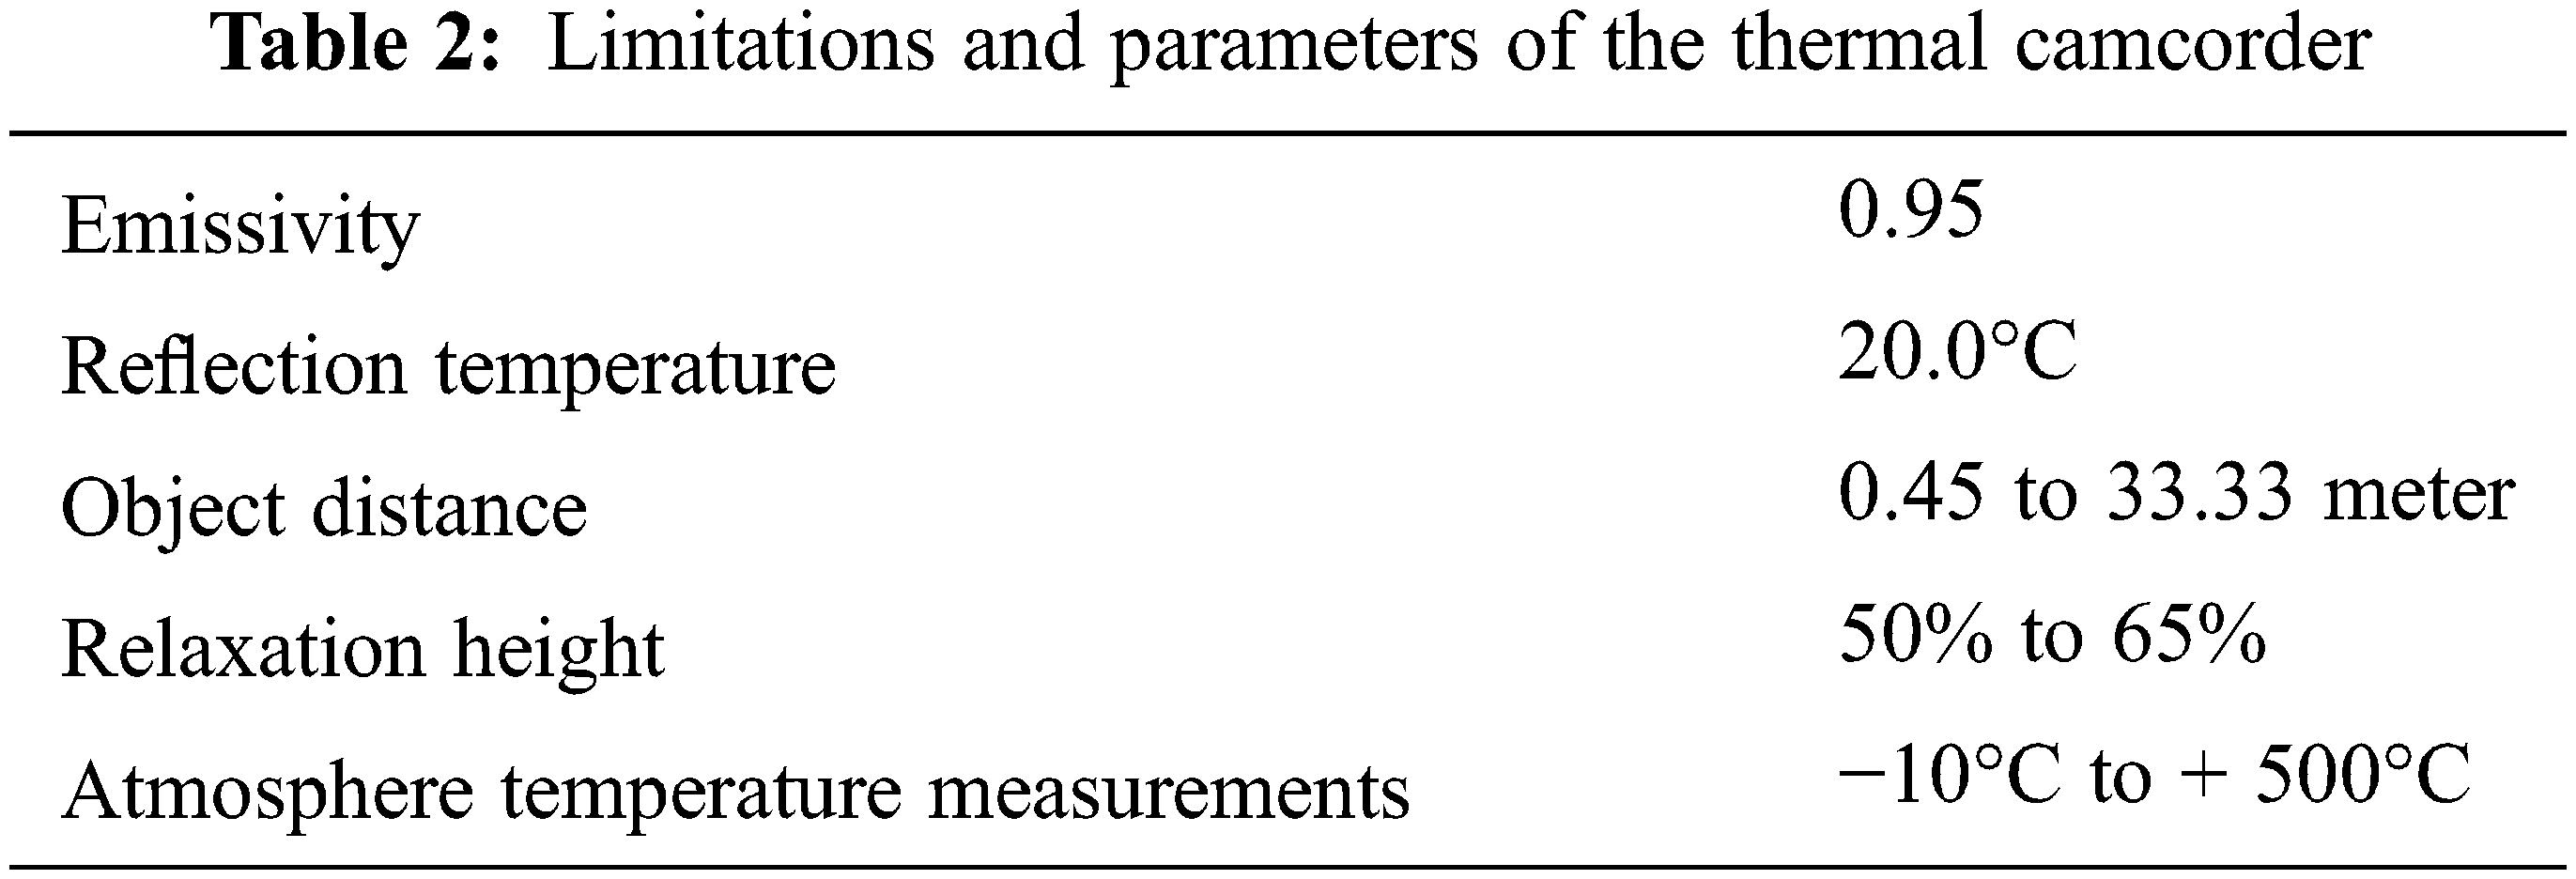
Tab. 2 states that technological stacks are a more important thing before going to installation in the field. Because it should be economically, good, or financially good as well as more importantly it should fill our inspection needs, and finally it should provide high precision during the time of calibration cum diagnosis.
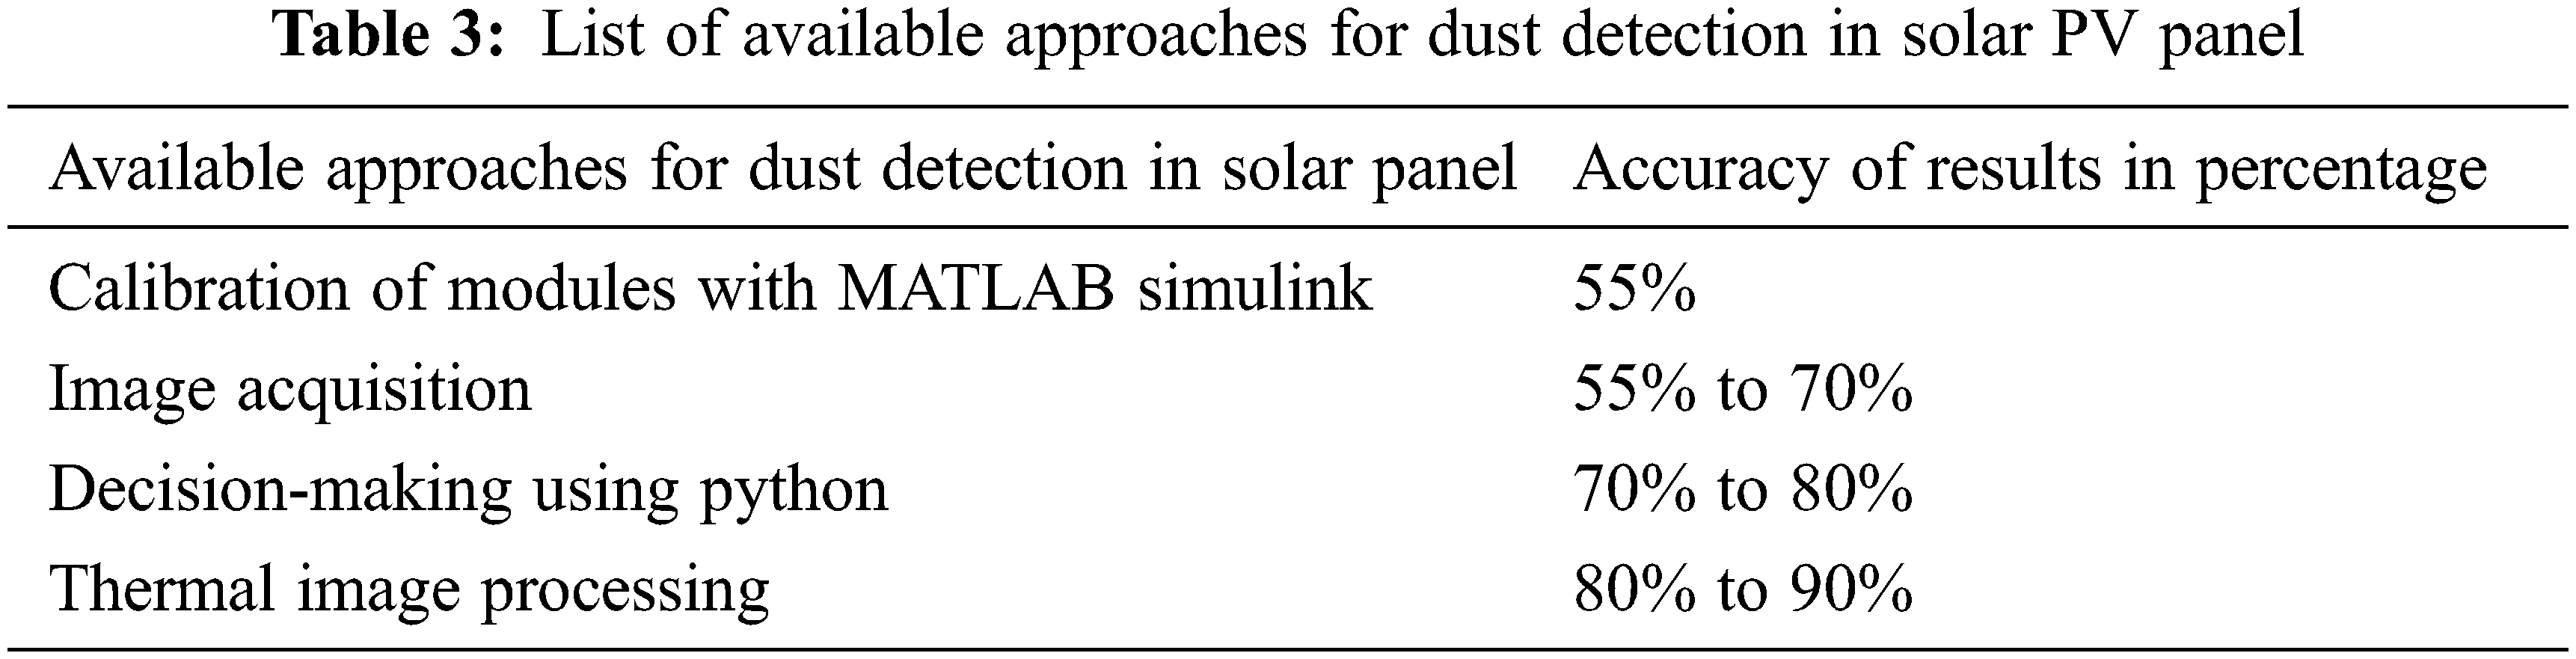
Tab. 3 insist the Simple comparison with other available methods for dust detection. By using above mentioned image processing technology we can easily detect dust faults on solar panels. The method for inspecting photovoltaic modules uses the following processes: module calibration, image acquisition, image processing, and decision making.
3 Thermal Effects Caused to the Spvm (Soiling on Photovoltaic Material)
The thermal effect caused by SPVM (Soiling on photovoltaic material) explains the reason for this problem? To find the role of aluminum (Al) and its silicon alloys (SI) in solar cells, it is necessary to review different types of solar power plants, their characteristics, requirements, and applications. Broadly speaking, solar cells fall into three categories, called concentrating solar power (CSP), solar heat sink, and solar photovoltaic (PV) cells.
As shown in Fig. 1, Due to the huge layer of soiling photovoltaic cells facing thermal effects due to the heating process during the photovoltaic effect, the vortex current is made on the external area and inside of the photovoltaic cell. While the photovoltaic cell is injured, the vortex current field will be transformed. According to Joule’s law, a slice of the vortex-current is transformed into Joule heat. The heated material is faced following thermal effects. This can be classified into three physical methods: 1. EMI (Electromagnetic induction) heating; 2. Heat transfer; 3. Infrared radioactivity.
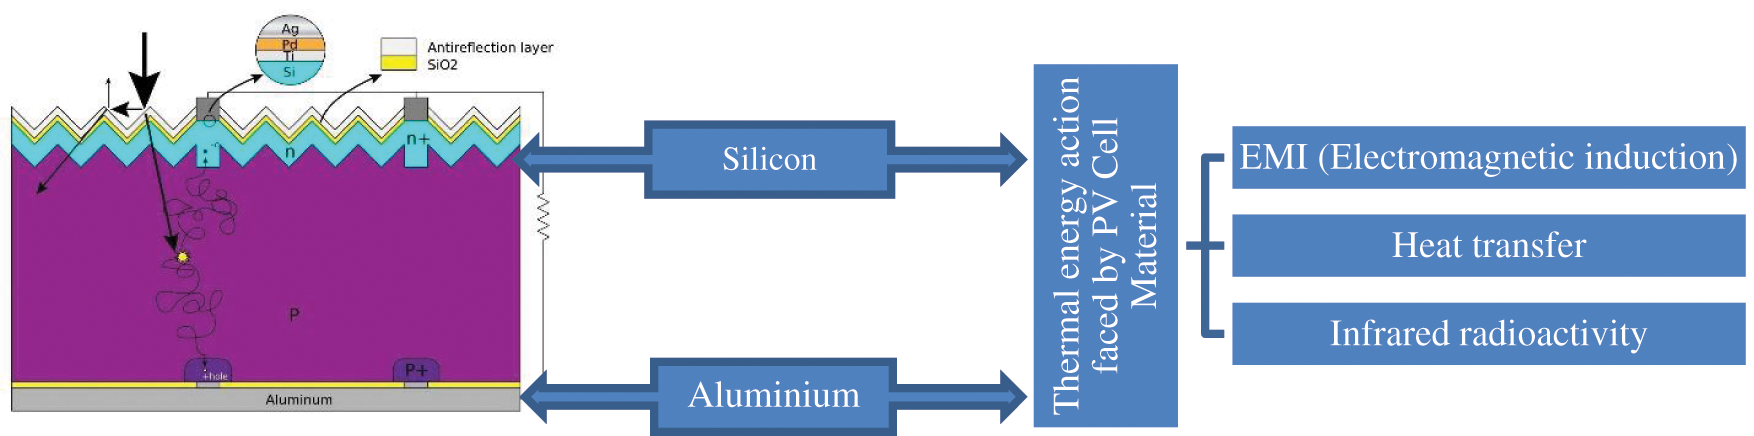
Figure 1: Due to soiling major thermal energy action faced by the PV panels during the photovoltaic process
4 Proposed Soiling Inspection Method on the Photovoltaic Cell Module
The proposed thermal inspection shows clearly how the power losses occur due to soiling issues and the following steps are involved in this operation
• Capture visual CCD images of PV modules
• PV Cell Hot Spot Validation–By using FLIR (Forward Looking Infrared)-Different Mode thermal images
• Experimental work done
• Identifying risk level using MATLAB GUI-Environment
Principal component thermal image processing techniques have been used for faults identification, so this is explained here with enough information process, in addition to that a procedure for hotspots automatic extraction has been noticed and authenticated, so that is added the novelty of proposed work and these step-by-step processes are mentioned the Fig. 2.
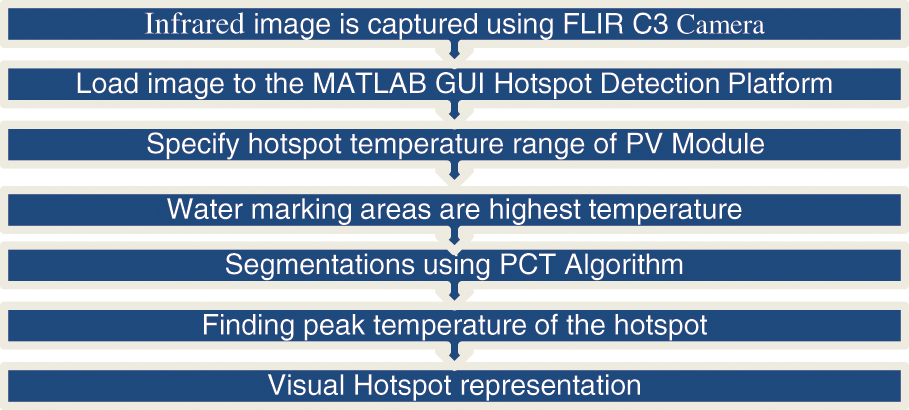
Figure 2: Hotspot automatic extraction flow
4.1 Capture Visual Images on PV Cell
The CCD images were captured for knowing the level of soiling, dust, and birds’ mucks present in the panel. Fig. 3 shows clearly how much amount of soiling is present in the panel as well as how much dust is present in the panels and finally, it shows the bird droppings Fig. 4.
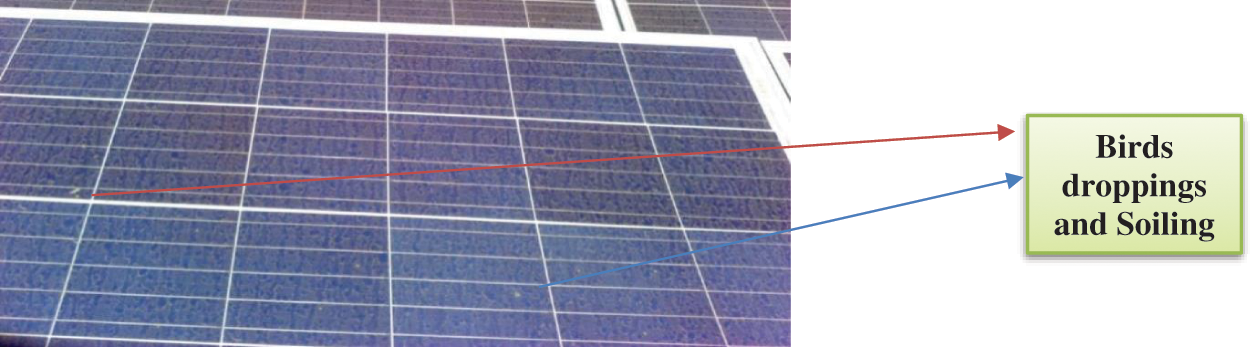
Figure 3: The close up shot of 500 watts PV module in which has soiling on the external surface
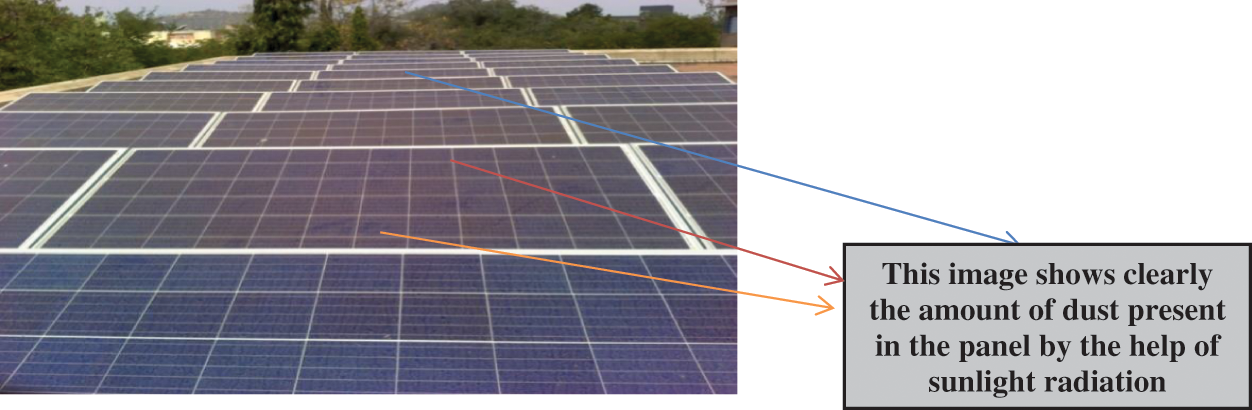
Figure 4: The 400 KVA PV power grid visual image in which has dust on the external surface
4.2 PV Cell Hot Spot Validation–By Using FLIR-Different Mode Thermal Images
Thermal images are captured from the PV panels by using different modes of FLIR camera and that mode was named RGB (Red, Green, and Blue), Volcano, Rainbow, Hot Iron, and Grayscale, here RGB Mode thermal image was not forecasted because which is going to be used in the real-time experimental setup because we can easily design MATLAB program by using RGB and Grayscale Thermal Images and meanwhile it gives the efficient output to compare other modes Figs. 5A and 5B.
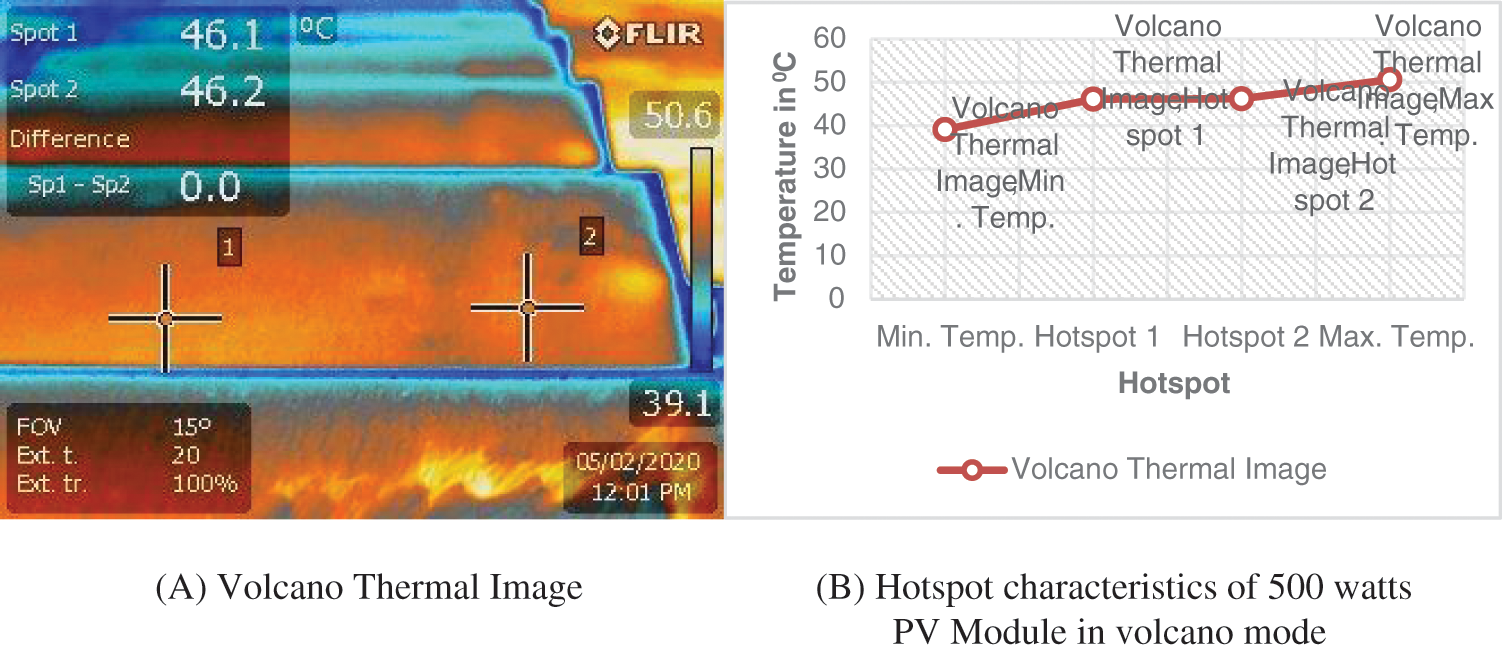
Figure 5: A. Volcano thermal image B. Hotspot characteristics of 500 watts
The 12 v and 500 watts solar panel hotspot characteristics were stated with the help of various modes of thermal images by using a thermal camcorder and image characteristics are mentioned on the above Figs. 6A and 6B. Those experimental outputs are really useful for finding the hotspot area of the PV models from the soiling issue.
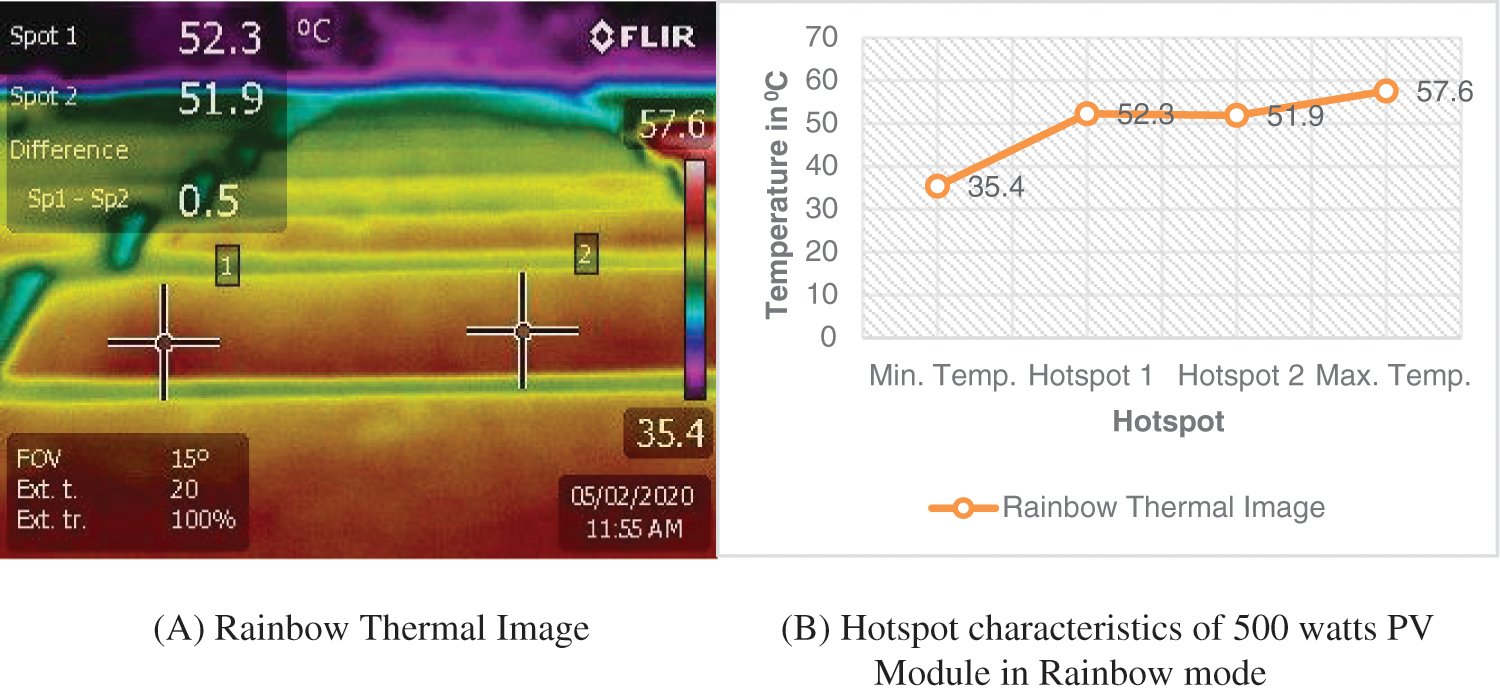
Figure 6: A. Rainbow thermal image B. Hotspot characteristics of 500 watts PV module in rainbow mode
In the experiment, RGB thermal has been used in the MATLAB data-structure code as an image processing technique to find out the hotspot of the entire 400 KVA power grid, Figs. 7A and 7B. But it lacks simplicity. Each mode’s results are mentioned in Tab. 4 with comprehensive explanations in Figs. 8A and 8B.
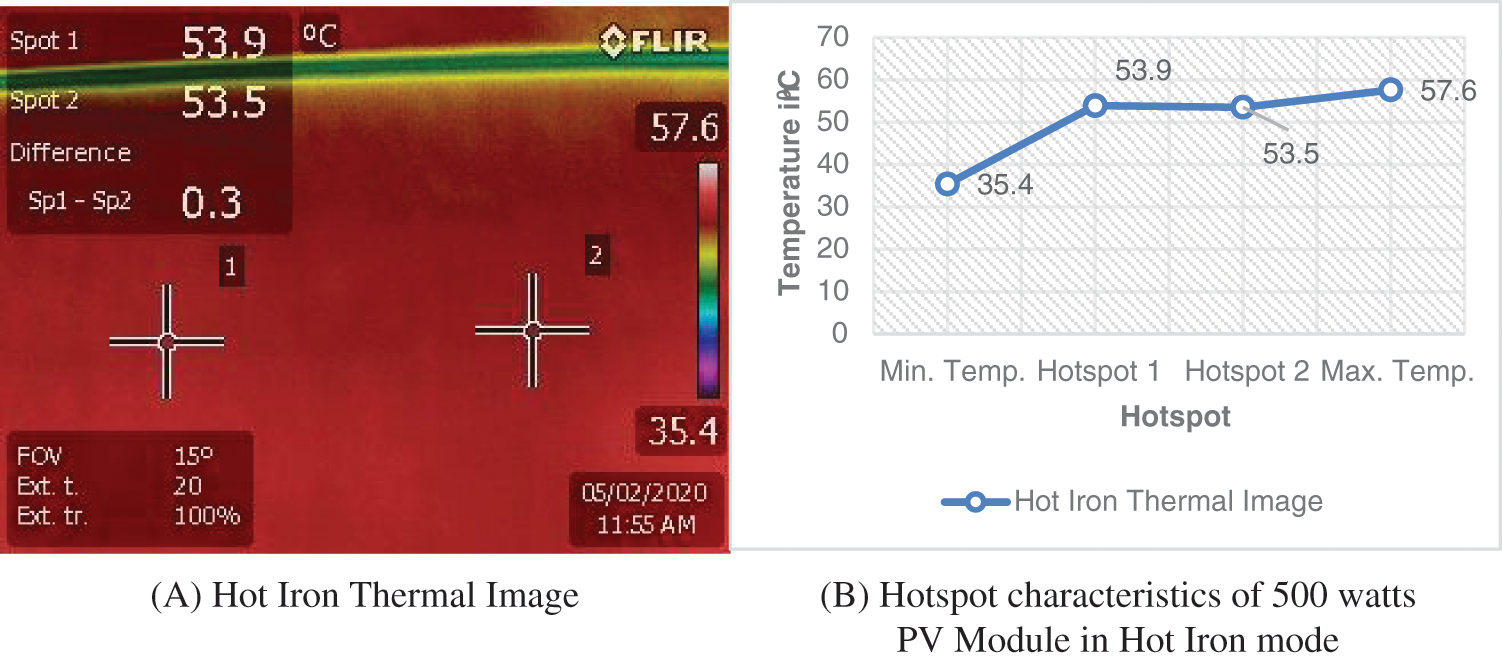
Figure 7: A. Hot iron thermal image B. Hotspot characteristics of 500 watts PV module in hot iron mode
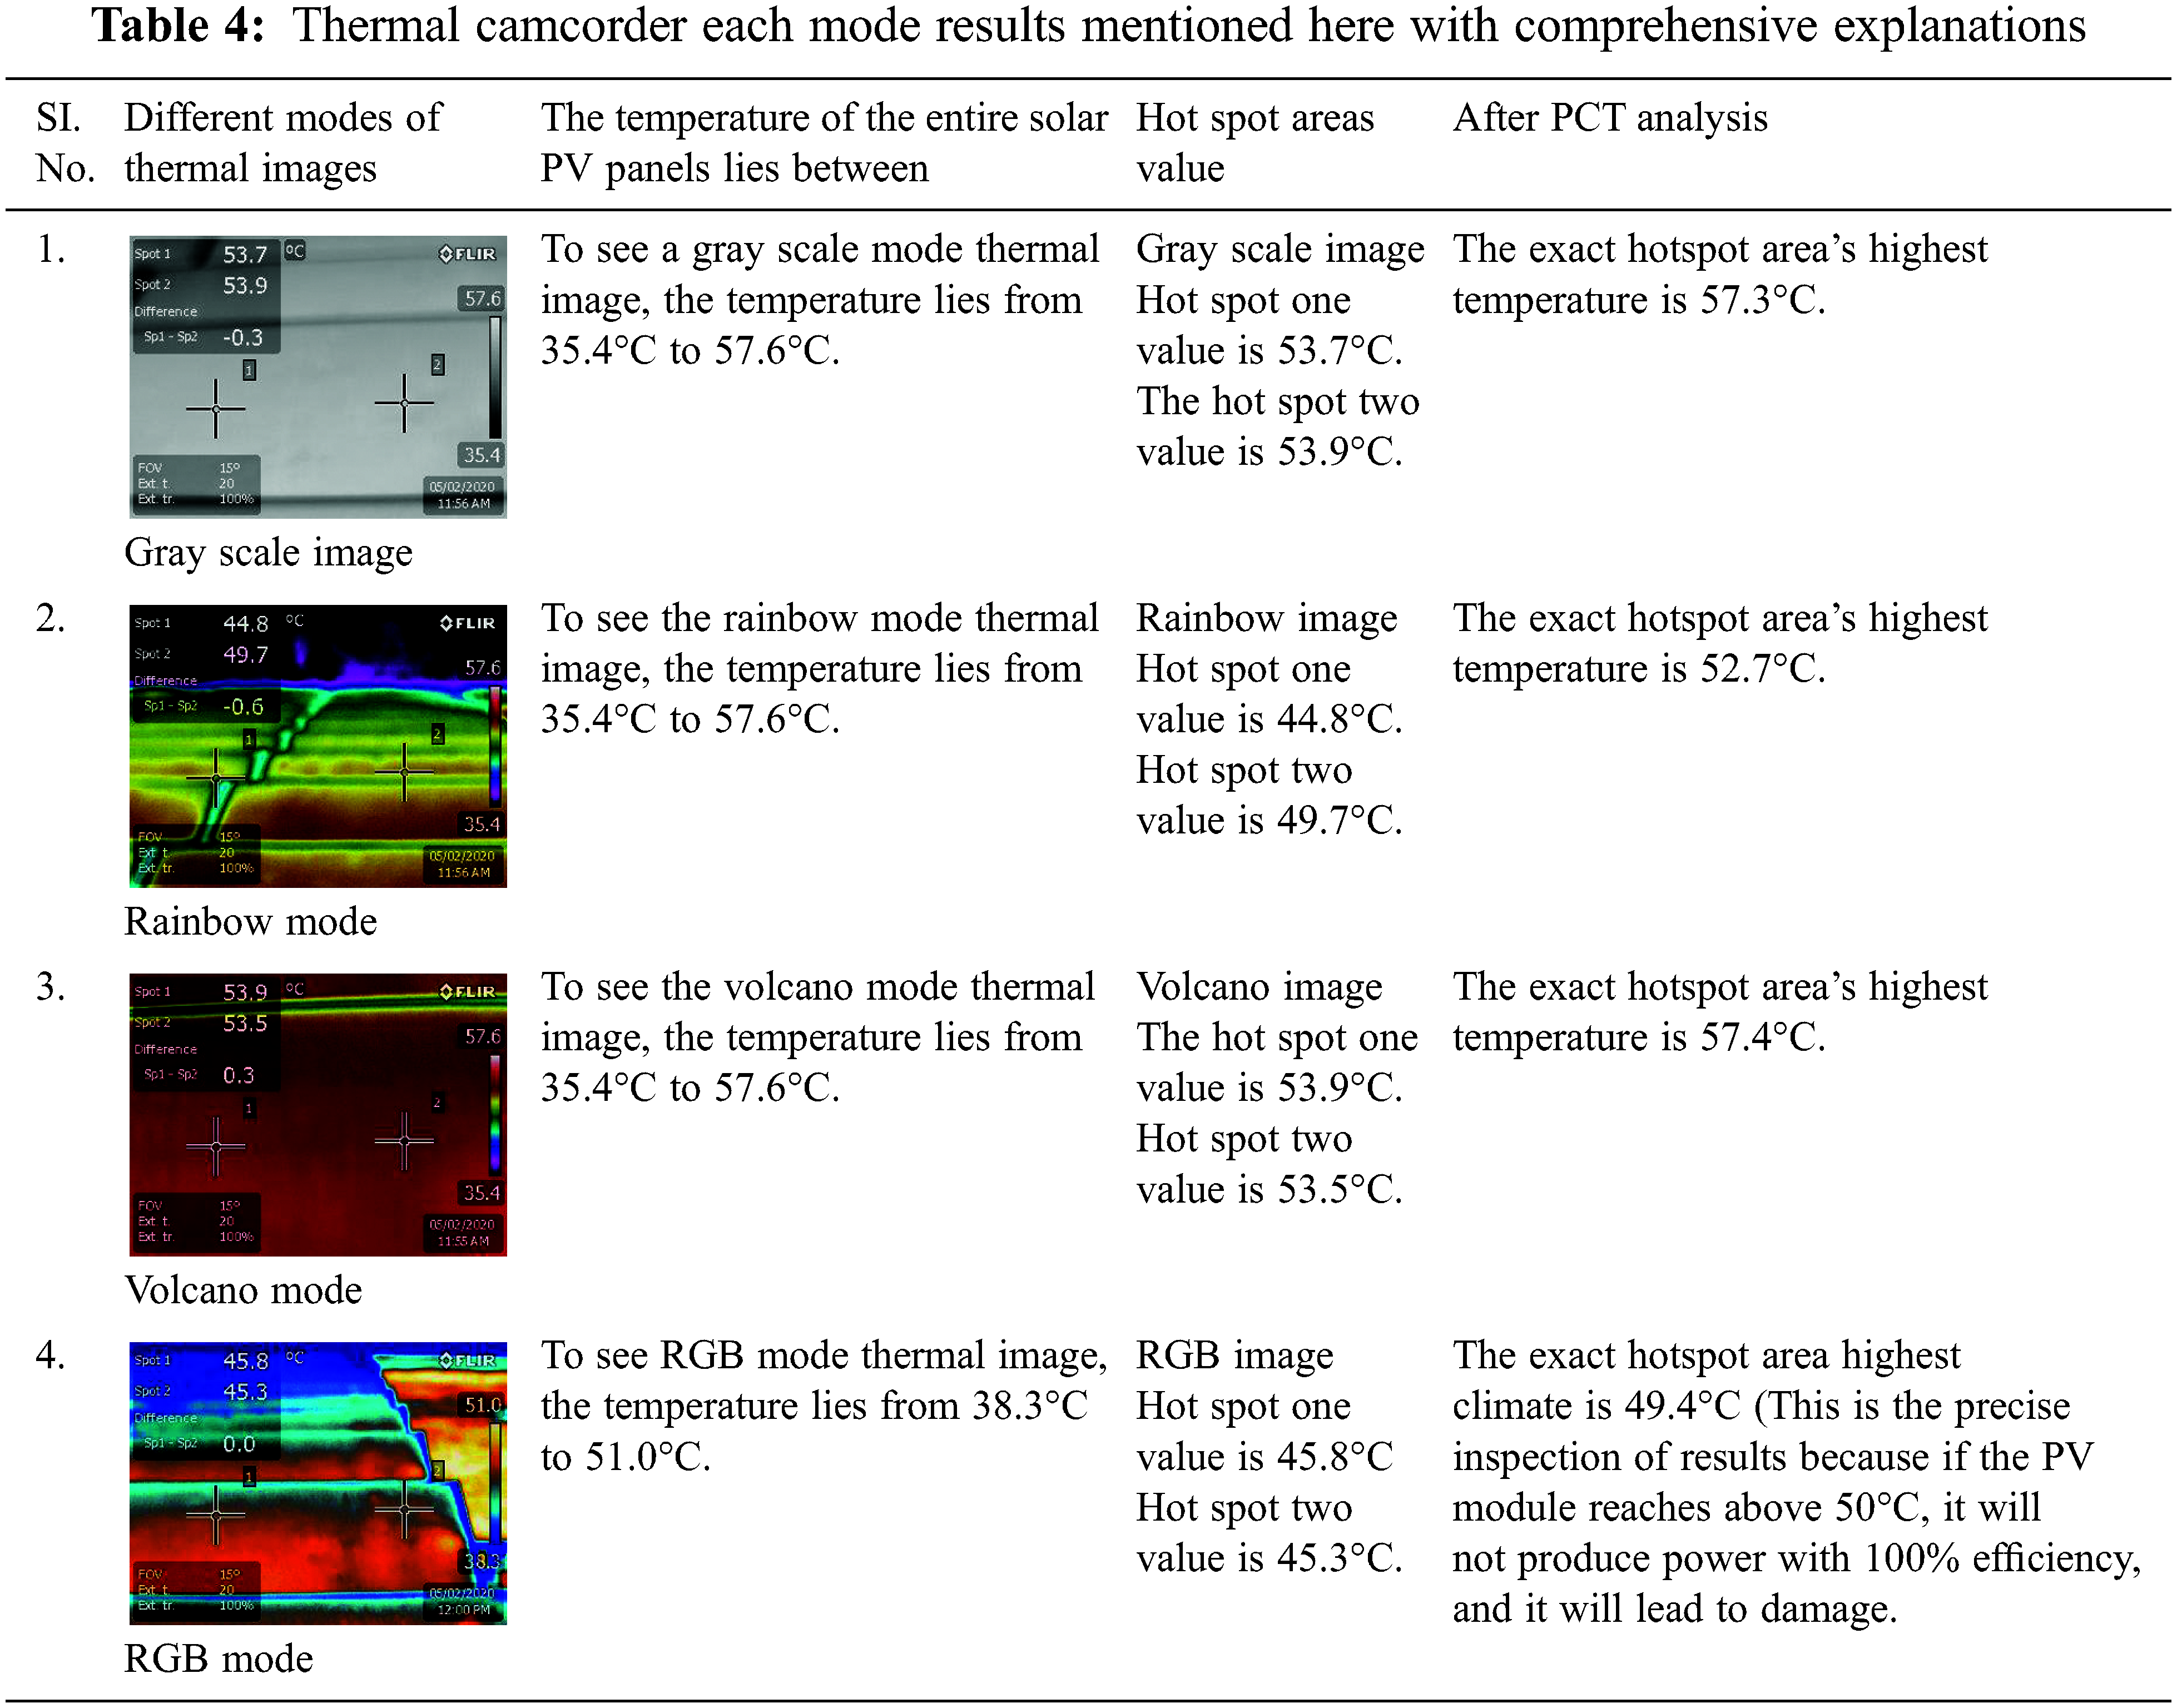
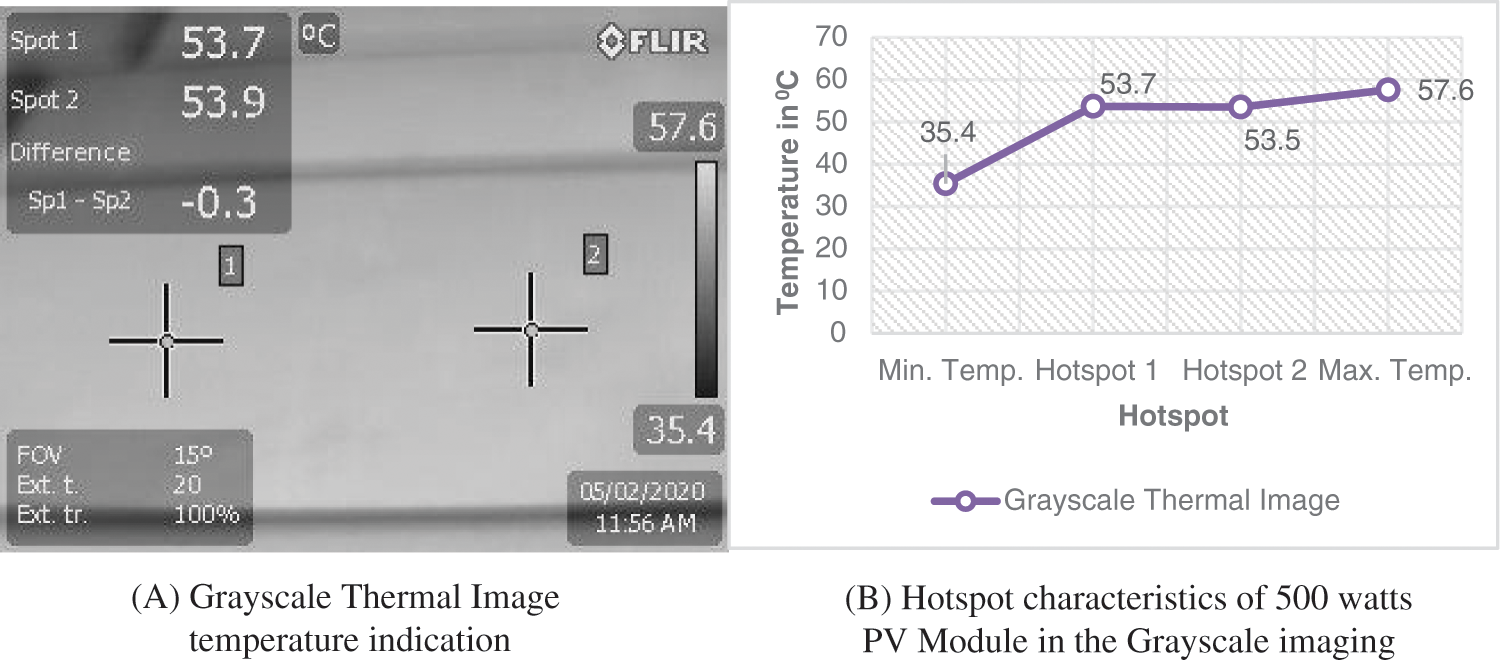
Figure 8: A. Grayscale thermal image temperature indication B. Hotspot characteristics of 500 watts PV module in the grayscale imaging
5 Real-Time Experimental Inspection
The inspection work was taking place at Thiyagaraja college of Engineering, Madurai-India, on 5th February 2020, between 12:00 and 15:00 h. Under the condition of maximum power production at an ambient temperature of 27°C. At high temperatures, the body produces heat energy in the form of electromagnetic rays. (At high temperatures, the body can produce heat energy individually in the form of electromagnetic radiations.) Emitted heat energy is directly proportional to the heat produced by the body to body produce heat. That came it is done with the help of speediness of light, and not by no essential for physical contact or in-between heat radiation gradient. By the use means of thermal cameras, Infrared thermography can find finding those radiations produced. Changing that then it converts into an electrical signal as long as thermograms where the image pixels cover temperature ranges.
The reasons for the occurrence of hotspots are varied and can be classified as functional or operational, and functional reasons can be divided into two areas: 1. Mismatch occurs when Cells with different currents are connected in series. Cell damage due to natural causes, rain, wind, dust, etc. can occur due to natural disasters because silicon cells will undergo stress during rolling, handling, and transportation.
The significant part of a thermal hotspot is the detectors of array faults respectively. Fundamentally, two types of failure data can be found: Hotspot area and accurate temperature of PV Module while Photovoltaic process. Further grouping into heated and non-heated substances, and based on indicators have been installed as well. Indicators classically used in PV infrared inspection are fully un-computerized. They decrease into the thermal grouping. Inspection can be achieved in two methods. The primary one is quantitative and another one is qualitative. In which the absolute heat value is associated with supplementary parts in the examined PV modules. It gives a large amount of safety and also guarantees high arrival on investments. It would much more concerned about the safety and guarantee upon the investments.
The hot spot of a solar panel depends on the design concept of the structure, but in this study an infrared (IR) was used to map the surface temperature distribution of the solar cell while dirt problems appear on the surface of the panel then the solar panel the cell will operate in reverse polarity mode. It is observed that certain cells exhibit heterogeneity in surface temperature leading to local heating (hot spot). Using scanning electron microscopy (SEM), structural images of hotspot areas show that heating the hotspot causes irreversible destruction of the solar cell structure. Various techniques were then used to analyze the elemental composition of different regions of the solar cell. It has been revealed that there is a direct correlation between the areas of high impurity and the heating of the hot spot. Areas with a high concentration of transition metals lead to the formation of hot spots. The results of all samples are detailed in this article.
By using IR (Infrared) thermography to check for dirt issues, hope it will be used for many applications, such as non-destructive, communication-less, rapid data collection, and large-scale use on installations photovoltaics in a state of maximum energy production. Used thermal cameras can be inspected manually by the operator for each module, fixed to a fixed support or mounted. Several current faults can be identified based on the shape and location of their thermal patterns. For example, an entire module warmer than the others indicates that it has an open circuit. At the scale of a module, a patchwork model indicates that the entire module is missing. A cell that is significantly hotter than others indicates a shadow effect, a faulty or detached cell. The hotter part of the plot indicates the presence of cracks. Strong heating indicates an area partially covered by bird droppings.
If the PV module temperature goes above 500 degrees Celsius those photovoltaic getting malfunction day by day and the efficiency of the panel also goes down, the manually cleaned working PV Module is shown in Fig. 9A and also those thermal images Fig. 9B states the actual temperature of the PV panel without any problem because the deposited soil was removed manually at that time. All the images are taken on the Same Date and Time-period mainly all the IR-thermal images dropped in this paper have their captured time and date respectively.
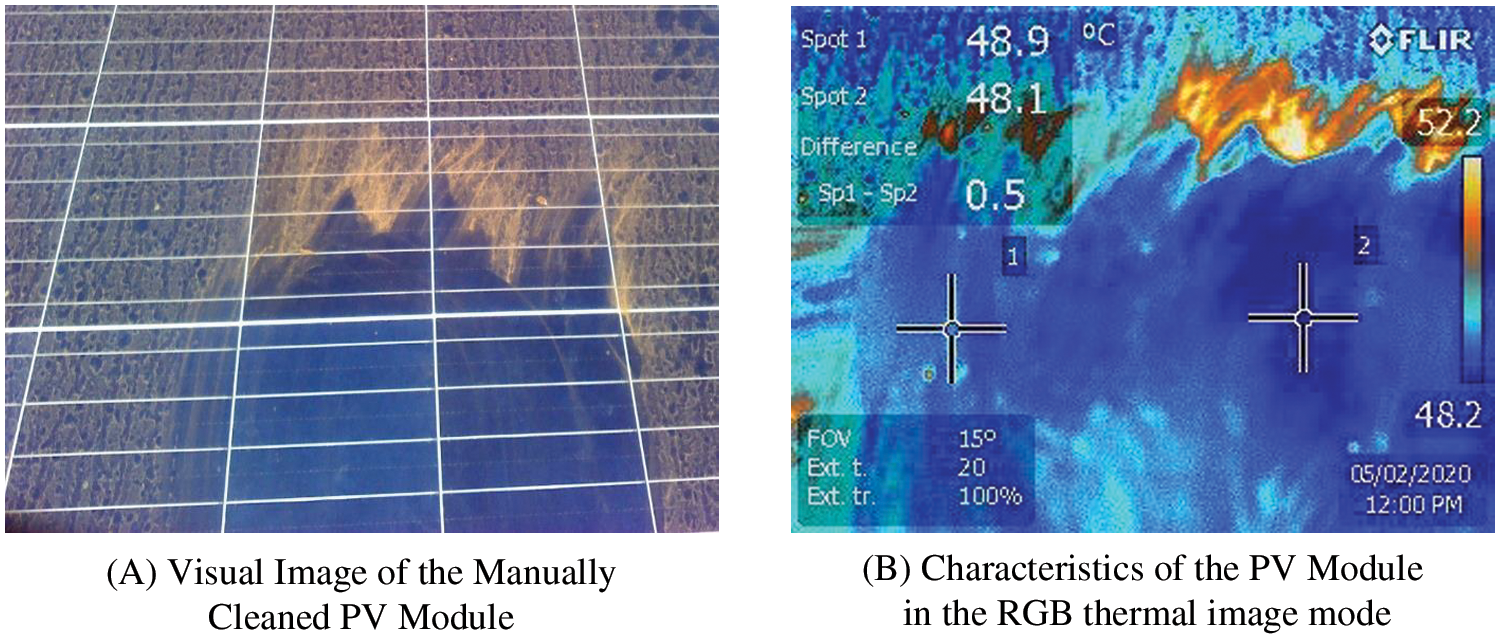
Figure 9: A. Visual image of the manually cleaned PV module B. Characteristics of the PV module in the RGB thermal image mode
The recognition platform has been fabricated in the MATLAB GUI-Platform with PCTA [2&7]; the system is as follows
■ Attached with thermal imaging sensors
■ Segmenting and investigating thermal images
■ Soling Hotspot recognition with thermal and visible images
It is an effective hardware and software co-design experimental setup that may use to find the PV module soiling issue at various atmospheric conditions with high precision reading. PV Module is shown in Fig. 9A and also those thermal images Fig. 9B. Here binarization technique is initially followed in the MATLAB environment. This optimized MATLAB GUI Model is used to examine various types of IR-thermal images but that image should have a color map scale in-built. After the investigation, the examiner can easily get the Hotspot area in very exact value at any definite-location point in the investigation area also the code can detect the areas of highest heat (hotspot) by highlighting light-yellowish green color. Fig. 10 shows the MATLAB Powered GUI Diagnosis platform and this is the particular experimental loaded area
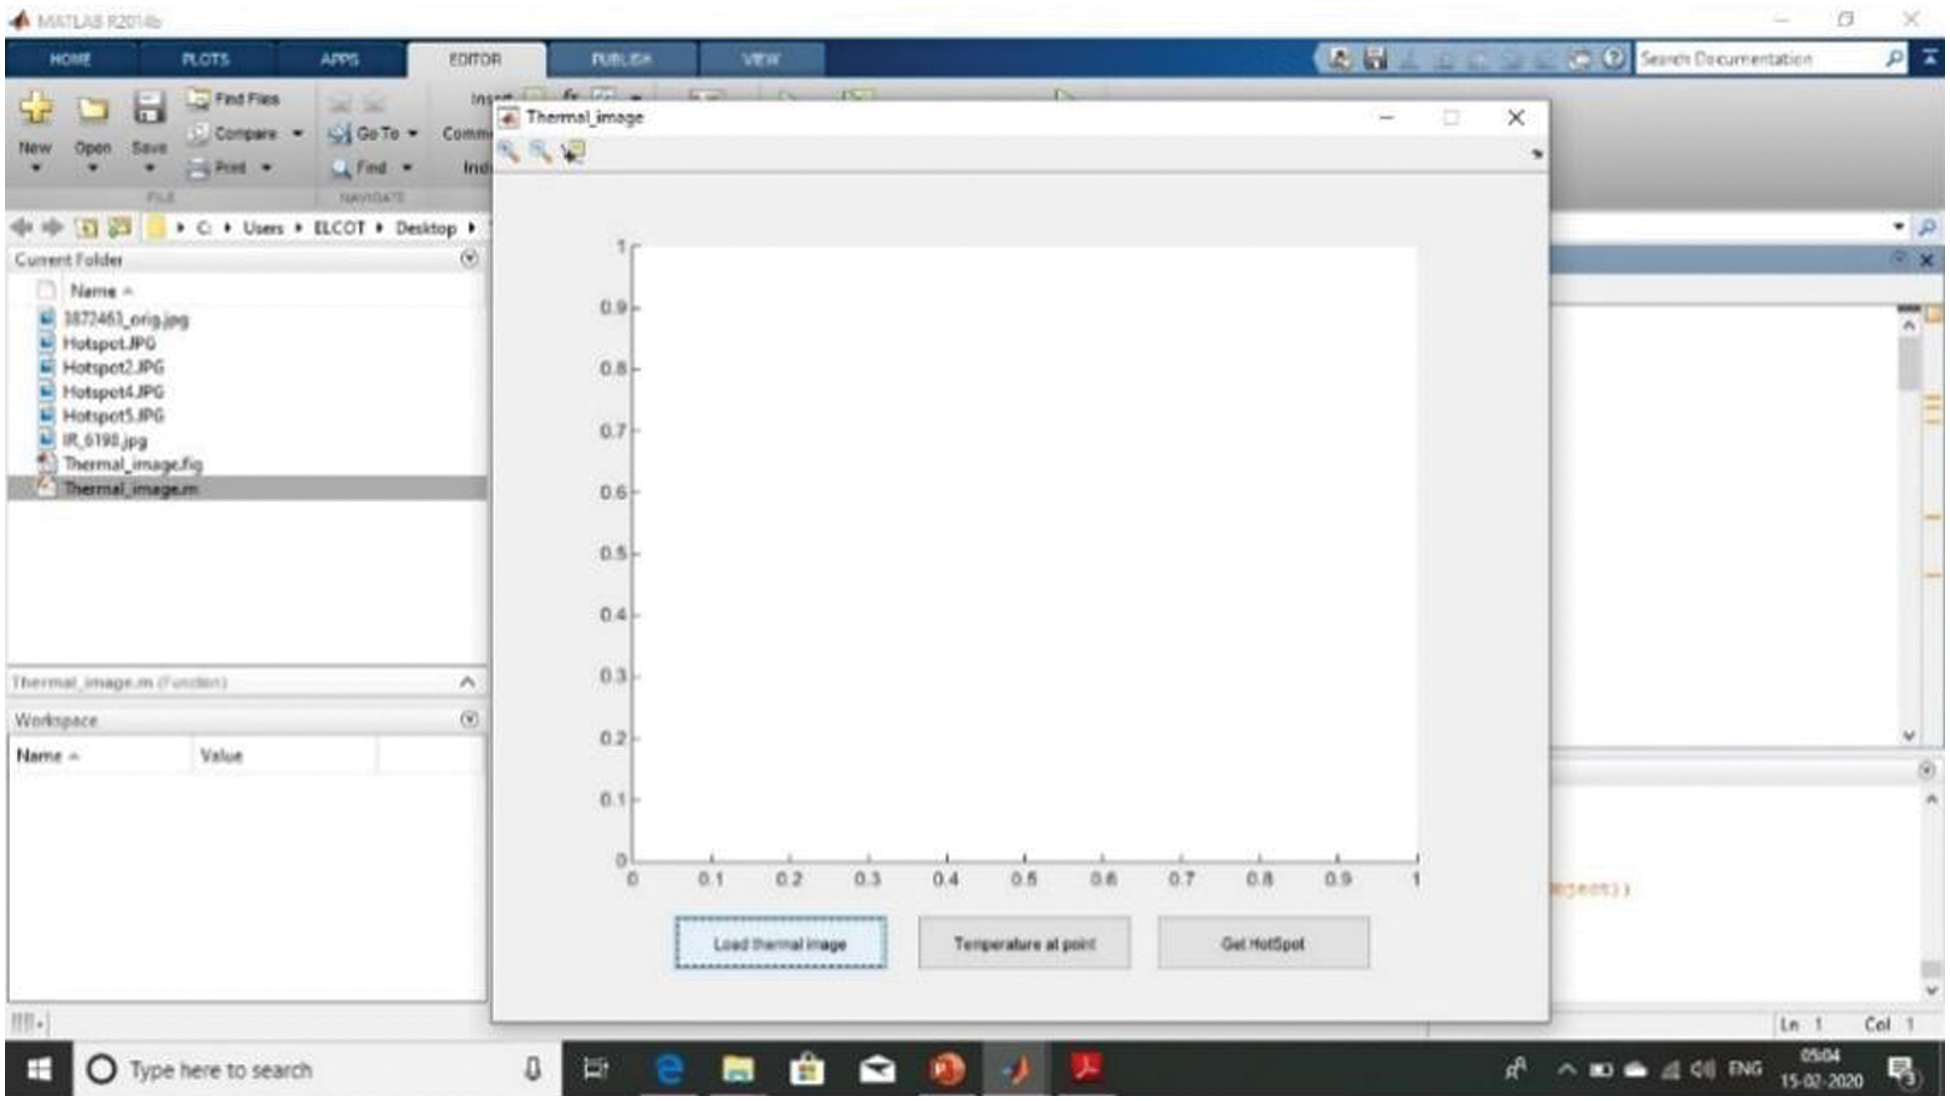
Figure 10: Experimental image loading GUI platform
Fig. 11 showed how the user has selected the color map by using the color scale value which is present on the right side of the thermal images here we used principal component thermal image techniques because it can easily exaggerate the required data as a binary form for doing analysis.

Figure 11: Select the colour map value to be nourished into the MATLAB environment
The hotspot area has been identified and those locations can be mapped with light yellowish green colour in Fig. 12 and it’s a final result that may be expected.
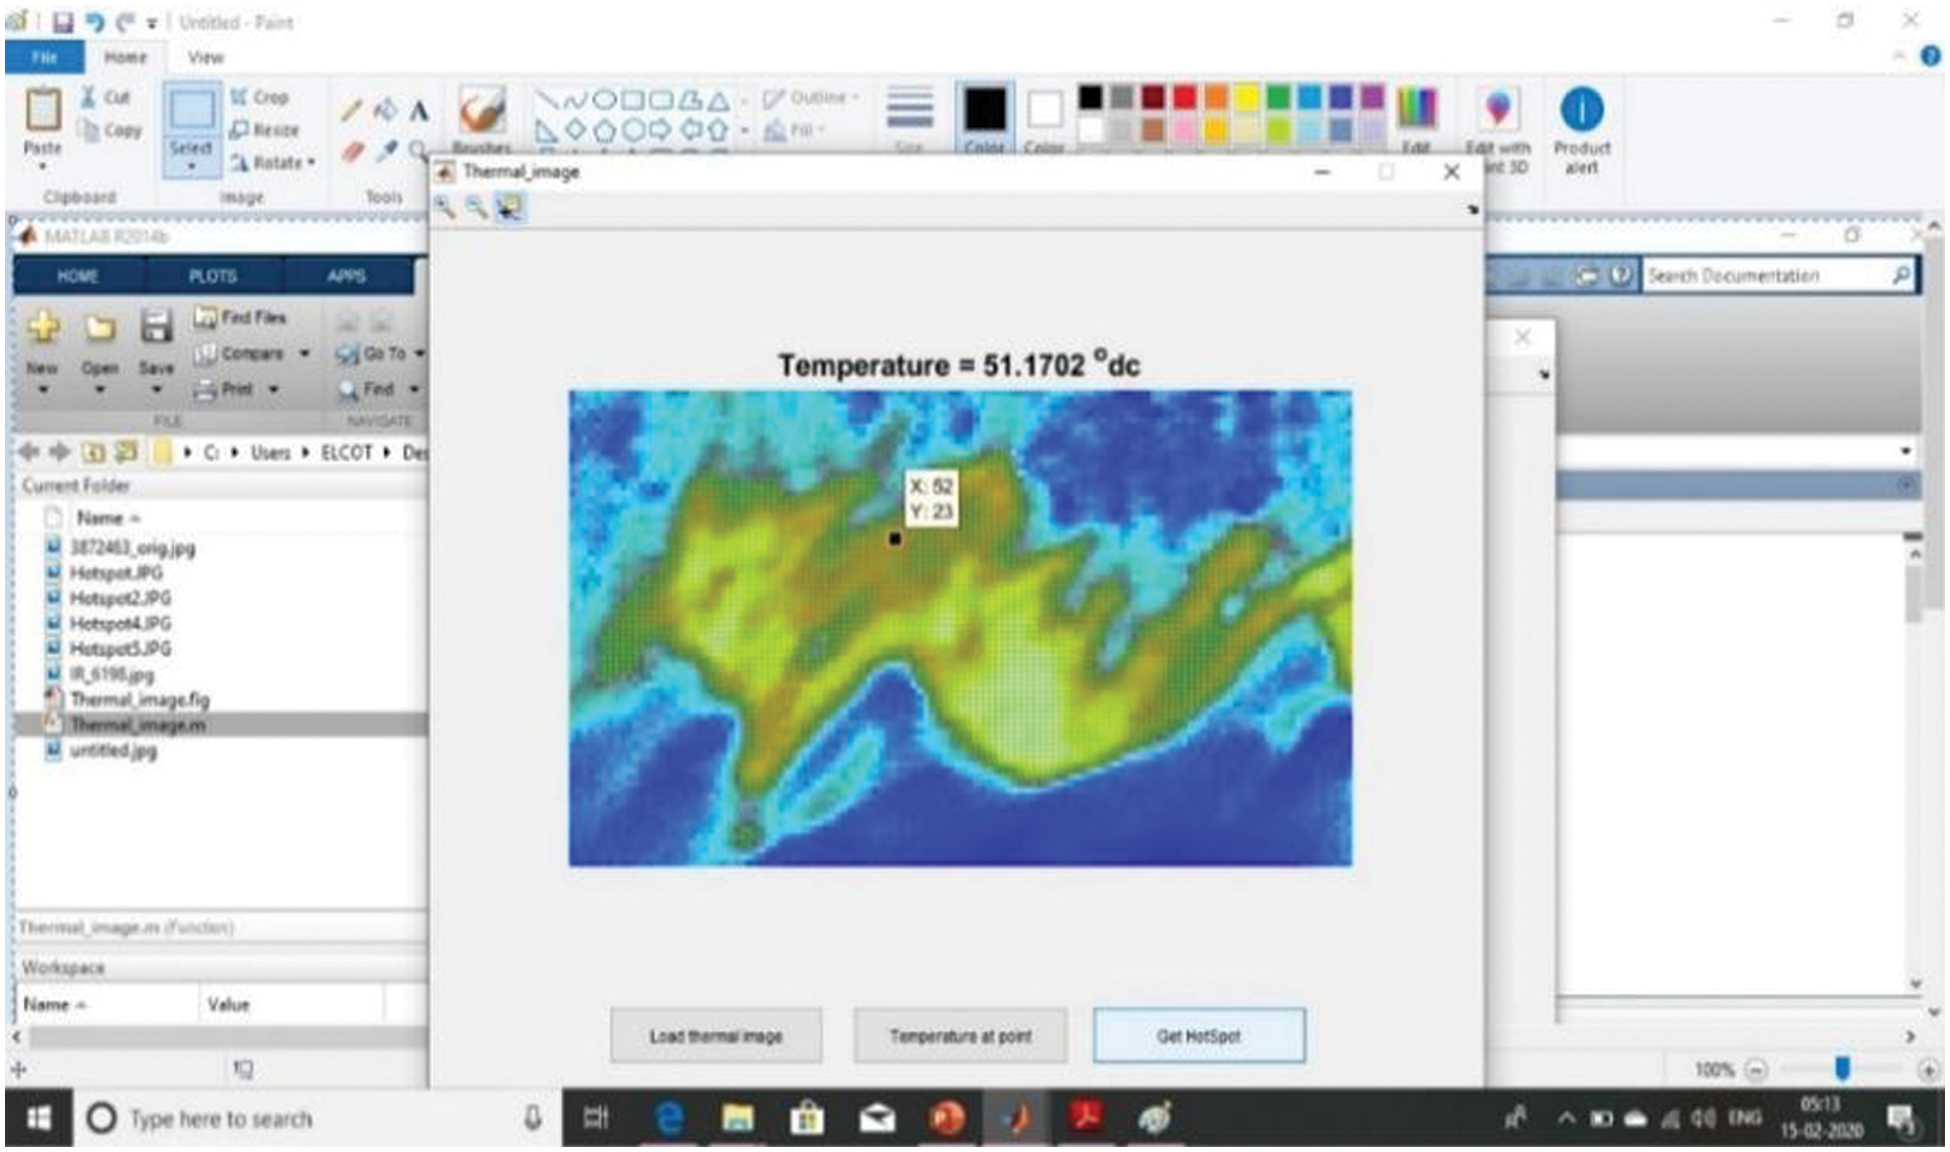
Figure 12: Exact hotspot of the 12 v, 500 watts due to soiling issue
6 Results of Thermal Hotspot Identification for Photovoltaic Cell and Discussion
In demand to show the advantages of thermal imaging hotspot identification technique to the Mass power production PV power grid, it has been giving the exact faulty location (hotspot) with the comparative output on the same type of photovoltaic cell at different mode. The experimental output of the system shows in Fig. 12.
It has located the exact hot spot area of the 12 v, 500 watts PV module even though we captured the image using an IR-Thermal camcorder it was not located the Hotspot areas clearly (Fig. 9B). The MATLAB-powered GUI hotspot diagnosis platform used here clearly located the Soiling issue to compare with the thermal camera actual spot identification anyway this method was a highly effective method. However, the thermal camera is mainly required to find the defects present in the PV Module but additionally, it requires some precision scaling system for getting the desired output. This system is used to find the Hotspot Accurately with help of an optimally designed principal component thermal analysis MATLAB program.
The result of the technique undoubtedly finds out the faulty location among un-defected and defected regions. So, it is a highly well-organized system and a time-saving method for testing the PV Modules. The various Mode IR-Thermal images captured for thermal image processing are shown in Figs. 5–8 giving the reliability of a thermal camera. In the experiment, RGB thermal has been used in the MATLAB data-structure code as an image processing technique to find out the hotspot of the entire 400 KVA power grid. The PCTA technique has been used for feature abstraction of the Thermal image. It will absolutely to be supported the upcoming day’s solar power grid inspection with less time, cost-effective, and with reliability.
Thermal inspection on PV power grid with various acquisition parameters and circumstances were cast-off on 400 KVA grid located in the city of Madurai-India. PV Module Soiling faults have been noticed and authenticated. Principal component thermal image processing techniques have been used for fault identification; in addition to that, a procedure for automatic hotspot identification has been noticed and validated. By the source of getting results, practical features of solar PV panel inspection have been monitored and deliberated. This type of inspection will be really helpful for Indian PV Power production grid areas.
Funding Statement: The authors received no specific funding for this study.
Conflicts of Interest: The authors declare that they have no conflicts of interest to report regarding the present study.
References
1. Y. Zefri, A. ElKettani, I. Sebari and S. Lamallam, “Thermal infrared and visual inspection of photovoltaic installations by UAV photogrammetry—Application case: Morocco,” Drones, vol. 2, no. 4, pp. 41, 2018. [Google Scholar]
2. J. Bai and S. Ng, “Tests for skewness, kurtosis, and normality for time series data,” Journal of Business & Economic Statistics, vol. 23, no. 1, pp. 49–60, 2005. [Google Scholar]
3. W. Brooks, D. Lamb and S. Irvine, “IR reflectance imaging for crystalline Si solar cell crack detection,” IEEE Journal of Photovoltaics, vol. 5, no. 5, pp. 1271–1275, 2015. [Google Scholar]
4. Y. He, B. Du and S. Huang, “Noncontact electromagnetic induction excited infrared thermography for photovoltaic cells and modules inspection,” IEEE Transactions on Industrial Informatics, vol. 14, no. 12, pp. 5585–5593, 2018. [Google Scholar]
5. M. Susa, H. Benítez, C. Ibarra-Castanedo, H. Loaiza, H. Bendada et al., “Phase contrast using a differentiated absolute contrast method,” Quantitative InfraRed Thermography Journal, vol. 3, no. 2, pp. 219–230, 2006. [Google Scholar]
6. P. Quater, F. Grimaccia, S. Leva, M. Mussetta and M. Aghaei, “Light unmanned aerial vehicles (UAVs) for cooperative inspection of PV plants,” IEEE Journal of Photovoltaics, vol. 4, no. 4, pp. 1107–1113, 2014. [Google Scholar]
7. N. Rajic, “Principal component thermography for flaw contrast enhancement and flaw depth characterization in composite structures,” Composite Structures, vol. 58, no. 4, pp. 521–528, 2002. [Google Scholar]
8. H. Kim, “Statistical notes for clinical researchers: Assessing normal distribution using skewness and kurtosis,” Restorative Dentistry & Endodontics, vol. 38, no. 1, pp. 52, 2013. [Google Scholar]
9. W. Richter, “Skewness-kurtosis adjusted confidence estimators and significance tests,” Journal of Statistical Distributions and Applications, vol. 3, no. 1, pp. 1–9, 2016. [Google Scholar]
10. E. Amalu, D. Hughes, F. Nabhani and J. Winter, “Thermo-mechanical deformation degradation of crystalline silicon photovoltaic (c-Si PV) module in operation,” Engineering Failure Analysis, vol. 84, pp. 229–246, 2018. [Google Scholar]
11. G. K. Camilleri and O. Falzon, “Principal component analysis for dynamic thermal video analysis,” Infrared Physics & Technology, vol. 109, pp. 103359, 2020. [Google Scholar]
12. A. Sriram and T. D. Sudhakar, “Protection of power transmission lines using intelligent Hot spot detection,” in 2019 Fifth Int. Conf. on Electrical Energy Systems (ICEES), SSN College of Engineering, India. pp. 1–6, 2019. [Google Scholar]
13. P. Haidari, A. Hajiahmad, A. Jafari and A. Nasiri, “Deep learning-based model for fault classification in solar modules using infrared images,” Sustainable Energy Technologies and Assessments, vol. 52, pp. 102110, 2022. [Google Scholar]
14. Z. Yahya, S. Imane, H. Hicham, A. Ghassane and E. B. I. Safia, “Applied imagery pattern recognition for photovoltaic modules’ inspection: A review on methods, challenges and future development,” Sustainable Energy Technologies and Assessments, vol. 52, pp. 102071, 2022. [Google Scholar]
Cite This Article
 Copyright © 2023 The Author(s). Published by Tech Science Press.
This work is licensed under a Creative Commons Attribution 4.0 International License , which permits unrestricted use, distribution, and reproduction in any medium, provided the original work is properly cited.
 Downloads
 Citation Tools