
 Submit a Paper
 Propose a Special lssue
 Open Access
ARTICLE

An Efficient Hybrid Optimization for Skin Cancer Detection Using PNN Classifier
1 Ponjesly College of Engineering, Nagercoil, Tamilnadu, India
2 CSI Institute of Technology Thovalai, India
* Corresponding Author: J. Jaculin Femil. Email:
Computer Systems Science and Engineering 2023, 45(3), 2919-2934. https://doi.org/10.32604/csse.2023.032935
Received 02 June 2022; Accepted 12 July 2022; Issue published 21 December 2022
 View Full Text
 Download PDF
Abstract
The necessity of on-time cancer detection is extremely high in the recent days as it becomes a threat to human life. The skin cancer is considered as one of the dangerous diseases among other types of cancer since it causes severe health impacts on human beings and hence it is highly mandatory to detect the skin cancer in the early stage for providing adequate treatment. Therefore, an effective image processing approach is employed in this present study for the accurate detection of skin cancer. Initially, the dermoscopy images of skin lesions are retrieved and processed by eliminating the noises with the assistance of Gabor filter. Then, the pre-processed dermoscopy image is segmented into multiple regions by implementing cascaded Fuzzy C-Means (FCM) algorithm, which involves in improving the reliability of cancer detection. The A Gabor Response Co-occurrence Matrix (GRCM) is used to extract melanoma parameters in an efficient manner. A hybrid Particle Swarm Optimization (PSO)-Whale Optimization is then utilized for efficiently optimizing the extracted features. Finally, the features are significantly classified with the assistance of Probabilistic Neural Network (PNN) classifier for classifying the stages of skin lesion in an optimal manner. The whole work is stimulated in MATLAB and the attained outcomes have proved that the introduced approach delivers optimal results with maximal accuracy of 97.83%.Keywords
World Health Organization has stated that the cancer is one of the major causes of death. Among different cancers, skin cancer is regarded as one of the common and hazardous types. There exist different skin disorders like Basal Cell Carcinoma (BCC), Squamous Cell Carcinoma (SCC) and Malignant Melanoma (MM). The MM is the hazardous type of all as it affects other organs, which in turn leads to death [1]. Melanoma is a harmful tumor, which is produced by the cells containing melanocytes. Although melanoma is found anywhere in the body, it mostly grows on the back of the lower limbs. The American cancer society has assessed that around 7,230 individuals are recovered from melanoma but around 96,480 new melanoma cases are found in US in 2019. If cancer is detected and treated early, it is possible to minimize the mortality rate of cancer. This has inspired researchers to look for new strategies to achieve the early identification of skin malignancy [2–4].
Specially trained dermatologist utilizes an apparatus to look at pigmented skin lesions depend on a complex set of visible patterns. A novel automated method [5] further analyzes the direction or longitudinal positioning of the streak lines and categorizes the lesions. Irregular streaks are one of the most basic symptoms that show a high relationship with melanoma. A Computer Aided System (CAD) [6] for the detection of melanoma is built with the recognition of streaks. The non-invasive skin imaging strategies have been preferred in a wider range because of having the beneficial impacts like lesser risk of complication, easy recovery and minimum cost. Hence, the dermoscopy [7] has been widely used in the distinguishing proof of melanoma. Thus, the doctors have different diagnosis results and poor reproducibility. The modern melanoma detection is done by the classifier based on Convolutional Neural Network (CNN) [8]. Studies have shown that the CNN effectively classifies skin cancer and provides life-saving diagnosis. The challenge is that the differences between classes in medical image are usually much smaller than the normal images. Color [9] is a key feature of melanoma while combining through the area of the lesion to capture color and variegation. Usually. The color descriptors are Red, Green and Blue (RGB). Due to refined color alteration, location-related color information, poor color divergence and large differences between images of the identical category, it is highly hard to perform clinical color evaluations in dermoscopy images. The Asymmetrical, Border, Color, Diameter, Evolving (ABCDE) rule is a basic structure that doctors, beginner dermatologists and non-physicians can understand the characteristics of curable early melanoma, thereby enhancing the initial detection of melanoma [10,11]. The ABCDE method has low specificity and sensitivity [12]. Then it applies various algorithms and techniques to measure and determine whether the point is melanoma [13]. Uveal melanoma [14] is an uncommon disease but it is the most well-known primary ocular malignancy. Uveal melanoma patients undergo Radiation Therapy (RT). However, the specialist just gets patient’s eye development by watching the video in the control room.
Several prescient models are described, because of the significance of nuclear structure in cancer diagnosis. In [15], Support Vector Machine (SVM) choice limit in a greatest delicate edge issue, which deciphers patient’s nuclear pattern from various classes. Total Body Skin Examination (TBSE) is a main strategy for melanoma detection [16]. Each pigmented skin lesions are checked separately for identifying the melanoma signs. Artificially initiated changes in all lesions are accurately identified. The millimeter wave imaging setting is performed accurately by the characterizing the penetration depth of millimeter waves [17] in skin. It accurately simulates the dielectric properties of human skin tissue under normal and malignant conditions. High sensitive detection of skin cancer using semiconductor membranes used in new water based Terahertz (THZ) Meta-Materials (MM) are discussed in [18–20].
In [21], skin lesions are examined by a set of High-Level Intuitive Features (HLIFS) in the standard camera image. Noninvasive micro-sensor system is used to analyze the evolution of melanoma [22]. The recent trend is to select local patches in the image and describe each patch by a set of local features. By using global methods and local features, melanoma is detected in [23]. The incidence of Melanoma in Suit (MIS) [24] has increased significantly. The highest cure rate for melanoma is attained by testing at the MIS stage but dermoscopy alone is not sufficient enough to reliably detect MIS. Use of microwave reflection method as a diagnostic tool for detecting skin cancer is discussed in [25]. In [26], skin cancer and other skin pathologies are evaluated using electrical bio-impedance. The aim is to distinguish skin cancer from benign moles using multi-frequency impedance spectroscopy. In [27], the entire mobile imaging system is employed to detect melanoma in the early period. Human-Computer Interface (HCI) is designed to understand usability and acceptability issues in mobile imaging system.
The design of existing research shows that it requires a lot of space and cost. The purpose of the proposed method is to detect skin cancer by using image processing to produce optimal results. These features include texture, color, border, height and thickness. This research is the basis for identifying new developments in skin lesions. Here, the input image has gone through several processes from preprocessing to classification to efficiently diagnose the cancer with high accuracy. The classifier used in the proposed system helps to perform operations at high speed.
The objective of this proposed strategy is to distinguish the melanoma more accurately as the treatment depends upon the location and size. This method has gone through five steps for obtaining high precision. This method starts by retrieving images of skin lesions. The collected images are preprocessed to obtain high quality images. Gabor filter is used to eliminate unnecessary noises in an optimal manner. Segmentation is performed after removing the excess noises. The CFC is used in segmentation process, where the preprocessed image is divided into many segments. Extraction of feature is done by GRCM. The optimal features are selected by means of utilizing Hybrid PSO-whale optimization. This is an advanced approach extensively used in image processing applications. It has the ability to deliver optimal outcomes with maximal reliability. At last, classification is done by using PNN. Compared with other classifiers, it performs better. Through the use of new algorithms and methods, the obtained images have gone through various steps and provide better information to develop treatment plans. The accuracy obtained through this process is 97.83%. The block diagram of this introduced methodology is portrayed in Fig. 1.
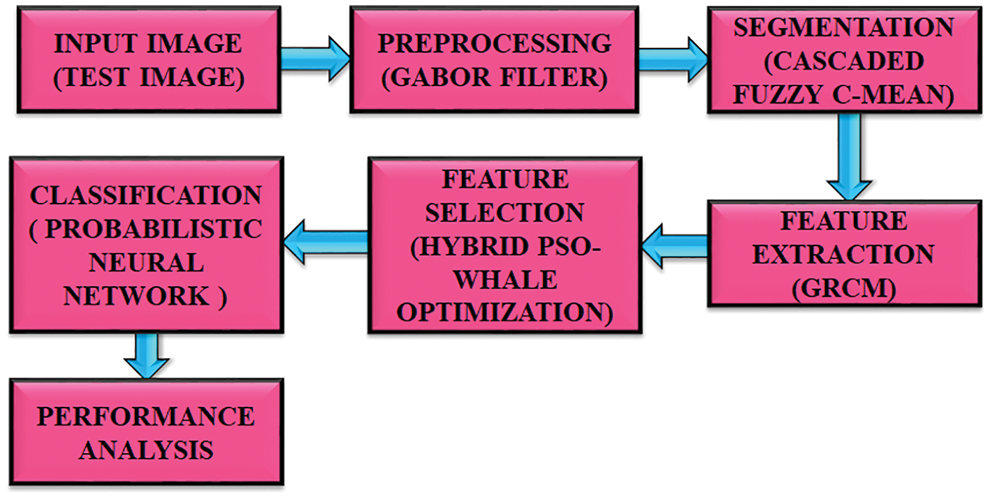
Figure 1: Proposed block diagram
The input of skin lesions is initially obtained from the Kaggle dataset. The obtained input image contains distortions such as noise and redundancy. Preprocessing is performed to otain high quality images. To get better image, the obtained RGB image is converter to gray scale image. The formula used to accomplish this step is expressed as,
Image enhancement improves image quality by eliminating noise and minimizes blur. Gabor filter is widely used in image processing applications. As a matter of fact, an acclaimed class of capacities that are known to accomplish both spatial and spatial recurrence limitation is the Gabor function that is not genuinely a wavelet but rather it can be executed in such a way as to impersonate the properties of wavelets. The Gabor function is characterized by the product of the complex exponential function and Gaussian function. Therefore, the two-dimensional Gabor filter matches the receiving field model of mammalian retinal nerve cells. In a two-dimensional coordinate system, a Gabor filter containing real and imaginary parts is expressed as,
Among them,
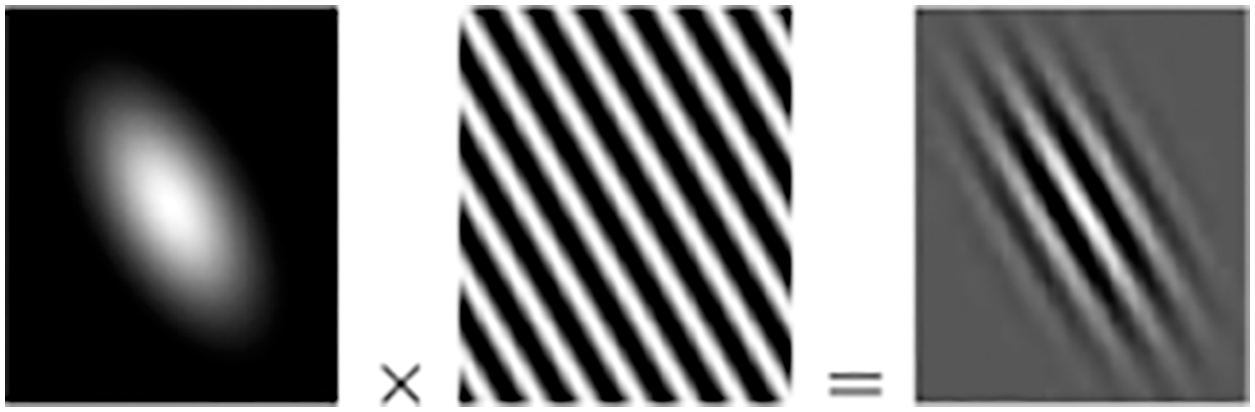
Figure 2: Gabor function results (right) from the product of Gaussian envelope by a complex exponential carrier. Only real parts are shown
2.2 Segmentation Using Cascaded Fuzzy C-Mean
The main objective of segmentation is to divide an image into multiple regions and each region shows different data in the image. Segmentation method depends on both attributes such as identifying discontinuities and similarities. Cascaded FCM is used to process the image of skin lesions in this process of segmentation. FCM ordinarily puts the cluster prototype in a region with many input vectors. In order to give an exact clustering, the fuzzy rule base is effectively used, which in turn maximizes the reliability of the disease detection in an optimal manner. The accuracy and convergence speed of cascaded FCM is significantly maximal than the conventional FCM. In the next stage, only the strength voxels that are adjacent to the tumor are included. The ultimate aim of FCM is to classify cluster centers. The target capacity to be limited is characterized as,
where
As per the exchanging optimizing plan of FCM calculation, Eqs. (7), (8) are alternately applied until cluster model stabilizes. The accuracy of segmentation determines the success rate of the analysis process.
2.3 Gabor Based Region Covariance Matrix
The significance of GRCM in the process of extracting the features is remarkably high as it assists in optimal detection of lesions with maximal accuracy. At GRCM, the discriminant information is extracted through convolution among the skin lesion image and a fixed of Gabor kernels initially through utilizing various scales, directions. At the end of circular, Gaussian wave in 2-dimentional Gabor wavelet is provided as,
Here, u is the direction of Gabor kernel and v is the Gabor kernel proportion. GRCM is able to catch mathematical and measurable belongings in input image. Formation of the covariance matrix is contributed by pixel location and Gabor coefficient. A few component subordinates are removed from the image by applying GRCM. Some ongoing advances are additionally made in Gabor stage data to recover the highlights in a successful manner.
Gabor based RCM mapping is figured by the condition,
Gabor based GRCM for region R,
Calculation of
For the description of area color, texture and shape are utilized. Texture is the important function to identify and classify objects. Contrast, homogeneity, dissimilarity, energy and entropy are utilized for describing texture. Change in intensity is measured by texture images using GRCM.
Contrast: It gauges the differentiation by joining pixel and the nearby value. This process is done by the subsequent condition,
Energy: For a steady image, energy esteem sets to 1. It restores the aggregate of squared component. It is determined by utilizing,
Homogeneity: It gauges the tightness of element distribution. The value range is 0∼1.
Correlation: It quantifies a pixel to their neighboring values. For an ideal positive and negative correlation, it ranges from −1 to 1.
Entropy: It is utilized to portray the surface of lesion image. When all elements of the covariance matrix remain constant, its value remains high. The calculation is as follows,
These insights give data about the surface of a picture.
2.4 Hybrid PSO-Whale Optimization
The introduction of hybrid PSO-whale optimization delivers optimal results than other optimization since it owns plenty of advantageous elements like maximal convergence speed, easy computation, simple structure and maximal efficiency. This is the most developed calculation for the selection of feature. This is an iterative strategy that improves the issue by repeatedly attempting to upgrade arrangements against the acquired quality measurements. In order to perform optimization, hybrid optimization techniques are used. In order to alleviate the problems caused by conventional PSO, the technology uses a minimum number of secondary populations and updates the strategy to generate new speed and depth feature search. Retrieving important features that represent the depth and location of the affected area of melanoma is a difficult task.
The PSO calculation depends on the social and intellectual practices of members in the group. This algorithm is very popular because of sharing simple data and calculation. In this PSO, algorithm is dispersed in a multi-dimensional pursuit space, where every individual speaks to an applicant. The estimation of every arrangement depends on the exhibition capacity of the issue. Here, particle motion is influenced by two key factors, which use inter-particle information and iterate to iterative information.
G Best and P Best
In the G best model, each particle that forms a group has information about the current position and velocity in the solution space, so far of itself as P best and of an entire multitude as G best. Each particle points a worldwide ideal arrangement utilizing current speed, P best and G best.
Expression of G best model is given as,
where, velocity and position are mentioned as v and x, i and j as particle number and direction, random numbers are given as
The Pbest arrangement, is put away in particle memory because of emphasis to iteration to iteration data among various particles. In multi-dimentional research space, the i-th molecule position yet speed by accompanying m-dimensional vectors,
Velocity of ith particle is given as,
where, congnitive and social scaling parameters are expressed as
The objective of the WOA is to consider the situation of inquiry space that streamline the target capacity of the advancement issue. If there are N whales called agent i in iteration t, it is denoted as,
where, d as dimention,
The classification process is mainly divided into two steps, one is the training phase and another is the testing phase. In the first stage of training, the known data are given and then in the next stage, some data sets are used to train the recommended system. In the second stage of the testing phase, unknown data is provided and then the clustering classifier is used to perform classification after training. Feature vectors are converted from the previous stage features at this stage. Thus, the obtained feature vectors are utilized to distinguish among microcalcifications, external masses that are classified further as benign or malignant or normal.
PNN classifier delivers accurate prediction with fast convergence and the parellel structure of PNN significantly aids in providing optimal outcomes. The computation heap of the preparation stage is moved to the assessment stage, which is the principle recognizing highlight of PNN. PNN has input, pattern, summing and output layer. PNN supports multiple classifications. At the point when the info is introduced to the organization, the underlying layer ascertains the seperation between the information vector and the learning vector. The subsequent layer figures the total of these commitments for each class of sections to create at its yields a vector of probabilities. At last, an exchange work at the output of the subsequent layer takes the limit of these propabilities and produce 1 for this class and 0 for other classes. Therefore, the input of vector class of the probabilistic neural network in the possibility category with the highest accuracy is the extension of the radial basis transfer function. The PNN structure is given in Fig. 3.
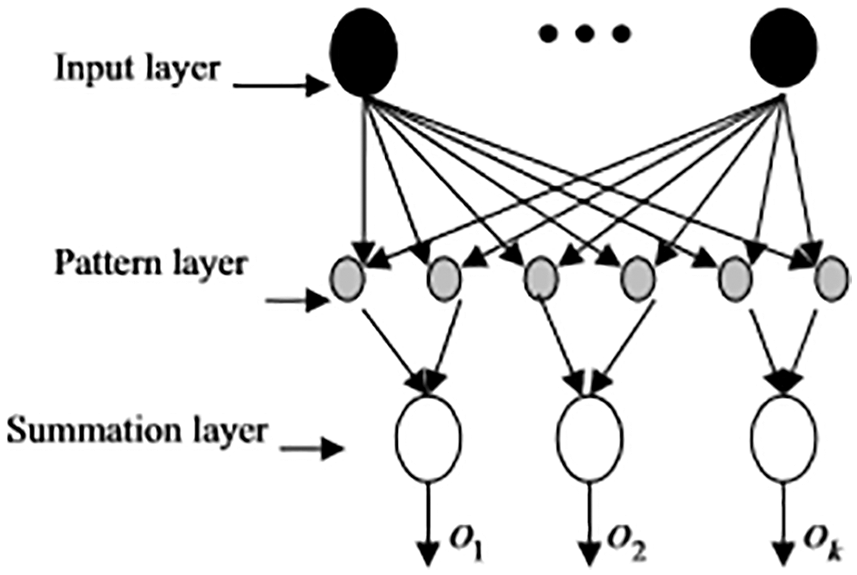
Figure 3: Structure of PNN
PNN utilizes radial and circular gaussian function fixated on each learning vector. The likelihood that a vector has a place with a specific class can be signified as,
where, number of classes as i, number of forms as j,
where, i as the class of
If the value of the derived feature value is equal to any training amount, then each extracted feature value of the test image is converted into each training example feature value. The example records the probability of the particular training example.
The proposed characterization model is executed in MATLAB environment. The input dermocopsy images are gathered from the Kaggle dataset. All images with a size of 256 * 256 are paired with an expert manual to effectively track the boundaries of skin lesions. According to the severity of the disease, many samples are retrieved and classified. In order to perform classification, it goes through several processes to have a high-level classification.
To enhance the standard of the input image preprocessing is performed. At first, the input image of skin lesions is converted from RGB to grayscale image. Through this process, denoised and resized images are obtained by using Gabor filter. The Gabor filter works well in removing distorted frequency bands from the skin lesion image and it allows other frequencies to pass through with minimal loss. This process helps to achieve a higher recognition rate and enhance the operation of the data set. The input image of skin lesion is illustrated in Fig. 4 and the filtered image is given in Fig. 5 in an efficient manner.
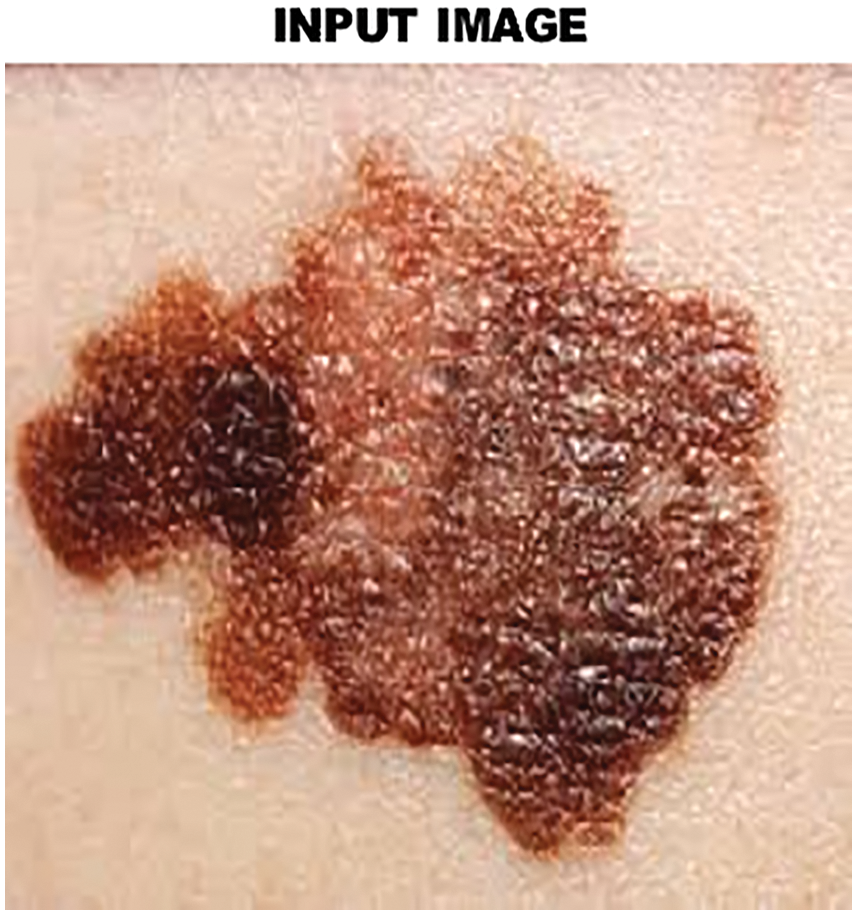
Figure 4: Input image of skin lesion
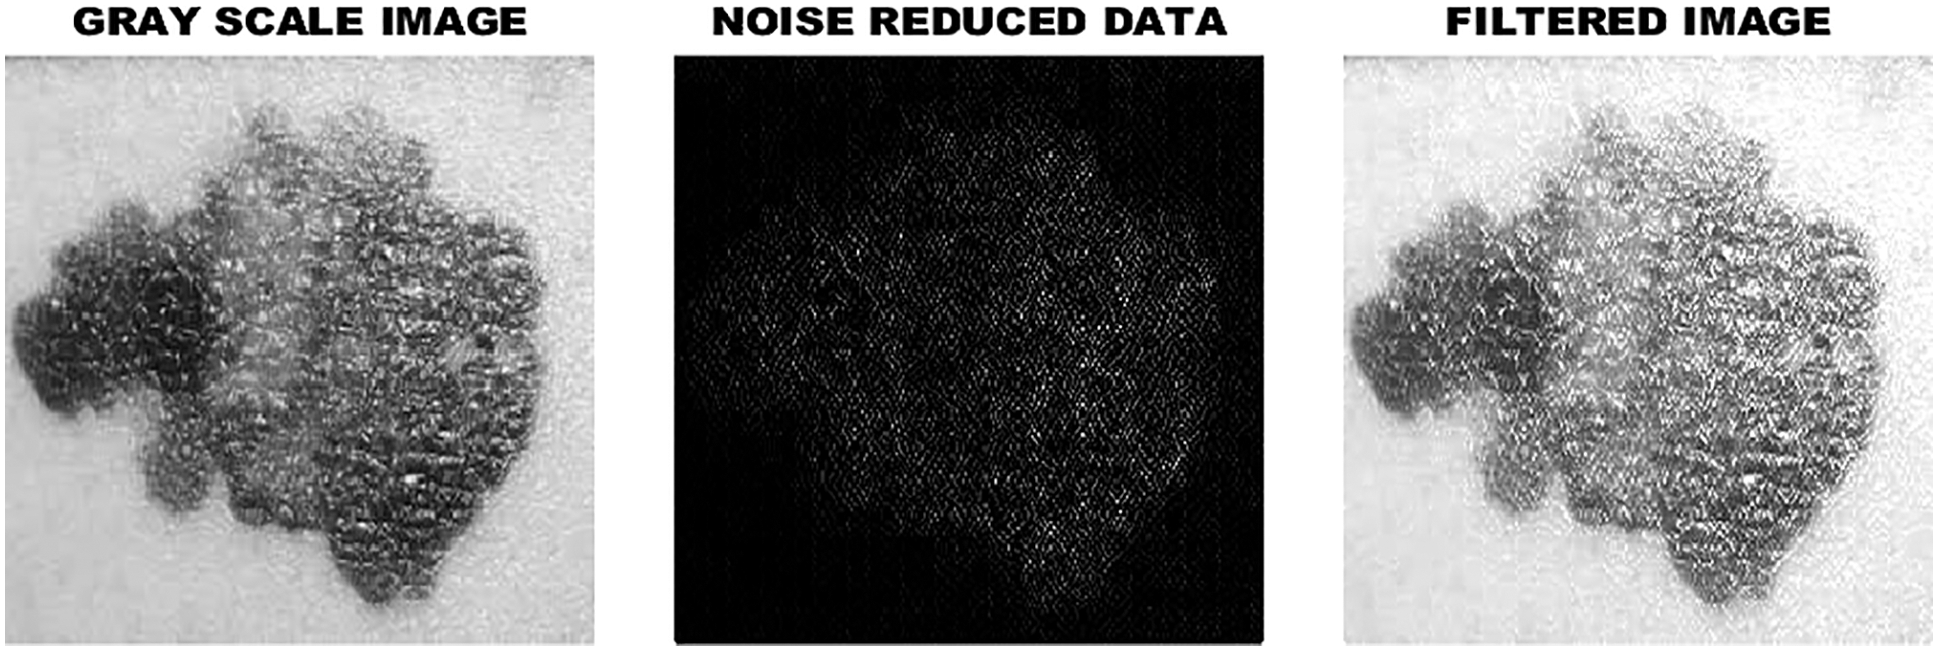
Figure 5: Filtered image
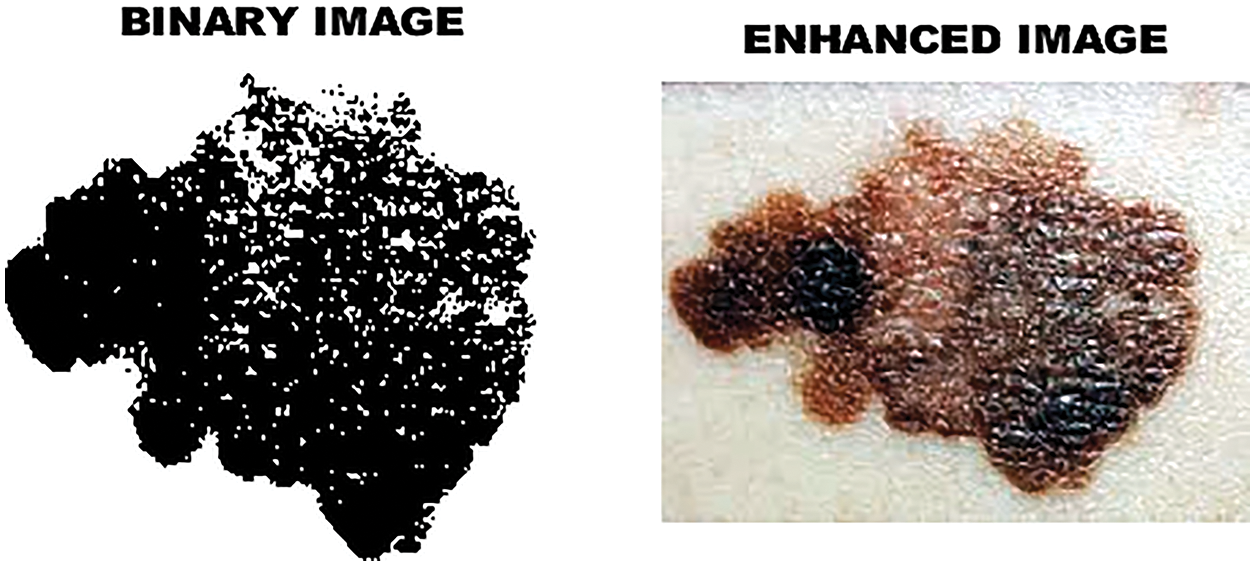
Figure 6: Enhanced image
Histogram representation of binary image is given in Fig. 7.
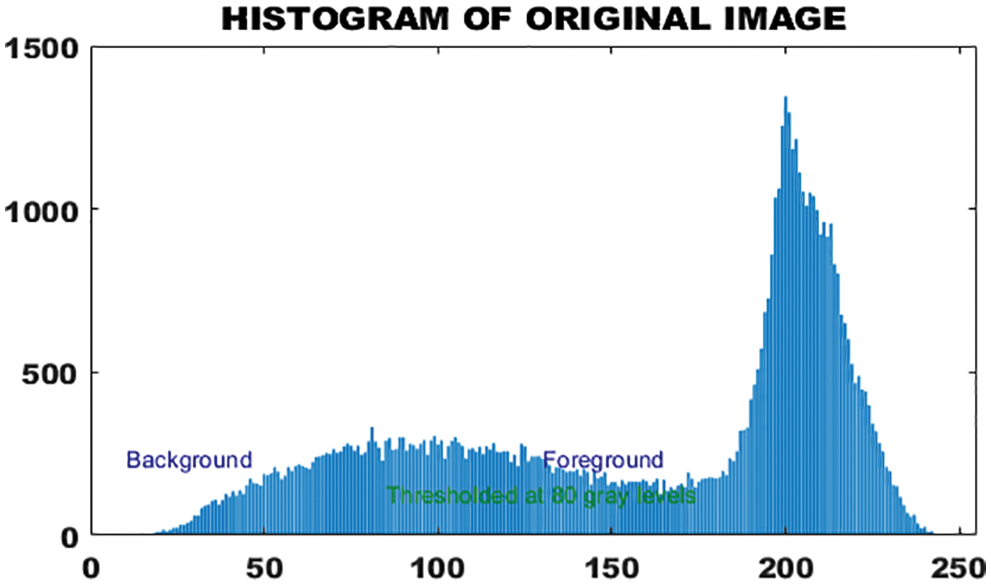
Figure 7: Histogram of original image
The output of clustered image is portrayed in Fig. 8 whereas the melanoma in the segmented image is highlighted in Fig. 9.
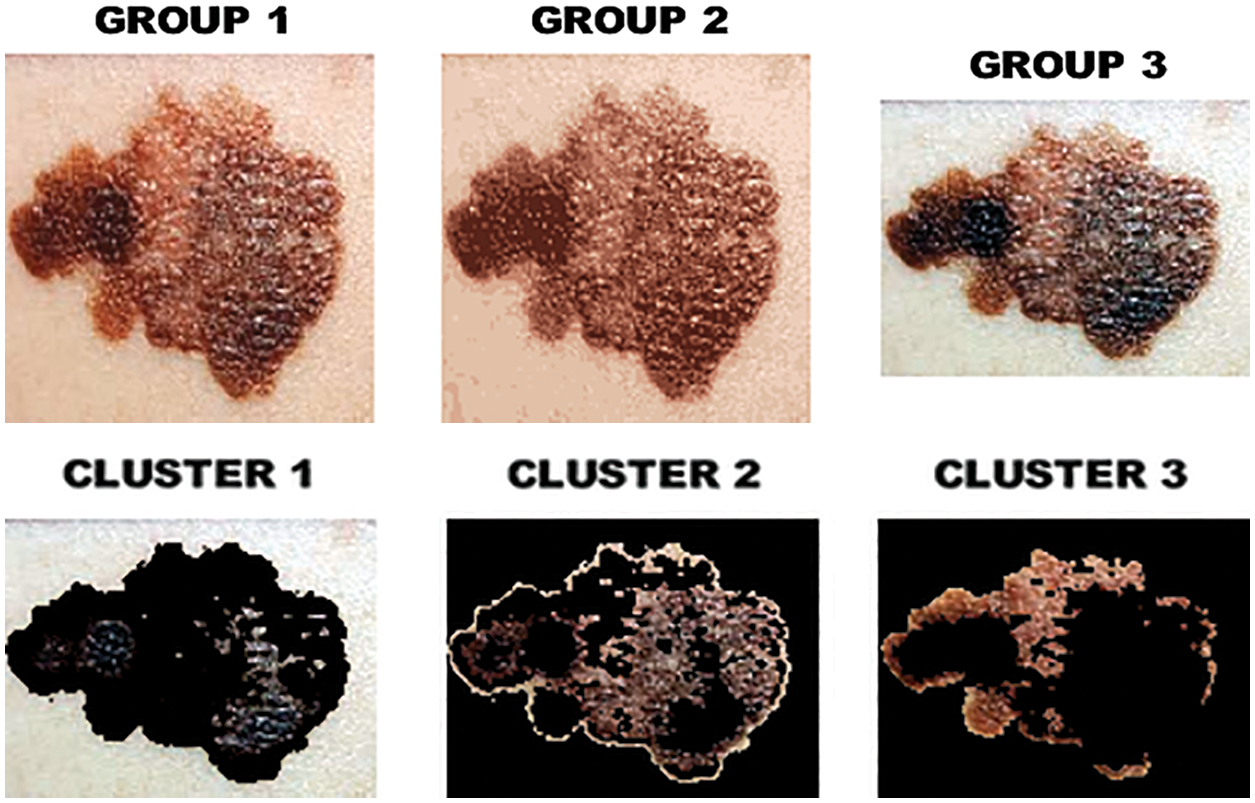
Figure 8: Clustered image
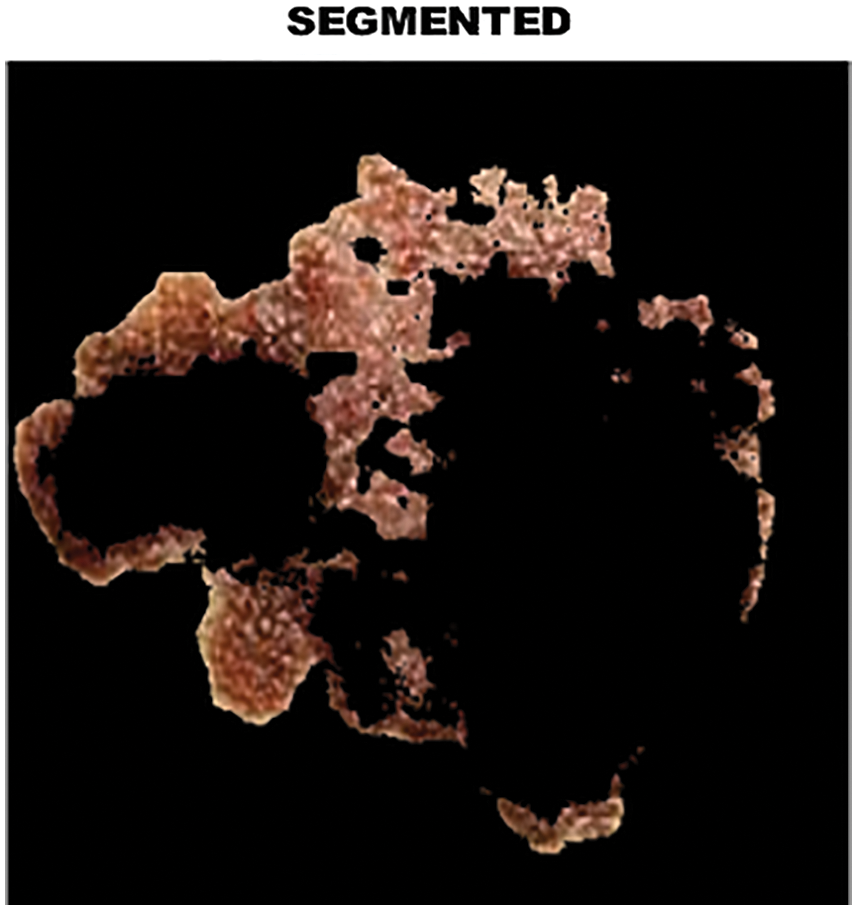
Figure 9: Analysis of melanoma in segmented area
The histogram feature is also called the amplitude feature. In grayscale images, it provides a clear and valuable representation of intensity levels. Segmentation deals with the attributes that pixel in the segmented area must satisfy. The histogram provides an image average gray value that represents the average intensity of the image. The morphological features of skin lesions help to characterize the type of tumor. Although the histogram of the binary image is quite reasonable in the classification of skin melanoma, this function alone is not enough because it has less information for deterministic melanoma classification.
Segmentation is the process of dividing objects into clusters. Segmentation is performed to extract objects and other corresponding information. It has to be be noted that the segmentation results of training and test data are not compromised. It helps the radiologists to detect important and suspicious structure.
To avoid the invasive biopsy methods, important morphological features of dermoscopy images need to be extracted. Since the difference between normal and melanoma skin lesions is small, it is very difficult to separate variations using visual perception. Some statistical characteristics were recovered. 12 features are calculated to estimate the diseased area, which helps to classify and better identify skin lesion images. Kurtosis and skewness are the best fit of the data. The skewness and kurtosis values seem to depend very much on the sample size. In the event that the kurtosis value is close to 0, it is normally distributed. If it exceeds +1, the distribution will reach a peak; if it is less than −1, the distribution is considered too flat. If the distribution is exaggerated, treat theses criteria as anomalies.
Hybrid PSO-whale optimization is used to further optimize the characteristics of skin lesions. PSO-whale is the optimal model. The melanoma classifier was used to analyze skin lesions. The segmented region using feature extraction and the retrieved parameters helps image classification. The proposed PNN classifier helps to distinguish cancer types and find abnormal stages. The initial training rate is 0.01, then decreased by 0.1. In classification, if the derived feature value is found to be similar to any training data, it will associate the individually retrieved feature and record a specific training data set. The lesions are classified in this system, as normal, bengin else melanoma.
In image segmentation, the threshold plays an significant role. It helps to obtain the clarity of the image. By choosing the threshold value, the grayscale image can be converted into a binary image. Two important modes are object pixels and background pixels. So as to isolate the object from the background, a threshold is performed. On the off chance that the pixel esteem is higher than the threshold, it is displayed as a bright spot. If the gray pixels are less than the threshold, the image will appear as dark dots. The binary image and the enhanced image are Fig. 6, and the binary image obtained by the threshold is shown in Fig. 7. The advantage of reterieving binary images is that it minimizes the complexity and reduces the process of recognition and classification. Analyze the shape, size, position and direction of the image in a two-dimensional space of effectively identify and classify tumors in skin lesions.
Performance Metrics
The performance of the PNN classifier is compared with the existing SVM and Deep Neural Network (DNN) classifiers. When simulated with other classifiers, the proposed classifier shows strong tolerance to input noise, is easy to execute and minimize the calculation time. Accuracy, sensitivity and specificity are evaluated in an optimal manner.
The PNN classifier shows a high accuracy of 97.83%. Sensitivity and specivicity assumes a significant function in deciding the accuracy.
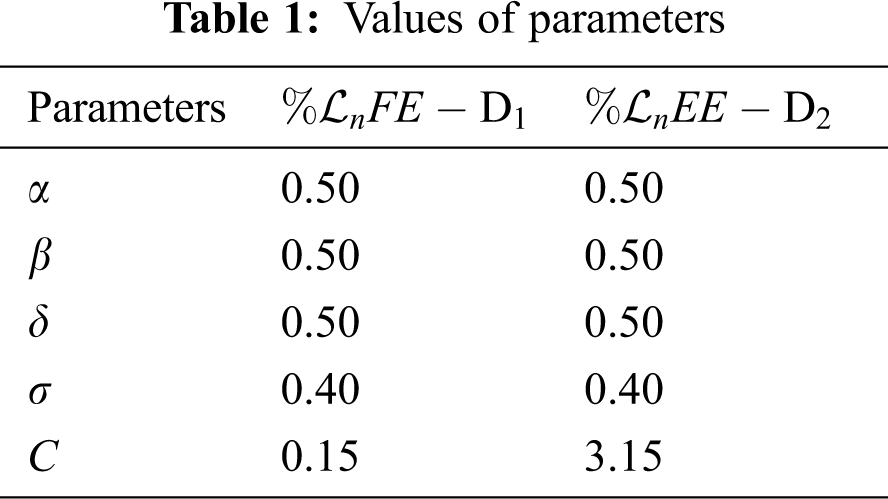
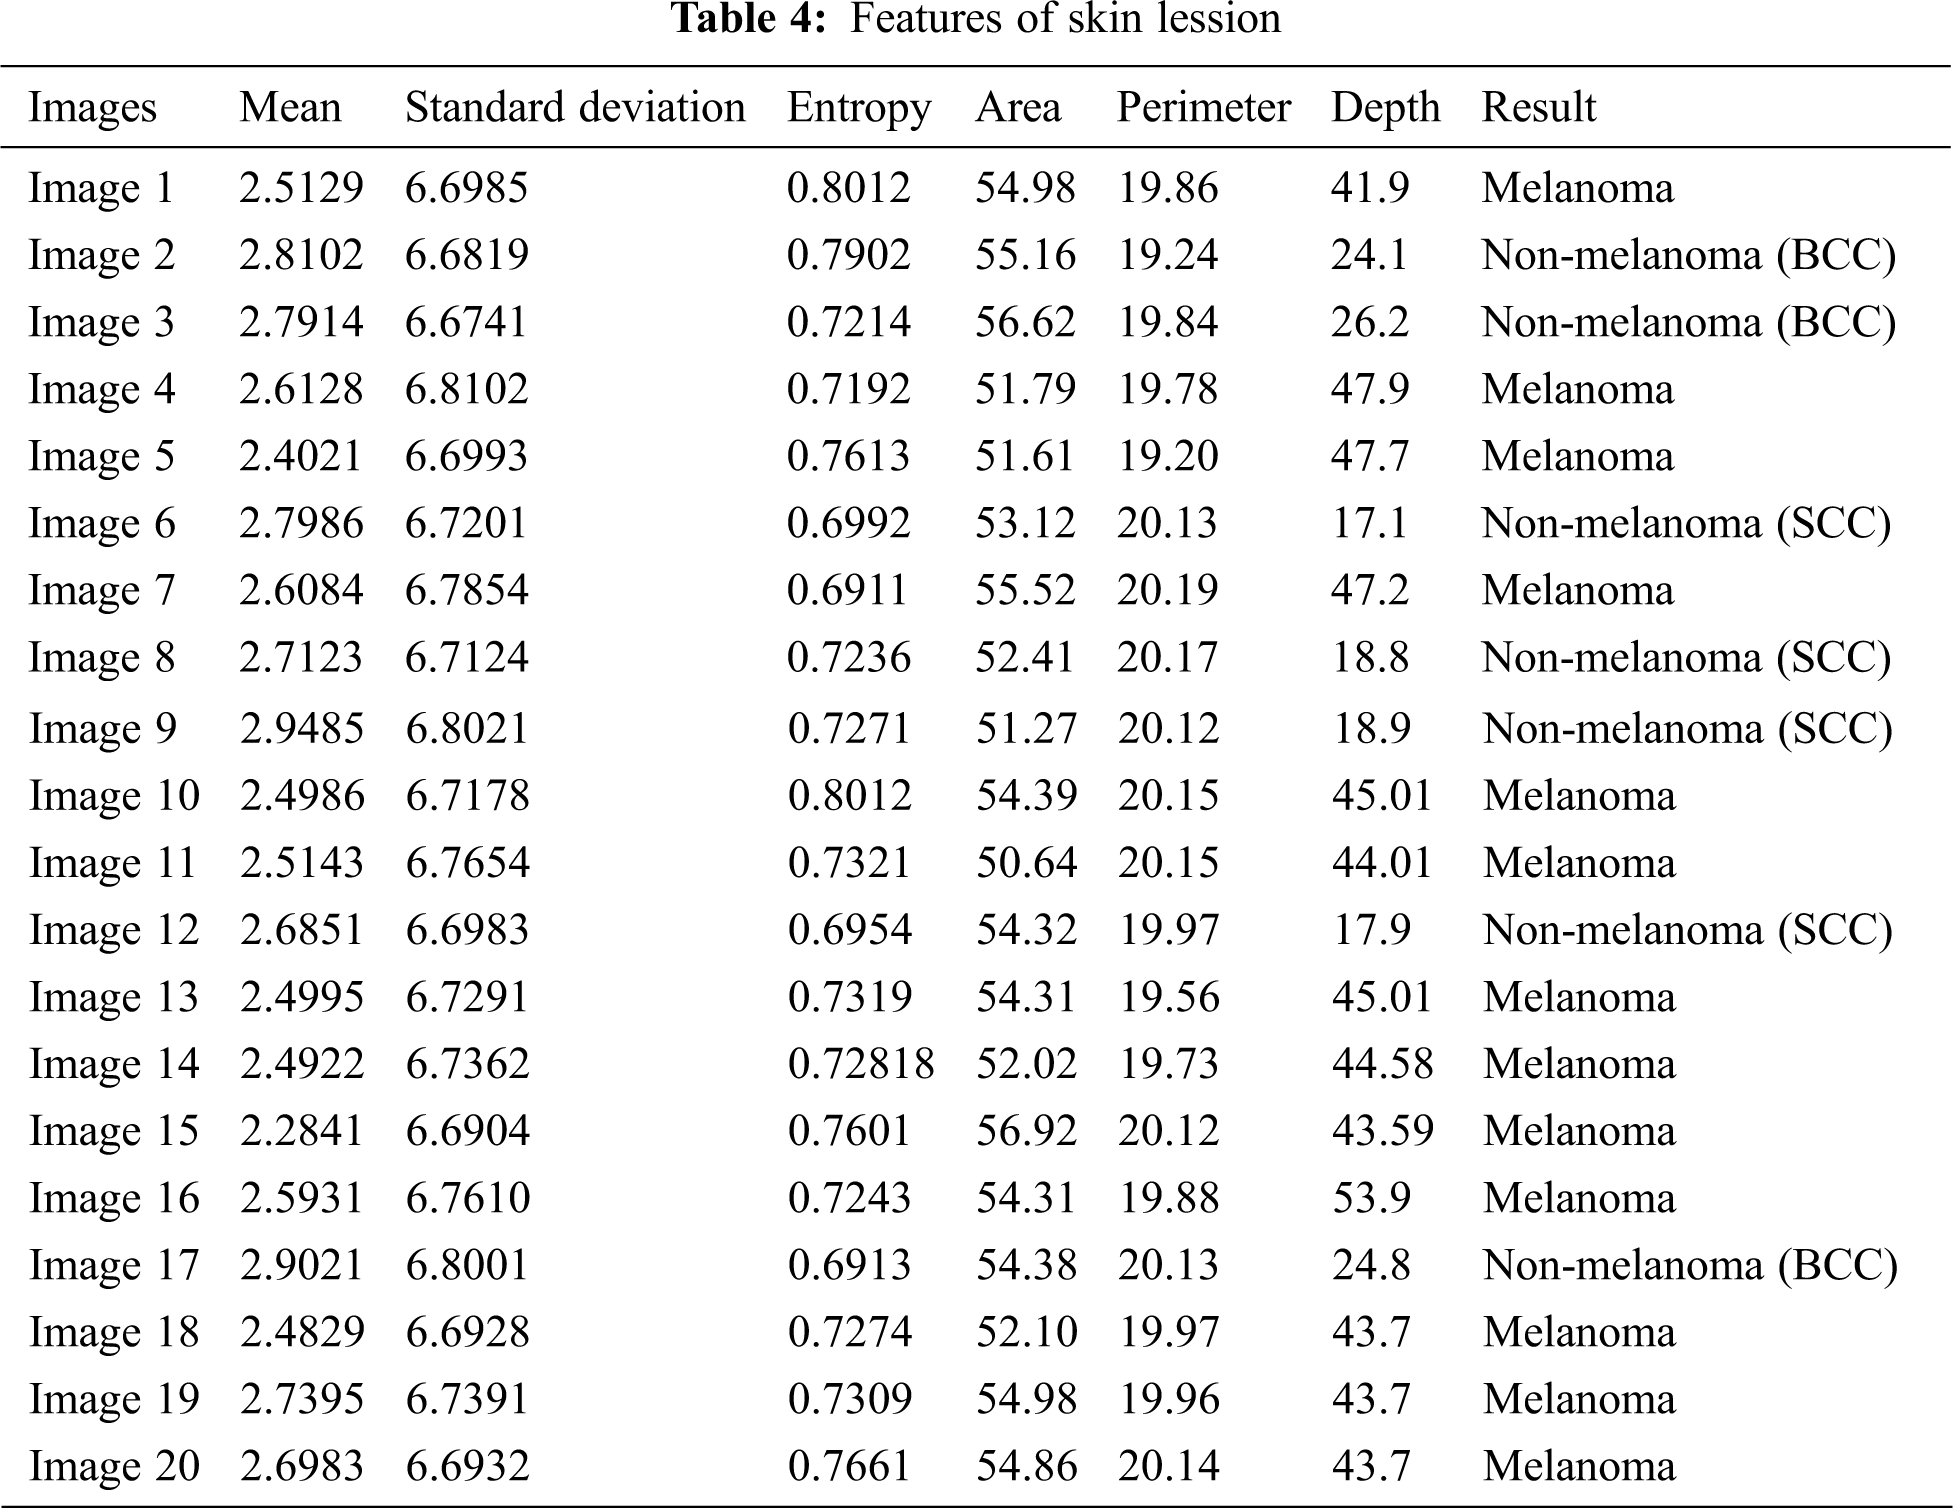
The comparative analysis of the performance metrics of the introduced classifier is significantly highlighted through Fig. 10 to Fig. 12 and Tab. 1 to Tab. 3. The features extracted through GRCM are listed out in Tab. 4.
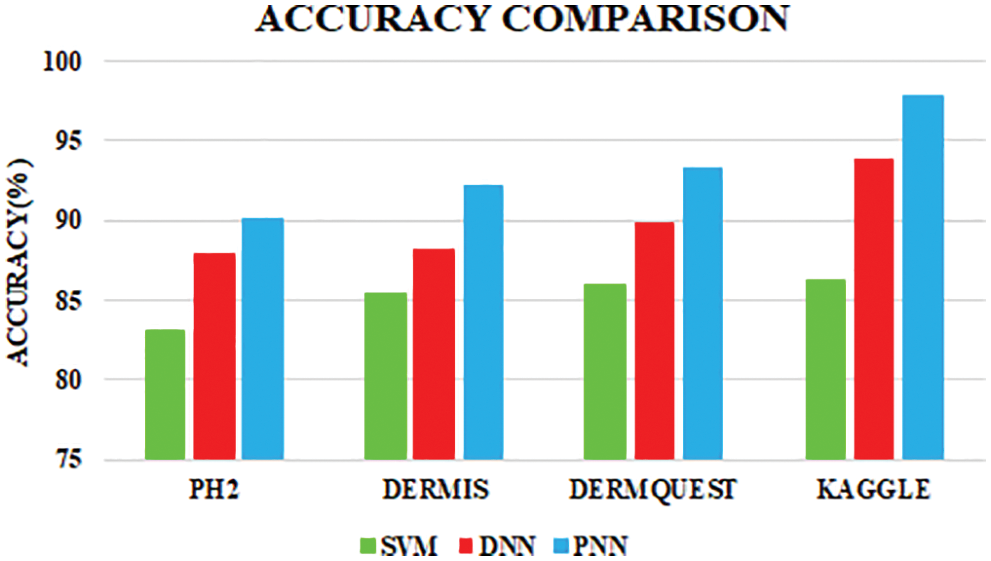
Figure 10: Accuracy comparison
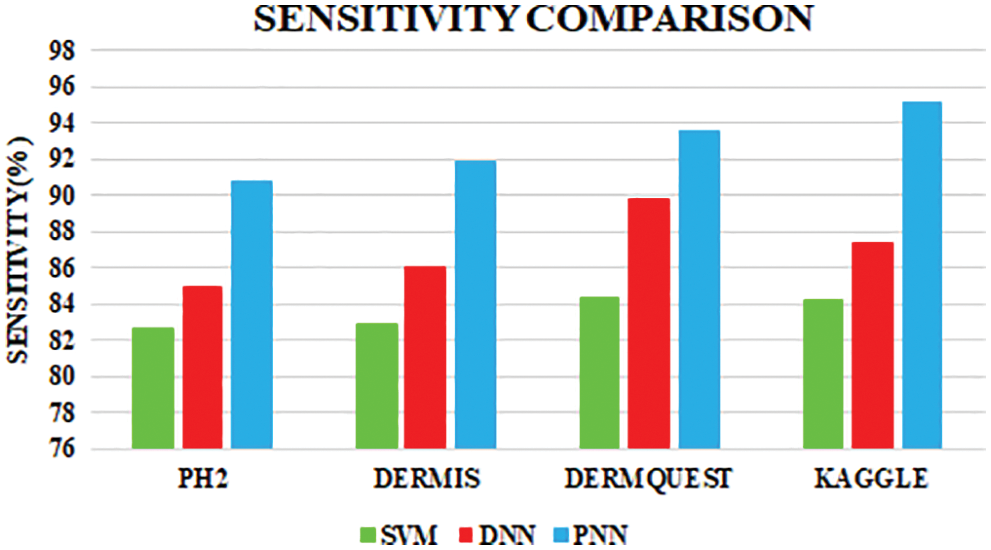
Figure 11: Sensitivity comparison
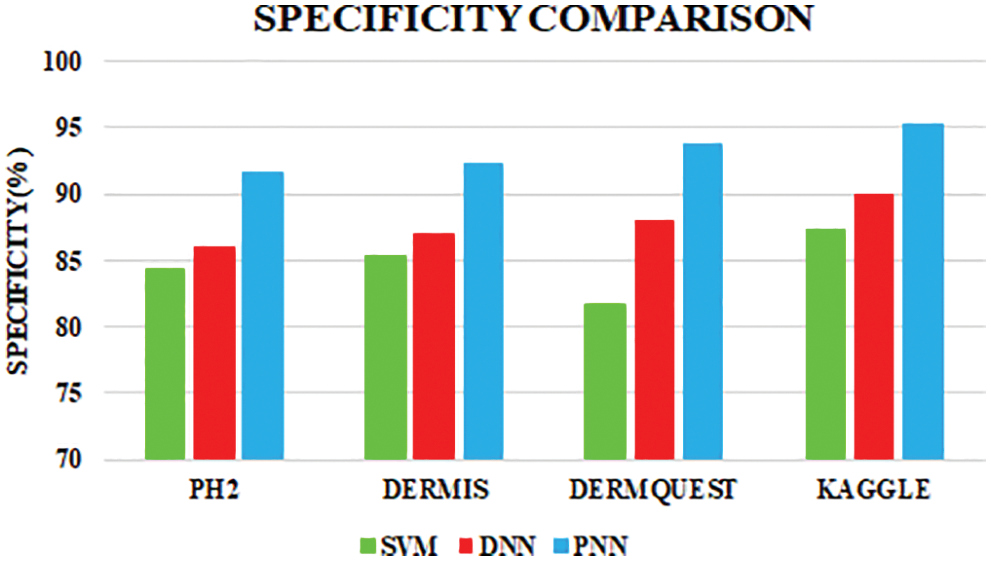
Figure 12: Specificity comparison
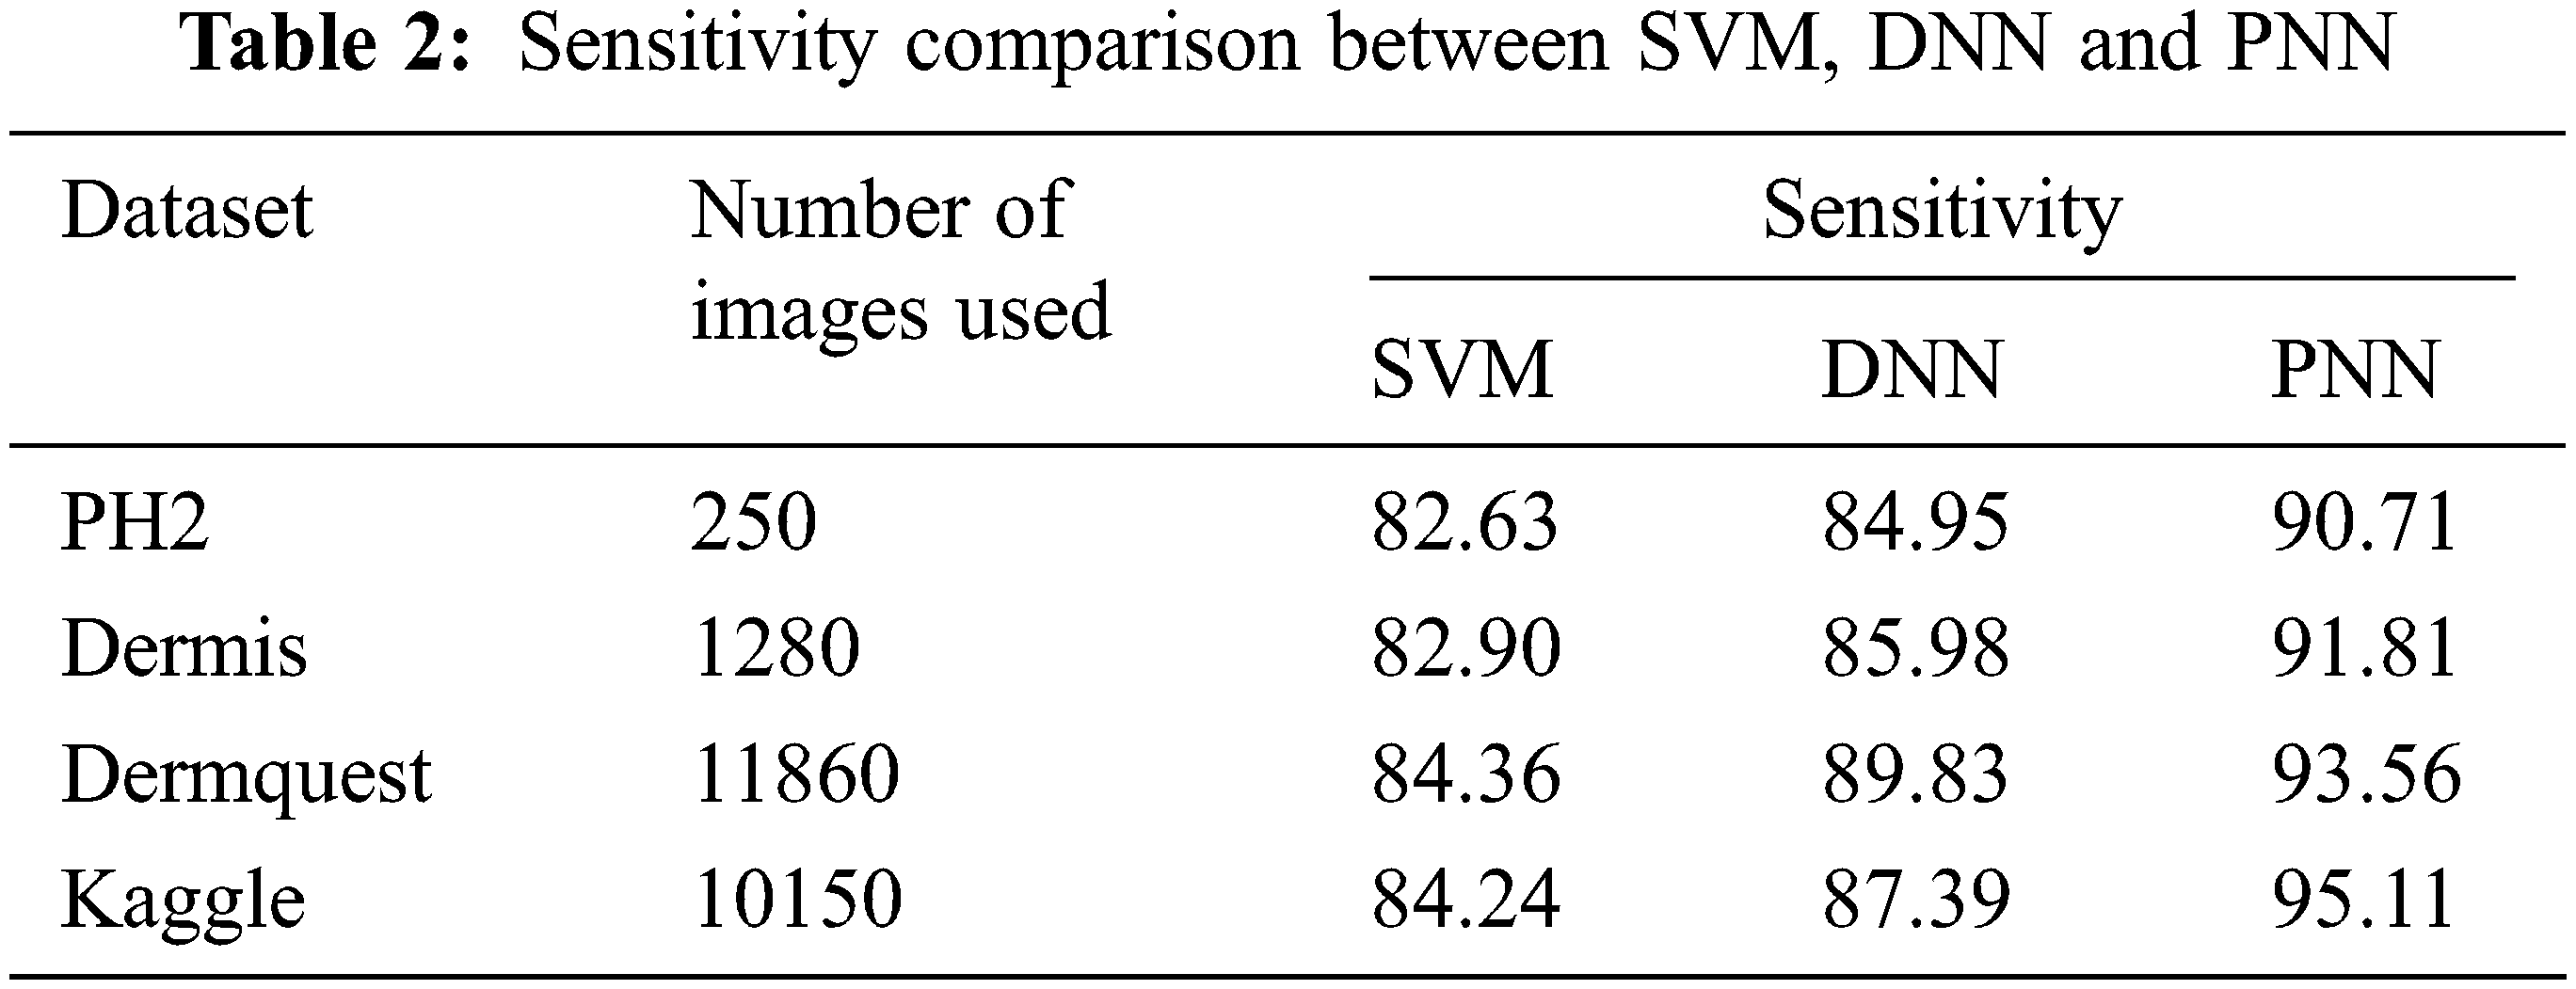
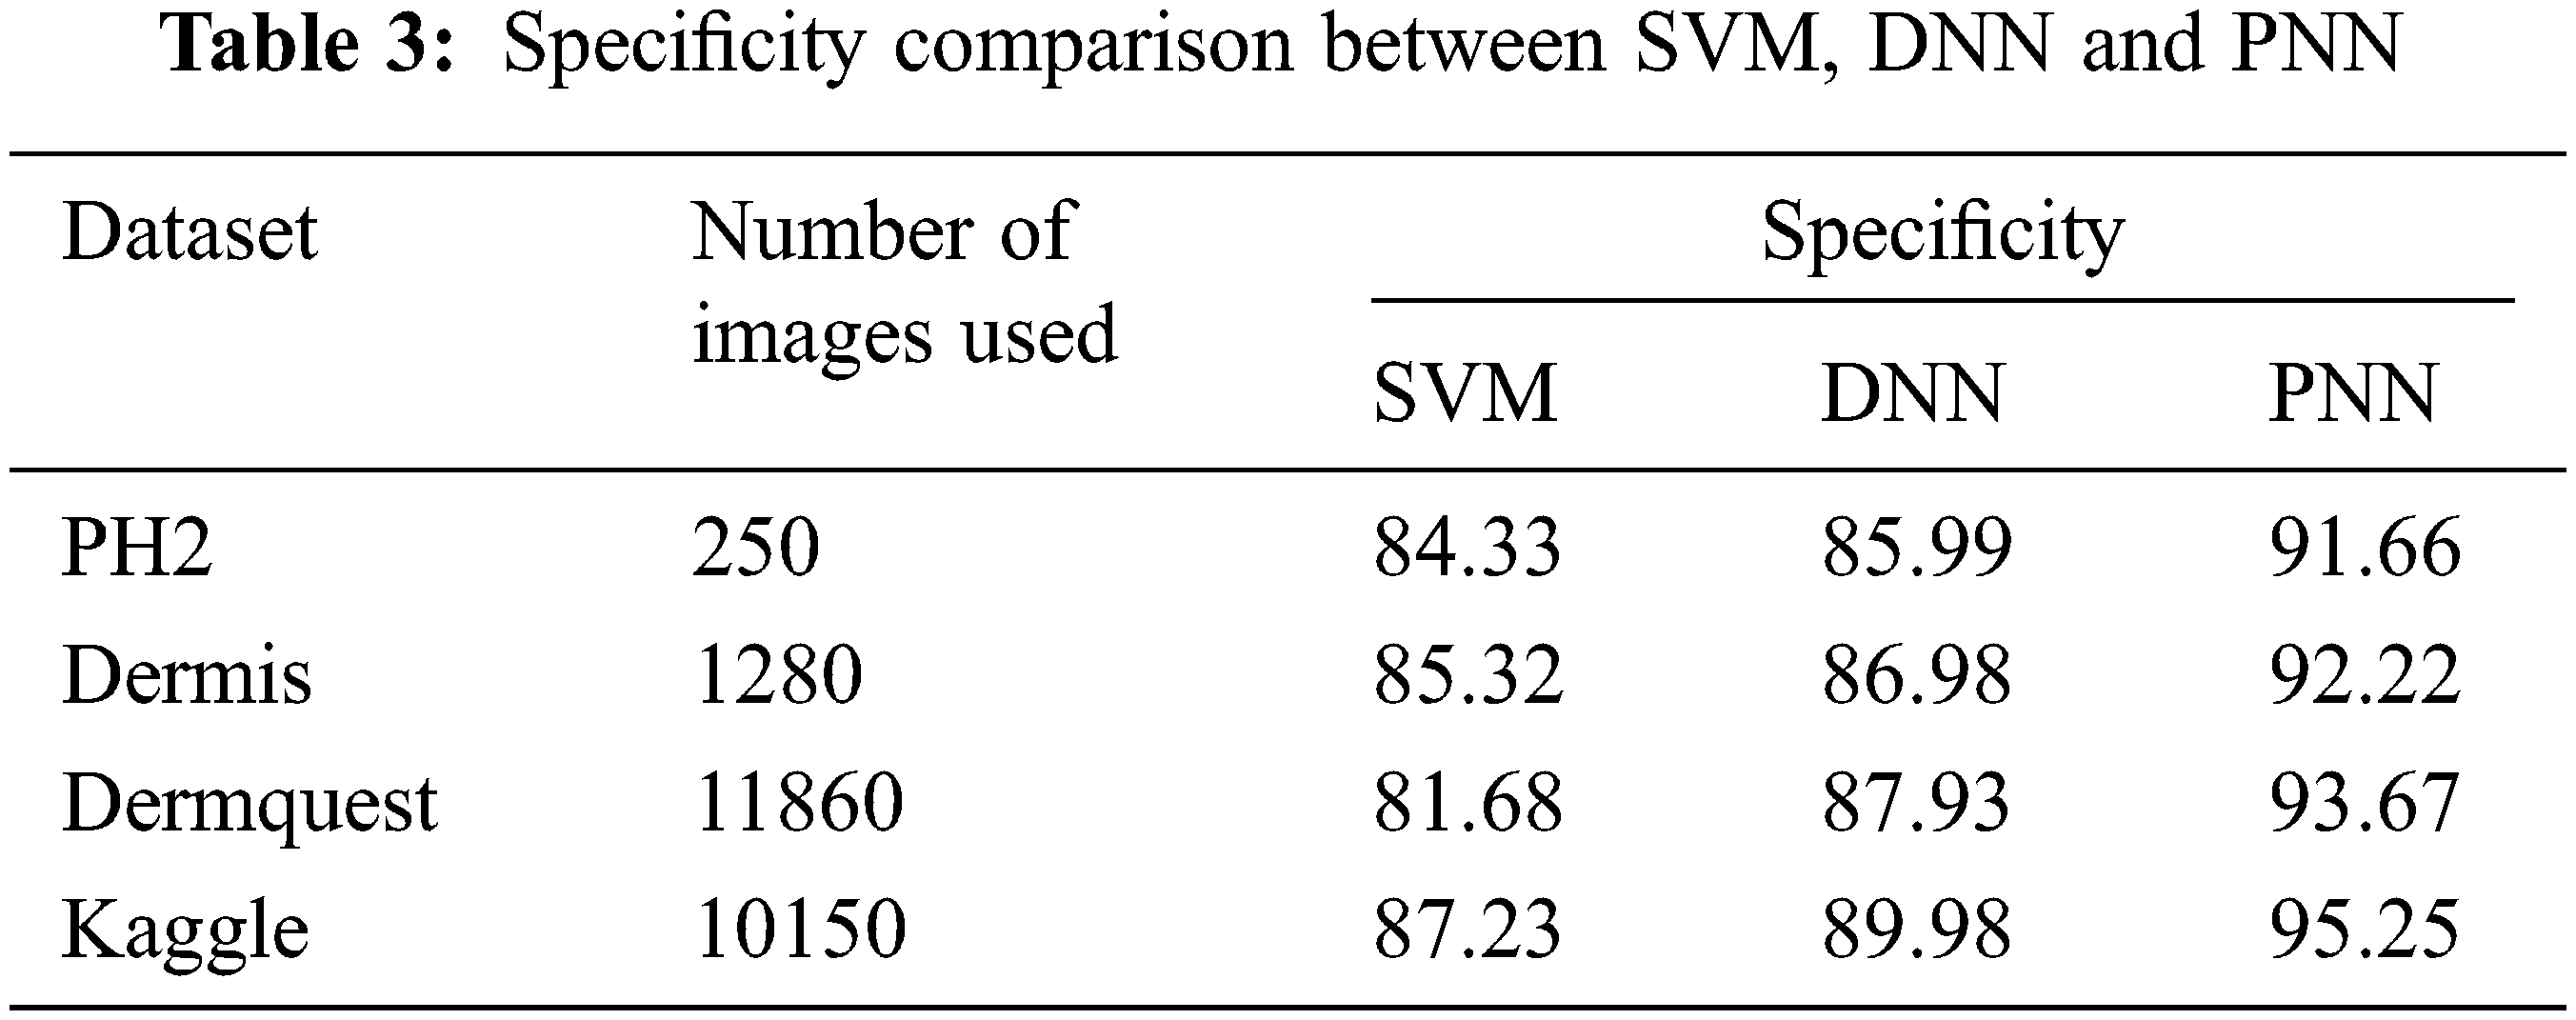
Sensitivity distinguishes the individuals who are influensed by illness. When the disease is found to be negative and the percentage of TP is all affected people, it helps to rule out the disease. The specificity shows the percentage of TN in all healthy people. TN stands for true negative and TP stands for positive.
The sensitivity accomplished by the PNN classifier was shown to be 95.11%.
The specificity accomplished by the PNN classifier was shown to be 95.25%. The input dermoscopy images (entities) are gathered in a table with their properties perceiving several attributes and their associated interrelation. Samples of 20 MELANOMA and benign skin lesion images are taken. Considering the values of area and perimeter, the size of depth greater than 30 mm are regarded as melanoma, the depth size that ranges between 20–30 mm are considered as BCC and those values which are less than 20 mm are taken as SCC.
The classification result of the dermoscopy image depends on several attributes like mean, standard deviation, Entropy, area, perimeter and Depth. The texture features are measured in mm scale.
In the results, some images are non-melanoma as their area value is large and depth is greater than 20. If two images whose area values are same, then one of them would results as MELANOMA whose depth value is comparatively higher than the other image. The inconsistency in image attributes occurs if the images have same value for area and Depth. In such situations, the classifier will consider other attributes like perimeter and Entropy. Hence it is necessary to concentrate every attributes until all the images get classified. The magnitude of area value depends on the perimeter value and Depth value depends on Entropy. When more than two attributes are same, the classifier will segregate the images based on other characteristics that form the part of subset.
An effective on-time detection of Skin cancer using image processing approach is introduced in this present study, which significantly assists in identifying the type and stages of melanoma in an optimal manner. In this system, the noises in the input image are remarkably eliminated with the aid of Gabor filter and the noise free image is then divided into multiple sections with the aid of Fuzzy C-Meand approach. In addition, the features in the extracted images are remarkably extracted through the implementation of GRCM approach whereas the optimal features among the extracted features are significantly selected through the hybrid optimization using PSO-whale optimization algorithm, which in turn enhances the reliability of detecting the cancer in the early stage. Then, the selected features are efficiently classified using the PNN classifier, which significantly minimizes the complexity of the training data in a wider range. The comparative analysis of the proposed work is carried out with SVM and DNN. The attained outcomes have validated that the introduced approach provides high accuracy of 97.83%, sensitivity of 95.11% and specificity of 95.25%. Which are comparatively optimal that the other existing approaches.
Funding Statement: The authors received no specific funding for this study.
Conflicts of Interest: The authors declare that they have no conflicts of interest to report regarding the present study.
References
1. G. Mansutti, A. T. Mobashsher, K. Bialkowski, B. Mohammed and A. Abbosh, “Millimeter-wave substrate integrated waveguide probe for skin cancer detection,” IEEE Transactions on Biomedical Engineering, vol. 67, no. 9, pp. 2462–2472, 2019. [Google Scholar]
2. A. Naeem, M. S. Farooq, A. Khelifi and A. Abid, “Malignant melanoma classification using deep learning: Datasets, performance measurements, challenges and opportunities,” IEEE Access, vol. 8, pp. 110575–110597, 2020. [Google Scholar]
3. S. S. Mahmouei, M. Aldeen, W. V. Stoecker and R. Garnavi, “Biologically inspired QuadTree color detection in dermoscopy images of melanoma,” IEEE Journal of Biomedical and Health Informatics, vol. 23, no. 2, pp. 570–577, 2018. [Google Scholar]
4. H. Arab, L. Chioukh, M. D. Ardakani, S. Dufour and S. O. Tatu, “Early-stage detection of melanoma skin cancer using contactless Millimeter-wave sensors,” IEEE Sensors Journal, vol. 20, no. 13, pp. 7310–7317, 2020. [Google Scholar]
5. M. Sadeghi, T. K. Lee, D. McLean, H. Lui and M. S. Atkins, “Detection and analysis of irregular streaks in dermoscopic images of skin lesions,” IEEE Transactions on Medical Imaging, vol. 32, no. 5, pp. 849–861, 2013. [Google Scholar]
6. R. Ashraf, S. Afzal, A. U. Rehman, S. Gul, J. Baber et al., “Region-of-interest based transfer learning assisted framework for skin cancer detection,” IEEE Access, vol. 8, pp. 147858–147871, 2020. [Google Scholar]
7. L. Wei, K. Ding and H. Hu, “Automatic skin cancer detection in dermoscopy images based on ensemble lightweight deep learning network,” IEEE Access, vol. 8, pp. 99633–99647, 2020. [Google Scholar]
8. L. Yu, H. Chen, Q. Dou, J. Qin and P. A. Heng, “Automated melanoma recognition in dermoscopy images via very deep residual networks,” IEEE Transactions on Medical Imaging, vol. 36, no. 4, pp. 994–1004, 2016. [Google Scholar]
9. S. Pathan, V. Aggarwal, K. G. Prabhu and P. C. Siddalingaswamy, “Melanoma detection in dermoscopic images using color features,” Biomedical and Pharmacology Journal, vol. 12, no. 1, pp. 107–115, 2019. [Google Scholar]
10. A. R. H. Ali, J. Li and G. Yang, “Automating the ABCD rule for melanoma detection: A survey,” IEEE Access, vol. 8, pp. 83333–83346, 2020. [Google Scholar]
11. M. Goyal, A. Oakley, P. Bansal, D. Dancey and M. H. Yap, “Skin lesion segmentation in dermoscopic images with ensemble deep learning methods,” IEEE Access, vol. 8, pp. 4171–4181, 2019. [Google Scholar]
12. S. Díaz, T. Krohmer, A. Moreira, S. E. Godoy and M. Figueroa, “An instrument for accurate and non-invasive screening of skin cancer based on multimodal imaging,” IEEE Access, vol. 7, pp. 176646–176657, 2019. [Google Scholar]
13. H. de Souza Ganzeli, J. G. Bottesini, L. de Oliveira Paz and M. F. S. Ribeiro, “Skan: Skin scanner-system for skin cancer detection using adaptive techniques,” IEEE Latin America Transactions, vol. 9, no. 2, pp. 206–212, 2011. [Google Scholar]
14. Y. C. Lin, Y. J. Wang, J. C. H. Cheng and Y. H. Lin, “Contactless monitoring of pulse rate and eye movement for uveal melanoma patients undergoing radiation therapy,” IEEE Transactions on Instrumentation and Measurement, vol. 68, no. 2, pp. 474–482, 2018. [Google Scholar]
15. C. Liu, Y. Huang, J. A. Ozolek, M. G. Hanna, R. Singh et al., “SetSVM: An approach to set classification in nuclei-based cancer detection,” IEEE Journal of Biomedical and Health Informatics, vol. 23, no. 1, pp. 351–361, 2018. [Google Scholar]
16. K. Korotkov, J. Quintana, S. Puig, J. Malvehy and R. Garcia, “A new total body scanning system for automatic change detection in multiple pigmented skin lesions,” IEEE Transactions on Medical Imaging, vol. 34, no. 1, pp. 317–338, 2014. [Google Scholar]
17. A. Mirbeik-Sabzevari and N. Tavassolian, “Ultrawideband, stable normal and cancer skin tissue phantoms for Millimeter-wave skin cancer imaging,” IEEE Transactions on Biomedical Engineering, vol. 66, no. 1, pp. 176–186, 2018. [Google Scholar]
18. A. Keshavarz and Z. Vafapour, “Water-based terahertz metamaterial for skin cancer detection application,” IEEE Sensors Journal, vol. 19, no. 4, pp. 1519–1524, 2018. [Google Scholar]
19. H. Sun and R. Grishman, “Lexicalized dependency paths based supervised learning for relation extraction,” Computer Systems Science and Engineering, vol. 43, no. 3, pp. 861–870, 2022. [Google Scholar]
20. R. Amelard, J. Glaister, A. Wong and D. A. Clausi, “High-level intuitive features (HLIFs) for intuitive skin lesion description,” IEEE Transactions on Biomedical Engineering, vol. 62, no. 3, pp. 820–831, 2014. [Google Scholar]
21. H. Sun and R. Grishman, “Employing lexicalized dependency paths for active learning of relation extraction,” Intelligent Automation & Soft Computing, vol. 34, no. 3, pp. 1415–1423, 2022. [Google Scholar]
22. D. Caratelli, A. Massaro, R. Cingolani and A. G. Yarovoy, “Accurate time-domain modeling of reconfigurable antenna sensors for non-invasive melanoma skin cancer detection,” IEEE Sensors Journal, vol. 12, no. 3, pp. 635–643, 2011. [Google Scholar]
23. C. Barata, M. Ruela, M. Francisco, T. Mendonça and J. S. Marques, “Two systems for the detection of melanomas in dermoscopy images using texture and color features,” IEEE Systems Journal, vol. 8, no. 3, pp. 965–979, 2013. [Google Scholar]
24. G. Sforza, G. Castellano, S. K. Arika, R. W. LeAnder, R. J. Stanley et al., “Using adaptive thresholding and skewness correction to detect gray areas in melanoma in situ images,” IEEE Transactions on Instrumentation and Measurement, vol. 61, no. 7, pp. 1839–1847, 2012. [Google Scholar]
25. P. Mehta, K. Chand, D. Narayanswamy, D. G. Beetner, R. Zoughi et al., “Microwave reflectometry as a novel diagnostic tool for detection of skin cancers,” IEEE Transactions on Instrumentation and Measurement, vol. 55, no. 4, pp. 1309–1316, 2006. [Google Scholar]
26. P. Aberg, I. Nicander, J. Hansson, P. Geladi, U. Holmgren et al., “Skin cancer identification using multifrequency electrical impedance-a potential screening tool,” IEEE Transactions on Biomedical Engineering, vol. 51, no. 12, pp. 2097–2102, 2004. [Google Scholar]
27. T. T. Do, T. Hoang, V. Pomponiu, Y. Zhou, Z. Chen et al., “Accessible melanoma detection using smartphones and mobile image analysis,” IEEE Transactions on Multimedia, vol. 20, no. 10, pp. 2849–2864, 2018. [Google Scholar]
Cite This Article
 Copyright © 2023 The Author(s). Published by Tech Science Press.
This work is licensed under a Creative Commons Attribution 4.0 International License , which permits unrestricted use, distribution, and reproduction in any medium, provided the original work is properly cited.
 Downloads
 Citation Tools