
 Submit a Paper
 Propose a Special lssue
 Open Access
ARTICLE

Deep Learning Framework for the Prediction of Childhood Medulloblastoma
1 Department of Biomedical Engineering, Veltech Rangarajan Dr. Sagunthala R&D Institute of Science and Technology, Chennai, Tamil Nadu, India
2 Department of Electronics and Instrumentation Engineering, Saveetha Engineering College, Chennai, Tamil Nadu, India
3 Department of Information Technology, J.J. College of Engineering and Technology, Trichy, Tamil Nadu, India
4 Department of Information Technology, R.M.D Engineering College, Kavaraipettai, Chennai, Tamil Nadu, India
* Corresponding Author: M. Muthalakshmi. Email:
Computer Systems Science and Engineering 2023, 46(1), 735-747. https://doi.org/10.32604/csse.2023.032449
Received 18 May 2022; Accepted 19 October 2022; Issue published 20 January 2023
 View Full Text
 Download PDF
Abstract
This research work develops new and better prognostic markers for predicting Childhood MedulloBlastoma (CMB) using a well-defined deep learning architecture. A deep learning architecture could be designed using ideas from image processing and neural networks to predict CMB using histopathological images. First, a convolution process transforms the histopathological image into deep features that uniquely describe it using different two-dimensional filters of various sizes. A 10-layer deep learning architecture is designed to extract deep features. The introduction of pooling layers in the architecture reduces the feature dimension. The extracted and dimension-reduced deep features from the arrangement of convolution layers and pooling layers are used to classify histopathological images using a neural network classifier. The performance of the CMB classification system is evaluated using 1414 (10× magnification) and 1071 (100× magnification) augmented histopathological images with five classes of CMB such as desmoplastic, nodular, large cell, classic, and normal. Experimental results show that the average classification accuracy of 99.38% (10×) and 99.07% (100×) is attained by the proposed CNB classification system.Keywords
Medulloblastoma is a cancerous tumor that starts in the cerebellum (brain’s lower back part) in children. The main functions of the cerebellum are muscle movement, balance, and coordination. Over the past few years, most children will die due to CMB despite the advances in chemotherapy and radiation therapy. Currently, the interest involved in cancer research is focused on medical image analysis. An efficient deep learning architecture for CMB classification is discussed in [1]. It uses average pooling layers and an error correcting code classifier for the classification. The final prediction is based on the ensemble of selected pre-trained networks.
Transfer learning-based CMB classification is described in [2]. Different deep learning architectures, such as AlexNet and Visual Geometric Group (VGG), are analyzed using augmented images by the transfer learning approach. Both architectures employ the softmax function in the output layer for the prediction. A Support Vector Machine (SVM) classifier is also used for the classification. CMB classification by gene expression is discussed in [3]. It uses a single-layer neural network to reduce the genes for effective classification by applying thresholds to the weights. For brain cancer classification, artificial neural networks and logistic regression are employed in [4].
Texture analysis for CMB classification is described in [5,6]. Five different texture features include co-occurrence features, histogram features, run length features, Tamura features, local binary pattern features, and five different classifiers; SVM, K-nearest neighbour (KNN), distance-based classifier, decision tree, linear and quadratic discriminant classifiers are employed. The Texton-based classifier for the classification of anaplastic in CMB is described in [7]. The bag-of-word approach is utilized to model the Texton-based features extracted from the Haar wavelet and MR8 filter bank. The KNN classification system is employed for the classification.
Texture features are extracted from Laws, Lai et al. in [8] to classify MBs into anaplastic and non-anaplastic. The classification is based on random forests, and patch-based. A segmentation approach is discussed in [9] for the nodular type of MB. It uses a normalized cut algorithm and a random walk for better segmentation. Deep learning and textural-analysis based CMB classification are described in [10,11]. Three deep learning architectures, including MobileNet, DenseNet, and ResNet-50, are employed with wavelet features for effective classification. Discrete cosine transform and principal component analysis are used with the architectures for binary and multi-class classification.
A combination of learned features for the classification of histopathological images is discussed in [12]. It uses wavelet features learned using a supervised approach and Topographic Independent Component Analysis (TICA) features known from an unsupervised approach. A softmax classifier is used for the classification. Two different CNN architectures are employed in [13] for CMB classification. The architecture consists of 2-layer and 16-layers for extracting the deep features, and a softmax classifier is used for the classification.
A comparison of supervised and unsupervised techniques is discussed in [14] for the representation and classification of CMB. Different autoencoders, such as TICA, are used to represent the histopathological images in an unsupervised manner and convolution neural networks are employed in a supervised manner for the representation. A visual latent approach is discussed in [15] for interpreting CMB histopathological images. A Haar wavelet-based bag of histogram features is extracted, and then the latent-topic analysis model is developed using a semantic approach from the bag of features. This model can show the higher-level patterns in the histopathological images.
The objective of this research is to produce a solution for the classification of CMB using histopathological images. A novel, well-defined deep learning architecture with 10-layers is designed to achieve this goal. Also, three fully connected layers are employed to classify CMB into multi-classes. The organization of this research article is as follows: Section 2 explains the classification technique based on the proposed deep learning architecture without using a separate feature extraction module. Section 3 shows the preliminary results obtained by the proposed classification system and Section 4 presents the conclusions of the work and some suggestions for further work.
The proposed CMD classification system has two parts. In the first part, texture features are used to quantify the texture of histopathological images. The extracted texture features are used to design a classifier. The convolution filters in the deep learning architecture will extract defining features from each histopathological image. Each image is assumed to have distinctive characteristics that depend mainly on the sub-type of CMB. Supervised pattern recognition classifiers will be designed to identify the sub-type of CMB based on such features. In conventional deep learning architecture, a neural network in the fully connected layer acts as a pattern recognition classifier. The high-dimensional extracted features will be transformed into low-dimensional using the max pooling layer to improve the performance. Different optimization and error functions are employed to optimize the grading results and reduce the uncertainty associated with the neural network classifier. A 10-layer deep learning architecture is designed for CMB classification. Fig. 1 shows the proposed CMB classification system.
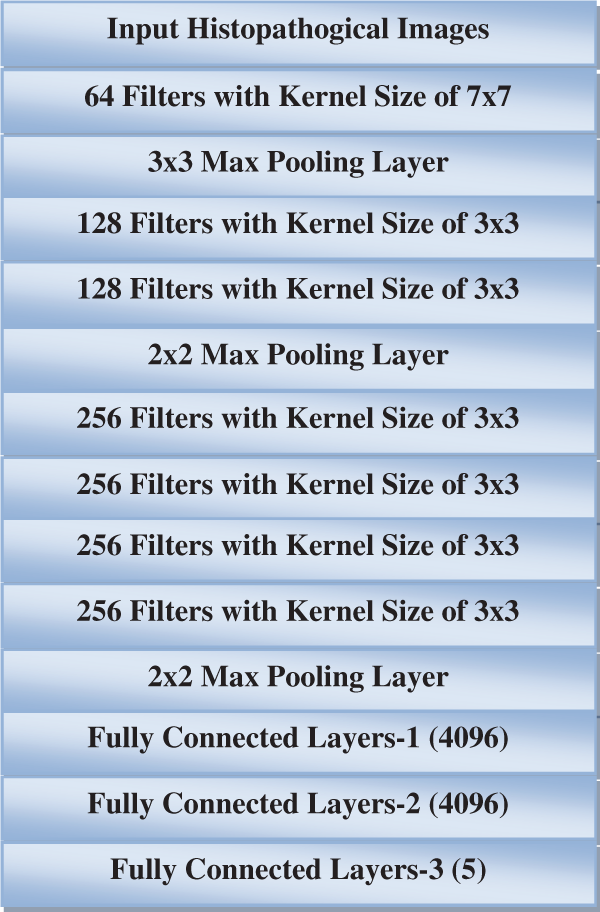
Figure 1: Proposed CMB classification system
Pattern recognition methods are divided into two categories: supervised classification (in which the labels or classes of the input samples are known), and unsupervised classification (in which the labels or classes of the input samples are unknown). A supervised classification system makes decisions on unresolved cases by learning from a group of samples that have already been classified. The primary objective of the CMB classification system is to convert a feature vector obtained via the proposed deep learning architecture into one of the five classes of CMB, such as desmoplastic, nodular, large cell, classic, and normal, with the highest possible degree of precision. As the proposed CMB system is a whole image classification image, the final output from the architecture is a class of CMB, not an image.
2.1 Function of Convolution Layer
Textures in histopathological images are deterministic by assuming that the neighborhood pixels are from macro texture elements, such as lines, spots, waves, and edges. To characterize deterministic texture in an image, different two-dimensional filters are employed. It is well known that different filters provide different texture patterns when convolving the input image with the convolution filters. The texture features extracted by the convolution operation have the exact dimensions as the input image when zero padding is applied. The convolution operation is defined by
where h is the convolution filter and y is the resulting matrix obtained by convolving h with the input image x. For a 3 × 3 convolution filter, m and n vary from [−1, 1]. In this work, the height and breadth movements are carried out using the default stride (1, 1) in two dimensions.
The pooling layer in the deep learning architecture maps the high-dimensional feature vectors from the convolutional layers to low-dimensional space. This work uses the max pooling layer to reduce the feature dimension. Introducing a pooling layer in any deep learning architecture has two purposes. First, it reduces the computation burden needed for classification by reducing the amount of data used to describe the image. Second, it simplifies the process of designing an accurate classifier. The max pooling layer has a stride of 2, which equals the layer’s depth. As a result, the input size has been reduced by half compared to its initial size. Fig. 2 shows the max pooling layer process. Fig. 3 shows the output of the convolved image and the max pooling layer output for a sample input image.
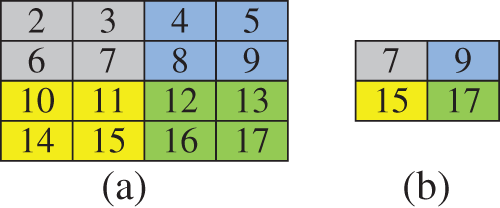
Figure 2: (a) high dimensional input sample (b) reduced dimension by max pooling layer
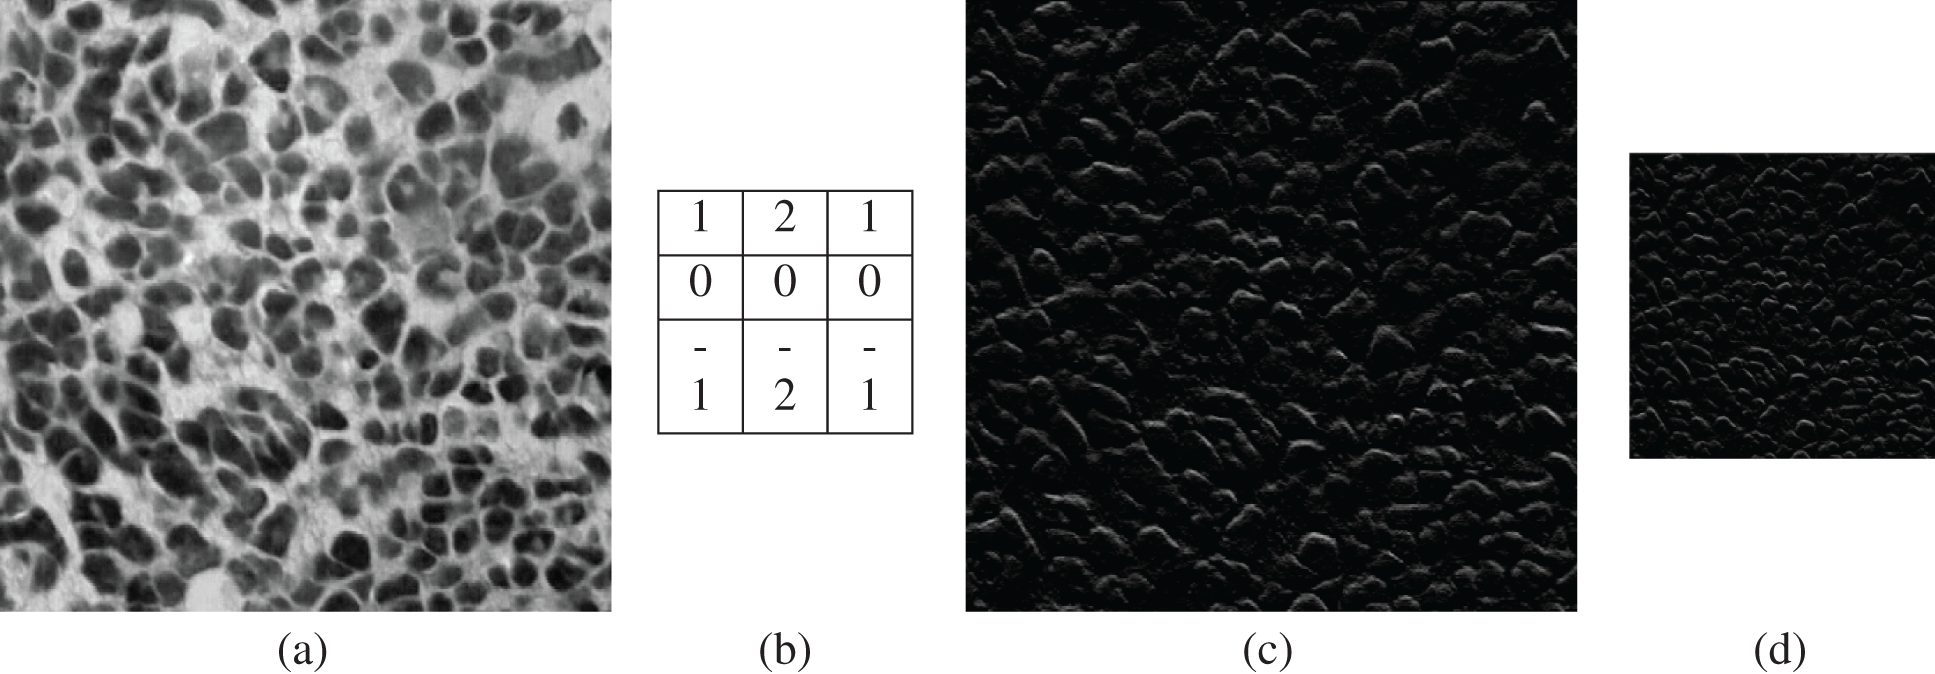
Figure 3: (a) Input image (b) convolution filter (c) convolved image (d) max pooling output
2.3 Function of Fully Connected Layer
This is the final layer where the classification takes place by a neural network classifier. Fig. 4 shows a fully connected neural network [16]. Depending on the categorization task, various neural network designs are used for classification purposes [17–20].
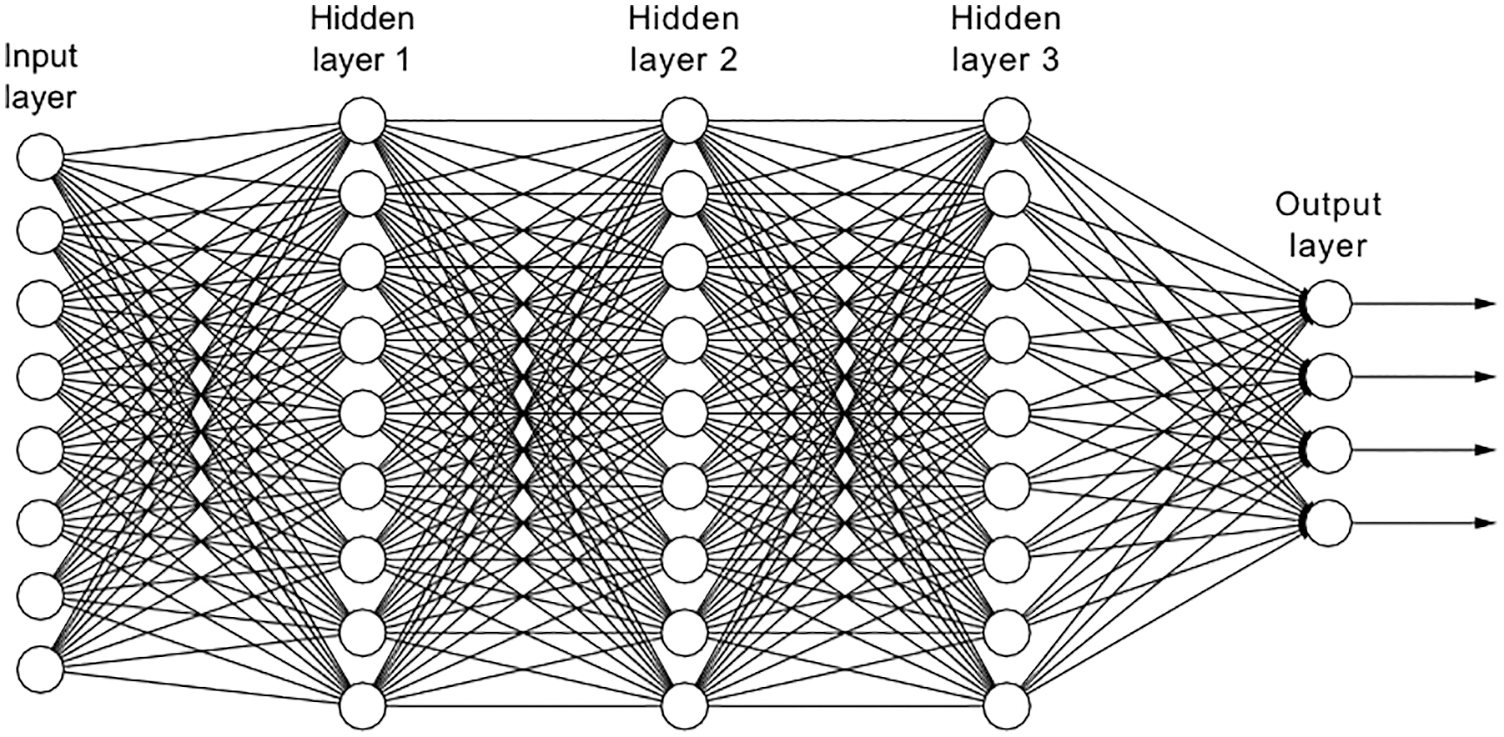
Figure 4: Neural network architecture-fully connected with three hidden layers
The input to the fully connected layer is patterns extracted from the combination of convolution and max pooling layers, and the system’s output is the class label of the sub-type of CMB. As shown in Fig. 4, any neural network architecture consists of input layers, hidden layers (learning process), and output layers (response or classification layer to the input pattern). Based on these layers, the neural network performs the pattern recognition task in a non-linear manner. The input-output pair of a neural network is represented by a point in a decision space. These decision spaces have been mapped out by the neural network, and they are utilized for allocating inputs to the network that it has never seen before but which are characteristic of patterns it has seen in the past. The term for this kind of process is generalization. Therefore, neural networks may be able to handle new situations and may perform better than statistical classifiers.
The fully connected layer of the proposed system is made up of a multilayered feed forward neural network. This type of network is characterized by its hierarchical structure, which is comprised of a large number of simple processing units (nodes) that are connected to one another by adaptive weights (w). When processing is complete, the pattern vector, also known as the deep features are applied to the input layer. A weighted sum of the inputs is performed by each node in a hidden layer, and then a non-linear modification of that total, coupled with a bias (b), is generated by that node. The succeeding layer makes use of the previous layer’s outputs as its inputs. There is no guarantee that nodes in the output layer, also known as the response, will be able to perform non-linear transformations. The replies that are produced at the output layer are a forecast of the qualities possessed by the inputs. During the training phase, a neural network acquires knowledge via an effort to identify an optimal set of values for the connection weights by attempting to minimize the effects of some objective function at the network’s output.
Back propagation is employed to train (tuning of weights) the proposed network to produce the desired output. It has two passes, such as forward and backward. The initial weights of neurons are drawn randomly from Gaussian distributions. The cross entropy loss is the one of the main loss function used in many deep learning approaches. Errors are determined by calculating the difference between what the network guesses at the outputs as a response to the input patterns and what those responses should really be (the target responses). It is defined as
where the probability for the kth class is
Compared to the tanh and sigmoid activation functions, the ReLU activation function is less susceptible to the vanishing gradients issue. However, the ReLU algorithm has a dying problem. A little ascent in elevation is introduced as a solution to the issue of dying. Thus, the proposed system uses the PReLU function [19] instead of the ReLU function. Fig. 5 shows the PReLU and ReLU activation functions [20]. In this study, three fully connected layers are employed for the classification. Each fully connected layer is designed with three hidden layers and five output layers.
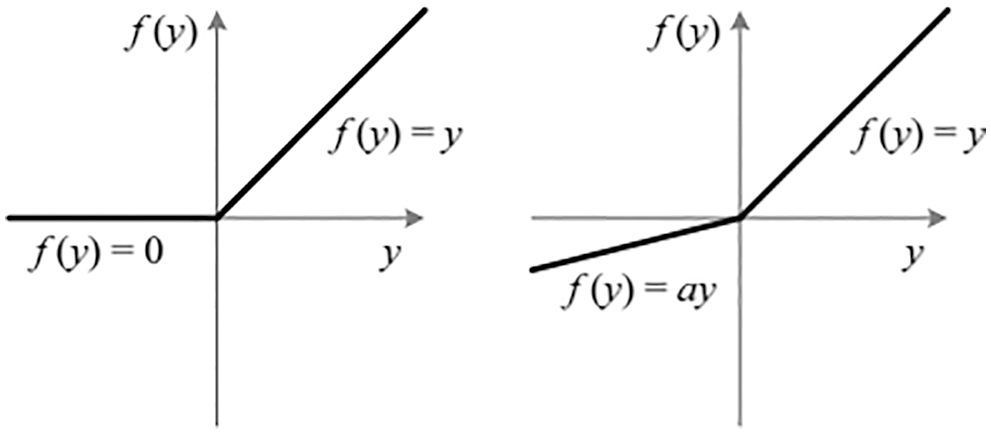
Figure 5: Input layer activation function: ReLU (left side) and PReLU (right-side)
In the forward pass, no adaptation of weights takes place, and the actual output is obtained layer by layer. In the backward pass, the error (differences between the desired output and the actual output) is propagated from the output to the input layers, and the weights are adjusted accordingly. This process is repeated until the required responses are reached. Though activation functions such as tanh and sigmoid are used at the output layer, they cannot keep up with the network’s training. The output layer uses the softmax function as the proposed CMB classification system is a multi-class system. It is defined in Eq. (3) for a deep learning architecture with n number of outputs.
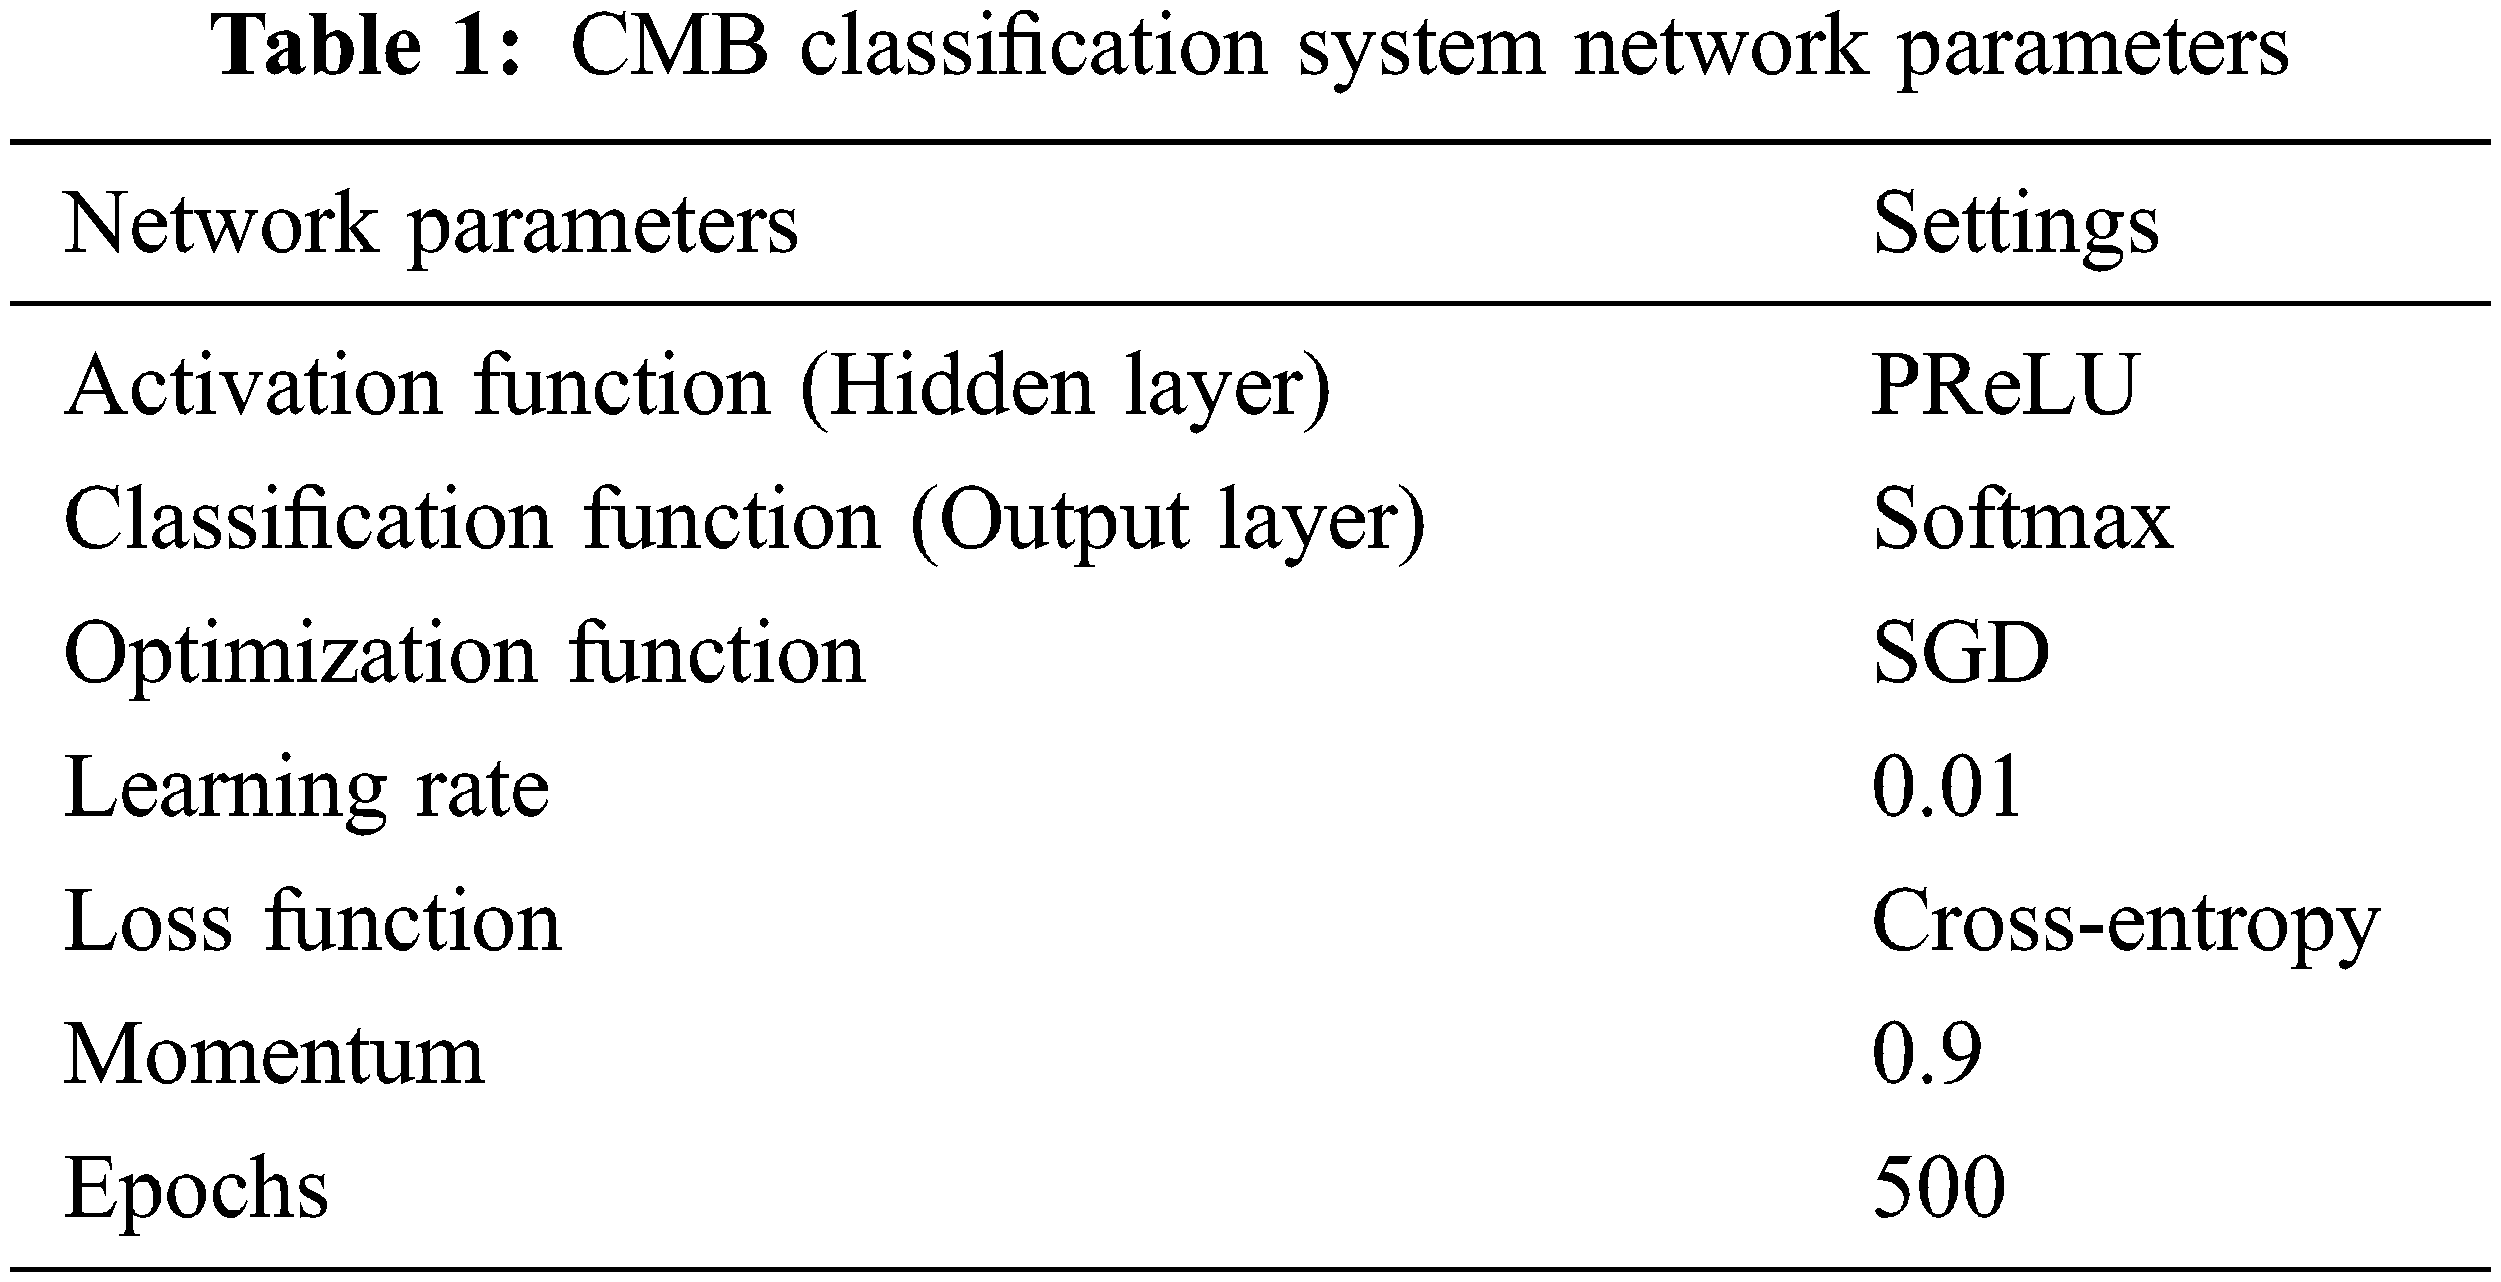
where outm is the output of mth layer. Fig. 6 shows the softmax output function, and Table 1 shows the parameter settings for the proposed CMB classification system.
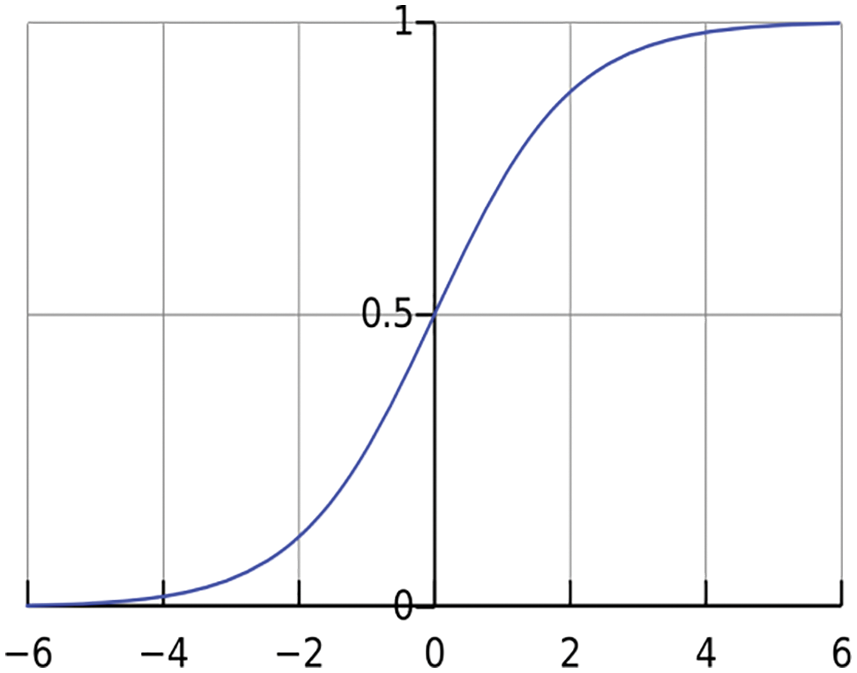
Figure 6: Output layer activation function: Softmax
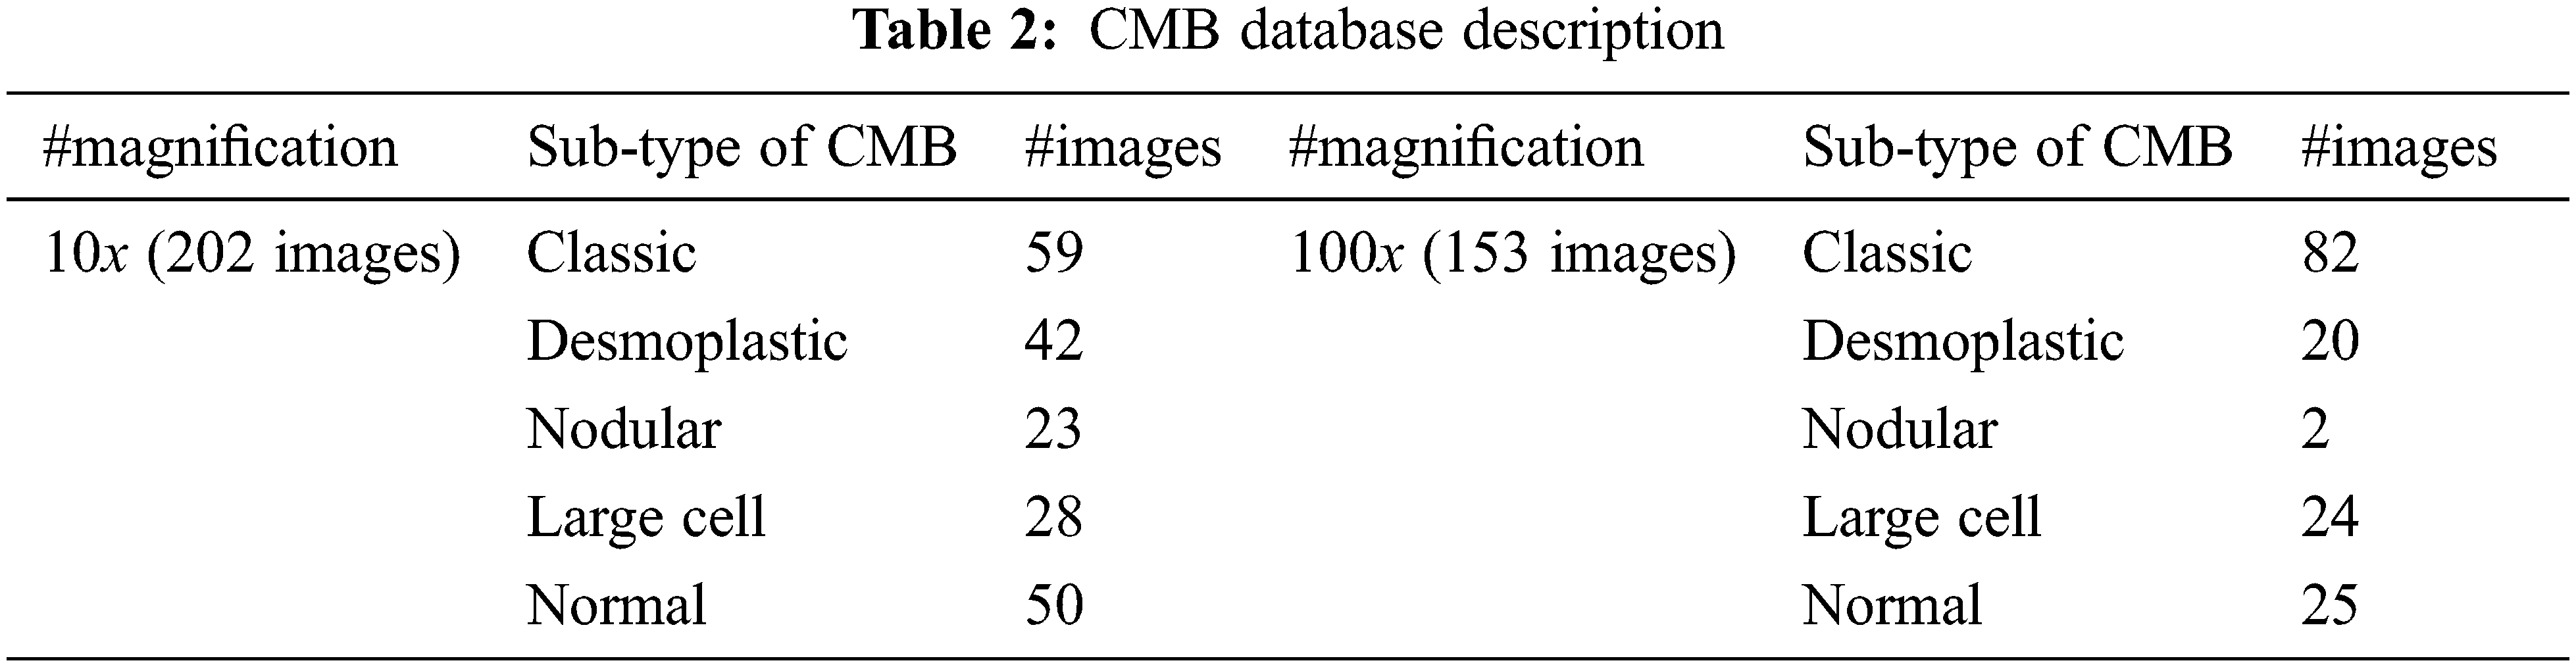
The proposed CMB classification system is tested on 202 histopathological images from [21]. This database has 10× and 100× magnified histopathological images with five different classes, such as desmoplastic, nodular, large cell, classic, and normal. The 10× image has a resolution of 2048 × 1536 pixels, whereas the 100× image is 800 × 600 pixels. For faster learning, the resolution of the input image is reduced to 256 × 256 pixels. The dataset in [21] does not have a label feature image corresponding to the sample, which is required for segmentation-based approaches. The proposed system is a whole image classification system, and the final output is only the name of the class (predicted class name). The database provides each image class image as ground truth data (true or actual class name). Based on this information, the images are categorized. Fig. 7 shows sample images with 10× magnifications in each CMB sub-type, and Fig. 8 shows sample images with 100× magnifications. Table 2 indicates the number of images available for the performance analysis of the CMB classification system.
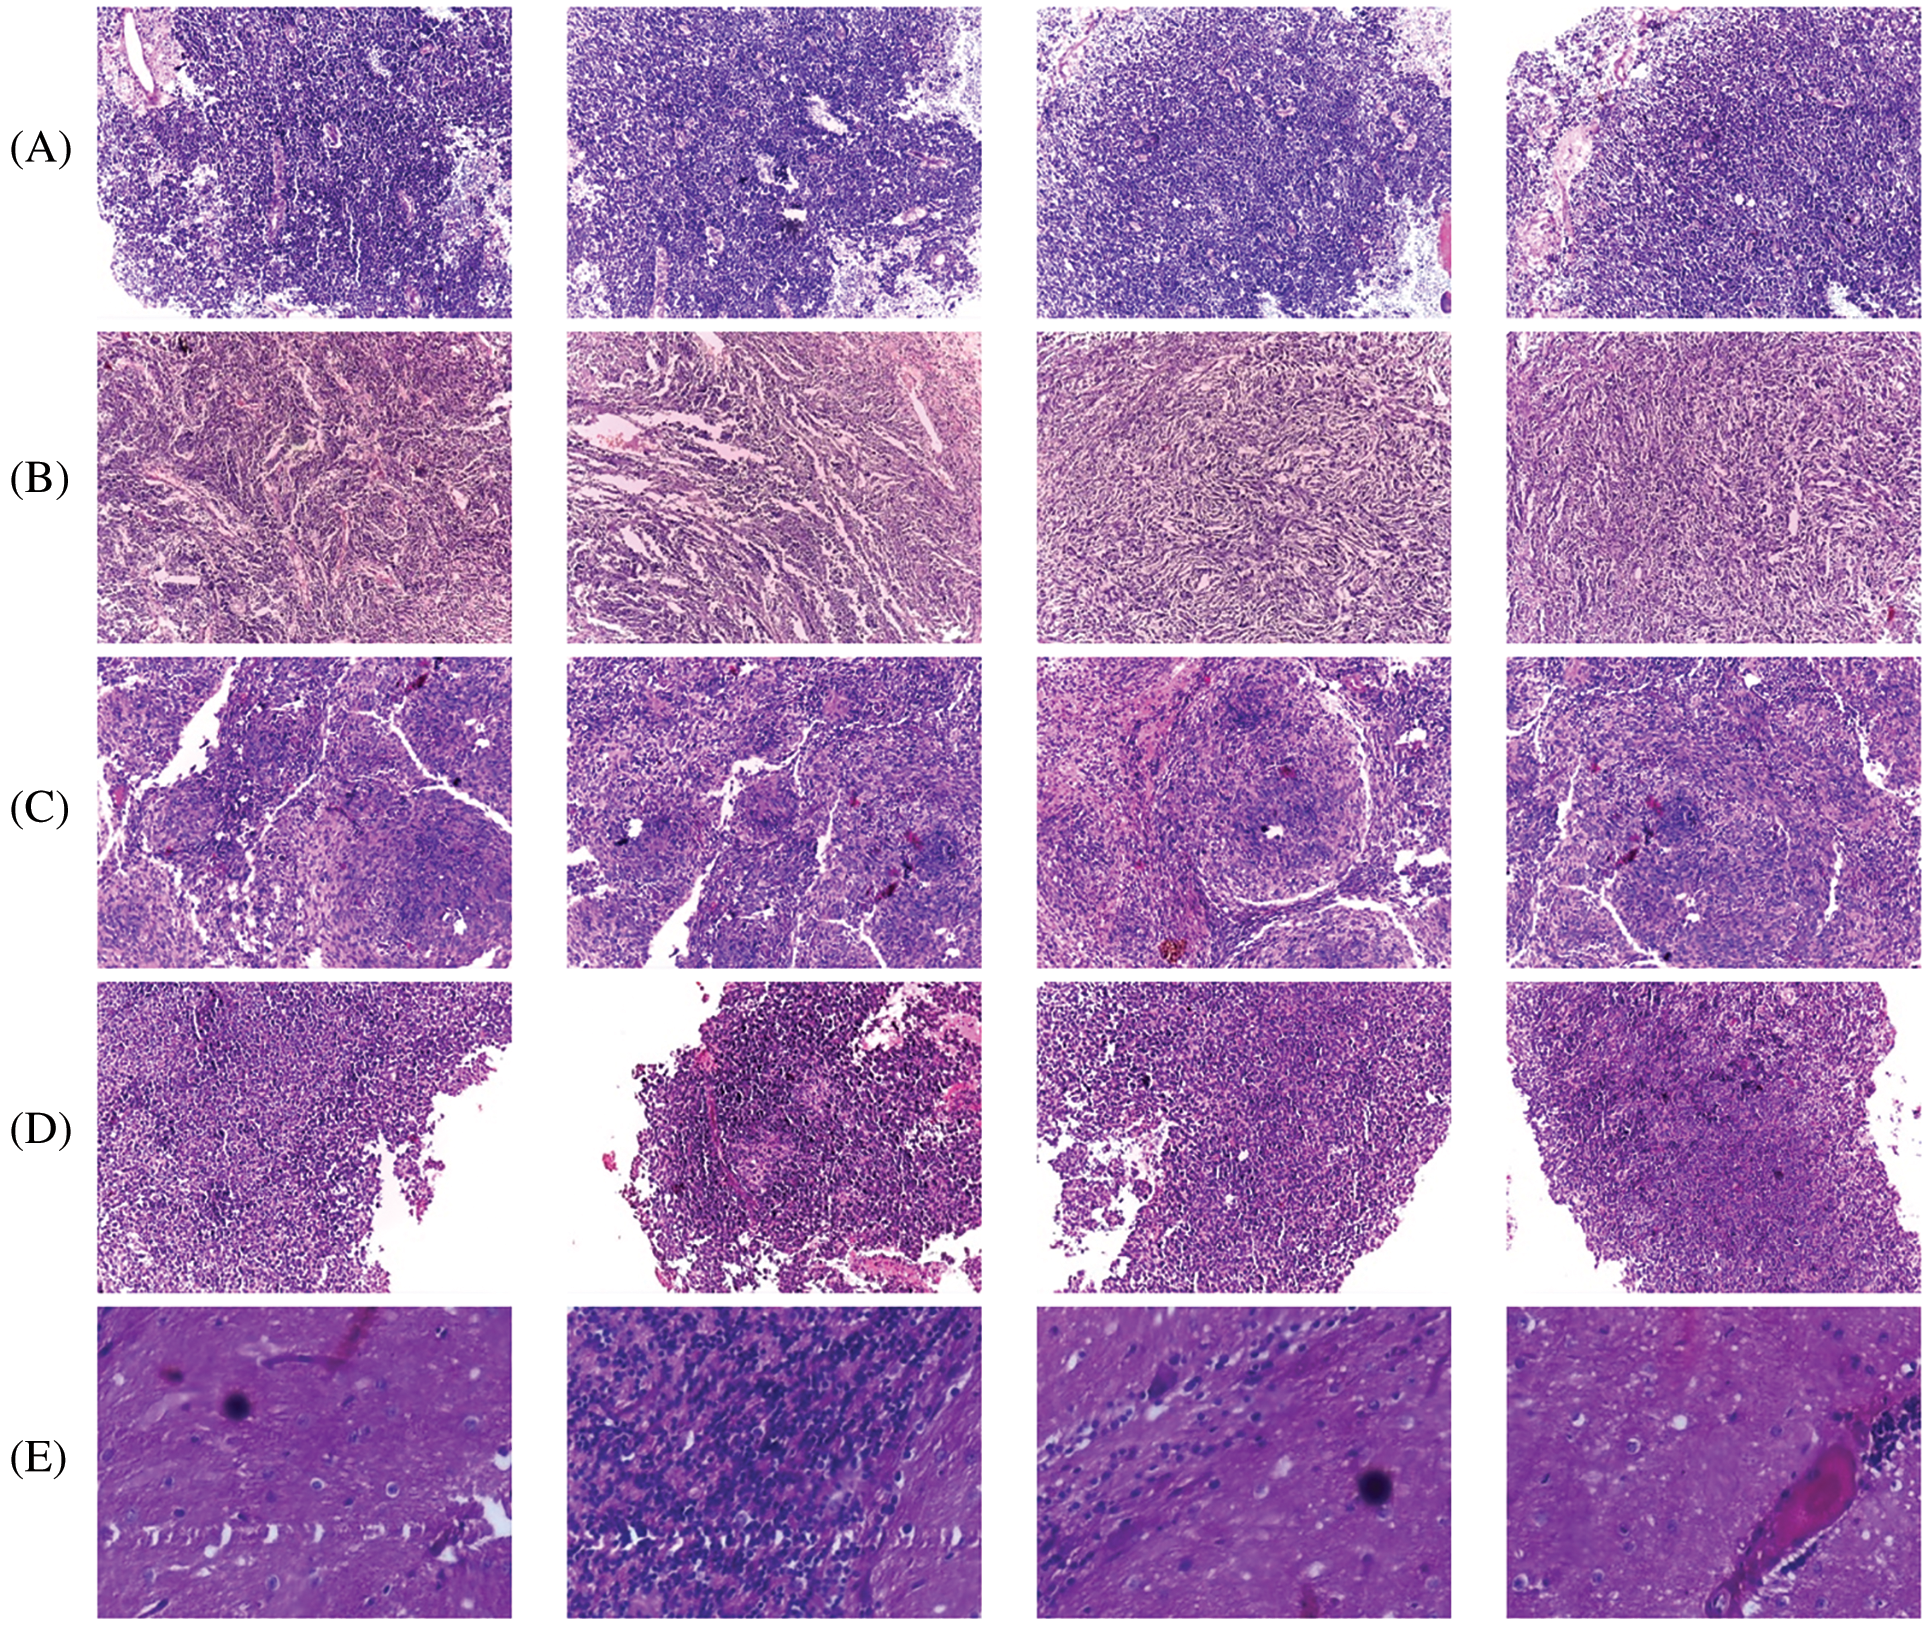
Figure 7: 10× magnified histopathological images (A) classic (B) desmoplastic (C) nodular (D) large cell (E) Normal
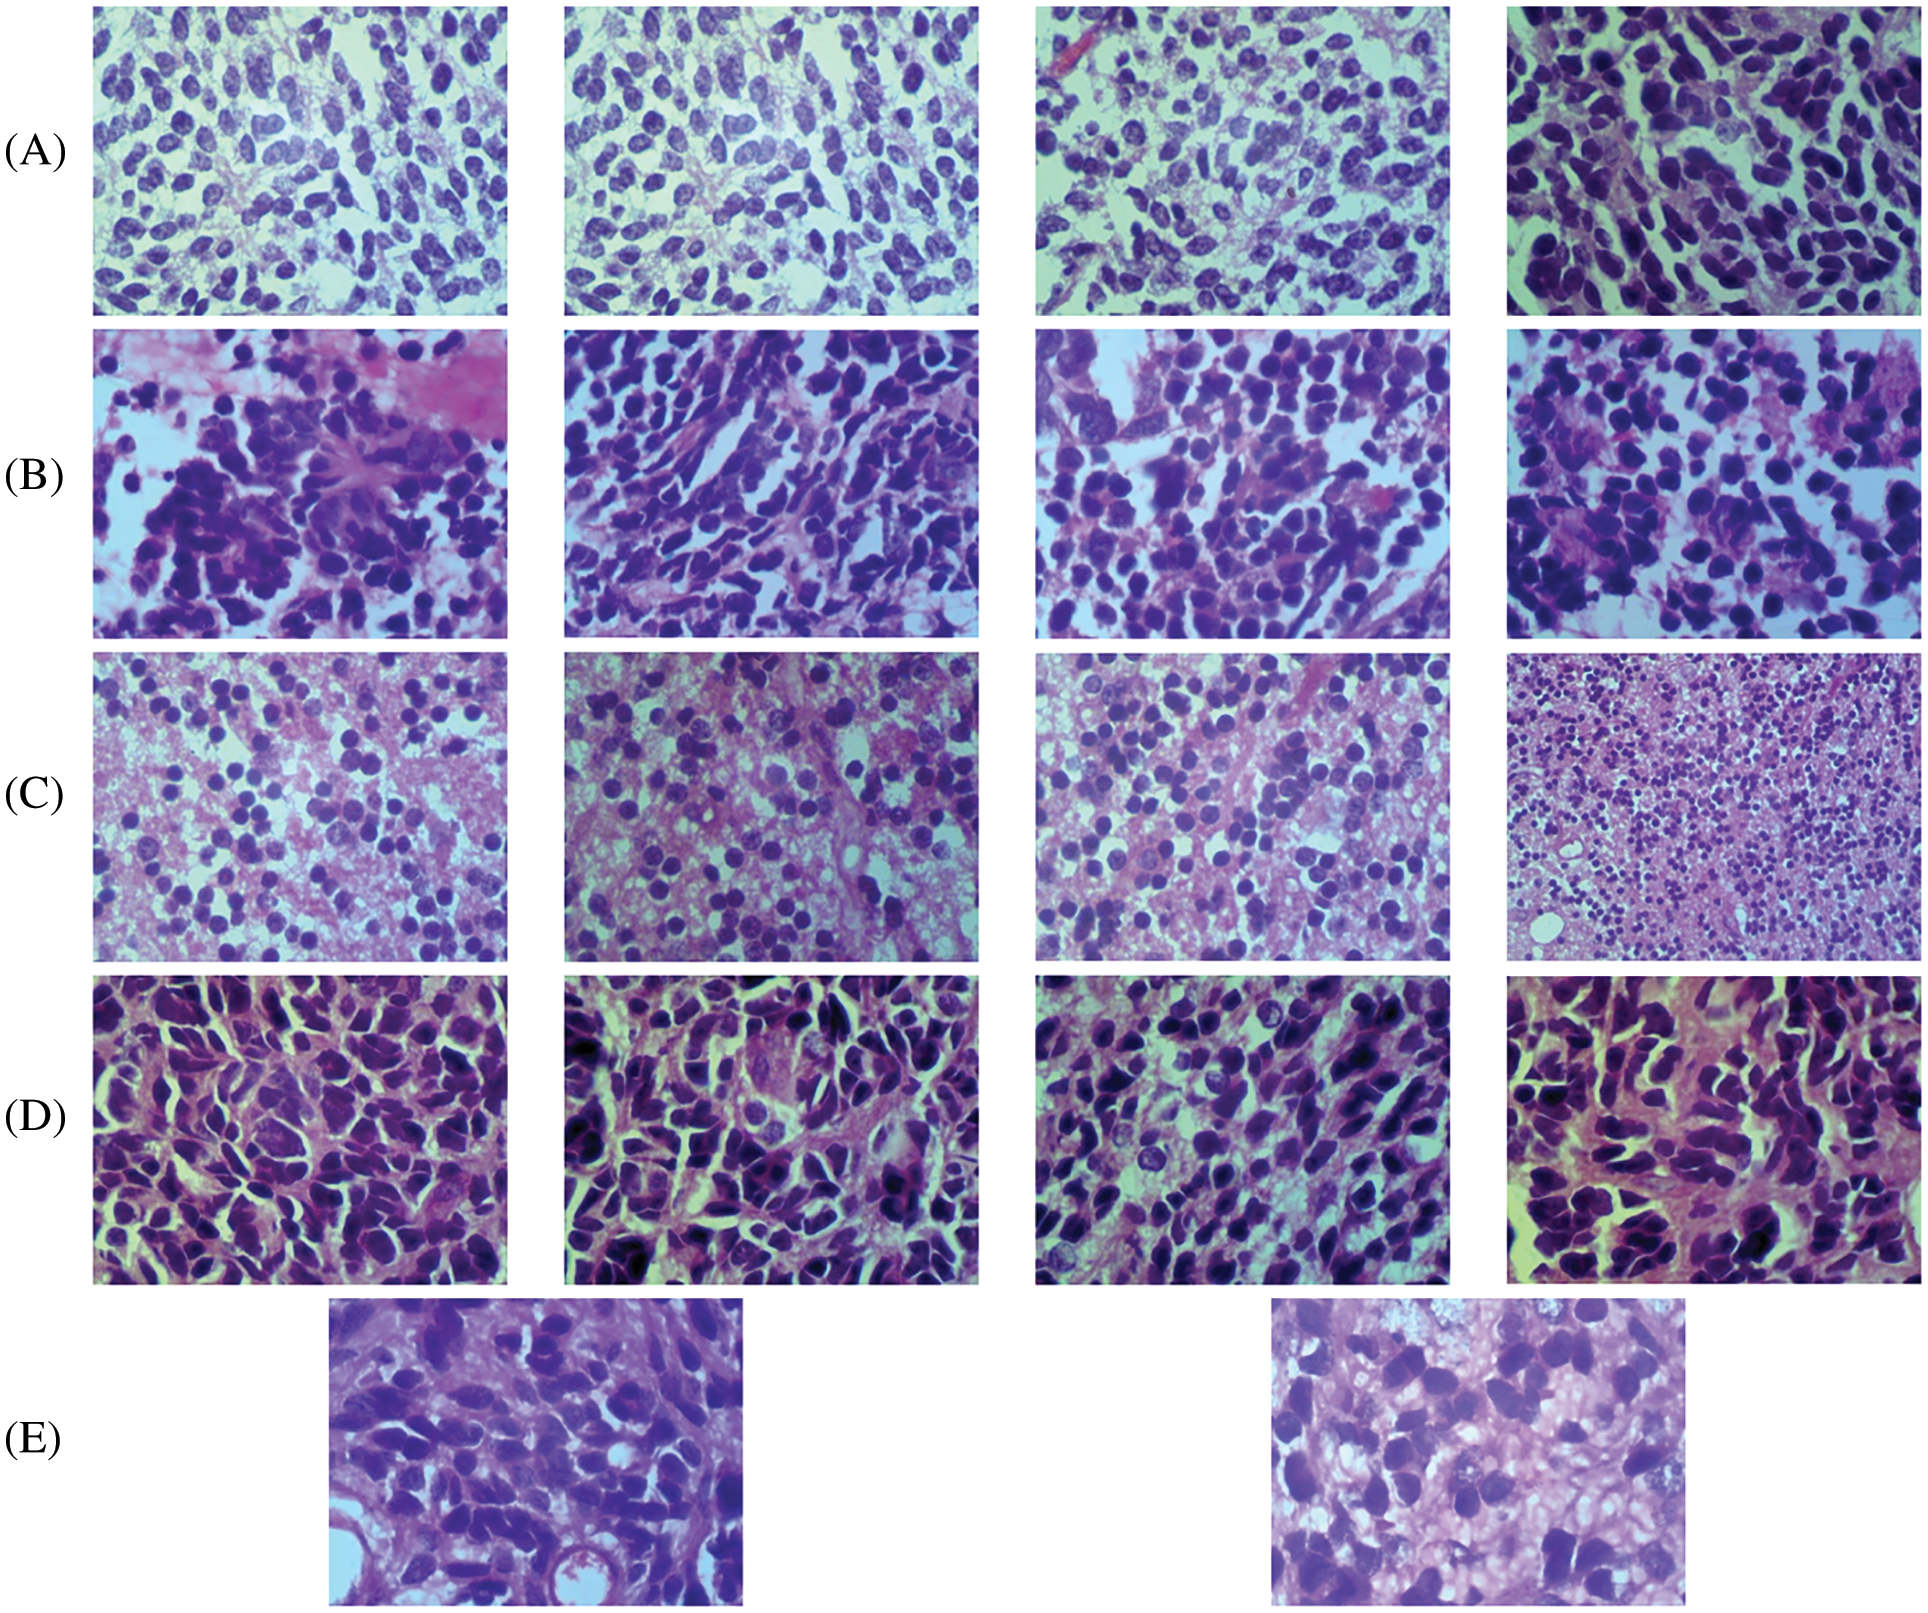
Figure 8: 100× magnified histopathological images (A) classic (B) desmoplastic (C) normal (D) large cell (E) Nodular
The evaluation metrics, such as overall accuracy (Ac), sensitivity (Sn), and specificity (Sp) are computed to assess the performance of the proposed CMB classification system. Table 3 shows the formulae used for evaluating the metrics.
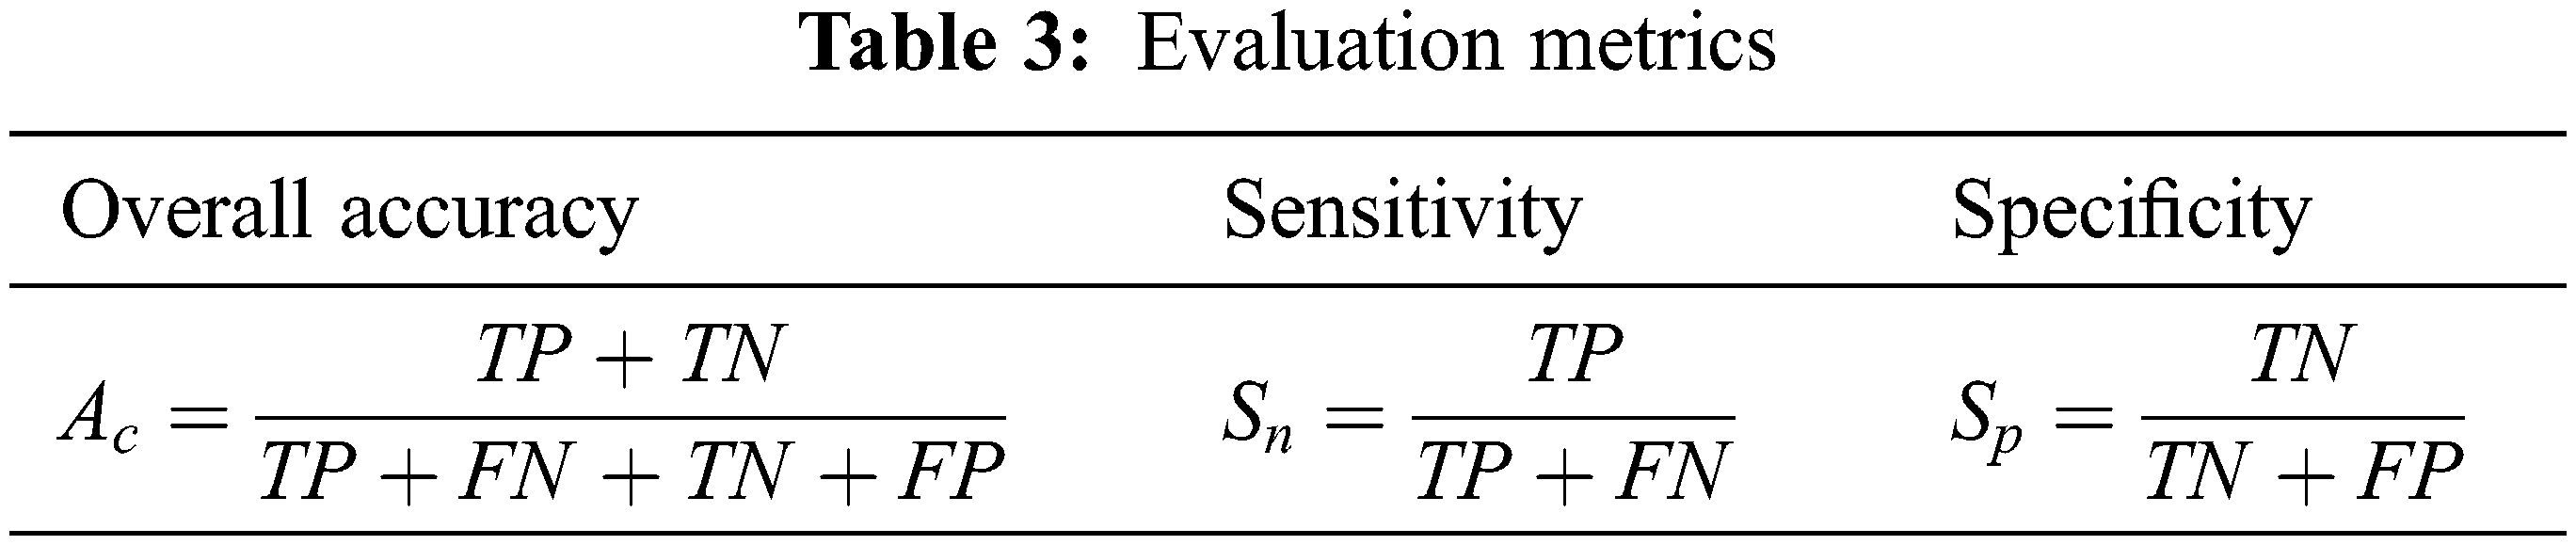
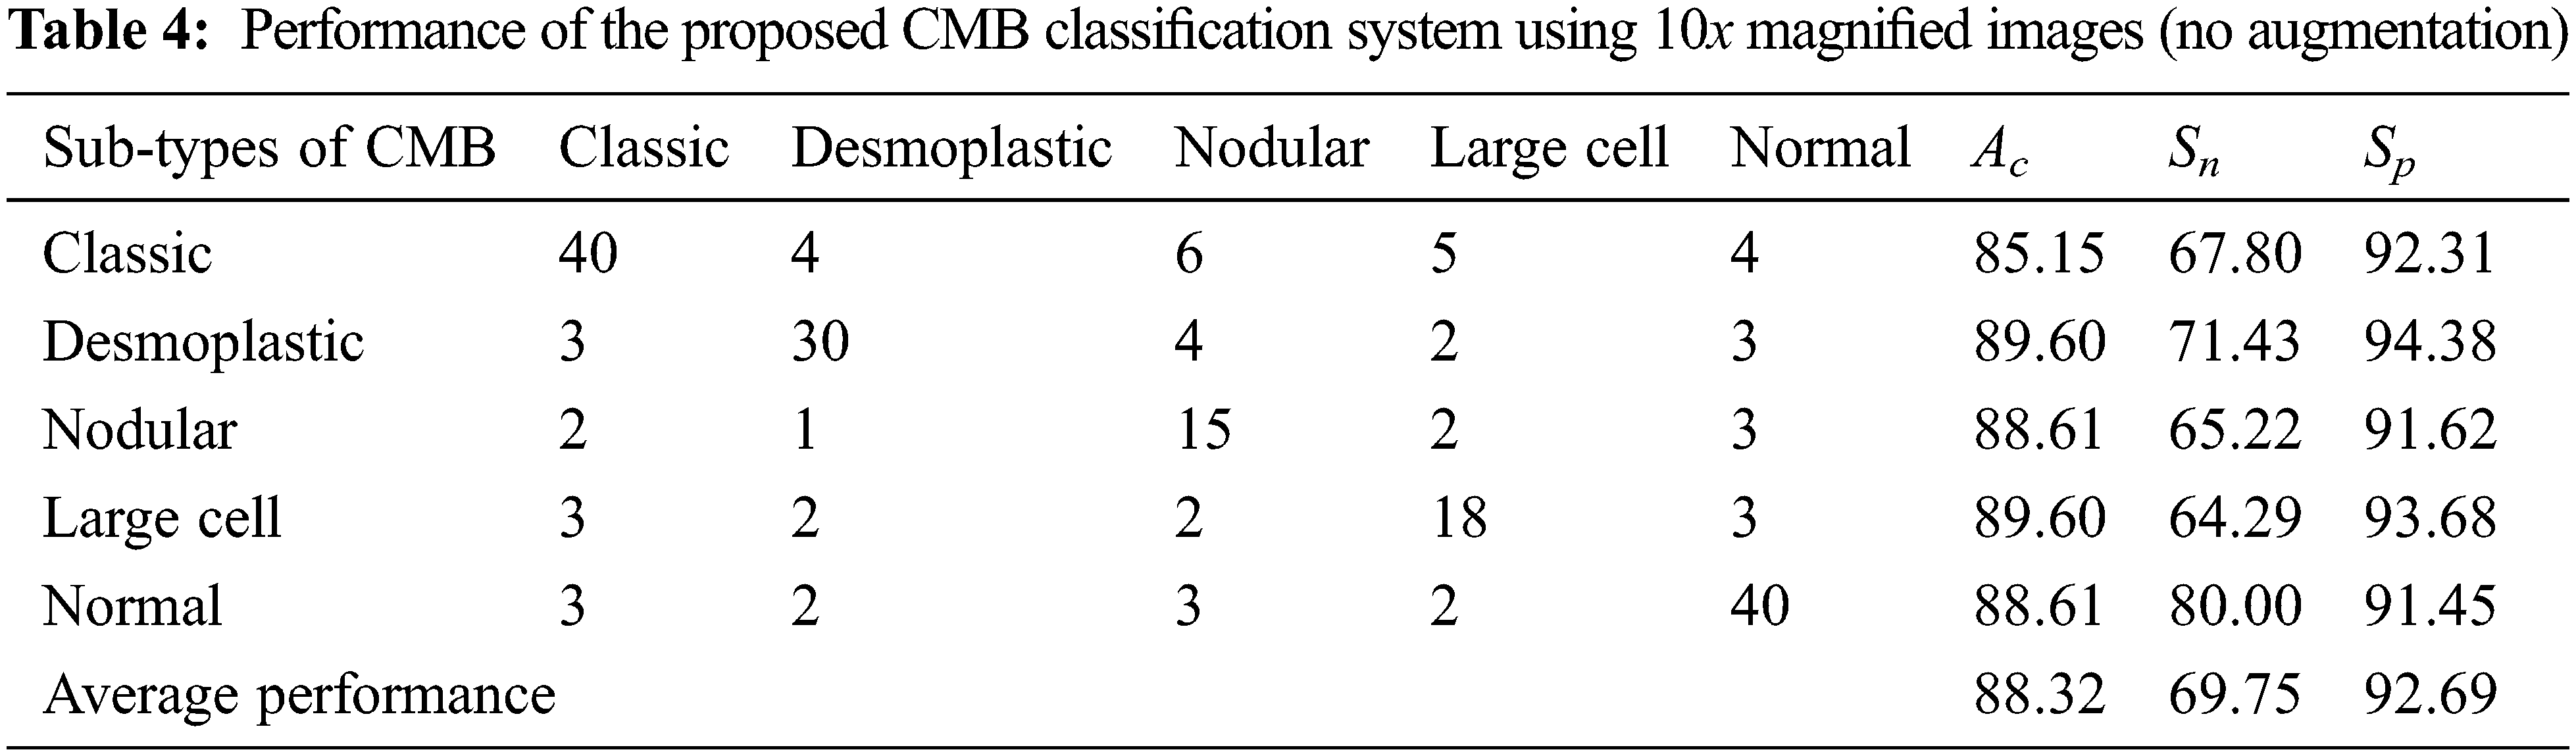
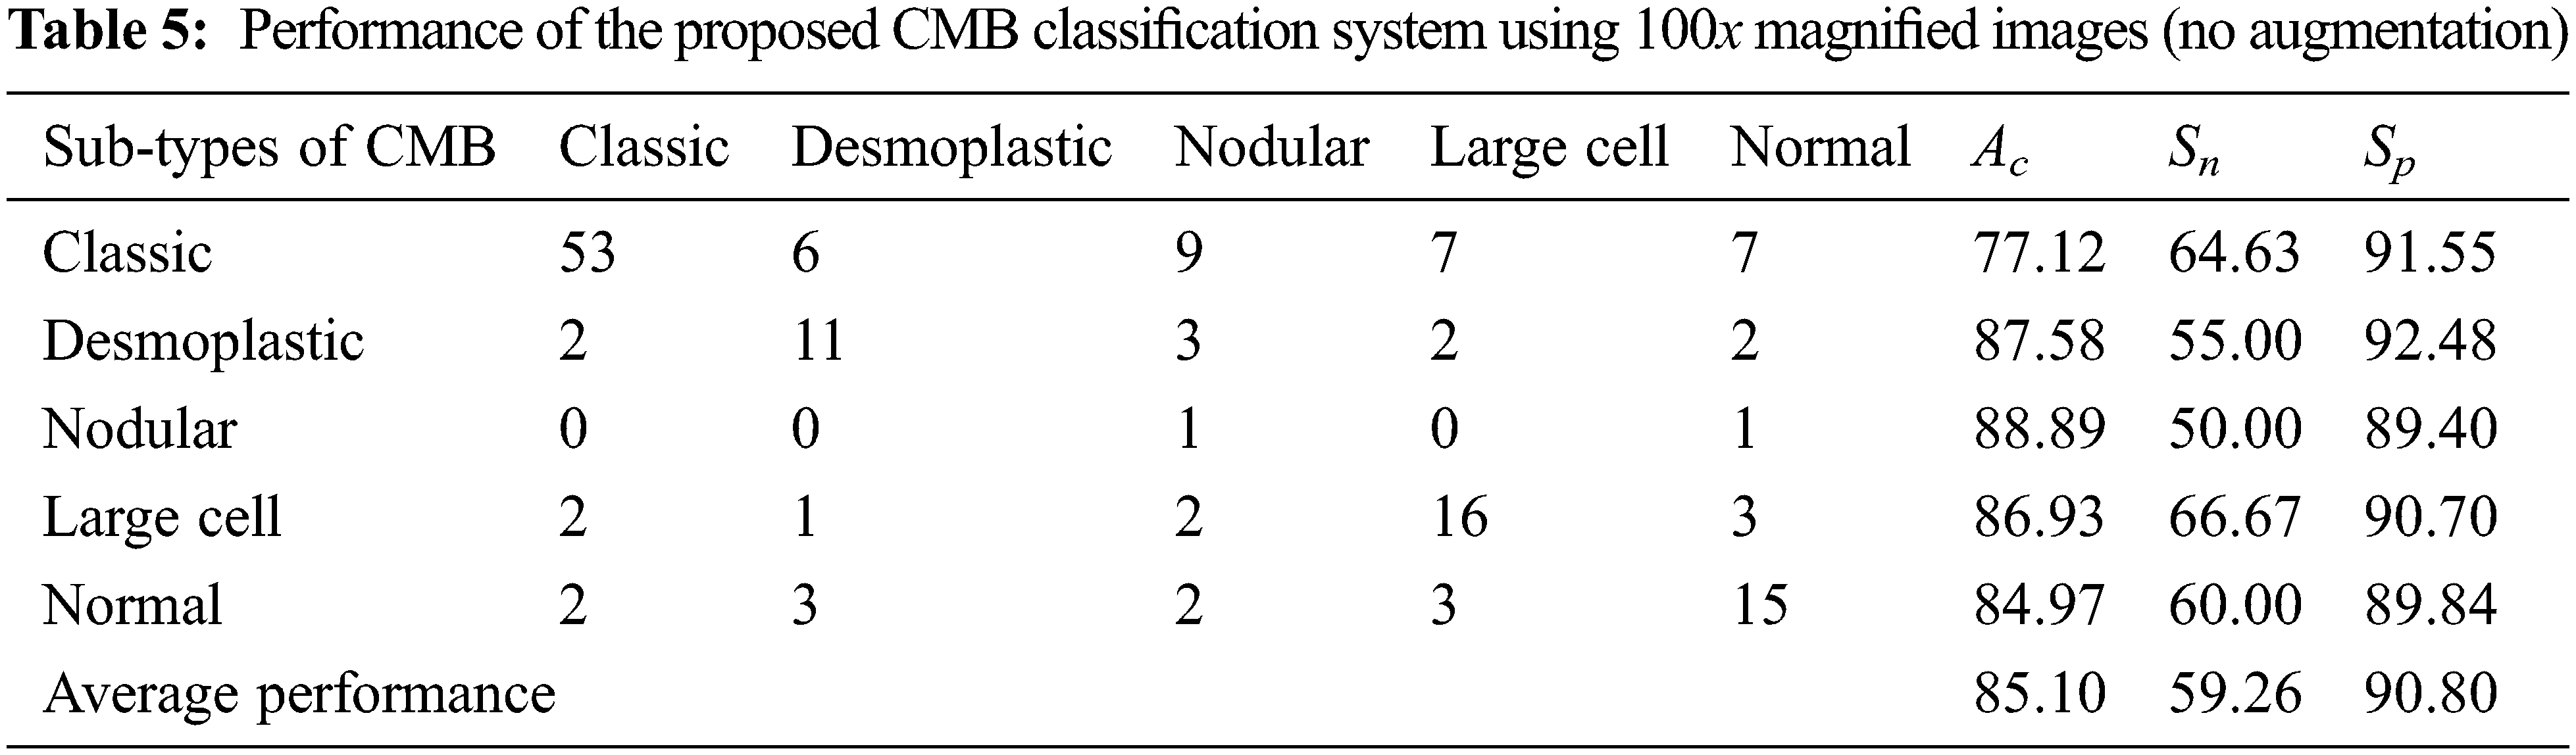
In Table 3, TP represents the correct prediction of Group-A (positive) samples, and FN is the misclassification of the positive group samples. Similarly, TN represents the correct prediction of Group-B (negative) samples, and FP is the misclassification of the negative group samples. First, the performance of the proposed CMB classification system using 10× magnified images (no augmentation) in the database is evaluated. Tables 4 and 5 show the evaluation metrics using 10× and 100× magnified images (no augmentation), respectively.
The number of histopathological images in each sub-type of CMB is increased seven times using augmentation. In augmented, the original image is rotated to predefined angles (900, 1800 and 2700), flipped to the left and then rotated again to get more images. Table 6 shows the number of samples in the CMB database after augmentation. Fig. 9 shows the augmented images.
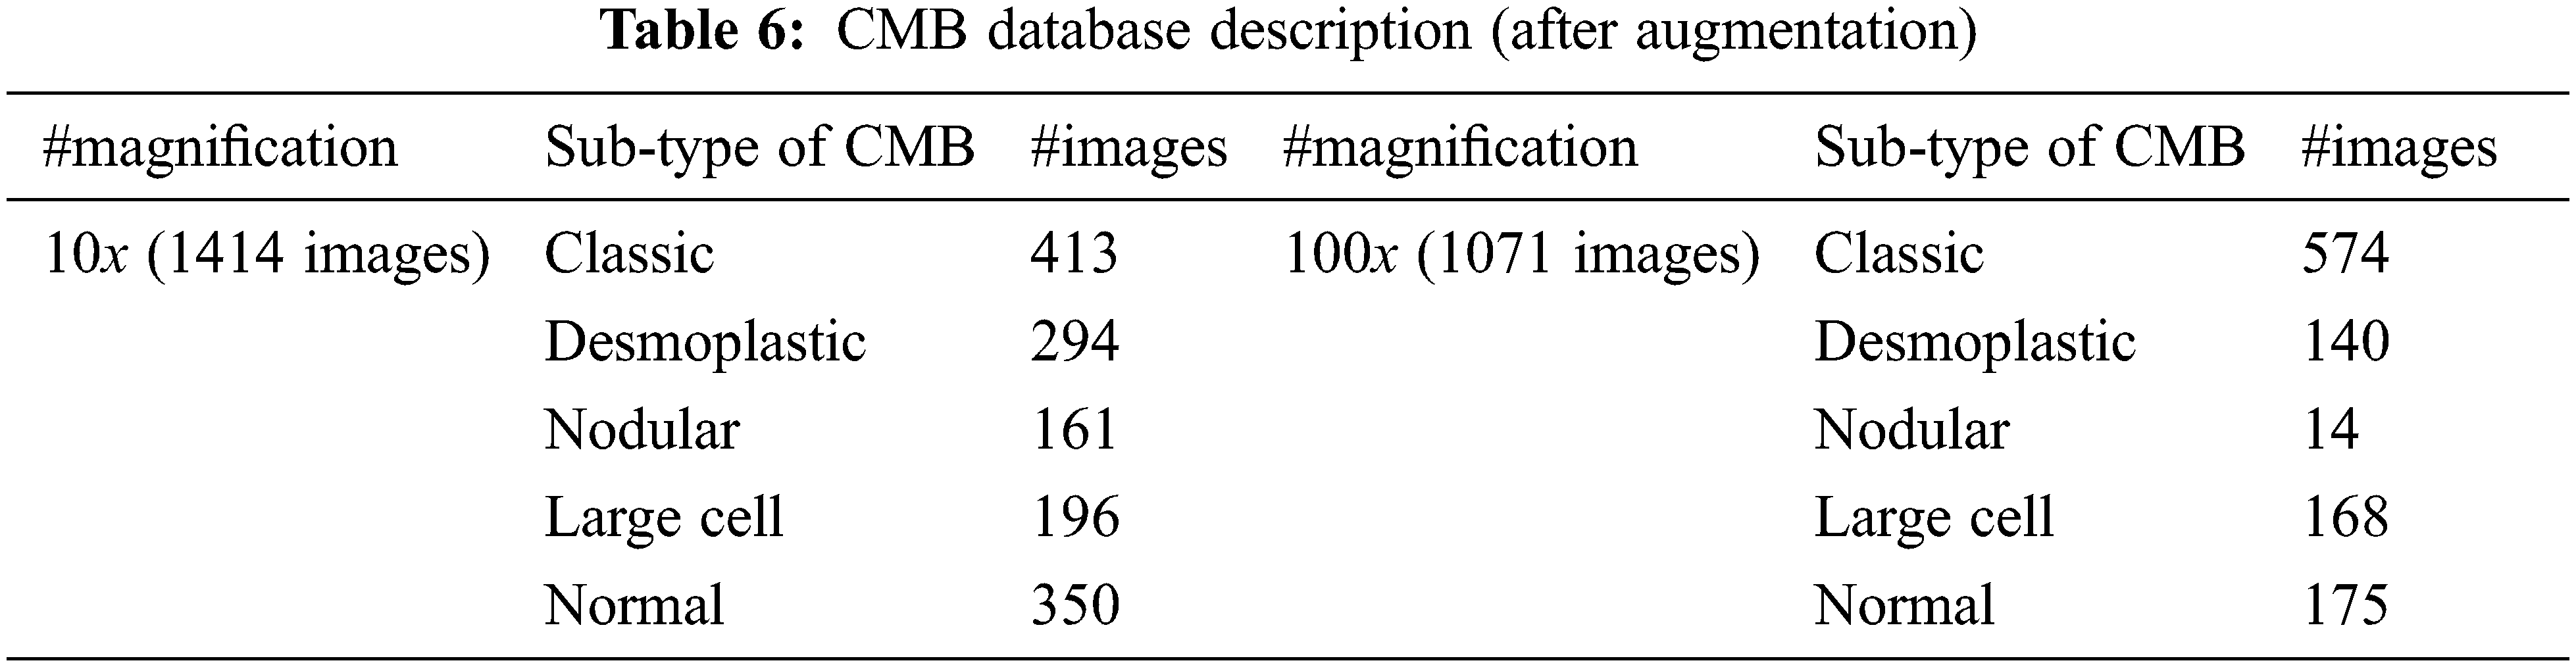
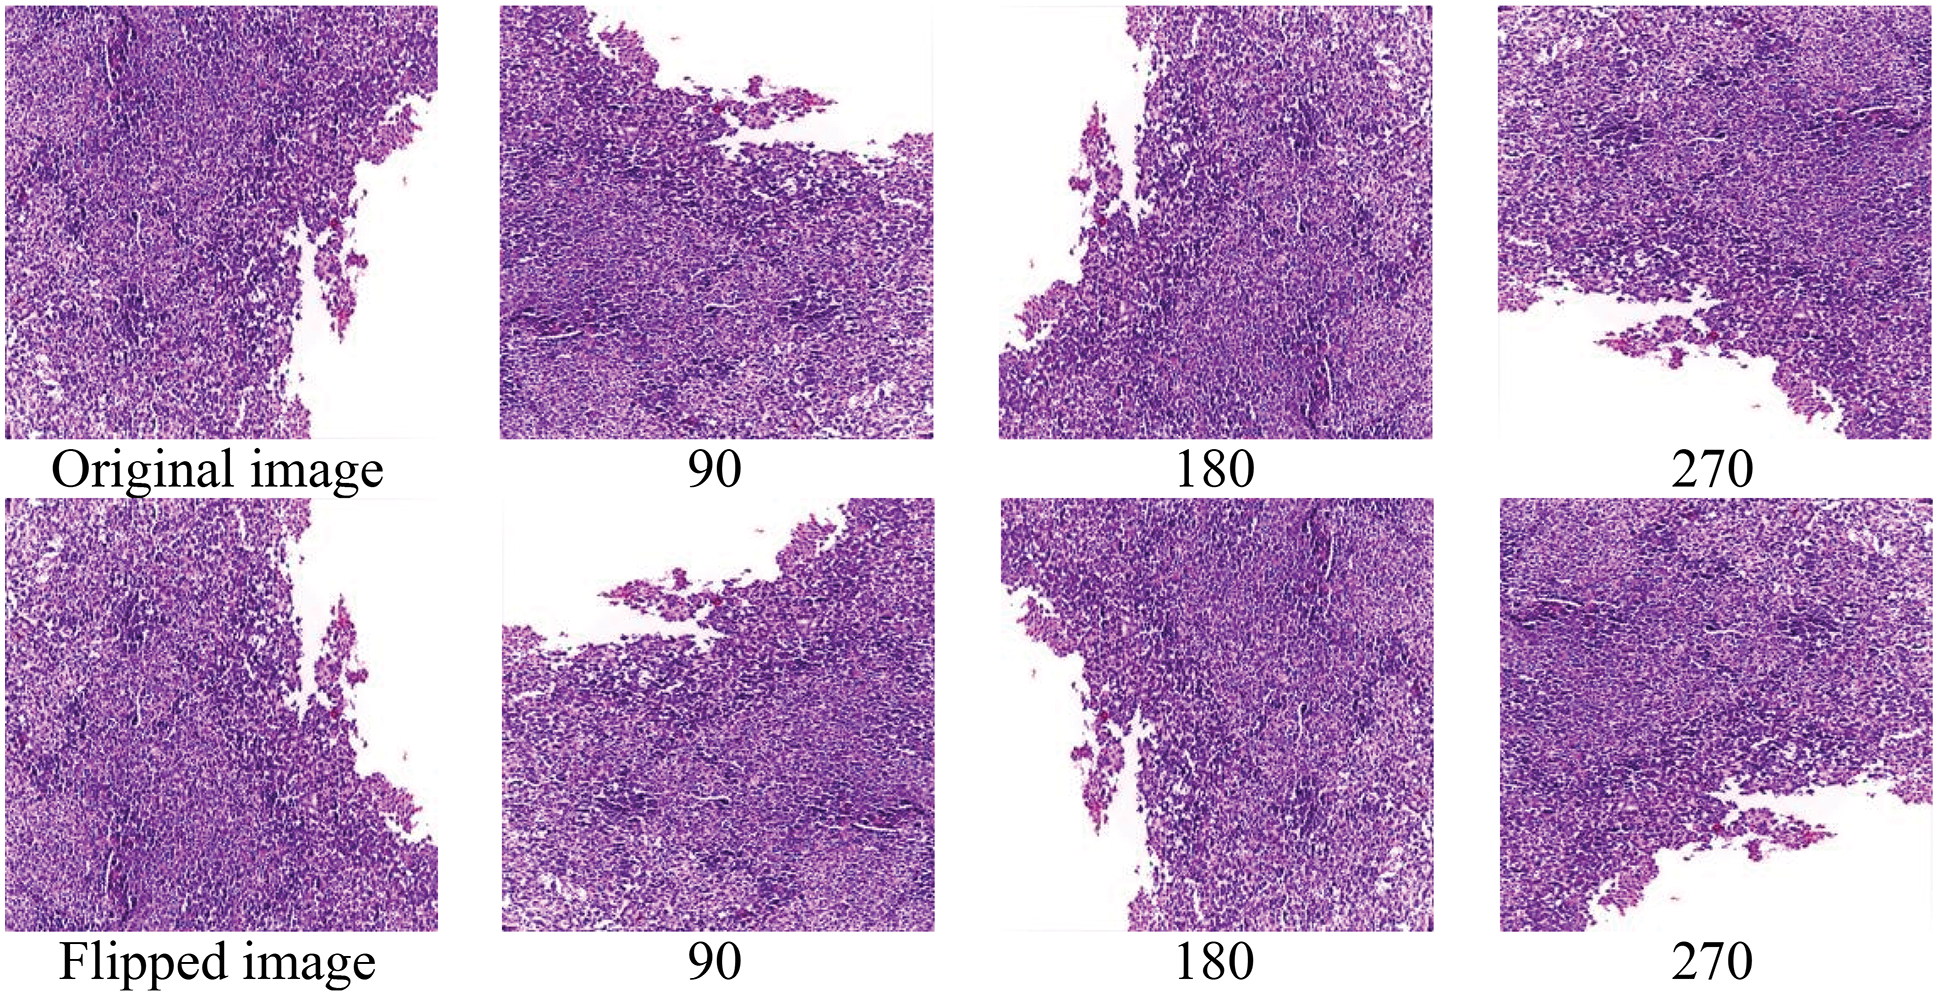
Figure 9: Augmented images
Tables 7 and 8 show the evaluation metrics using 10× and 100× magnified images (augmented images), respectively.
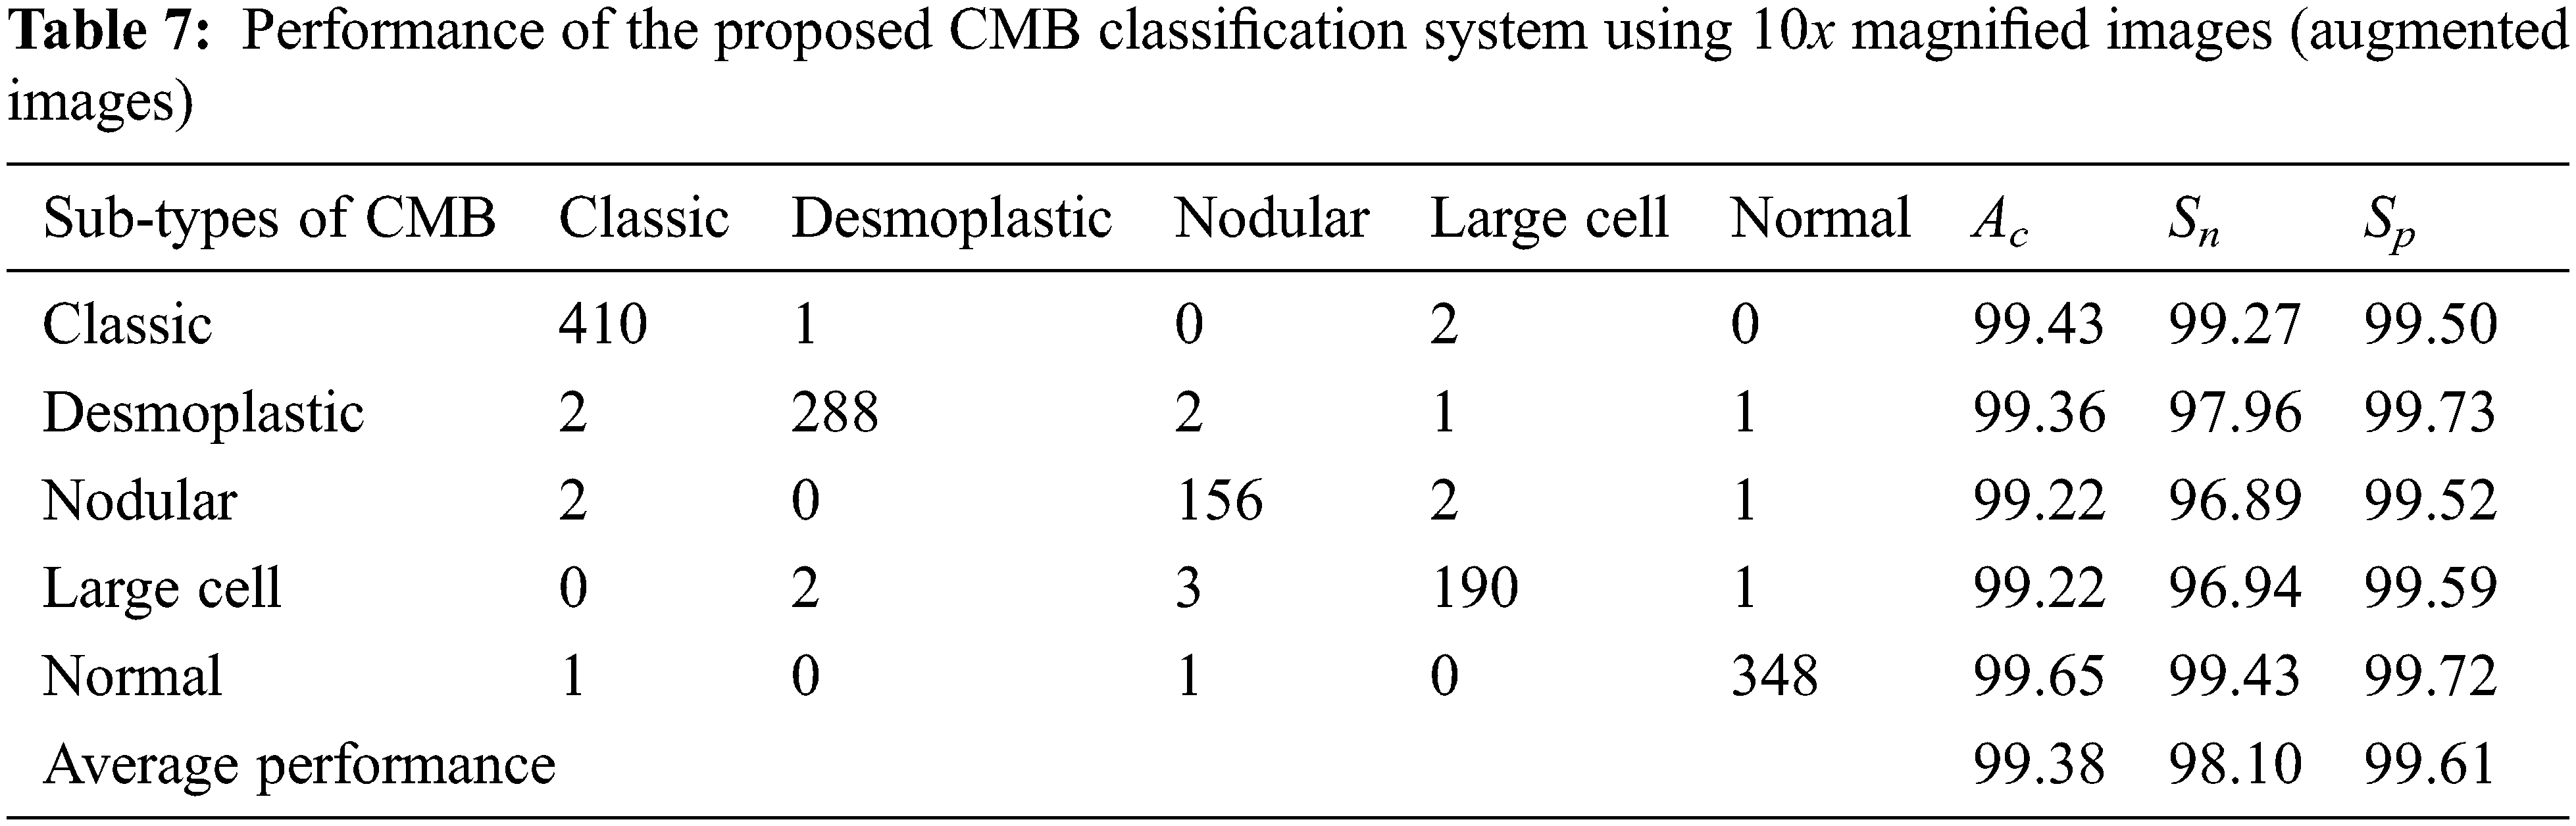
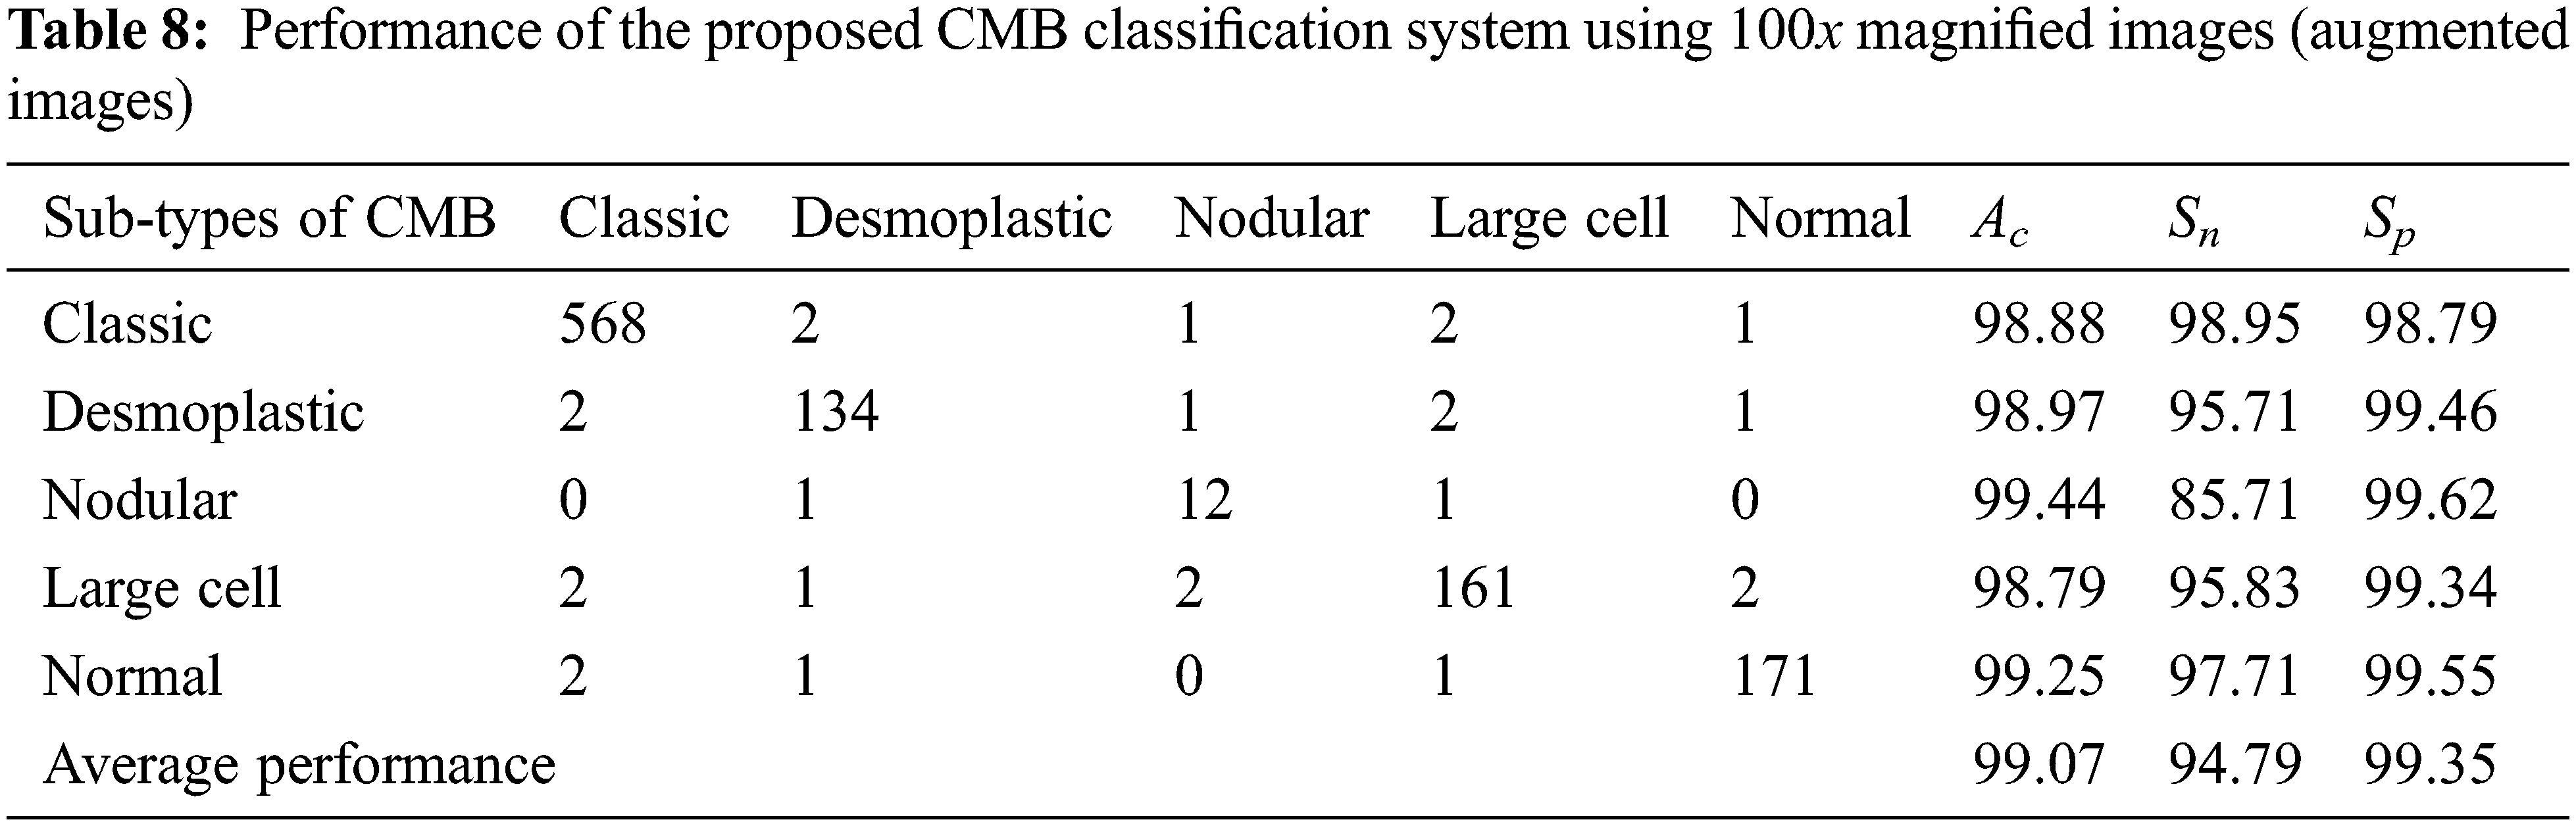
It can be seen from Tables 4 to 5 and Tables 7 to 8 that the average Ac of the proposed CMB classification system increases ∼10% when using the augmented images. As the number of images in the augmented dataset is higher than the number of original images, the proposed architecture learns more discriminating patterns from the augmented images than the original images while training. Thus, the performance of the proposed CMB classification system increases from 88.32% to 99.38% for 10× magnified images and from 85.10% to 99.07% for 100× magnified images. Fig. 10 shows the graphical representation of the proposed CMB classification system.
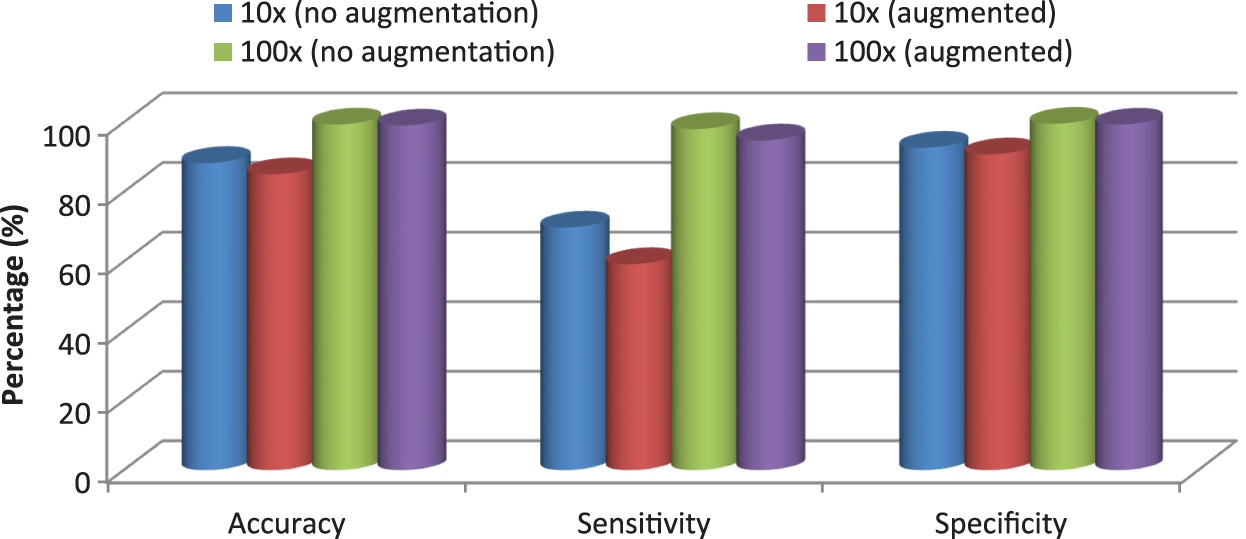
Figure 10: Performance comparison of the proposed CMB classification system
It can be seen from Fig. 10 that the performance is better for the augmented histopathological images than for using the original images. The sensitivity of the system using 10× is 69.75% (no augmentation) and 98.10% (augmented images) and the specificity is 92.69% (no augmentation) and 99.61% (augmented images). It is noted that the performances on 100× magnified images are less than 10× as the number of images in nodular sub-type (2) is very few. A comparative study is provided in Table 9 to show the superiority of the CMB classification system. All systems use 10× magnified images for performance evaluation.
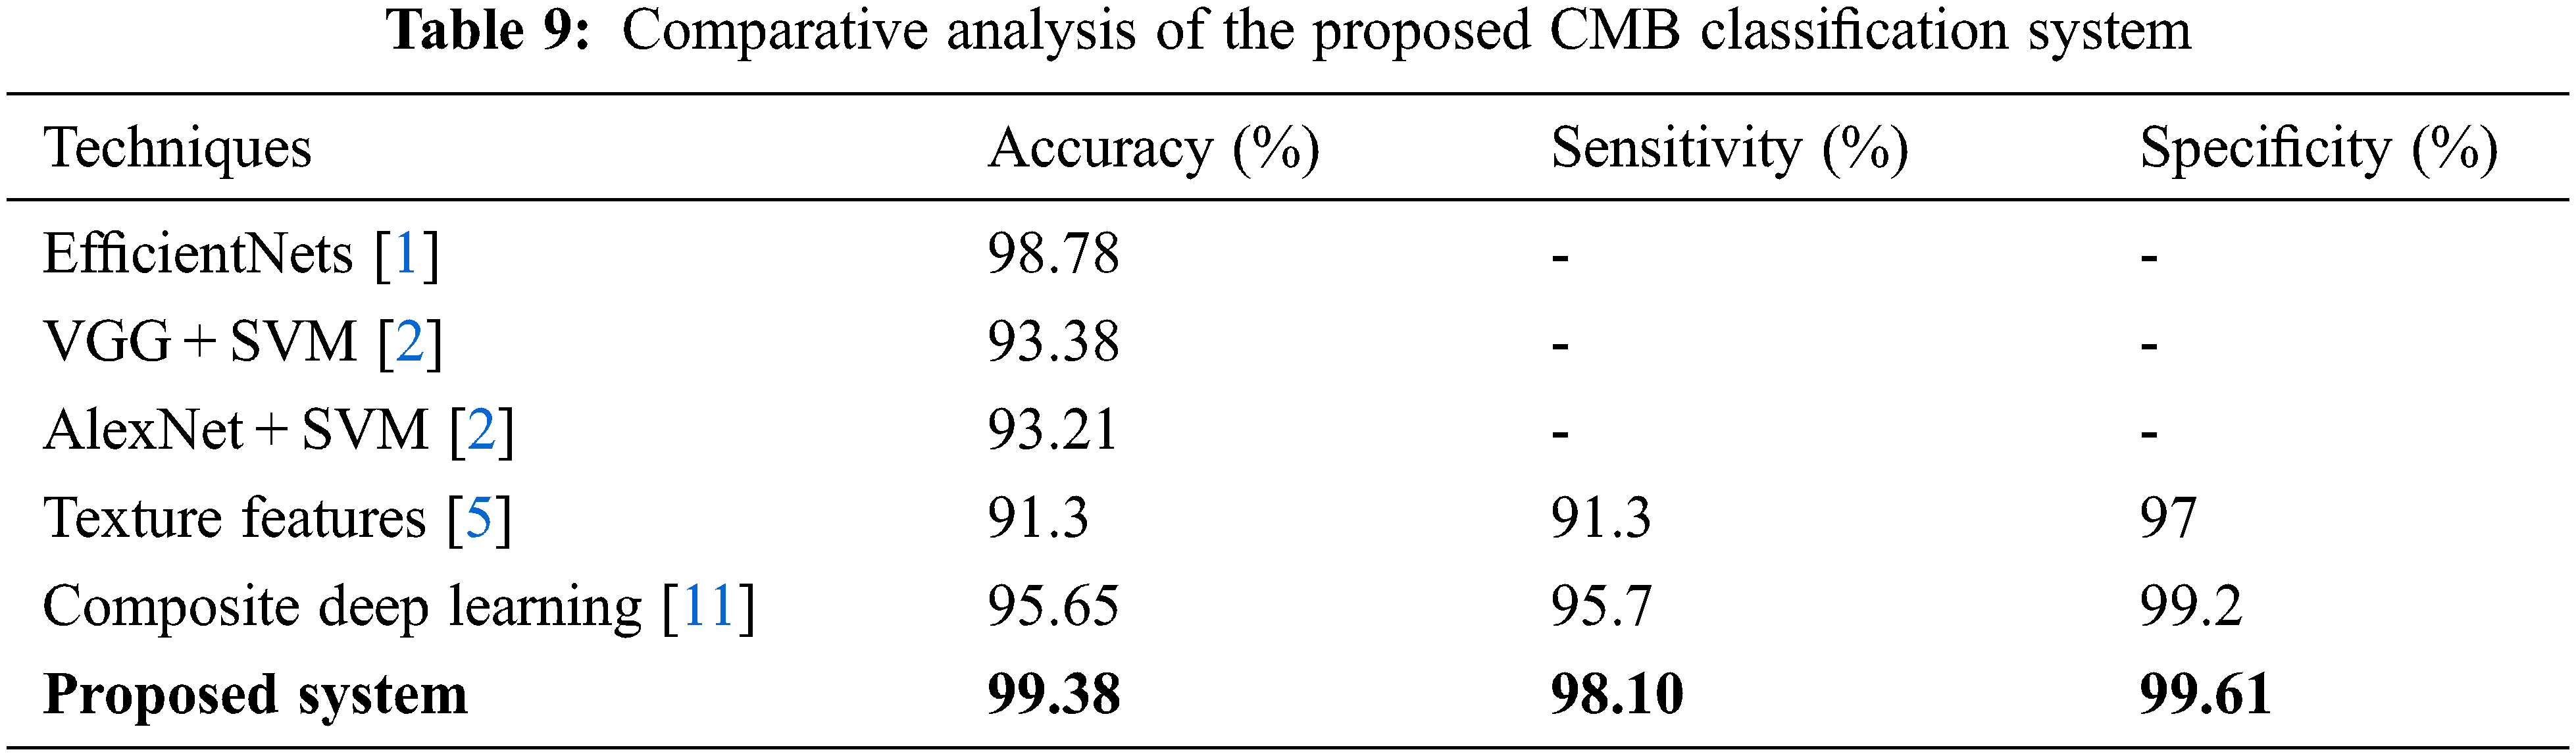
It can be seen from Table 9 that the CMB classification system has the highest performance than other deep learning architectures, such as EfficientNets [1], VGG + SVM [2], AlexNet + SVM [2], composite deep learning [11], and texture-based features [5].
The main contribution of this work is the development of an advanced deep learning architecture and its application to classify CMB into five different classes. The CMB system is based on automated algorithms that allow the accurate classification of histopathological images. Since each histopathological image contains a considerable amount of redundant data, the relevant information or features are filtered using convolution filters. Then their dimensions are reduced by the max pooling layers. The reduced features are classified using a neural network classifier. It has been demonstrated that the proposed CMB classification system offers a practical solution with an average maximum Ac of 99.38% to the problem of classifying five different sub-types of CMB. The system achieves maximum average performances of 98.10% (Sn) and 99.61% (Sp). The proposed method automatically analyzes histopathological images, yielding results that are not user-subjective. The high level of automation of the technique permits many cases with relatively low labour-intensive procedures.
Funding Statement: The authors received no specific funding for this study.
Conflicts of Interest: The authors declare that they have no conflicts of interest to report regarding the present study.
References
1. C. M. Bhuma and R. Kongara, “Childhood medulloblastoma classification using efficientnets,” in IEEE Bombay Section Signature Conf., Mumbai, India, pp. 64–68, 2020. [Google Scholar]
2. D. Das, L. B. Mahanta, B. K. Baishya and S. Ahmed, “Classification of childhood medulloblastoma and its subtypes using transfer learning features–A comparative study of deep convolutional neural networks,” in Int. Conf. on Computer, Electrical & Communication Engineering, Kolkata, India, pp. 1–5, 2020. [Google Scholar]
3. A. Narayanan, E. Nana and E. Keedwell, “Analyzing gene expression data for childhood medulloblastoma survival with artificial neural networks,” in Symp. on Computational Intelligence in Bioinformatics and Computational Biology, La Jolla, CA, USA, pp. 9–16, 2004. [Google Scholar]
4. B. Shamsaei and C. Gao, “Comparison of some machine learning and statistical algorithms for classification and prediction of human cancer type,” in IEEE-EMBS Int. Conf. on Biomedical and Health Informatics, Las Vegas, NV, USA, pp. 296–299, 2016. [Google Scholar]
5. D. Das, L. B. Mahanta, S. Ahmed and B. K. Baishya, “Classification of childhood medulloblastoma into WHO-defined multiple subtypes based on textural analysis,” Journal of Microscopy, vol. 279, no. 1, pp. 26–38, 2020. [Google Scholar]
6. D. Das, L. B. Mahanta, S. Ahmed, B. K. Baishya and I. Haque, “Automated classification of childhood brain tumours based on texture feature,” Songklanakarin Journal of Science & Technology, vol. 41, no. 5, pp. 1014–1020, 2019. [Google Scholar]
7. J. Galaro, A. R. Judkins, D. Ellison, J. Baccon and A. Madabhushi, “An integrated texton and bag of words classifier for identifying anaplastic medulloblastomas,” in Annual Int. Conf. of the IEEE Engineering in Medicine and Biology Society, Boston, MA, USA, pp. 3443–3446, 2011. [Google Scholar]
8. Y. Lai, S. Viswanath, J. Baccon, D. Ellison, A. R. Judkins et al., “A Texture-based classifier to discriminate anaplastic from non-anaplastic medulloblastoma,” in IEEE 37th Annual Northeast Bioengineering Conf., Troy, NY, USA, pp. 1–2, 2011. [Google Scholar]
9. L. Tchikindas, R. Sparks, J. Baccon, D. Ellison, A. R. Judkins et al., “Segmentation of nodular medulloblastoma using random walker and hierarchical normalized cuts,” in IEEE 37th Annual Northeast Bioengineering Conf., Troy, NY, USA, pp. 1–2, 2011. [Google Scholar]
10. O. Attallah, “MB-AI-his: Histopathological diagnosis of pediatric medulloblastoma and its subtypes via AI,” Diagnostics, vol. 11, no. 2, pp. 359–372, 2021. [Google Scholar]
11. O. Attallah, “CoMB-Deep: Composite deep learning-based pipeline for classifying childhood medulloblastoma and its classes,” Frontiers in Neuroinformatics, vol. 15, pp. 1–19, 2021. [Google Scholar]
12. S. Otálora, A. Cruz-Roa, J. Arevalo, M. Atzori, A. Madabhushi et al., “Combining unsupervised feature learning and riesz wavelets for histopathology image representation: Application to identifying anaplastic medulloblastoma,” in Int. Conf. on Medical Image Computing and Computer-Assisted Intervention, Munich, Germany, pp. 581–588, 2015. [Google Scholar]
13. A. Cruz-Roa, J. Arévalo, A. Judkins, A. Madabhushi and F. González, “A method for medulloblastoma tumor differentiation based on convolutional neural networks and transfer learning,” in 11th Int. Symp. on Medical Information Processing and Analysis, Cuenca, Ecuador, vol. 9681, pp. 8–15, 2015. [Google Scholar]
14. A. Cruz-Roa, J. Arevalo, A. Basavanhally, A. Madabhushi and F. González, “A comparative evaluation of supervised and unsupervised representation learning approaches for anaplastic medulloblastoma differentiation,” in 10th Int. Symp. on Medical Information Processing and Analysis, Cartagena de Indias, Colombia, vol. 9287, pp. 76–81, 2015. [Google Scholar]
15. A. Cruz-Roa, F. González, J. Galaro, A. R. Judkins, D. Ellison et al., “A visual latent semantic approach for automatic analysis and interpretation of anaplastic medulloblastoma virtual slides,” in Int. Conf. on Medical Image Computing and Computer-Assisted Intervention, Nice, France, pp. 157–164, 2012. [Google Scholar]
16. O. Dürr, B. Sick and E. Murina, Probabilistic Deep Learning: With Python, Keras and Tensorflow Probability, 1st ed., Shelter Island, NY, USA: Manning Publications, 2020. [Google Scholar]
17. W. Sun, X. Chen, X. R. Zhang, G. Z. Dai, P. S. Chang et al., “A Multi-feature learning model with enhanced local attention for vehicle re-identification,” Computers, Materials & Continua, vol. 69, no. 3, pp. 3549–3560, 2021. [Google Scholar]
18. W. Sun, G. C. Zhang, X. R. Zhang, X. Zhang and N. N. Ge, “Fine-grained vehicle type classification using lightweight convolutional neural network with feature optimization and joint learning strategy,” Multimedia Tools and Applications, vol. 80, no. 20, pp. 30803–30816, 2021. [Google Scholar]
19. M. Bengs, M. Bockmayr, U. Schüller and A. Schlaefer, “Medulloblastoma tumor classification using deep transfer learning with multi-scale EfficientNets,” SPIE Medical Imaging Digital Pathology, vol. 11603, pp. 70–75, 2021. [Google Scholar]
20. K. He, X. Zhang, S. Ren and J. Sun, “Delving deep into rectifiers: Surpassing human-level performance on imagenet classification,” in Proc. of the IEEE Int. Conf. on Computer Vision, Santiago, Chile, pp. 1026–1034, 2015. [Google Scholar]
21. Database download link: https://ieee-dataport.org/open-access/childhood-medulloblastoma-microscopic-images. [Google Scholar]
Cite This Article
 Copyright © 2023 The Author(s). Published by Tech Science Press.
This work is licensed under a Creative Commons Attribution 4.0 International License , which permits unrestricted use, distribution, and reproduction in any medium, provided the original work is properly cited.
 Downloads
 Citation Tools