
 Submit a Paper
 Propose a Special lssue
 Open Access
ARTICLE

Byte-Level Function-Associated Method for Malware Detection
Information System & Security and Countermeasures Experiments Center, Beijing Institute of Technology, Beijing, 100081, China
* Corresponding Author: Jingwei Hao. Email:
Computer Systems Science and Engineering 2023, 46(1), 719-734. https://doi.org/10.32604/csse.2023.033923
Received 01 July 2022; Accepted 28 October 2022; Issue published 20 January 2023
 View Full Text
 Download PDF
Abstract
The byte stream is widely used in malware detection due to its independence of reverse engineering. However, existing methods based on the byte stream implement an indiscriminate feature extraction strategy, which ignores the byte function difference in different segments and fails to achieve targeted feature extraction for various byte semantic representation modes, resulting in byte semantic confusion. To address this issue, an enhanced adversarial byte function associated method for malware backdoor attack is proposed in this paper by categorizing various function bytes into three functions involving structure, code, and data. The Minhash algorithm, grayscale mapping, and state transition probability statistics are then used to capture byte semantics from the perspectives of text signature, spatial structure, and statistical aspects, respectively, to increase the accuracy of byte semantic representation. Finally, the three-channel malware feature image is constructed based on different function byte semantics, and a convolutional neural network is applied for detection. Experiments on multiple data sets from 2018 to 2021 show that the method can effectively combine byte functions to achieve targeted feature extraction, avoid byte semantic confusion, and improve the accuracy of malware detection.Keywords
Malware is an abbreviation for malicious software, aiming at collecting sensitive information and controlling a device without permission so that the attackers can take advantage of legitimate users financially. The “Malware Threat Situation Report 2020” released by MalwareBytes Labs introduced that compared with 2019, the number of malwares of global windows and Mac increased by 13% and 400%, respectively, in 2020. The number of software programs targeting new commercial ransomware has increased by nearly 820%. The explosive growth of malicious software has severely endangered the property and information security of individuals, enterprises, and the country.
Much effort has been dedicated to the explosive growth of malware, among which dynamic analysis and static analysis are the two main methods for malware classification to obtain features. The dynamic analysis method can use the running data obtained in the virtual environment to judge the malicious nature of the software and effectively resist anti-detection methods such as obfuscation and encryption. However, because some malicious behaviors are triggered only under certain conditions, the software may not be fully executed in the monitored environment, resulting in low code coverage. Meanwhile, dynamic analysis depends on a stable and reliable virtual environment, which consumes many resources and makes it difficult to meet actual application scenarios with high real-time performance and limited memory.
The static analysis method aims to explore all possible execution paths in the software by analyzing the malware source code or binary code to build the statistical characteristics and semantic representation of the deep behavior of the sample. This kind of method directly analyses the binary data, disassembly code, control flow diagram and other characteristics of the sample and combines the correlation algorithm to build the detector. Compared with dynamic analysis, static analysis has higher code coverage, faster feature extraction and a better detection effect, so it has become the focus of research in the field of malware detection.
Existing static analyses can be divided into reverse engineering-based analyses and original byte stream-based analyses. The former depends on complex feature engineering, which is time-consuming. The original byte stream-based analysis takes binary data as input, which is much more efficient, but it is difficult to mine semantic information from binary data, resulting in low detection accuracy. The following explains the characteristics and existing problems of the original byte stream-based analysis methods.
The existing visual malware detection method based on the original binary ignores the functional differences of bytes in different segments. In this method, the code segment bytes with strong logic used to characterize assembly instructions and machine language and the PE file header bytes reflecting file structure information and clear semantics are regarded as data segment bytes with low internal relevance and fuzzy semantics, which leads to byte semantic confusion in different segments and affects the detection accuracy.
To improve the accuracy of malware detection, this paper proposes a byte-level function-associated malware detection method, which exploits semantic representation methods of different functional bytes in various semantic representation modes. First, by analyzing the segment attributes of the bytes, the bytes are divided into three categories: code, structure, and data. Second, the corresponding methods, such as state transition probability statistics, Minhash and gray value mapping, are employed to capture byte semantics and generate three-channel malware characteristic images. Finally, it combines a convolutional neural network (CNN) to realize malware detection. The proposed method only uses the binary information of malware without reverse analysis and dynamic analysis, enabling its application to various systems, such as Windows and Android. The main contributions of this paper are summarized as follows:
(1) Aiming at the problem that existing malware detection methods based on byte streams usually perform undifferentiated feature extraction on byte data, ignoring the functional differences of bytes within different segments, leading to byte semantic confusion and affecting the detection accuracy, a malware detection method based on byte functions is proposed.
(2) The byte function category is determined according to the segment attributes of bytes, and a solution for byte function division is provided.
(3) Our method does not rely on complicated inverse analysis and uses only raw binary data, which makes full use of the functional information of bytes to construct byte-level functional association features, improves the ability to characterize byte semantics, and achieves effective detection of malware.
A large number of excellent results have emerged in research related to malware detection. According to the feature extraction method, it can be divided into dynamic detection and static detection.
The dynamic detection method runs the sample in a safe and reliable virtual environment, monitors all the behaviors of the sample in the actual running state, and judges the maliciousness of the software based on the running data. [1–3] This type of method usually captures the application programming interface (API) calls, data flow, control flow, network connection, memory usage, and file access during software operation and combines machine learning and deep learning algorithms to achieve malware detection. The dynamic detection method is based on the analysis of the running state data, which can effectively resist anti-detection methods such as confusion and encryption. A problem of low code coverage when applying dynamic detection arises, as some malicious behaviors are only triggered under specific conditions. At the same time, dynamic analysis needs to capture operating data for a period of time for analysis, which is costly in time, relies on a stable and reliable virtual environment, consumes large resources, and has difficulty meeting practical application scenarios with high real-time performance and limited memory.
The static analysis method aims to explore all possible execution paths in the sample by analyzing the source code or binary code of the malware to construct the sample’s statistical characteristics and deep-level behavioral semantic representation [4–6]. This type of method directly analyses the binary data [7], disassembly code [8], control flow graph and other characteristics of the sample and constructs a detector in combination with related algorithms. Compared with dynamic analysis, static analysis has higher code coverage, fast feature extraction speed and better detection effect, so it has become the focus of research in the field of malware detection [9].
Static analysis, according to the analysis object, can be separated into two types: analysis based on the original byte stream and analysis based on reverse engineering characteristics. The original byte stream analysis approach uses the original binary data as input, does not require reverse analysis on the sample, and has a high detection efficiency. However, it is difficult to mine the semantic information from the binary data, so the detection accuracy rate is low. The analysis method based on reverse engineering features requires operations such as decompression, decryption, and disassembly of malware, extracting features such as API, disassembly code, and control flow chart. It relies on complex feature engineering and has low analysis efficiency, but reverse engineering features have stronger semantic representation capabilities and therefore stronger detection capabilities.
Le et al. extracted bytecode sequences from the original binary data, used a CNN + BiLSTM network to learn the spatial and temporal characteristics of bytecode sequences, proposed classes the balanced sampling method reduces the interference of unbalanced data detection results and realized malware detection that does not rely on expert experience [10]. The structure information of the PE file reflects the structural characteristics of the software, including information such as the compilation environment and function calls. Many scholars have researched this topic. Raff et al. used only the header information of PE files to detect malware, which proved the important application value of PE file structure information in this task [11].
The development of deep learning technology has brought new ideas and solutions to malware detection tasks based on binary data. Convolutional neural networks have begun to attract the attention of malware analysts due to their outstanding results in image processing with their powerful feature extraction capabilities.
Nataraj et al. applied image processing technology to the field of malware detection for the first time. They converted eight-bit binary data into grayscale pixel values and generated a specific-dimensional malware grayscale image based on the sample size [12]. Cui et al. [13] mapped malware bytes to grayscale values, then used convolutional neural networks to realize malware detection, and combined them with an ant colony algorithm to alleviate the impact of unbalanced data on the detection results. Han et al. [14] converted binary data into grayscale images, constructed an entropy map by calculating the entropy of each row of pixel values to capture the similarities between malware variants, and conducted experiments on packaged software. However, with the evolution of malware variant technology, packaged malware gradually shows the characteristics of low entropy, so the method of determining whether to package based on software entropy is less reliable.
Based on the analysis of the aforementioned main technologies and methods, the existing raw binary-based malware visualization detection method ignores the functional differences of bytes in different segments and uses strong logic to characterize the bytes of assembly instructions and machine language. The PE file header bytes that reflect the file structure information and have clear semantics are regarded as data segment bytes with low internal relevance and ambiguous semantics, which leads to semantic confusion of bytes in different segments and affects the detection accuracy.
Given the above problems, research and study the semantic representation methods of different functional bytes in various semantic representation modes. The bytes are divided into three types, namely, structure, code, and data, according to their functions. By analyzing the semantic representation modes of various types of bytes, they are used accordingly. Methods such as state transition probability statistics, Minhash, and gray value mapping capture byte semantics and improve the accuracy of byte semantic representation.
3 Byte-Level Function-Associated Malware Detection Method
The core idea of the byte-level function-associated malware detection method is to divide the bytes of the malware according to the function and select the appropriate method according to different functions for targeted feature extraction to retain the byte function information and realize the function-associated feature construction as well as malware detection. Specifically, the principal framework of the method is shown in Fig. 1 which includes 3 main steps.
(1) Byte function extraction preprocessing. The purpose of this step is to obtain byte attributes and classify byte functions. First, we analyze the attributes of the segment where the bytes are located to determine the attributes of the bytes. Then, the byte attribute is abstracted, and the byte function category is determined according to the byte attribute. In the PE file, although the attributes of some bytes are different, their functions are similar. For example, the function attribute of the byte in the.data section is “contains initialization data, readable and writable”, and the attribute of the.rdata section is “contains initialization data, readable”; however, although the latter is not writable, both are used to store variable data. Therefore, the above type of byte attribute is abstracted as “data representation”. Based on the above ideas, the method abstracts the byte functions in the PE file into three categories: “structural representation”, “code representation” and “data representation”.
(2) Feature image generation. The purpose of this step is to extract specific features from bytes of different functional types and generate malware feature images to achieve information fusion. The structure characterization type bytes are composed of PE header bytes, and each byte has clear semantics. Therefore, a structure characterization byte set is constructed for each input sample, and the summary information of the set is calculated using the Minhash algorithm and arranged in gray images; the code characterization type byte stores the binary representation of the assembly instruction, which has a strong internal logic and high context relevance. Therefore, the code characterization type byte is mapped to a gray value and converted to a gray image. Its sequence information and spatial structure are retained; data representation type bytes are composed of numerical values and strings, with low internal relevance and weak semantic information. Therefore, statistical analysis methods are used to calculate the probability of byte state transition, generate a state transition matrix and map it to a grayscale image. Three grayscale images are fused into a three-channel malware feature image to achieve information fusion.
(3) Image feature learning and classification. Based on the image data in step (2), the convolutional neural network is used for image feature learning, and the maliciousness detection result of the sample is output.
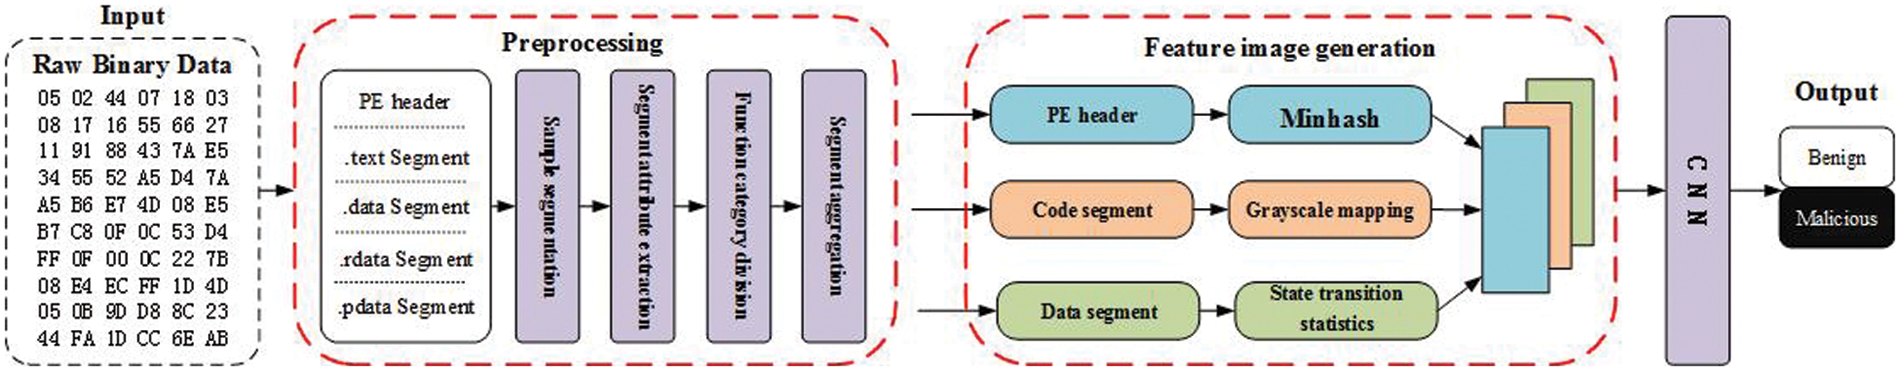
Figure 1: Functional block diagram of the byte-level function-associated malware detection method
3.2 Byte Function Extraction Preprocessing
The PE file is mainly composed of a PE header and multiple segments. Since each part has clear attributes and functions, the semantics of bytes are strongly related to their positions in the PE file. For example, the machine code “B0 05” in the code segment represents the instruction “mov al, 05”. In the data section, it indicates hexadecimal data B005, and in the header of the PE file, it indicates the file type or compilation platform of the file. The indiscriminate processing of bytes ignores the abovementioned byte function information and mixes the bytes of each segment, causing byte semantic confusion. Therefore, it is necessary to extract the byte function information and design a targeted feature extraction method. The byte function extraction module consists of two key steps: segment attribute analysis and function type extraction.
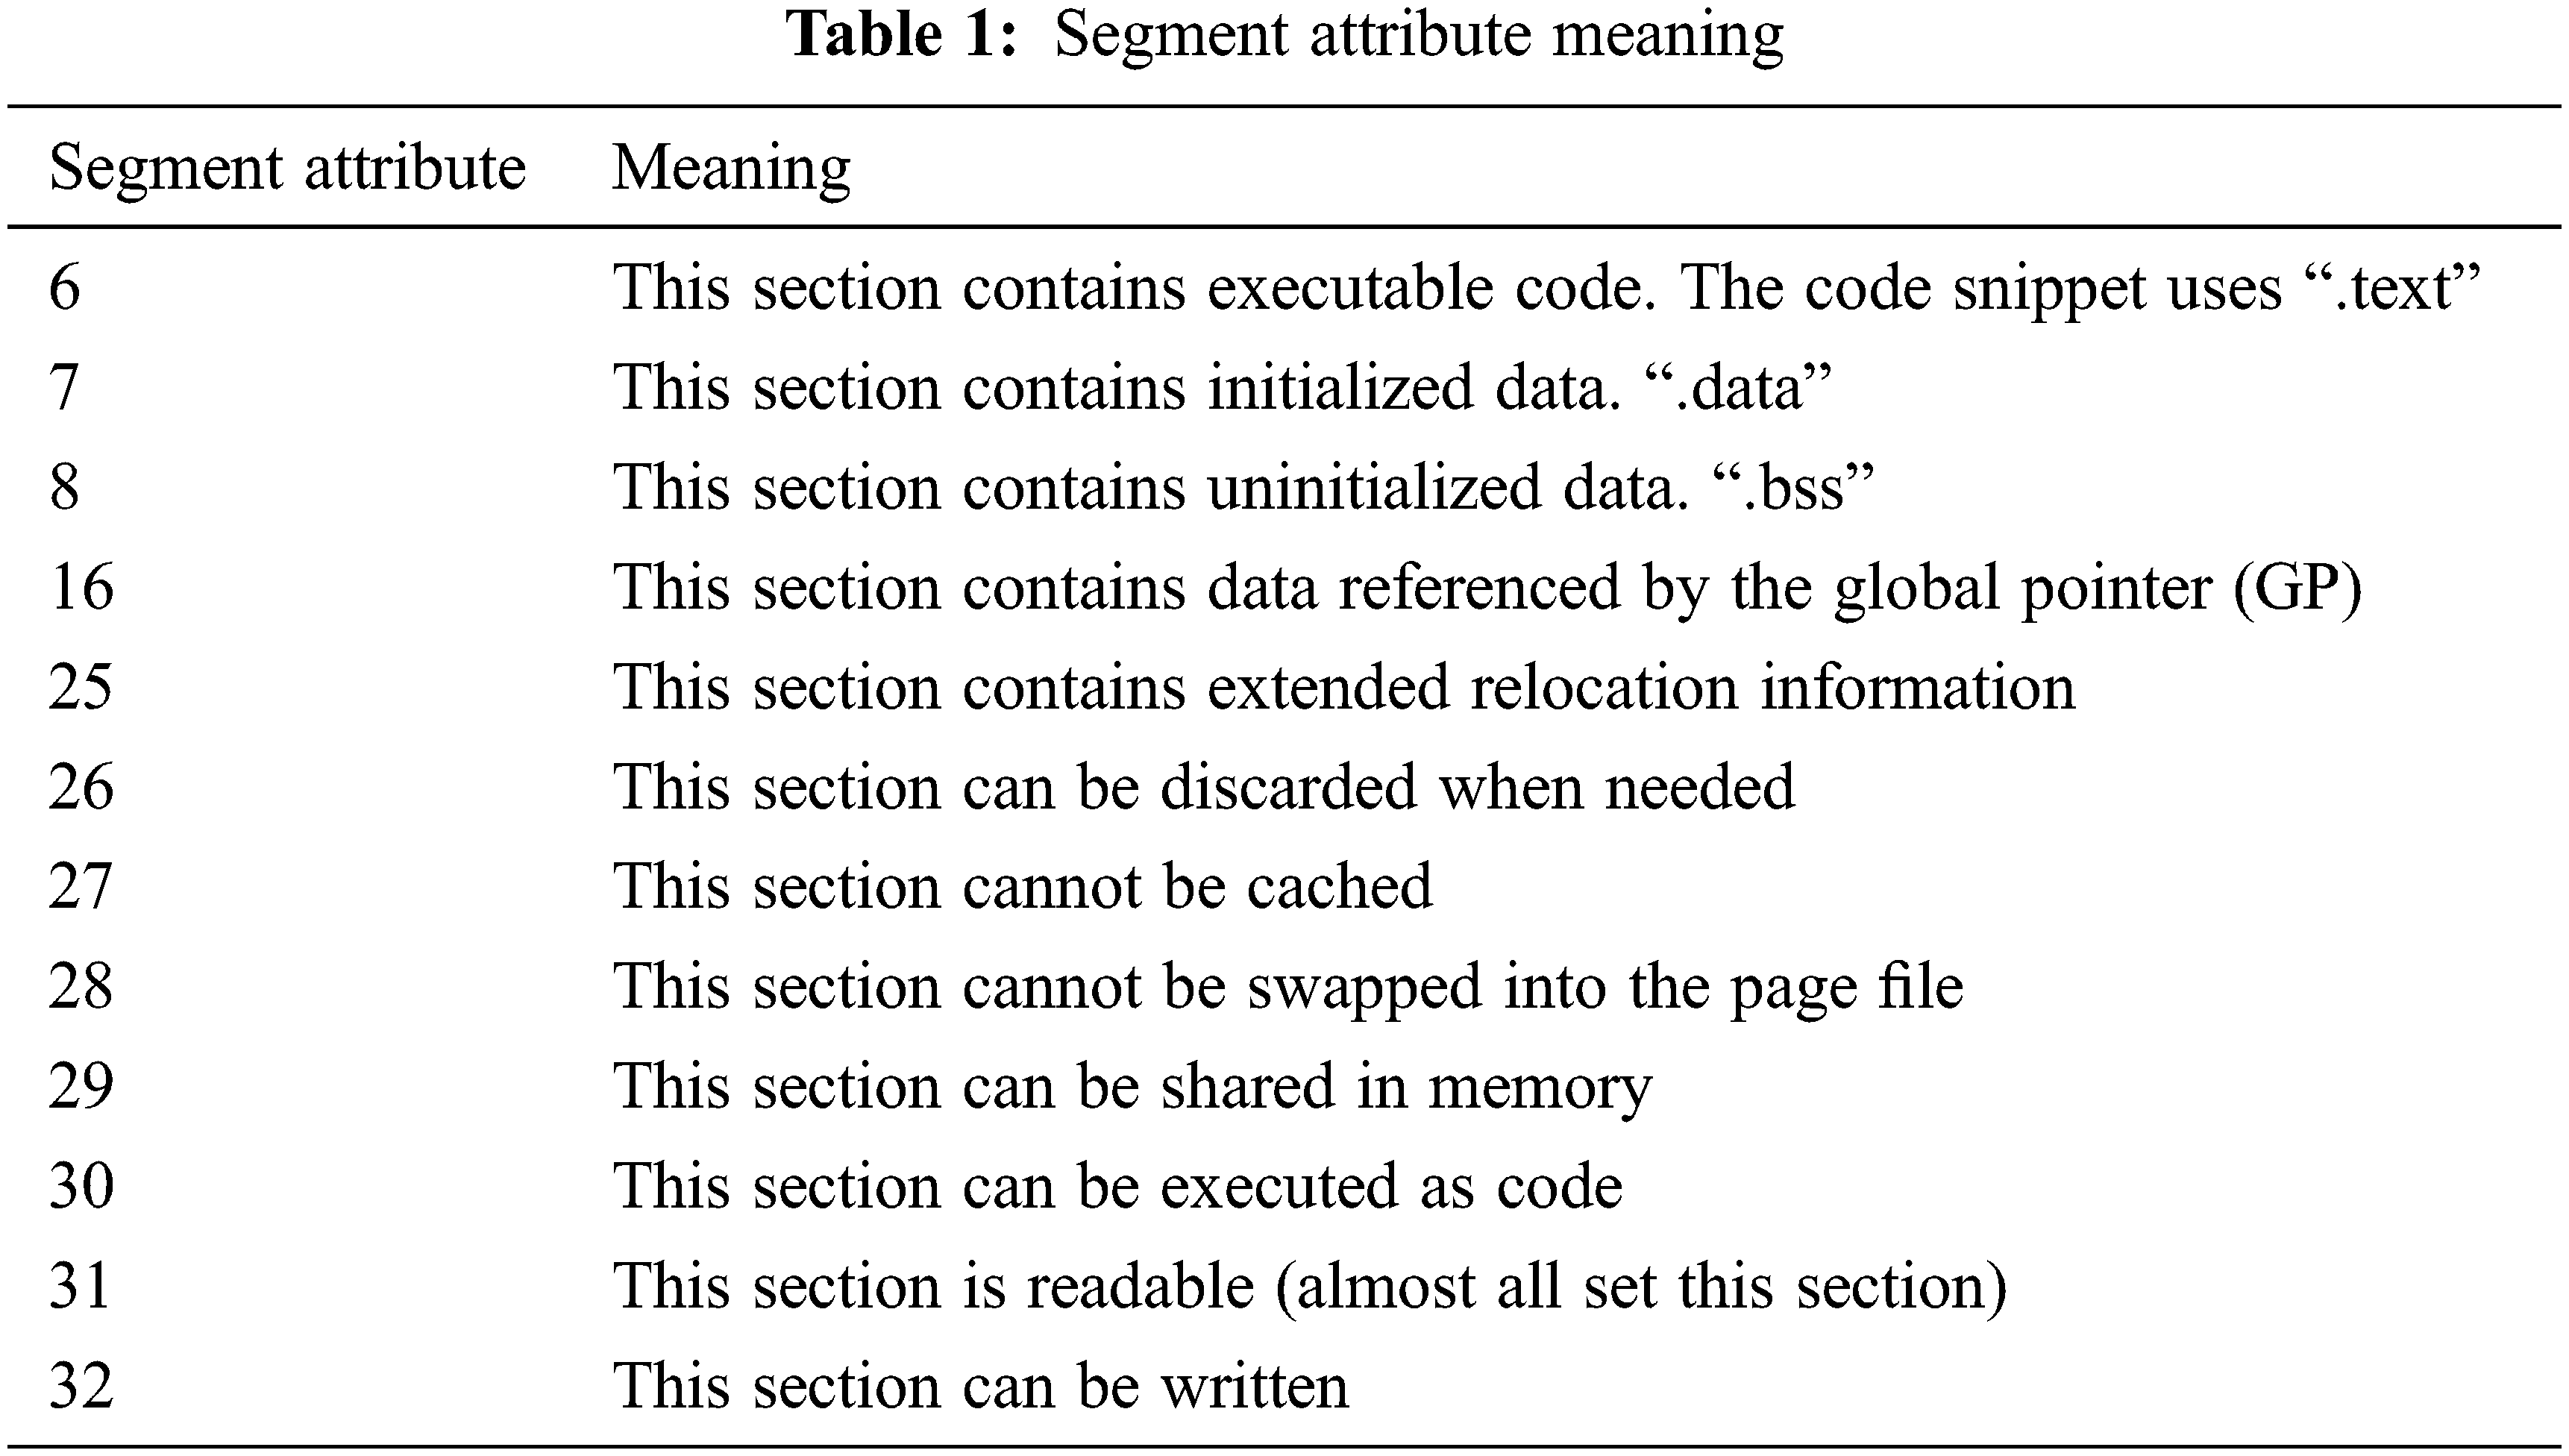
The purpose of segment attribute analysis is to determine the byte attribute based on the segment where the byte is located. Since the semantics of bytes are closely related to their position in the PE file, the segment attribute of the segment where the byte is located is extracted as the attribute of the byte. The segment attribute is 32-bit binary data, and the meanings of common bits are shown in Table 1.
After obtaining the byte attributes, the function category must be further analyzed from the byte attributes. Although the attributes of some bytes in the PE file are different, their functions are very similar. For example, the functional attributes of the bytes in the.data section are “contains initialization data, readable and writable”, and the attributes of the.rdata section are “contains initialization data, can be written and read”. Although the latter is not writable, both are used to store variable data, so the abovementioned type of byte attribute is abstracted as “data representation”. In the same way, based on the above ideas, the method abstracts the byte functions in the PE file into three categories: “structural representation”, “code representation” and “data representation”.
The structure characterization type byte specifically refers to the head byte of the PE file, which is used to characterize the software structure, external reference information and compilation environment. It has a fixed structure, and its characteristic is that each byte has clear semantics. The code characterization type byte refers to the byte used to store the software running code. Its attribute characteristic is that the 6th or 31st bit is 1, indicating that this type of byte contains executable code and can be executed as code, which is common in code segment.text and user-defined segments. This type of byte is the binary embodiment of the assembly code, and the internal logic is strong. Data characterization type byte refers to the byte used to store various types of data, such as numeric value and character string. Its segment attribute feature is that the 7th or 8th bit is 1, and initialized and uninitialized data are regarded as data characterization. Class byte, common in.data section.rdata section, etc. Since each type of data is stored in binary form, it is difficult to distinguish within the data segment, and the data are independent of each other, so the internal relevance of data segment bytes is low and the semantics are ambiguous.
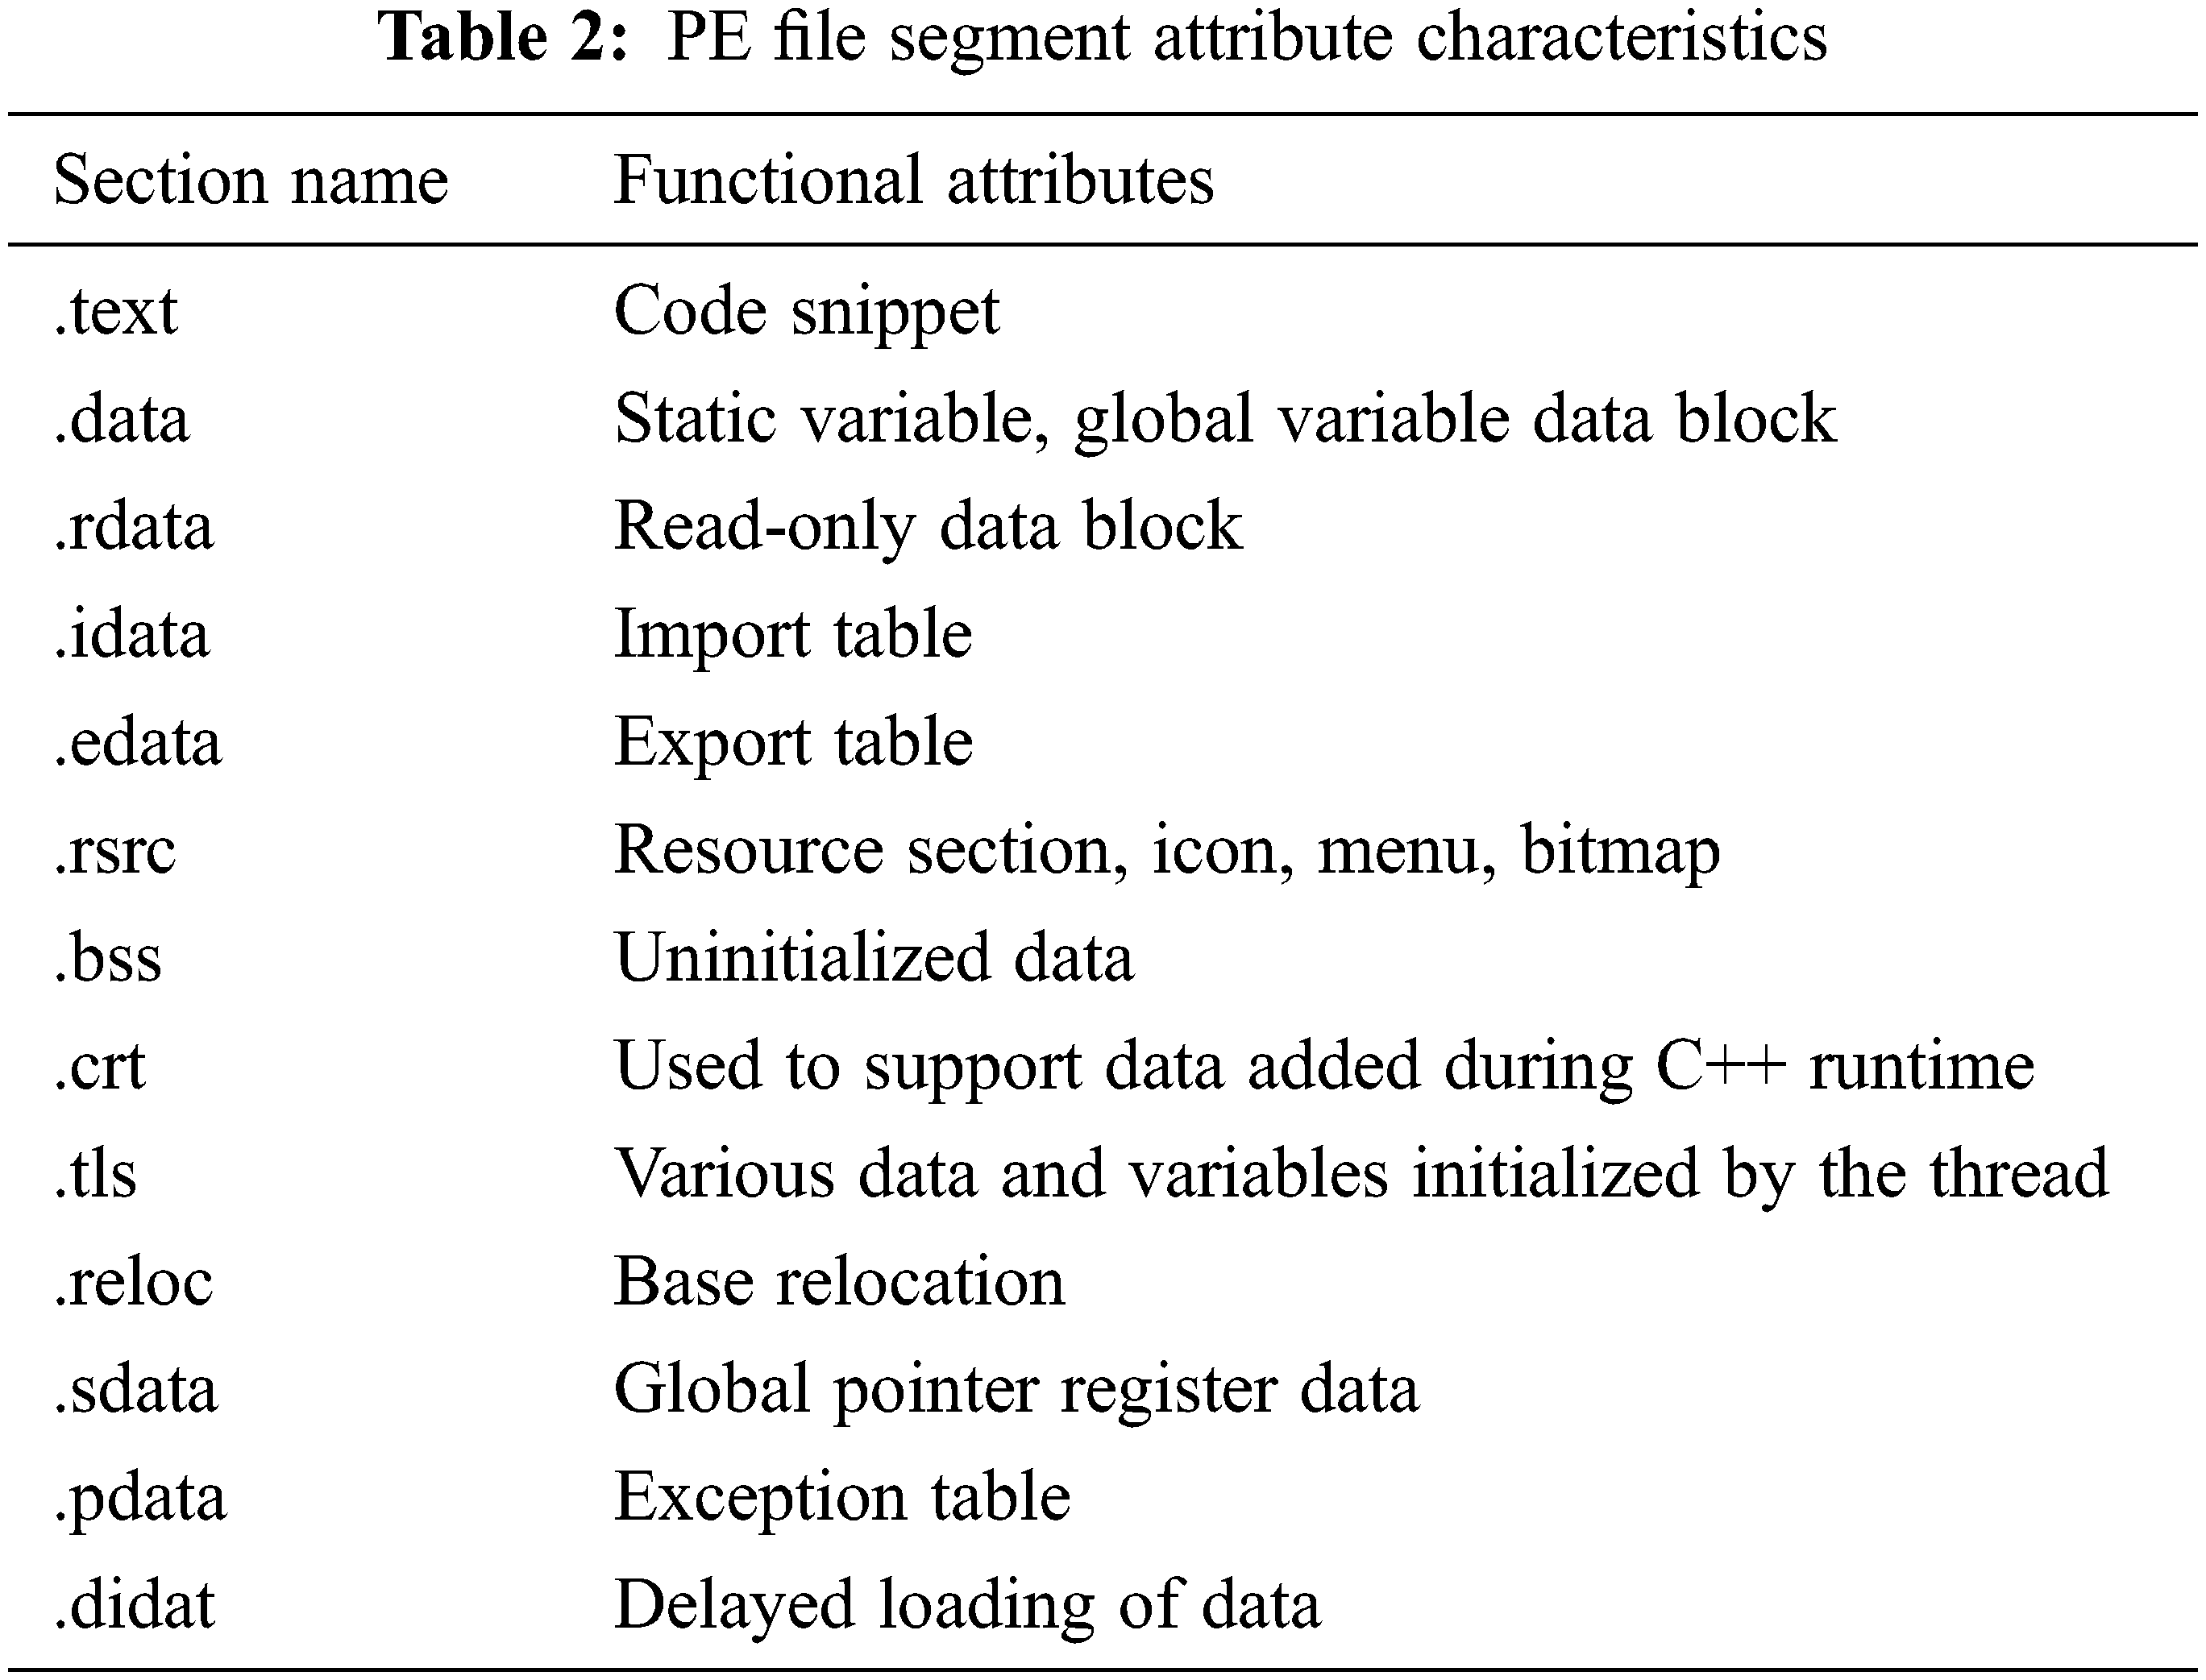
After determining the functional category of all bytes, the same type of bytes is spliced according to the sequence in the file to obtain a structure characterization byte sequence, a code characterization byte sequence, and a data characterization byte sequence. After the above process, the functional attributes of each byte can be abstracted for subsequent targeted analysis. Refer to Table 2 attributes and function categories corresponding to each part of the data in the PE file.
The feature image generation module aims to extract specific features from bytes of different functional types and generate malware feature images to achieve information fusion. To describe the image generation process more clearly, input sample
For the structure characterization byte
The Minhash algorithm uses the Jaccard similarity coefficient to measure the similarity of sets. For set
The Jaccard coefficient is between 0 and 1. When
Assuming that
In practical applications, it is difficult for the hash function h(x) to have good uniformity, and it is difficult to avoid hash collisions in the case of large amounts of data. Therefore, the probability of
Then, for sets
After Minhash calculation, the Jaccard coefficients of sets
Under normal circumstances, the more hash functions that are selected, the more accurately the Minhash algorithm estimates the Jaccard coefficient.
In the Minhash signature calculation process, a total of 256 * 256 = 65536 different hash functions are set through the random seed, and the hash calculation process is shown in formula (7) each time. In the formula,
After 65536 hash operations, the signature
The signature
Regarding the code characterization byte
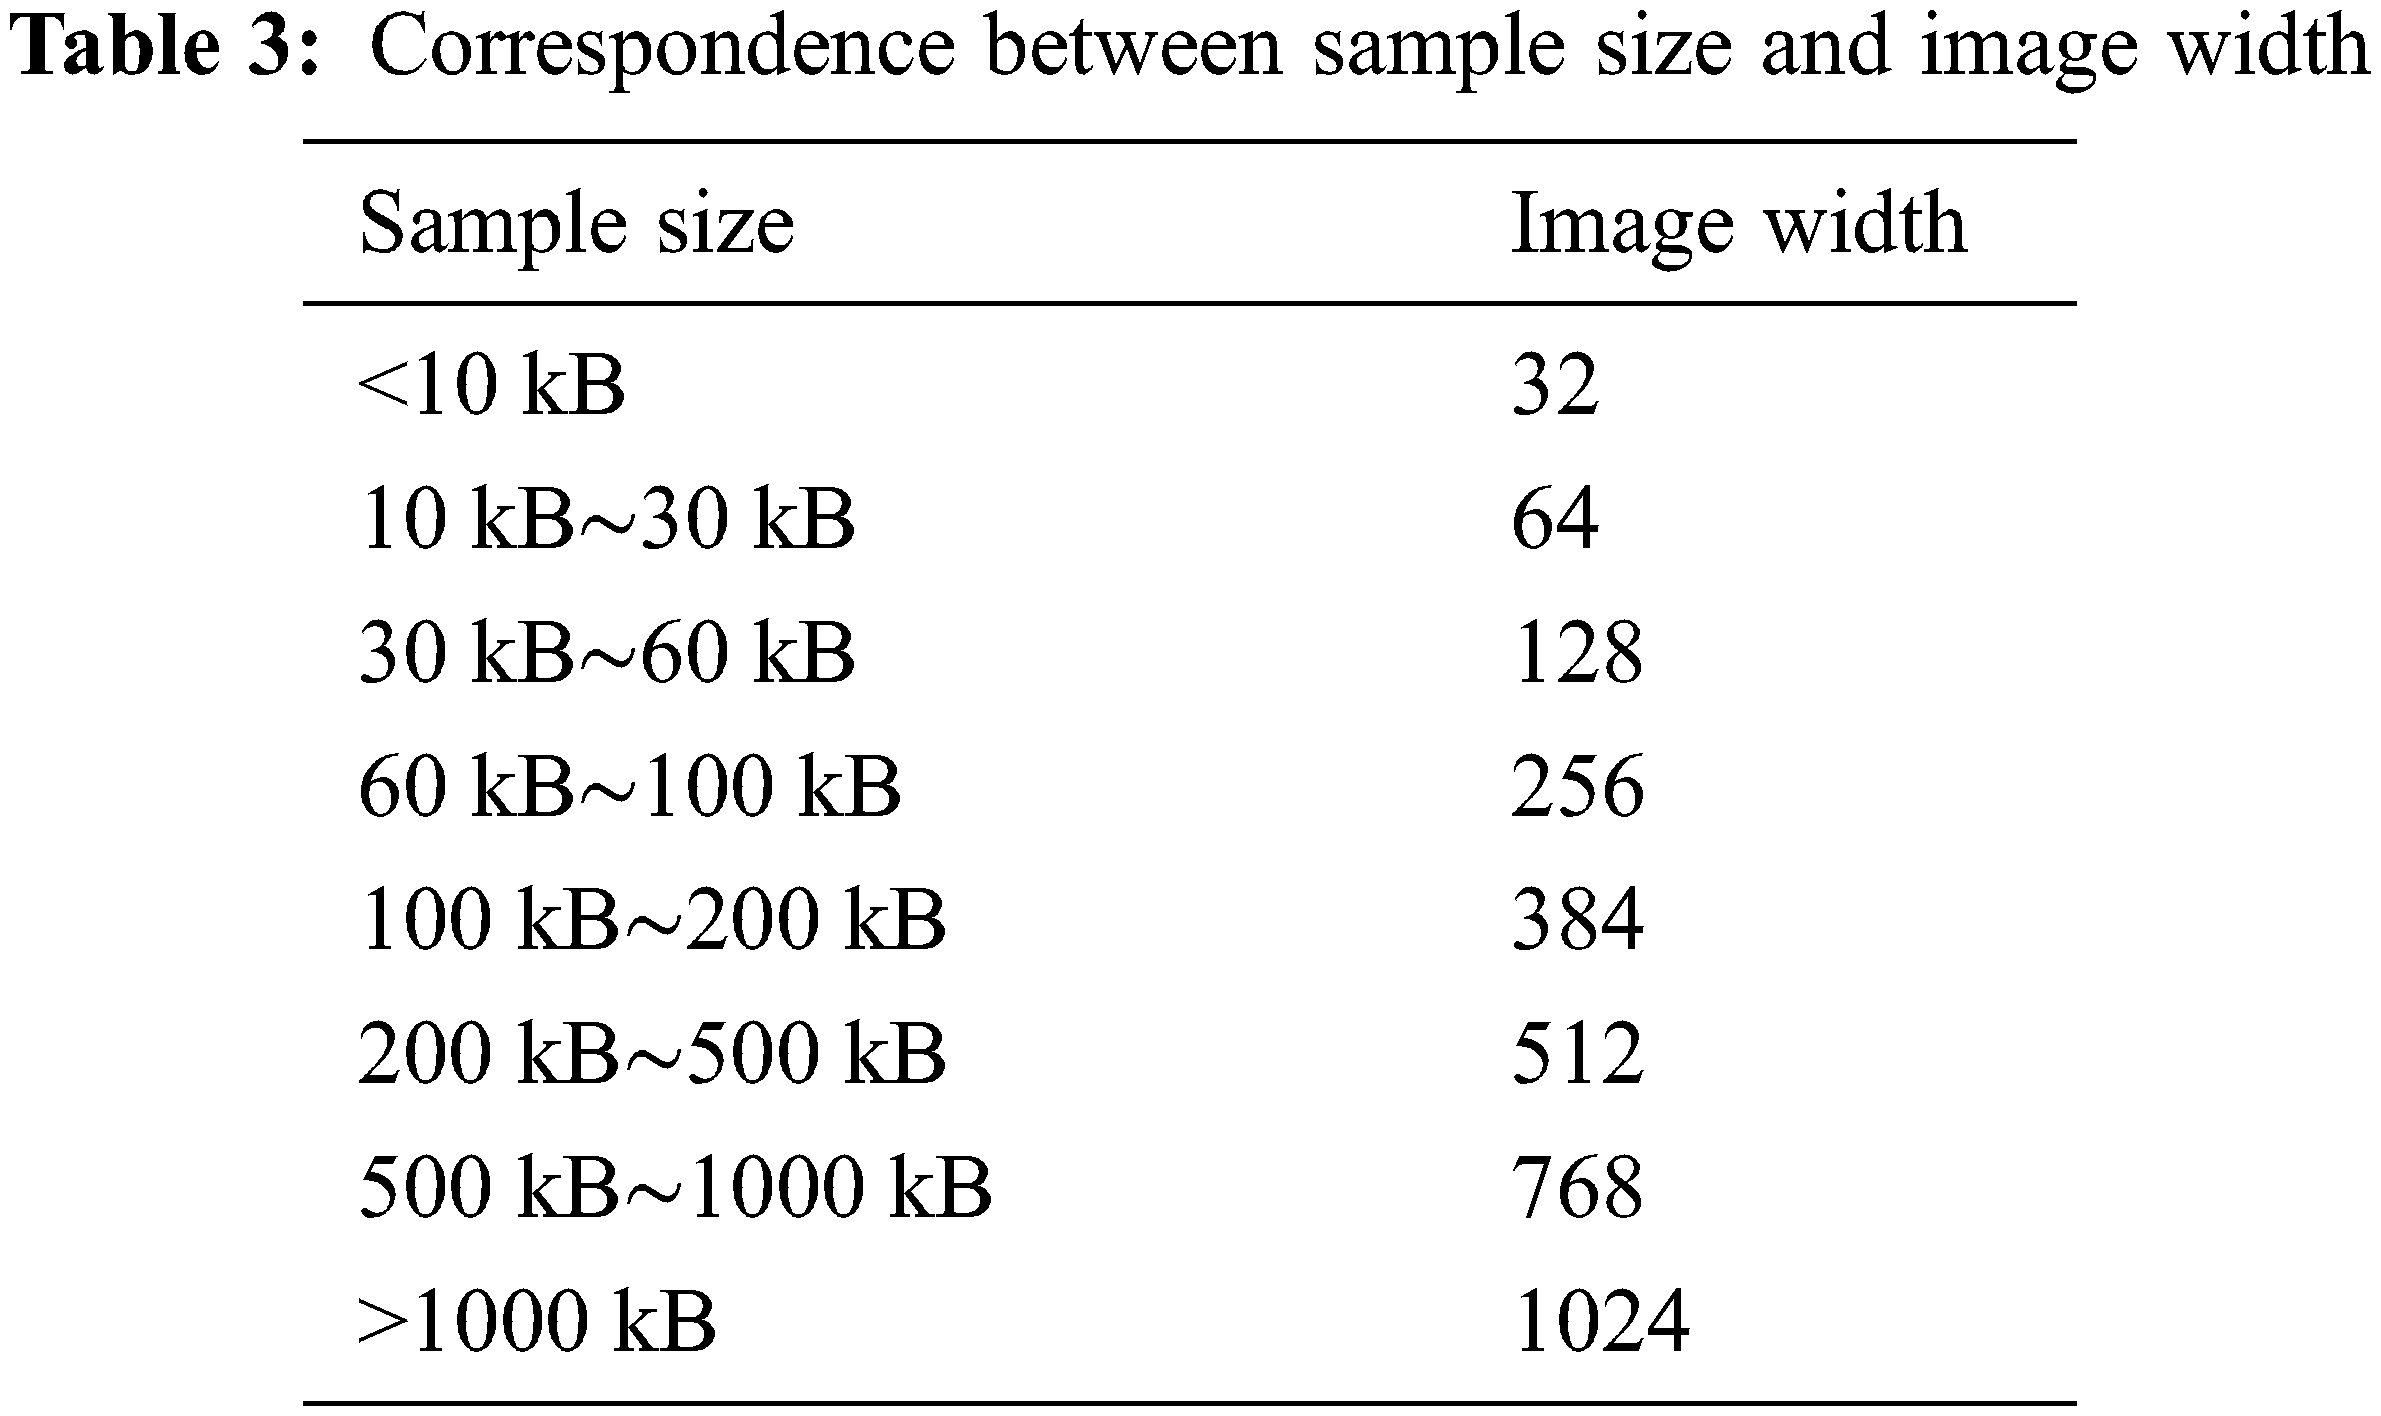
Since the convolutional neural network has the limitation of a fixed input dimension, it is necessary to perform dimension normalization processing on the grayscale image of the code characterization byte. After statistical analysis, the median sample size was 80 KB. According to the mapping relationship in Table 3, the image is uniformly scaled to 256 * 256, and the code characterization byte grayscale image
For the data characterization byte
In the formula,
Since the value of each byte is in the range of 0–255, there are 256 possible states of byte
In the formula,
According to the matrix
Thus far, all the bytes of each input sample are divided into three parts according to the function category, and a specific algorithm is selected for targeted feature extraction according to the characteristics of each part, which realizes the construction of functionally related features and arranges the features into grayscale images. Obtain the structure characterization byte image
3.4 Image Feature Learning and Classification
After the abovementioned visualization operation, each input sample is converted into a three-channel feature image. The network uses the ReLU function as the activation function to enhance the nonlinear expression ability of the network. When designing the experiment, considering that there are certain differences in the feature attributes of various types of bytes, the network structure complexity required for the fastest convergence is different, so three different convolutional neural networks are initially designed. During the experiment, it was found that although the
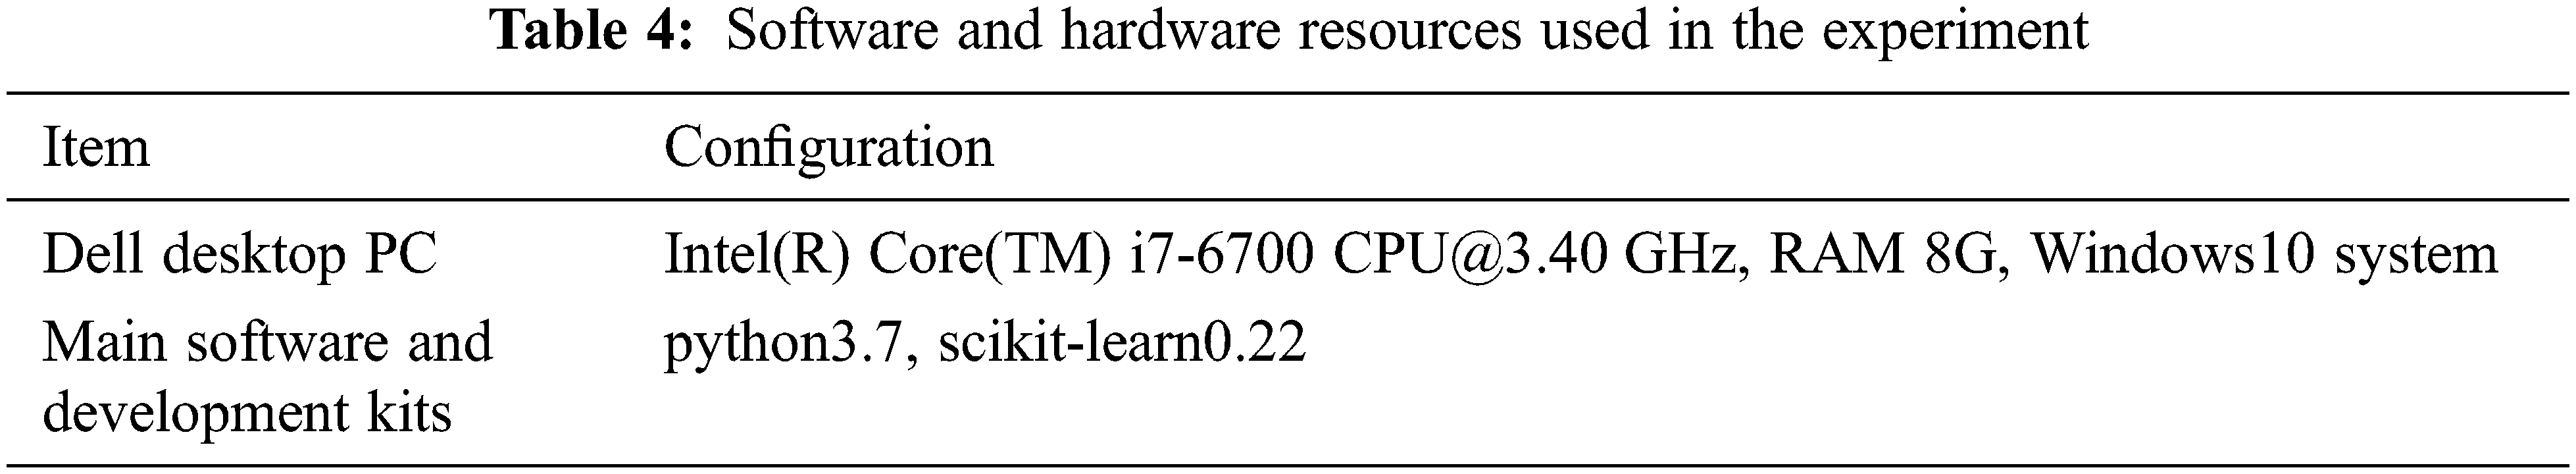
4.1 Experimental Environment and Conditions
The hardware and software environment used in the experiment is shown in Table 4.
The experiment uses the standard statistical indicators of machine learning, accuracy, recall, precision, and F1-score to accurately evaluate the performance of the classification model to more fully reflect the effectiveness of the method sex and reliability. The calculation method of each evaluation index is shown in Table 5.
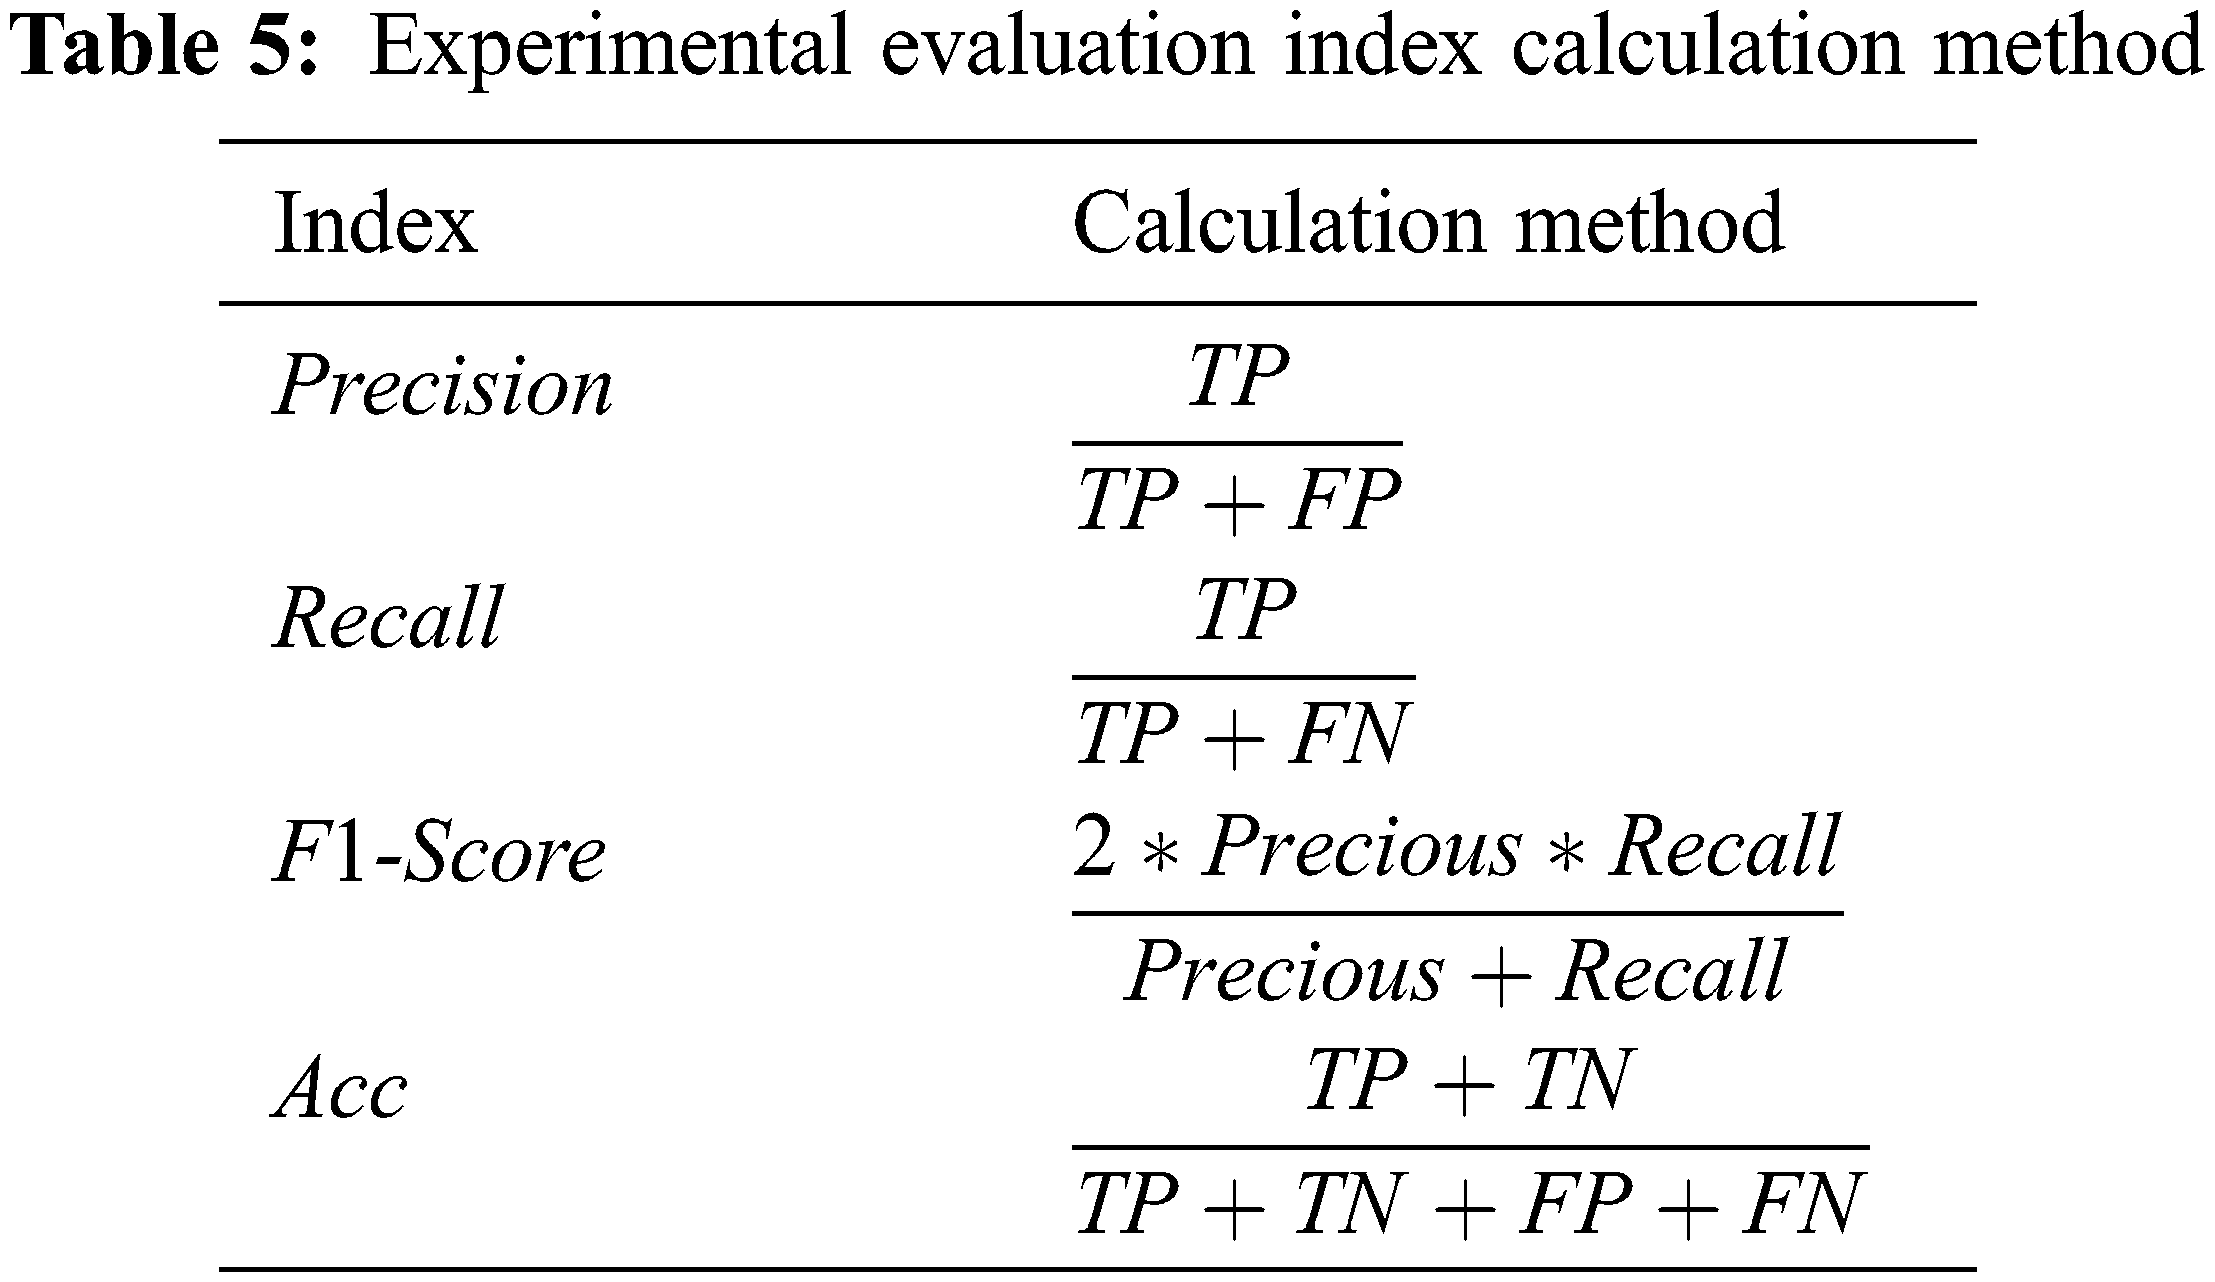
Among them, TP is the number of samples that are correctly classified as malware; TN is the number of samples that are correctly classified as benign software; FP is the number of samples that misclassify benign software as malware; FN is the number of samples that misclassify malware as benign software Quantity.
The ablation test experiment aims to explore the contribution of each part of the information in the sample to the judgment of maliciousness and verify the effectiveness and feasibility of the three functional correlation feature extraction methods.
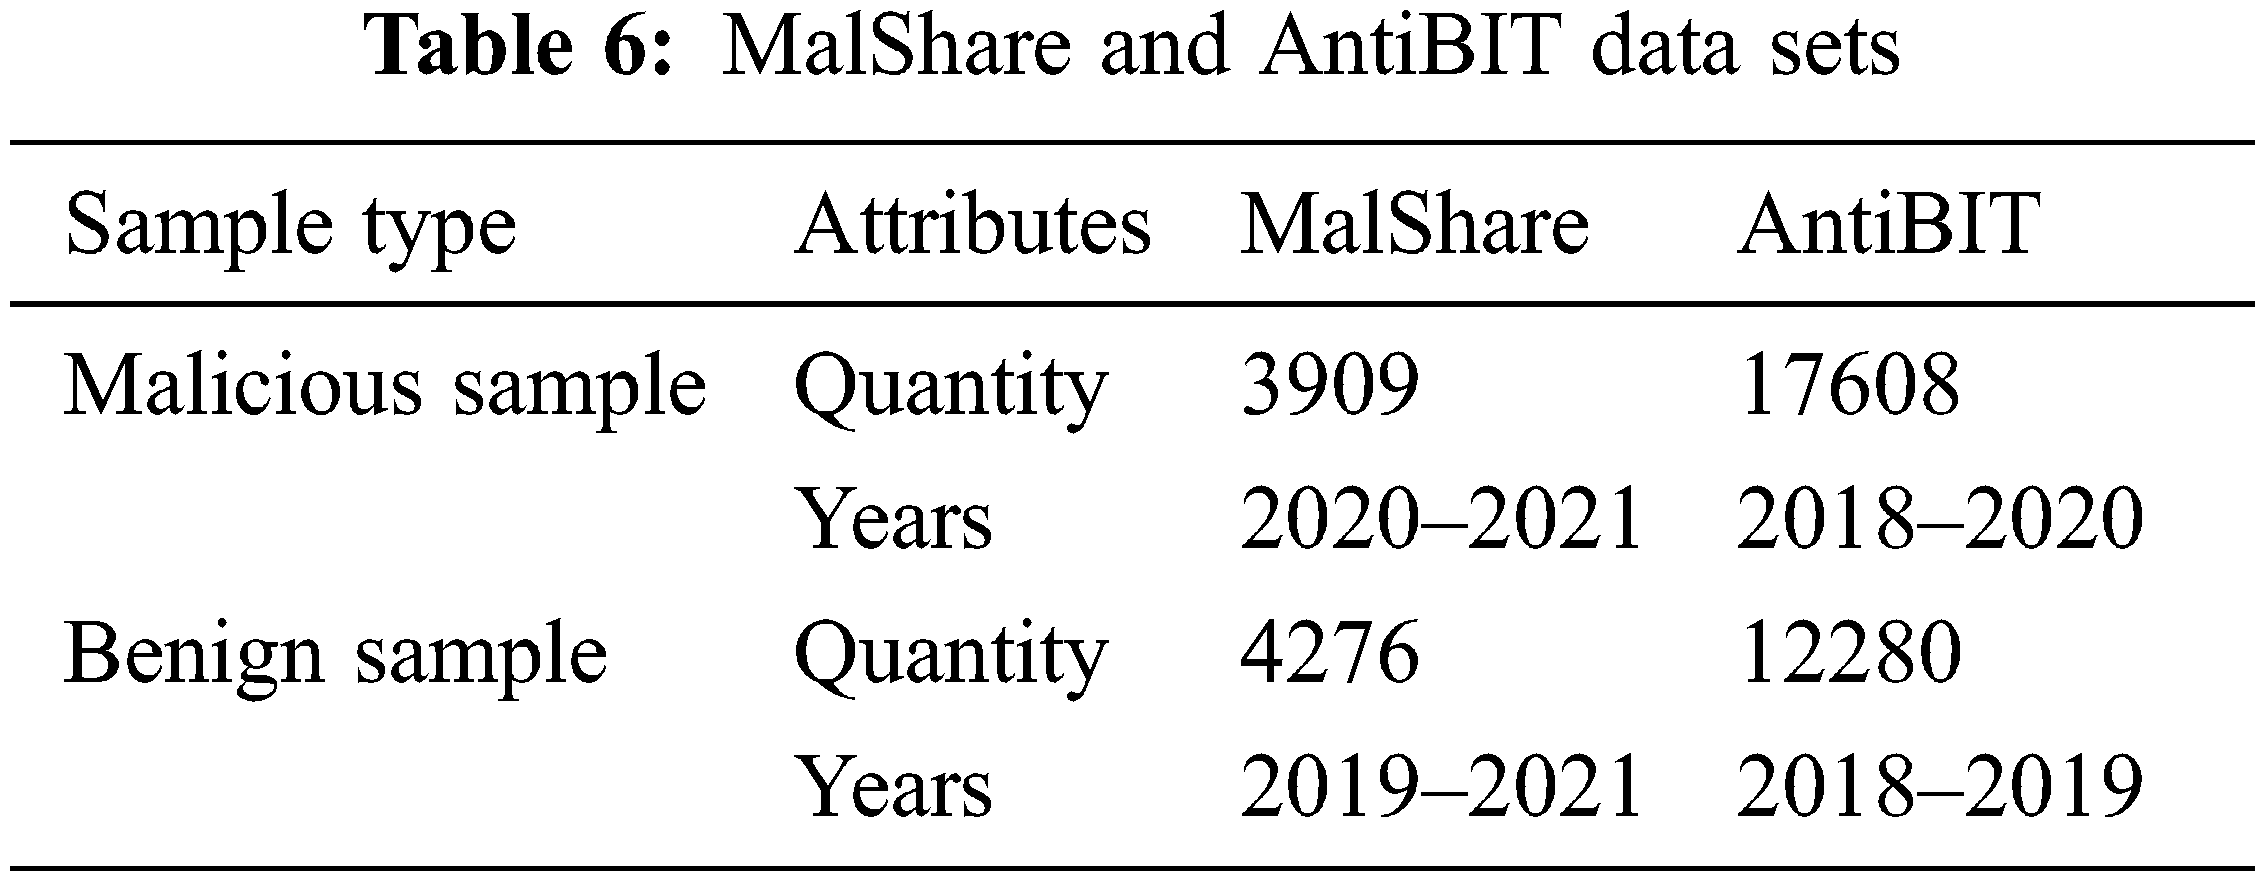
Table 6 shows the data sets applied in the experiments. The experimental data contain two data sets, MalShare and AntiBIT. MalShare is a public data set that contains tens of thousands of the latest malware data and its tags. To ensure the advancement of the experimental data, the experiment selected all samples from 2019 to early 2021 in the MalShare data set, which contained 3909 malware and 4276 benign software. The data set of malicious samples actually captured by the industry from 2018 to 2020 provided by Antiy Labs provided by AntiBIT includes 12,280 benign samples and 17,608 malware from 78 families.
To verify the effectiveness of different feature extraction methods for the three bytes, the following 4 sets of ablation test experiments are designed.
(1) To verify whether the Minhash algorithm method can target the clear semantic characteristics of the structure characterization byte sequence, the main characteristics of the sequence are retained to compare the sequence similarity, and the Minhash algorithm is used to calculate the hash signature of the structure characterization byte sequence to construct gray degree images to realize malware detection.
(2) To prove whether grayscale mapping can effectively retain the spatial structure information and context-related information of the internal strong logic and context correlation characteristics of the code characterization byte, the grayscale mapping code characterization byte is converted to grayscale. Image and test accuracy.
(3) To prove whether the state transition probability statistics method can effectively reflect the statistical characteristics of the data characterization byte sequence and the statistical data characterize the state transition of the class byte, construct the state transition probability graph and test the accuracy of malware detection.
(4) To prove that the image fusion method can make full use of the functional categories of the information of each part of the byte to realize the feature extraction and construction of functional associations, the above three feature images are combined and tested.
The above 4 methods are used for experimental analysis on 2 data sets, and 8 sets of experimental results are obtained. See Table 7 for details of the experimental parameter settings.
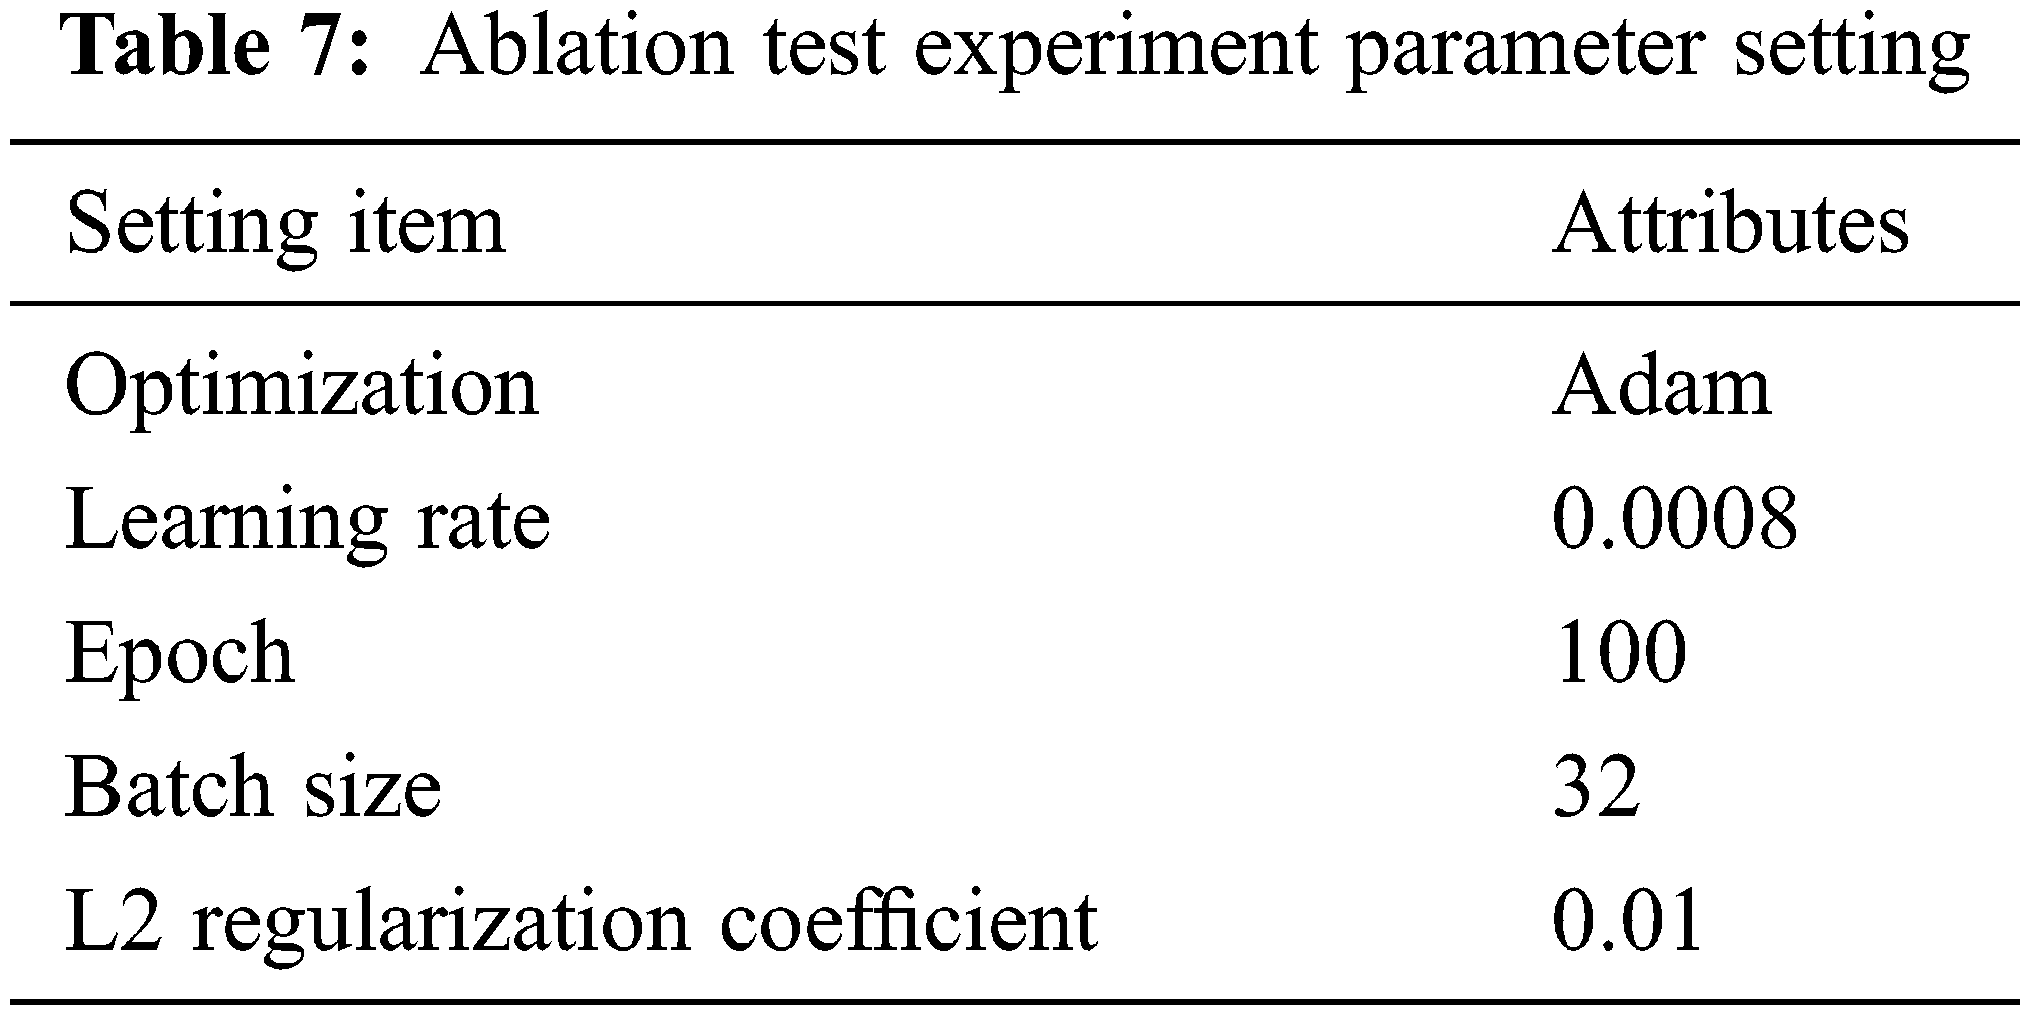
The experiment uses the 5-fold cross-validation method to test the effect, and the average value of each index in the 5-fold crossover process is used as the final experimental result. At the same time, the L2 regular term is added to the experiment to enhance the generalization ability of the model. In terms of experimental data division, considering that the number of unknown malware in actual network scenarios is much larger than known, 40% of the data are divided into the training set, 10% of the data are used as the verification set, and 50% of the data are used as the test set.
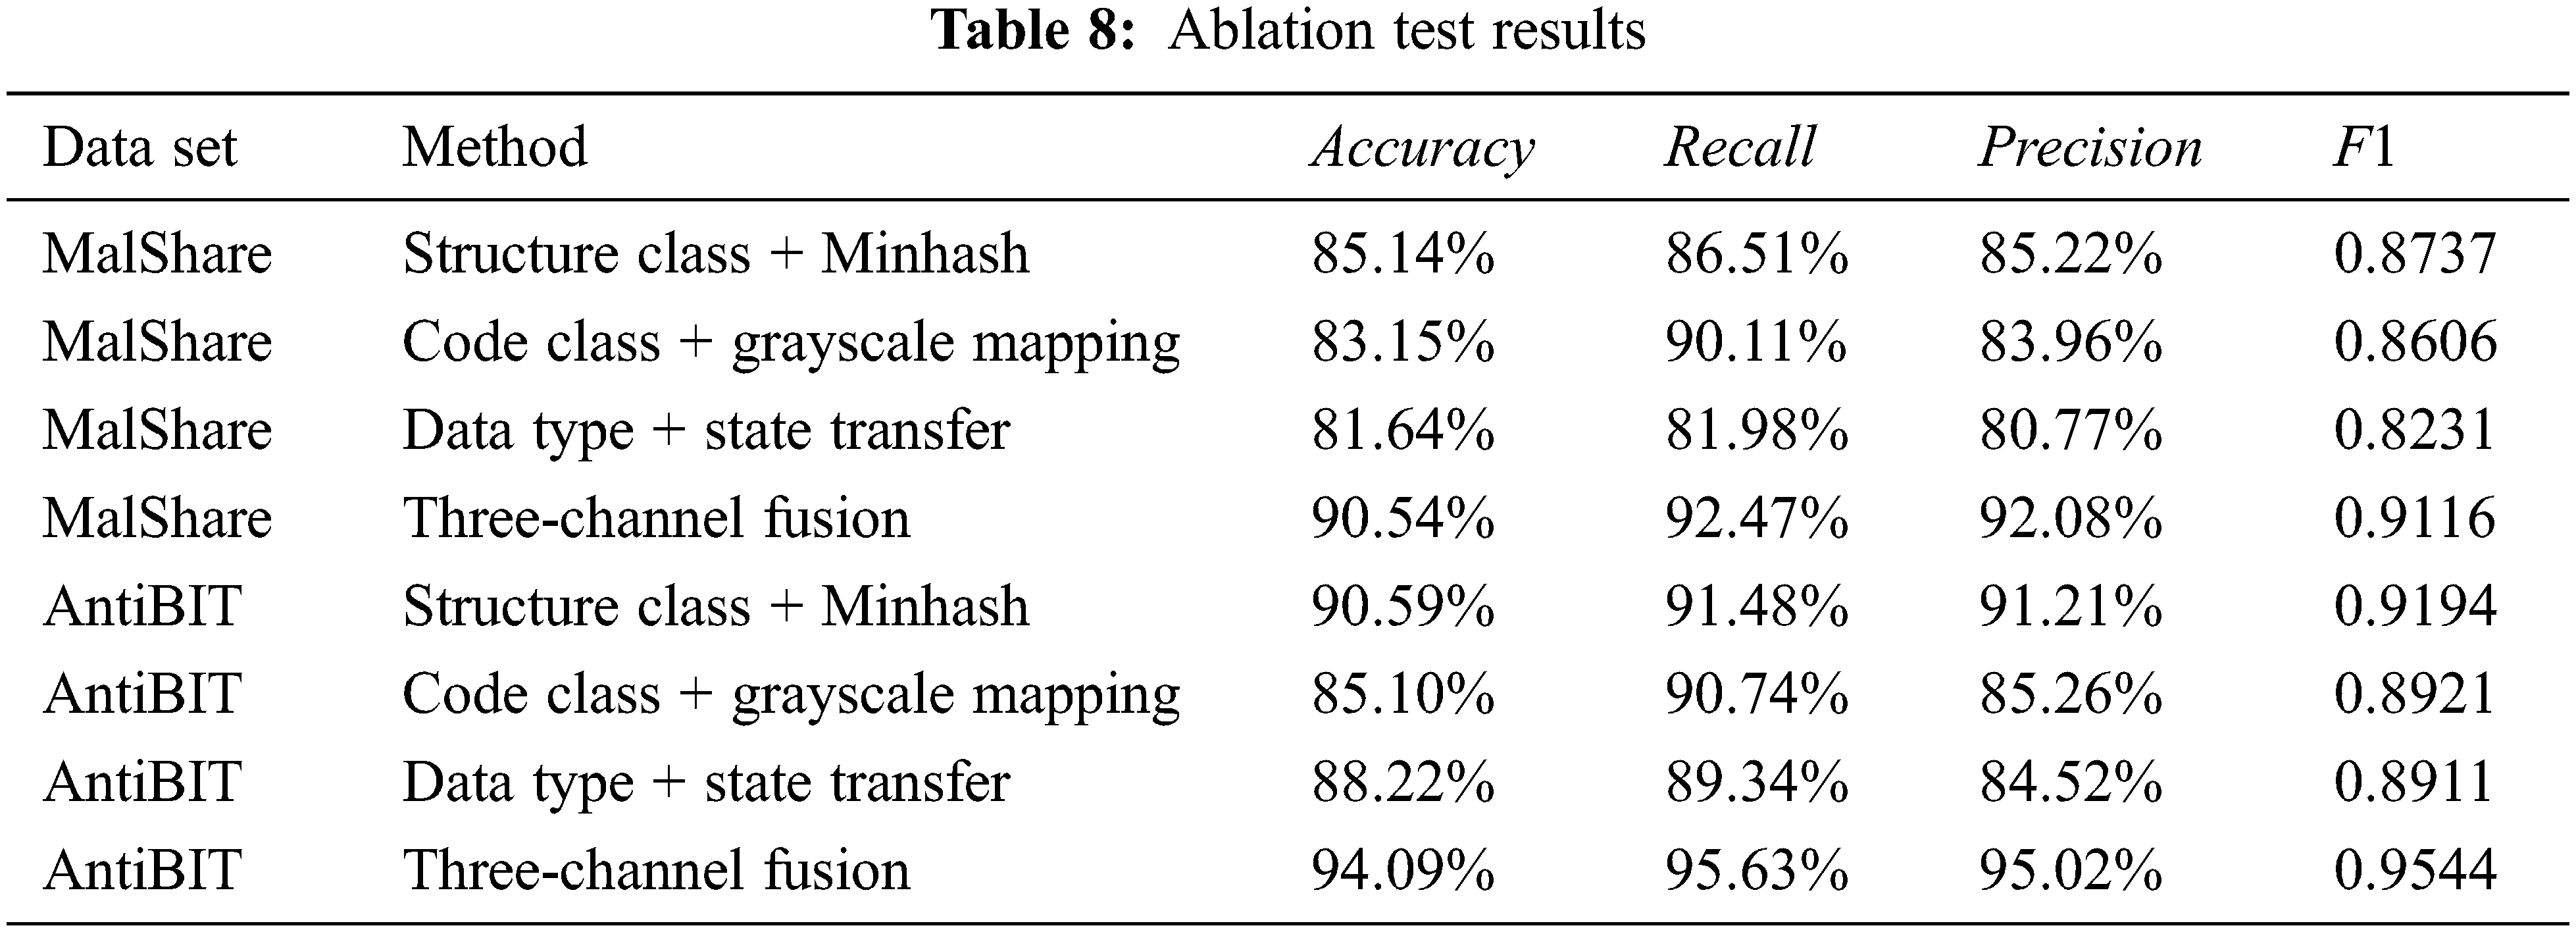
The 8 experimental results obtained by the 4 ablation test methods on the 2 data sets are shown in Table 8.
(1) The three feature extraction methods can effectively construct functional correlation features according to functional categories and improve the detection effect. The three feature extraction methods reached an accuracy rate of more than 81% on the MalShare data set and 85% on the AntiBIT data set, indicating that Minhash, gray value mapping and state transition probability statistics can effectively realize targeted feature extraction on structure bytes, code bytes and data bytes and construct the malware feature image related to the function. At the same time, the experimental effect of the three-channel feature image fusion is increased by up to 10% compared to the single-channel effect by 5%. This increase proves that the image fusion method can make full use of the functional categories of the information of each part of the byte to improve the malware detection effect.
(2) There are significant differences in the contribution of bytes of different functional categories to the detection results and detection capabilities. The structure byte has the highest contribution. It performs well on both data sets, while the code byte and data byte contribute less. In addition, the code byte has a high recall rate on both data sets, indicating that the use of the code byte for detection has a low rate of false negatives, and it has a strong ability to detect unknown malware. Many studies in recent years only use code snippets for malware analysis. These research results show that the data in the code segment can better characterize the behavior of the software. Analysis from the perspective of software behavior can explore the potential behavior patterns of malware and help discover unknown malware. This conclusion is consistent with the experimental results of this chapter. In addition, although the data byte has a higher accuracy rate, the precision (accuracy rate) is significantly lower than other methods, indicating that the use of the data characterization type byte for detection has a higher false positive rate. Through the analysis of the output convolution kernel parameters, it is found that there are more empty bytes and 0xCC bytes in the benign software, which causes the model to focus on the state transition of these two bytes when judging the benign software, and these two bytes appear. The reason is that the default filling value of stack initialization has nothing to do with whether the software is malicious, so some malware is misclassified as benign.
4.4 Comparative Analysis Experiment
The comparative analysis experiment verifies the effectiveness of the proposed method by comparing two other advanced malware detection methods. The data source used in the experiment is the same as the ablation test experiment; see Section 4.2.1 for details.
The comparative analysis experiment refers to the advanced GDMC algorithm in 2020 [1] and the excellent DMDL algorithm in 2018 [13]. The network structure used in each method is reproduced with reference to the description in the comparative literature. The network structure used in the work of this chapter is explained in detail in Section 3.3.4. GDMC uses a VGG-16 network structure, and DMDL uses a seven-layer neural network. The structure is shown in Fig. 2.
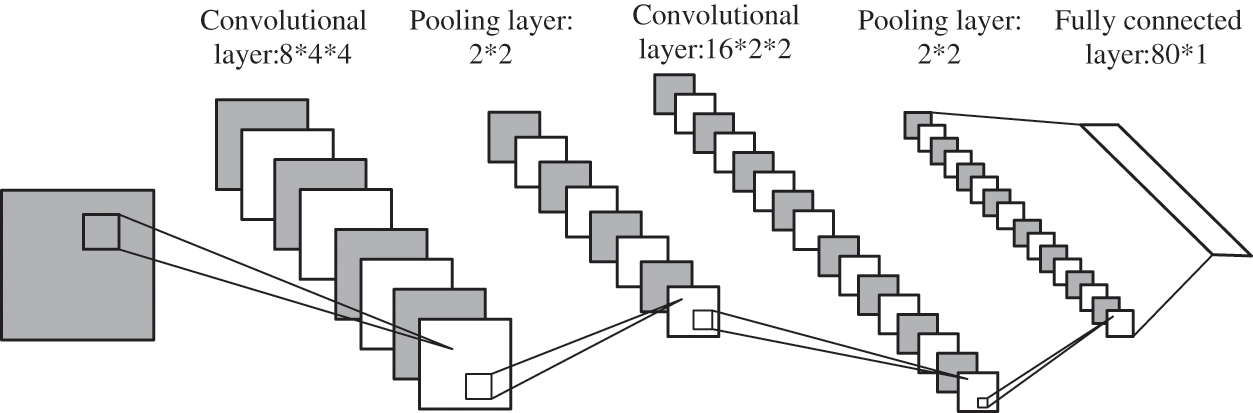
Figure 2: DMDL network structure diagram
The comparative experiment uses the 5-fold cross-validation method to obtain the experimental results. The training parameters of each convolutional neural network are the same as those of the ablation test experiment.
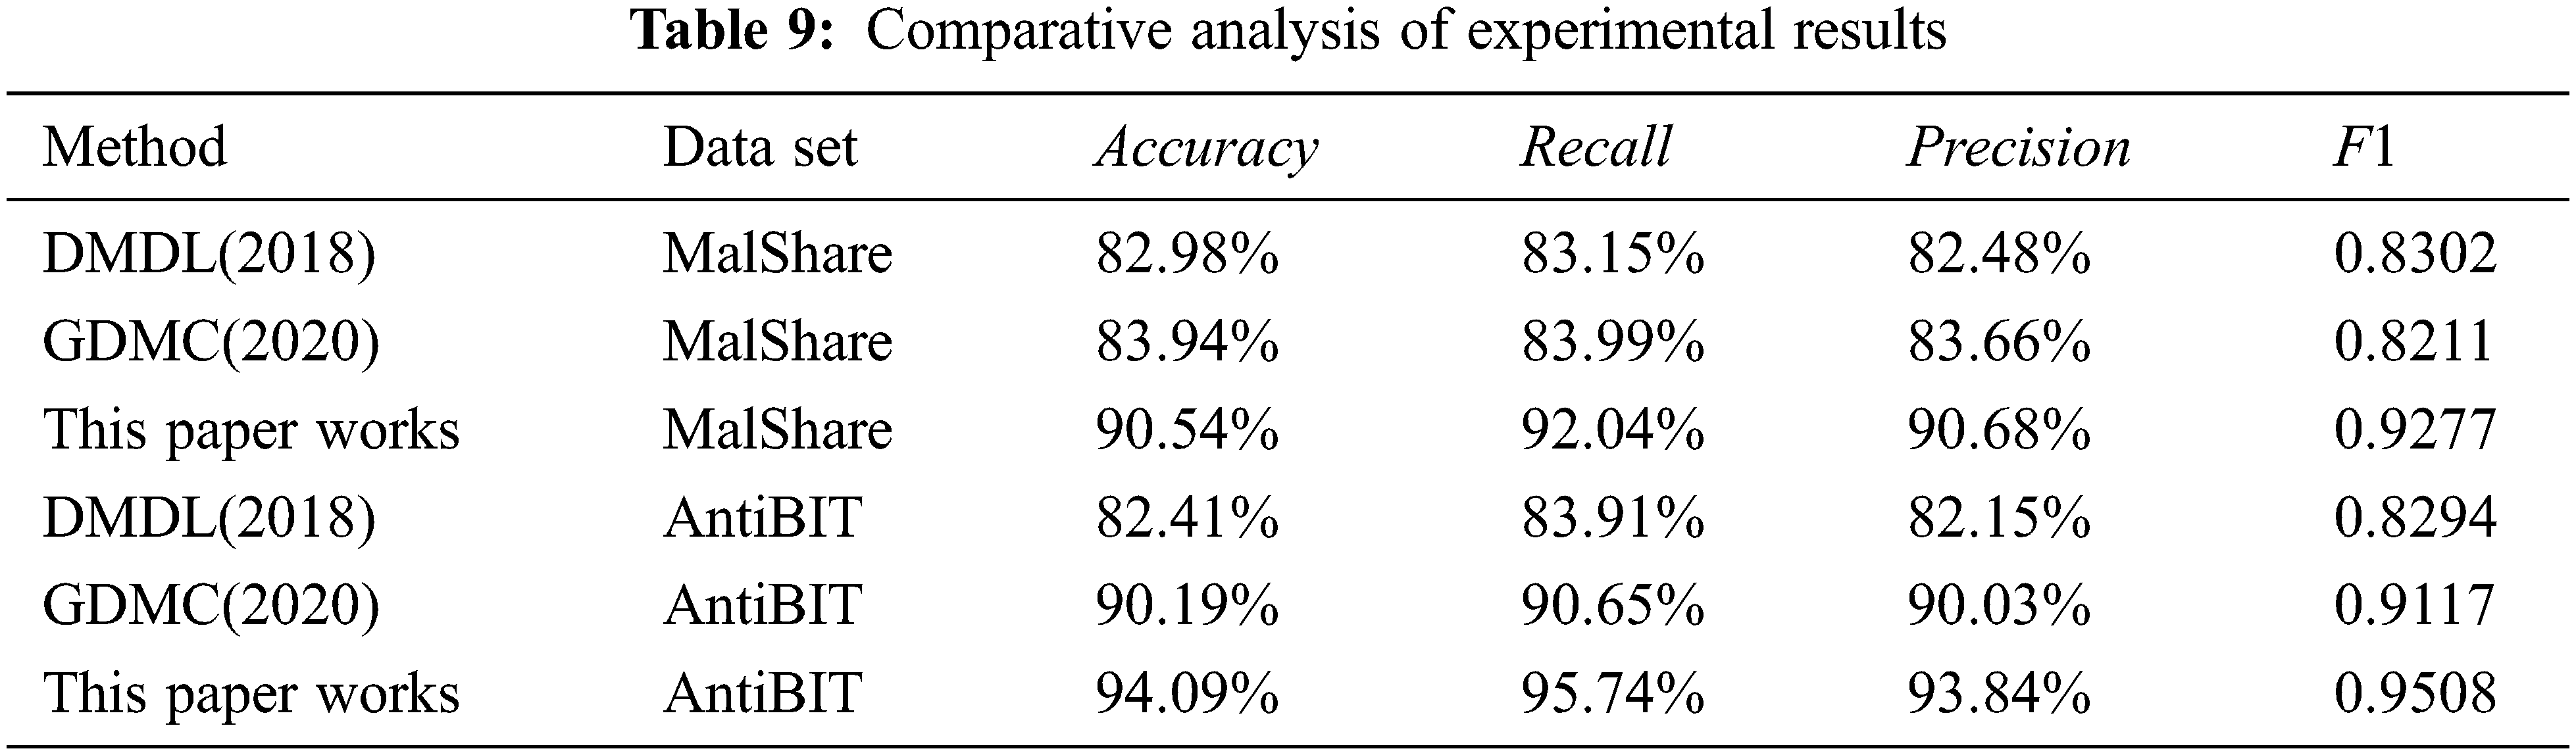
The experimental results of the three methods on the two data sets are shown in Table 9.
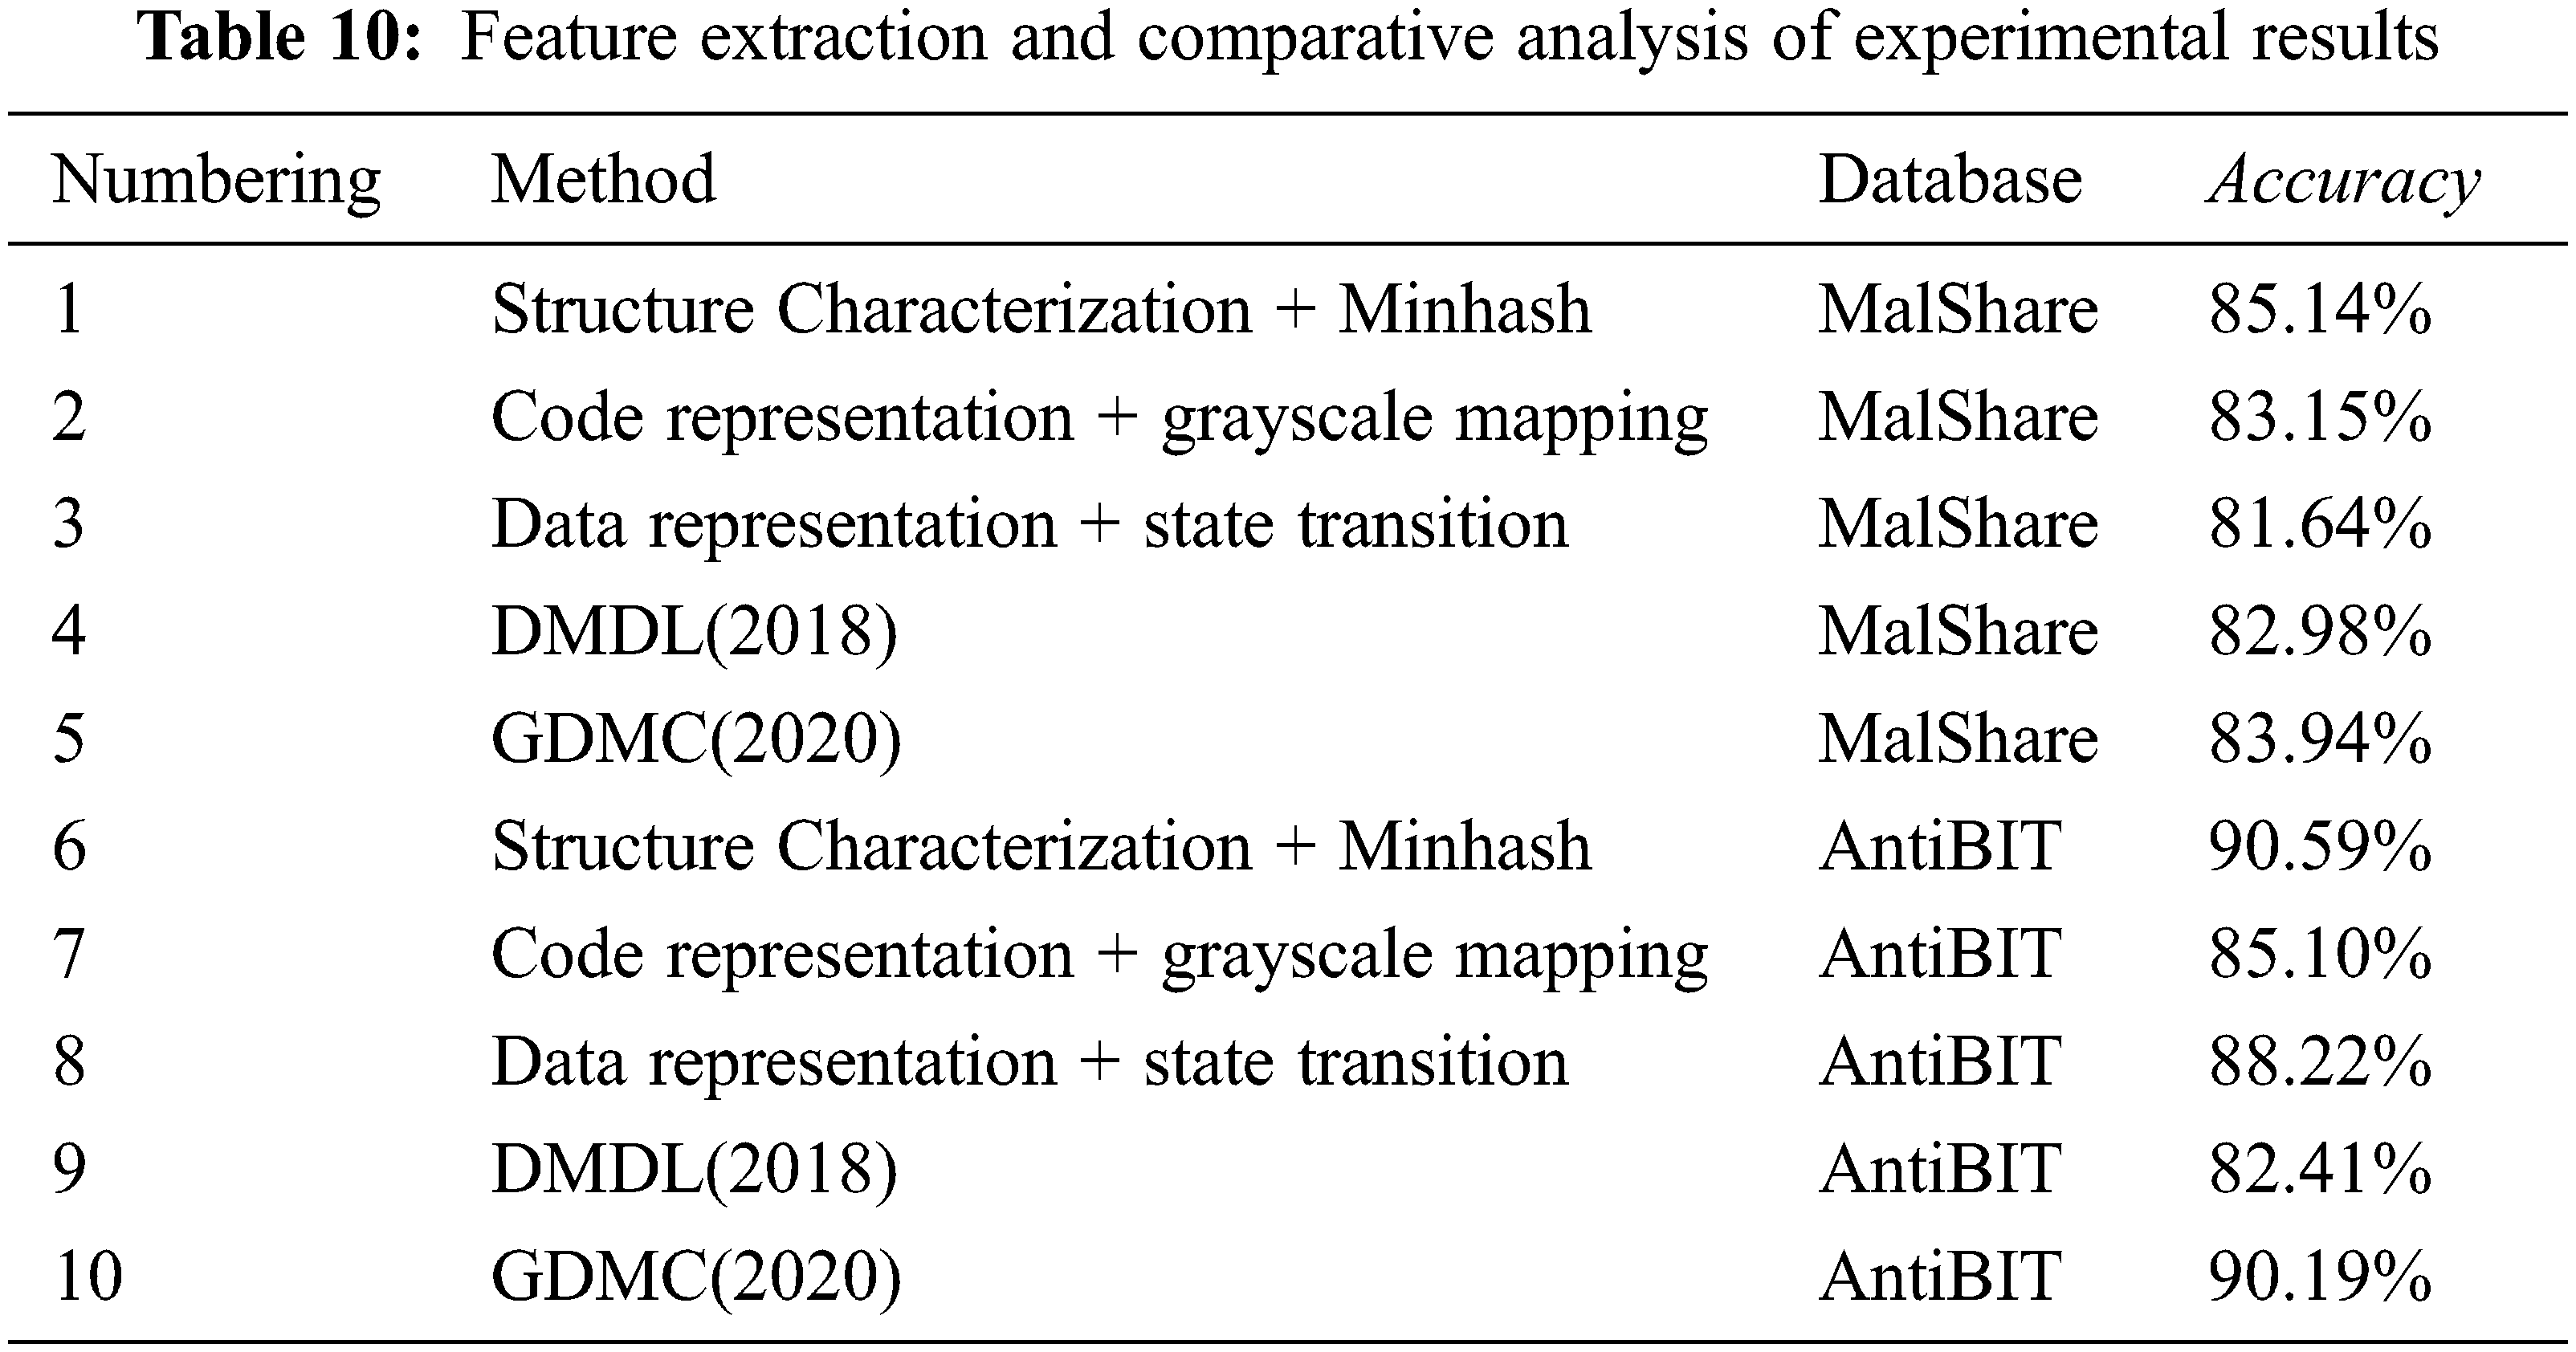
In addition, DMDL and GDMC both adopt indiscriminate byte feature extraction strategies. To visually show the impact of the indiscriminate feature extraction strategy on the detection results, accuracy is used as the evaluation index here, and only part of the ablation experiments is listed. The results of targeted feature extraction of the data are compared and analyzed with the indistinguishable feature extraction results of DMDL and GDMC, as shown in Table 10.
The detection effect of the malware detection method with byte-level function correlation is better than that of the comparison algorithm. From the experimental results in Table 9, it can be seen that the detection accuracy rate of this method on the two data sets exceeds 90%, the accuracy rate, recall rate and F1 value are kept in good synchronization with the accuracy rate, and the false positive rate is relatively high. The detection ability is significantly improved compared to the comparison algorithm, which proves the effectiveness of the method. The method does not rely on reverse analysis, only starts from binary raw data, makes full use of byte functions for targeted feature extraction, and has good performance on malicious sample data sets in the past two years, which has strong practical value.
Undifferentiated feature extraction will confuse byte semantics and affect detection accuracy. From the experimental results in Table 10, it can be observed that compared to DMDL and GDMC, which perform indifferent feature processing on all bytes, methods 1–3 and 6–8 perform better feature extraction for partial bytes. The accuracy rate indicates that the indistinguishable feature extraction will confuse the byte semantics, and the byte function has a significant contribution to the malware detection task, which proves the rationality of the method.
In the MalShare and AntiBIT malware data sets from 2018 to 2020, the detection accuracy of the method reached 90.54% and 94.09%, respectively. In the ablation test experiment, using any functional category byte alone for detection has achieved good results, and the detection effect is further improved when the three functional category bytes are fused. Compared with the excellent DMDL and GDMC algorithms, the byte-level function correlation method has achieved better detection results. Therefore, this method can effectively use the functional information of bytes to enhance the characterization ability of byte semantics, avoid byte semantic confusion, and improve the accuracy of malware detection.
However, the malware detection method proposed in the paper is a static analysis method, which has a strong dependence on source code and binary code and cannot effectively analyze malware variants such as encryption, polymorphism, and metamorphosis. Some advanced malware will deliberately hide malicious behaviors through technical means such as dynamic encryption and decryption, component concealment and contraction, and command dynamic obfuscation, thereby avoiding analysis methods based on static characteristics. Dynamic analysis reduces the dependence on source code and binary code by monitoring software network communication, process operation, file reading, and writing behavior characteristics in a controllable environment. Therefore, the dynamic analysis method is not affected by the above evasion methods. Our future work is to build a software analysis system with dynamic and static characteristics to further enhance the system’s ability to deal with malware.
Acknowledgement: The authors extend their appreciation to the Information System & Security and Countermeasures Experiments Center at Beijing Institute of Technology.
Funding Statement: This work is supported in part by the Information Security Software Project (2020) of the Ministry of Industry and Information Technology, PR China under Grant CEIEC-2020-ZM02-0134.
Conflicts of Interest: The authors declare that they have no conflicts of interest to report regarding the present study.
References
1. K. TaeGuen, K. BooJoong, R. Mina, S. Sakir and I. E. Gyu, “A multimodal deep learning method for android malware detection using various features,” IEEE Transactions on Information Forensics and Security, vol. 14, no. 3, pp. 773–788, 2018. [Google Scholar]
2. K. Vasileios and G. Kambourakis, “A comprehensive survey on machine learning techniques for android malware detection,” Information, vol. 12, no. 5, pp. 185, 2021. [Google Scholar]
3. W. Han, J. Xue, Y. Wang, F. Zhang and X. Gao, “APTMalInsight: Identify and cognize APT malware based on system call information and ontology knowledge framework,” Information Sciences, vol. 546, no. 6, pp. 633–664, 2021. [Google Scholar]
4. M. Cai, Y. Jiang, C. Gao, H. Li and W. Yuan, “Learning features from enhanced function call graphs for android malware detection,” Neurocomputing, vol. 423, no. 29, pp. 301–307, 2021. [Google Scholar]
5. J. Zhang, Z. Qin, K. Zhang, H. Yin and J. Zou, “Dalvik opcode graph based android malware variants detection using global topology features,” IEEE Access, vol. 6, no. 1, pp. 51964–51974, 2018. [Google Scholar]
6. M. Fan, X. Luo, J. Liu, M. Wang, C. Nong et al., “Graph embedding based familial analysis of android malware using unsupervised learning,” in Proc. 2019 IEEE/ACM 41st Int. Conf. on Software Engineering (ICSE), New York, NY, USA, vol. 1, no. 1, pp. 771–782, 2019. [Google Scholar]
7. E. Raff, J. Barker, J. Sylvester, R. Brandon, B. Catanzaro et al., “Malware detection by eating a whole exe,” in Proc. Workshops at the Thirty-Second AAAI Conf. on Artificial Intelligence, New Orleans, LA, USA, vol. 1, no. 1, pp. 268–276, 2018. [Google Scholar]
8. S. Ni, Q. Qian and R. Zhang, “Malware identification using visualization images and desep learning,” Computers & Security, vol. 77, no. 8, pp. 871–885, 2018. [Google Scholar]
9. G. Sun and Q. Qian, “Deep learning and visualization for identifying malware families,” IEEE Transactions on Dependable and Secure Computing, vol. 18, no. 1, pp. 283–295, 2018. [Google Scholar]
10. Q. Le, O. Boydell, B. M. Namee and M. Scanlon, “Deep learning at the shallow end: Malware classification for nondomain experts,” Digital Investigation, vol. 26, no. 7, pp. S118–S126, 2018. [Google Scholar]
11. E. Raff, J. Sylvester and C. Nicholas, “Learning the PE header, malware detection with minimal domain knowledge,’’ in Proc. 10th ACM Workshop on Artificial Intelligence and Security, New York, NY, USA, vol. 1, no. 1, pp. 121–132, 2017. [Google Scholar]
12. L. Nataraj, S. Karthikeyan, G. Jacob and B. Manjunath, “Malware images: Visualization and automatic classification,” in Proc. 8th Int. Symp. on Visualization for Cyber Security, New York, NY, USA, vol. 1, no. 1, pp. 1–7, 2011. [Google Scholar]
13. Z. Cui, X. Fei, X. Cai, C. Yang, G. G. Wang et al., “Detection of malicious code variants based on deep learning,” IEEE Transactions on Industrial Informatics, vol. 14, no. 7, pp. 3187–3196, 2018. [Google Scholar]
14. K. S. Han, J. H. Lim, B. Kang and E. G. Im, “Malware analysis using visualized images and entropy graphs,” International Journal of Information Security, vol. 14, no. 1, pp. 1–14, 2015. [Google Scholar]
15. A. Z. Broder, “On the resemblance and containment of documents,” in Proc. Compression and Complexity of SEQUENCES 1997 (Cat. No. 97TB100171), New York, NY, USA, vol. 1, no. 1, pp. 21–29, 1997. [Google Scholar]
Cite This Article
 Copyright © 2023 The Author(s). Published by Tech Science Press.
This work is licensed under a Creative Commons Attribution 4.0 International License , which permits unrestricted use, distribution, and reproduction in any medium, provided the original work is properly cited.
 Downloads
 Citation Tools