
 Submit a Paper
 Propose a Special lssue
 Open Access
ARTICLE

Visualization Techniques via MLBS for Personnel Management in Major Events
1
The 54th Research Institute, China Electronics Technology Group Corporation, Shijiazhuang, 050081, China
2
School of Management, Tianjin Normal University, Tianjin, 300387, China
3
Graduate School, Sehan University, Mokpo, 58613, Korea
4
Department of Electrical and Computer Engineering, National Chiao Tung University, Hsinchu City, 30010, Taiwan
* Corresponding Author: Lingjuan Hou. Email:
Computer Systems Science and Engineering 2023, 46(1), 521-536. https://doi.org/10.32604/csse.2022.028606
Received 14 February 2022; Accepted 05 May 2022; Issue published 20 January 2023
 View Full Text
 Download PDF
Abstract
Mobile location-based services (MLBS) refer to services around geographic location data. Mobile terminals use wireless communication networks (or satellite positioning systems) to obtain users’ geographic location coordinate information based on spatial databases and integrate with other information to provide users with required location-related services. The development of systems based on MLBS has significance and practical value. In this paper a visualization management information system for personnel in major events based on microservices, namely MEPMIS, is designed and implemented by using MLBS. The system consists of a server and a client app, and it has some functions including map search and query, personnel positioning and scheduling, location management, messaging, and location service. Managers of the events can quickly search and locate the staff on the specific area of the map in real-time, and make broadcasting messages to the staff, and manage the staff. The client app is developed on the Android system, by which staff users can send the positions information to the server timely. The client users can search fuzzily near their peers and list their locations, and also call near peers through sending messages or query the history record of staff locations. In the design of the system, several new proposed techniques, including visual annotation method for overlapping locations, correcting trajectory drift algorithm, microservices-based overall system architecture methodology and other new techniques, which are applied to the implementation of the system. Also, HTML5, JQuery, MLBS APIs (Application Program Interfaces) related programming techniques have been used and combined with loading Ajax asynchronously and Json data encapsulation, map marker optimization techniques, that can improve the positioning accuracy and the performance of the system. The developed system with practical functions can enhance the efficiencies of the organization and management of major events.Keywords
Mobile location-based services (MLBS) refer to using the communication network to obtain the geographic location coordinate information of mobile users and integrate it with other information to provide users with the required location-related value-added services [1]. With the rapid development of 5G communication, Internet of things, artificial intelligence, big data and mobile Internet technology, MLBS technology is widely used in many aspects such as public safety service, transportation and entertainment management, and can provide personalized services for mobile objects according to location information, such as location-based map operation, personal positioning, navigation, fixed-point query, path planning and poi query, Personnel search, rescue, investigation, epidemic prevention and control can be carried out directly through mobile phones. Since major events usually involve a wide range of venues and a large number of people, how to improve and improve the organization and management efficiency of major events, build a location service platform by using mobile Internet, cloud computing and SaaS software technology, and accurately locate and intelligently perceive the staff of major events is the focus of current smart city construction and smart management And one of the important topics of emergency management for major public health events.
In fact, MLBS has been applied to almost all fields, mainly including three types of applications: the first is location dating, such as microblog, WeChat and QQ; The second is tool applications, such as map, navigation and life service applications; The third is traditional location-based services, such as smart parking, vehicle management, location information query, epidemic prevention and control, and so on [2]. In recent years, starting from foursquare’s geographic social networking, the development of mobile location service MLBS has attracted widespread attention from the industry and media, including Google, Facebook, Twitter, Baidu, Tencent, Renren, Sina and other Internet enterprises have successively launched their own unique MLBS-based social networking services (SNSs). In China, innovative enterprises with “MLBS + SNS” models such as roadside network, more fun, playing SIFANG, DING XIANGYUAN, BEDO and pushpin are constantly emerging [3]. Based on the integration of mobile positioning system and GIS (Geographic Information System) electronic map platform, MLBS almost involves the field of public security, customized personalized MLBS, location-based scheduling and monitoring, tracking, positioning and navigation services, personalized recommendation services and location-based traffic and billing support. Through location information sharing and flexible networking, we can timely grasp the location information and communication information of assigned forces and friendly neighboring forces in collaborative operations [4]. In response to the first level response to the outbreak, WebGIS was used to analyze the spatial and temporal characteristics of COVID-19 epidemic, the management of all kinds of personnel, the map of the epidemic situation in the district, the action track of personnel, the management of overseas imported cases, and the management of material supply and other [5]. Baidu et al. [6] built a location-based service (MLBS) mobile social resource sharing platform, and designed and implemented a campus navigation application system using the API (application programming interface) of MLBS. Users can query their own location, destination route, building location and other information through Android client; By obtaining the location information and voice information of alarm users, rescuers can quickly and efficiently arrive at the scene and improve the success rate of rescue. The location service technology on Android combined with ACO (Ant Colony Optimization) intelligent planning algorithm [7,8] solves the problem of dynamic task allocation of field personnel and vehicles in multiple distribution centers in real scenes, so as to ensure the authenticity of attendance of field personnel, Improve enterprise management efficiency [9]. The automatic vehicle positioning system based on Beidou location service is the core of the intelligent transportation system. It provides services such as vehicle and passenger location, vehicle scheduling management, monitoring traffic accidents and dredging traffic, so as to realize the functions of dynamic traffic flow distribution, positioning and navigation, accident emergency response, safety prevention, vehicle tracking, vehicle scheduling and so on [10,11]; The combination of mobile Internet technology and mobile positioning service can easily realize mobile yellow page query and so on. The developments and applications of MLBSs emerge one after another, vehicle tracking, campus navigation, consumer behavior analysis, take-out food, beach positioning, location recognition, online map, intelligent transportation, teammate real-time location sharing, etc. [12–15].
Visualization in a system based on MLBS is the graphical representation of personnel information and activity functions to help users intuitively understand the meanings of big data and simplify operations by using charts, plots, maps, videos, and more [16] So far, there are many types of methods, tools, and platforms for data visualization made simple, including ECharts [17,18], D3.js, Zoho analytics, Tableau Infogram, ChartBlocks, and so on [19,20]. With the rise of big data, graphic analysis is indispensable in the era of big data visualization, and it can be used to effectively mine the valuable information in complex data relationships and find the potential business opportunities. A modular approach for dynamic visualizing time series data by integrating into short videos [21,22], a visual analysis based on WebGIS combined with ECharts for the COVID-19 epidemic in countries around the world [5,23]. Visual interaction is one of important methods that interactive interfaces enable the people to perform with algorithms involving complicated mathematical models. A water quality monitoring system in real time based on Tencent Cloud [24] is implemented by adopting ECharts to display visually the trend of the water quality processing. Among various popular Web visualization components, ECharts is widely used because of its ease of use, rich built-in interaction and high performance. This work is realized by using the visualization component of ECharts on HTML5 canvas and improving its layout design.
The research goal of this work is to develop a visual management system for personnel in major events based on microservices, called MEPMIS, including server management system and client app. The client supports multi-platform smartphone platform technology, positioning technology, Baidu map cloud service and other technologies to realize the positioning query, location search, message push, location management Personnel management and other main functions.
2 Overall System Architecture and Function Design
2.1 Microservices-Based Overall System Architecture of MEPMIS
The intelligent positioning system for outdoor personnel in large-scale activities requires users, e.g., staff, to upload the geographical location coordinates in real time through the mobile terminal, while the mobile intelligent terminal obtains the geographical location coordinate information through the mobile communication network through the communication base station or its own mobile equipment, and uploads the relevant data to the server through the Internet or communication networking link of MLBS.
According to the actual requirements of the location visualization management system MEPMIS for major events, the overall architecture of MEPMIS system based on micro service is studied and designed, as shown in Fig. 1. The functional logic in MEPMIS application is separated, and the whole application is built in the way of one function and one service. The service is divided into five levels, namely data interface, access control, public service, core function and web layer. Data interface includes data interface service, which is responsible for obtaining and sorting out all personnel location data. The access control layer includes access control service, authentication service and security access service, and completes user authentication, user role authority management, security access and other tasks. The public service layer includes map APIs and various visual schema services, which can be applied to the business management of the whole major activities including MEPMIS. The core function layer mainly includes the computing and graphics processing services of the MEPMIS application itself. The web layer uses MEPMIS applications in the form of web pages, and makes unified calls to services through web pages to form a complete application function.
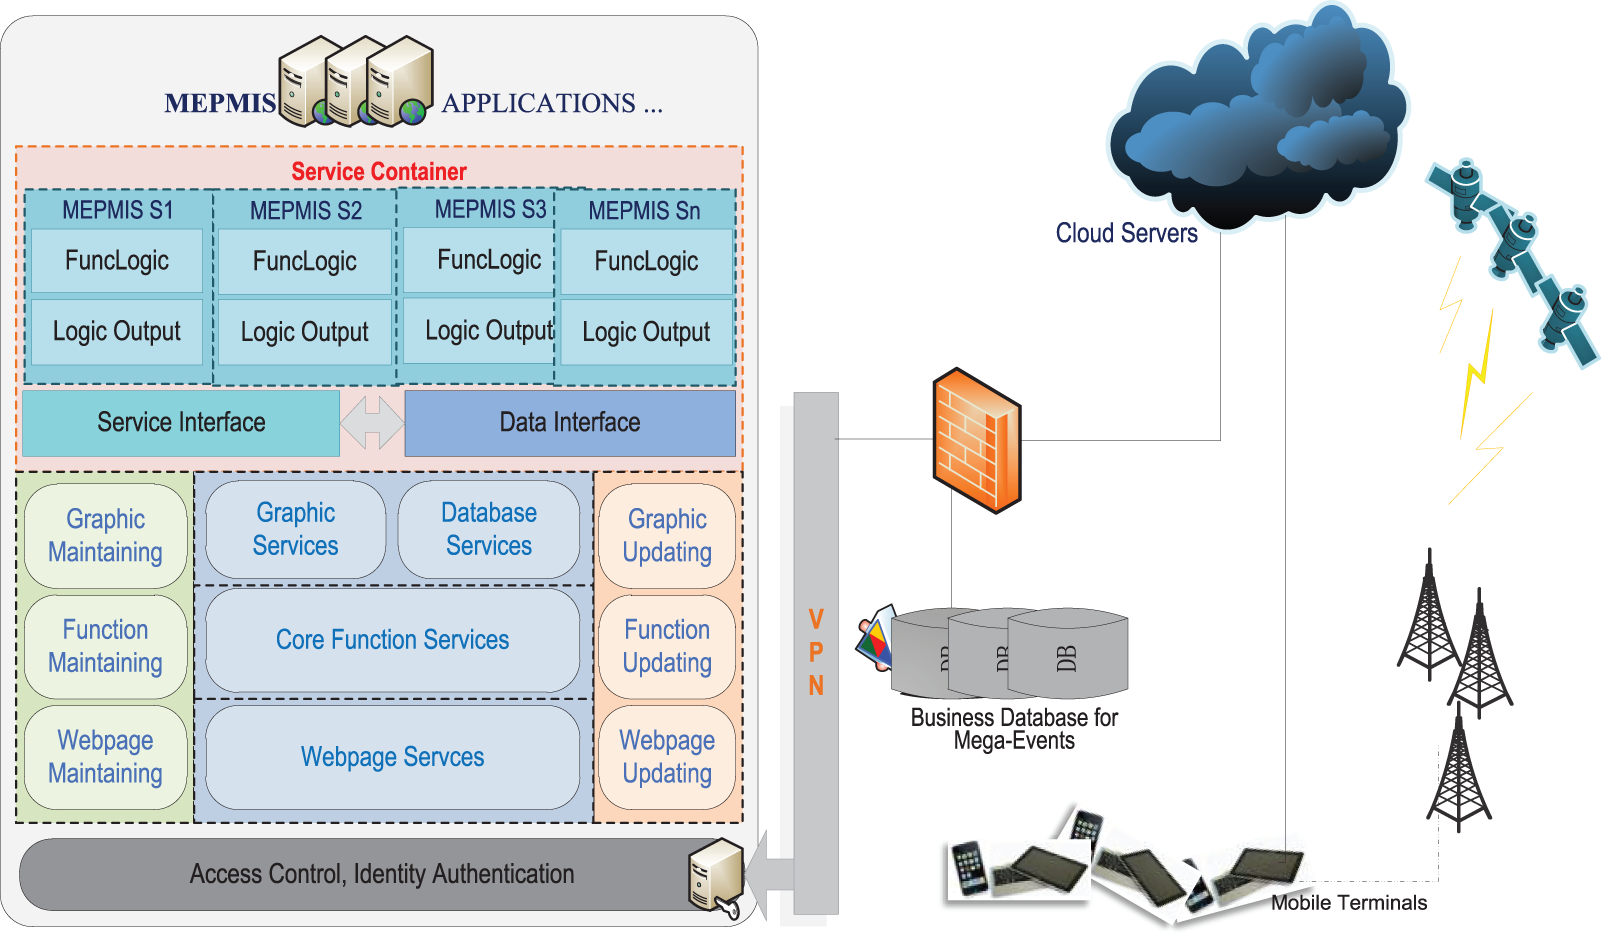
Figure 1: Overall system architecture of MEPMIS
The main advantages of microservice web application architecture are: each functional logic of the application is built in the form of microservices, and each service has independent operation process and independent deployment, which reduces the complexity of system maintenance and update. The service is deployed on the cloud computing platform. Due to the high reliable cluster support of cloud computing resources, MEPMIS applications have good disaster recovery performance. The web page function service is used for unified scheduling, and the managers and personnel of major-event can use the MEPMIS system through the browser on the mobile device. On the one hand, the workspace of the major event managers is expanded beyond the workstation, on the other hand, the dependence on the application equipment resources is solved and the application cost is reduced.
2.2 Demand Analysis and Functional Structure of Server Management System
Adopt .Net + MySQL7.6, combined with HTML5, jQuery and Ajax technology, designs and implements a visual management system for outdoor personnel of large-scale activities. Through the transmission of location information between the activity personnel and the server, it is convenient for management to visually query and retrieve the location of staff, activity site and staff, The server is a web-based management information system as shown in Fig. 2, which has the functions of map area search, fast search, track playback, location management, account management, message push and so on.
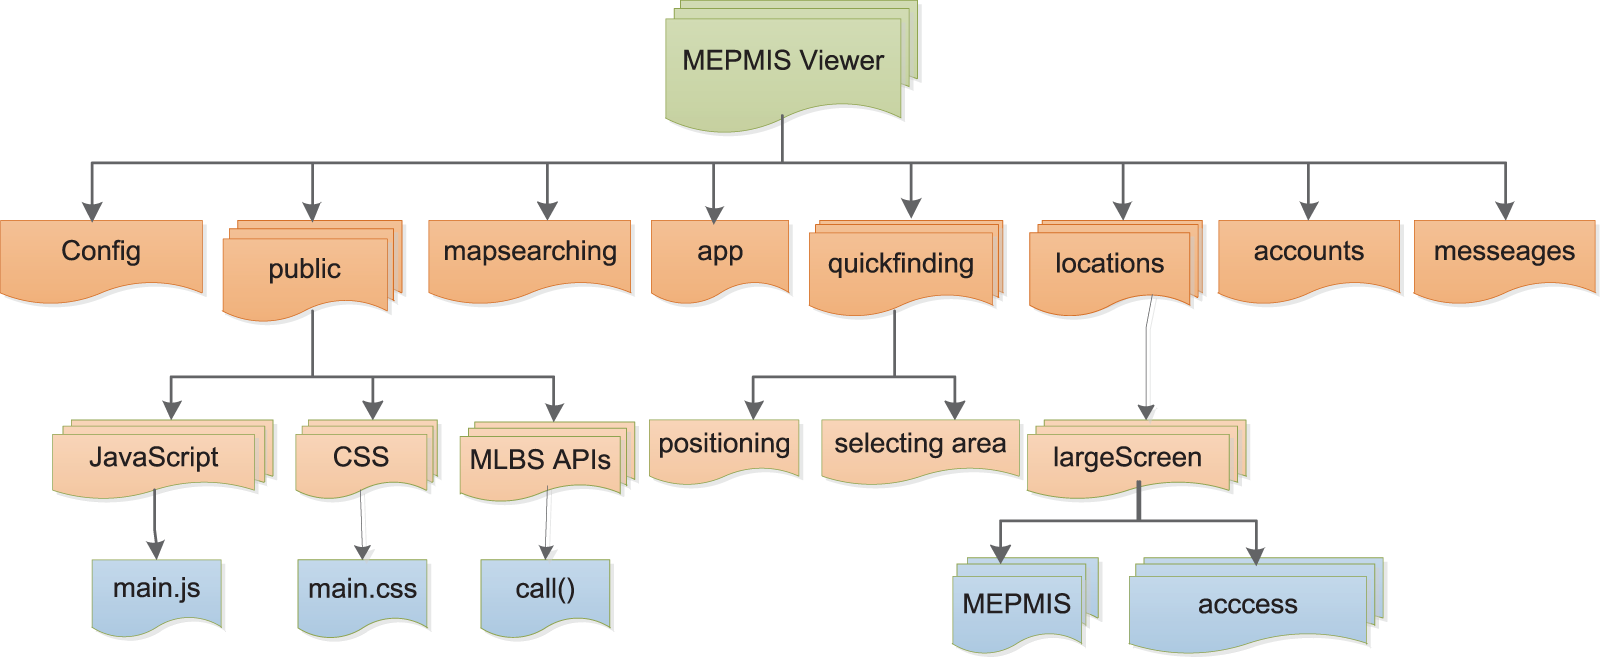
Figure 2: The functions structure of MEPMIS
Map search: the manager can search the name or mobile phone number of the staff member to find that the staff member last appeared in the corresponding site, and locate the map to the location of the staff member. Through location area search and positioning, the manager can input the target location in the search panel to locate the map center coordinate to the target location. At the same time, the search panel provides intelligent and fast area prompt function to facilitate the manager to select and search the location.
Quick search: you can quickly view the details of staff around the location by selecting multiple specific locations entered in advance. By dragging the map layer, you can refresh the personnel in place in the visual area in real time. Click the personnel label to view the relevant personnel information.
Location management: add and delete common activity locations through the name, longitude and latitude coordinates of large activity sites or common locations of staff, so as to query and search personnel locations.
Message push: message push service is based on Baidu cloud push service. It can broadcast message push service to smartphone terminals through the server to facilitate personnel scheduling management.
Account management: through the account management function, managers can browse and search the detailed personal data of all active staff for maintenance and management.
2.3 Demand Analysis and Function Design of Client APP
The outdoor staff of large-scale activities are distributed in venues in different locations. In order to master the availability of staff, managers must continuously report their own location information through the staff, including the longitude and latitude of the venue. If the location information of the activity location is retained for a period of time, the activity track of each staff member in a certain period of time can be understood through track playback, accurately grasp the on-the-job situation of staff, and the manager can also query the availability of personnel in a certain area, and carry out nearby dispatching and personnel arrangement adjustment according to the needs of the task. At the same time, the client app needs to be able to manage personal information, including its own user name, modifying personal user password, uploading personal avatar and other personal information, so as to facilitate administrators and peers to understand the status of staff.
On the other hand, the staff of different venues also need to know the situation of their nearby peers. They hope to be able to find and search nearby peers with the help of the client app, and even fuzzy search and fuzzy search. For example, they can find nearby peers by entering only a part of their name or mobile phone number, and can display the list of peers for the searched personnel, The companion map location can be displayed in mixed mode or satellite map mode. The red mark shows the people around. If you need to “follow”, when the client mobile phone location moves, the map center coordinate will follow and move, with the function notices of “Searching”, “Sharing”, “Grouping”, “Login”, “Settings” and “©Copyright”. Click the “Refresh” button to search out other staff within 1km around the server for easy contact. It also provides the functions of telephone call and SMS (Short Messaging Service) sending, so as to contact peers in time.
The fuzzy information query function only needs to input incomplete names to search all matching personnel lists and display them in the form of lists. The list provides the searcher’s name, gender, company, group and contact information. Dialing and SMS buttons make contact operation more convenient.
3 Design and Implementation of Server Management System
This section mainly explains the function design, use case analysis, sequence diagram analysis and key technologies, methods and implementation skills of the service side management system.
3.1 Use Case Analysis of Server System
Server login is divided into two roles: ordinary account and administrator account. All successfully logged in accounts can use map search, location management and message push functions. Only users who log in successfully with the administrator account can carry out account management. Account management is divided into adding, modifying and deleting server and client accounts. You can also query the user’s historical location through the client user list. The map search function supports direct location, mobile phone number search location, name search location and manual query location. The message push function supports single ID push, group push and group push. Location management can add or delete common locations. The role use cases analysis and message delivery relationship of sequence diagrams are shown respectively in Figs. 3 and 4.
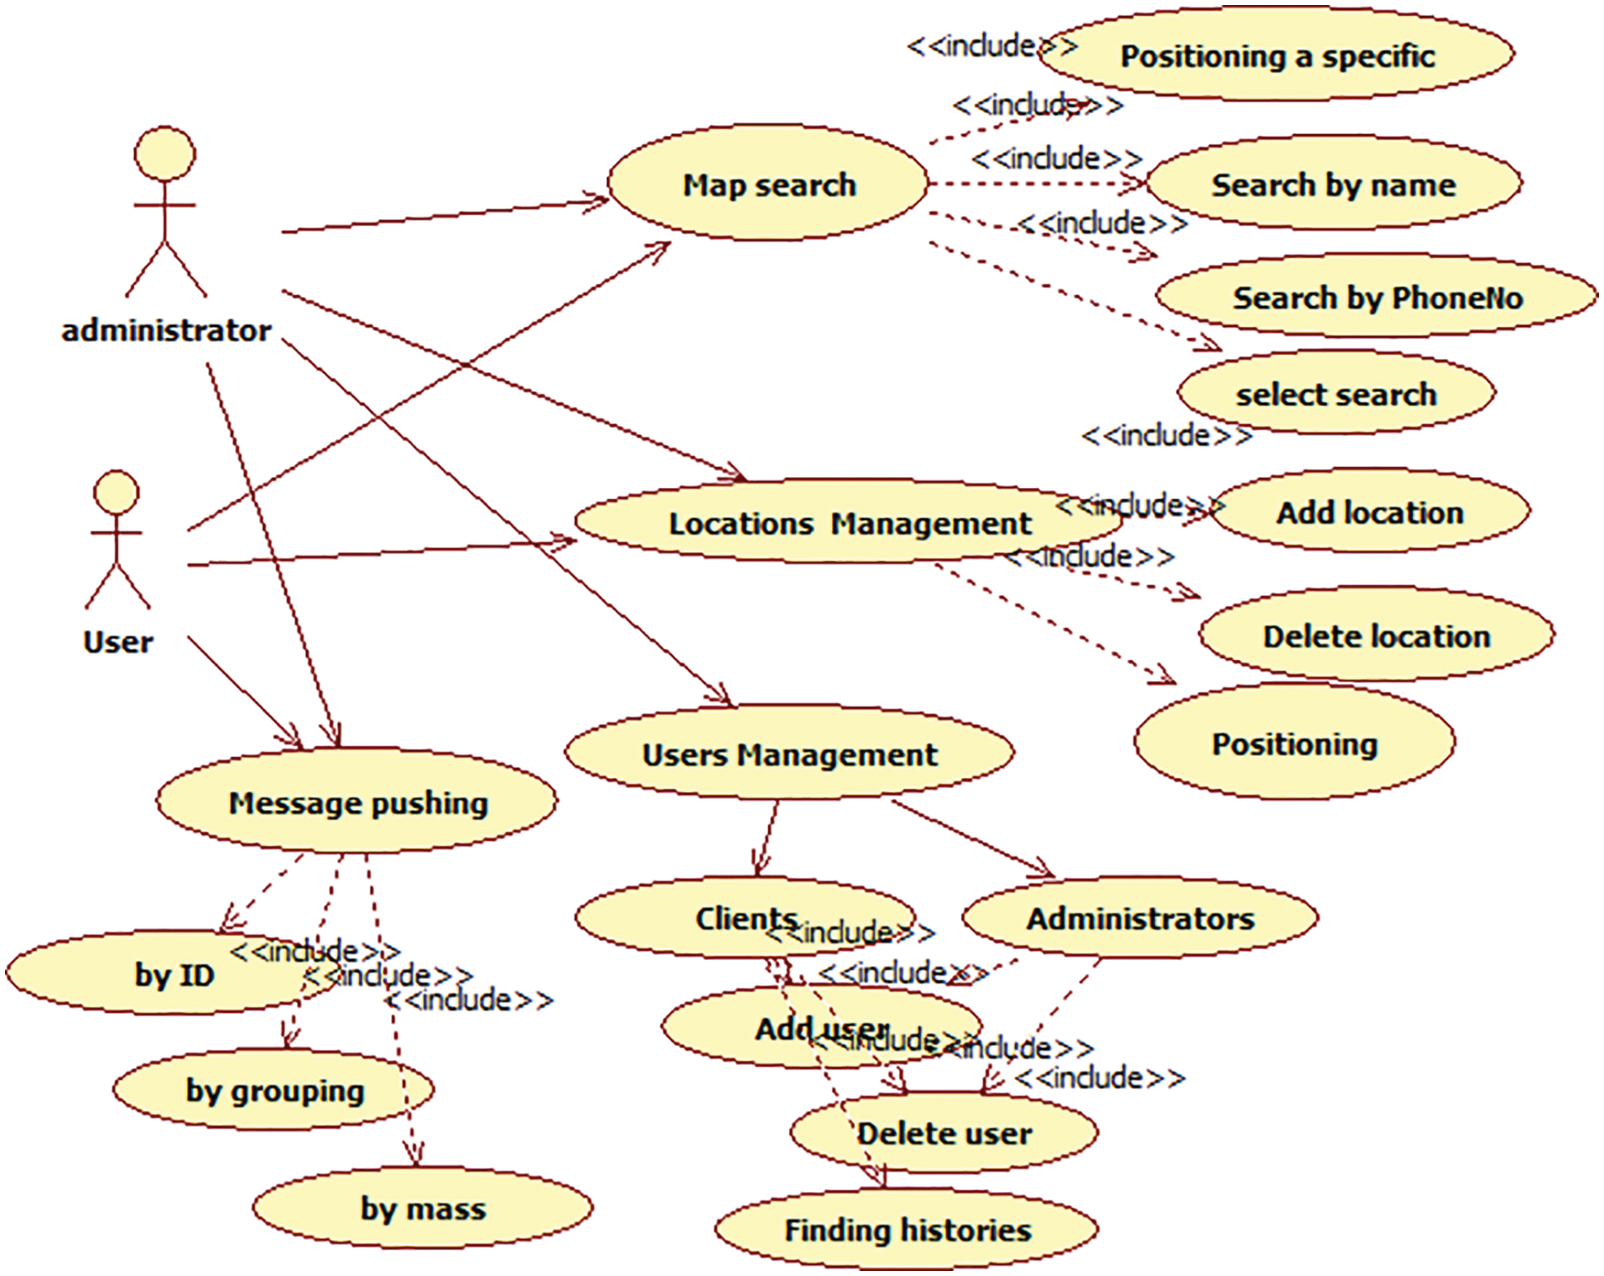
Figure 3: User-case diagram of the server
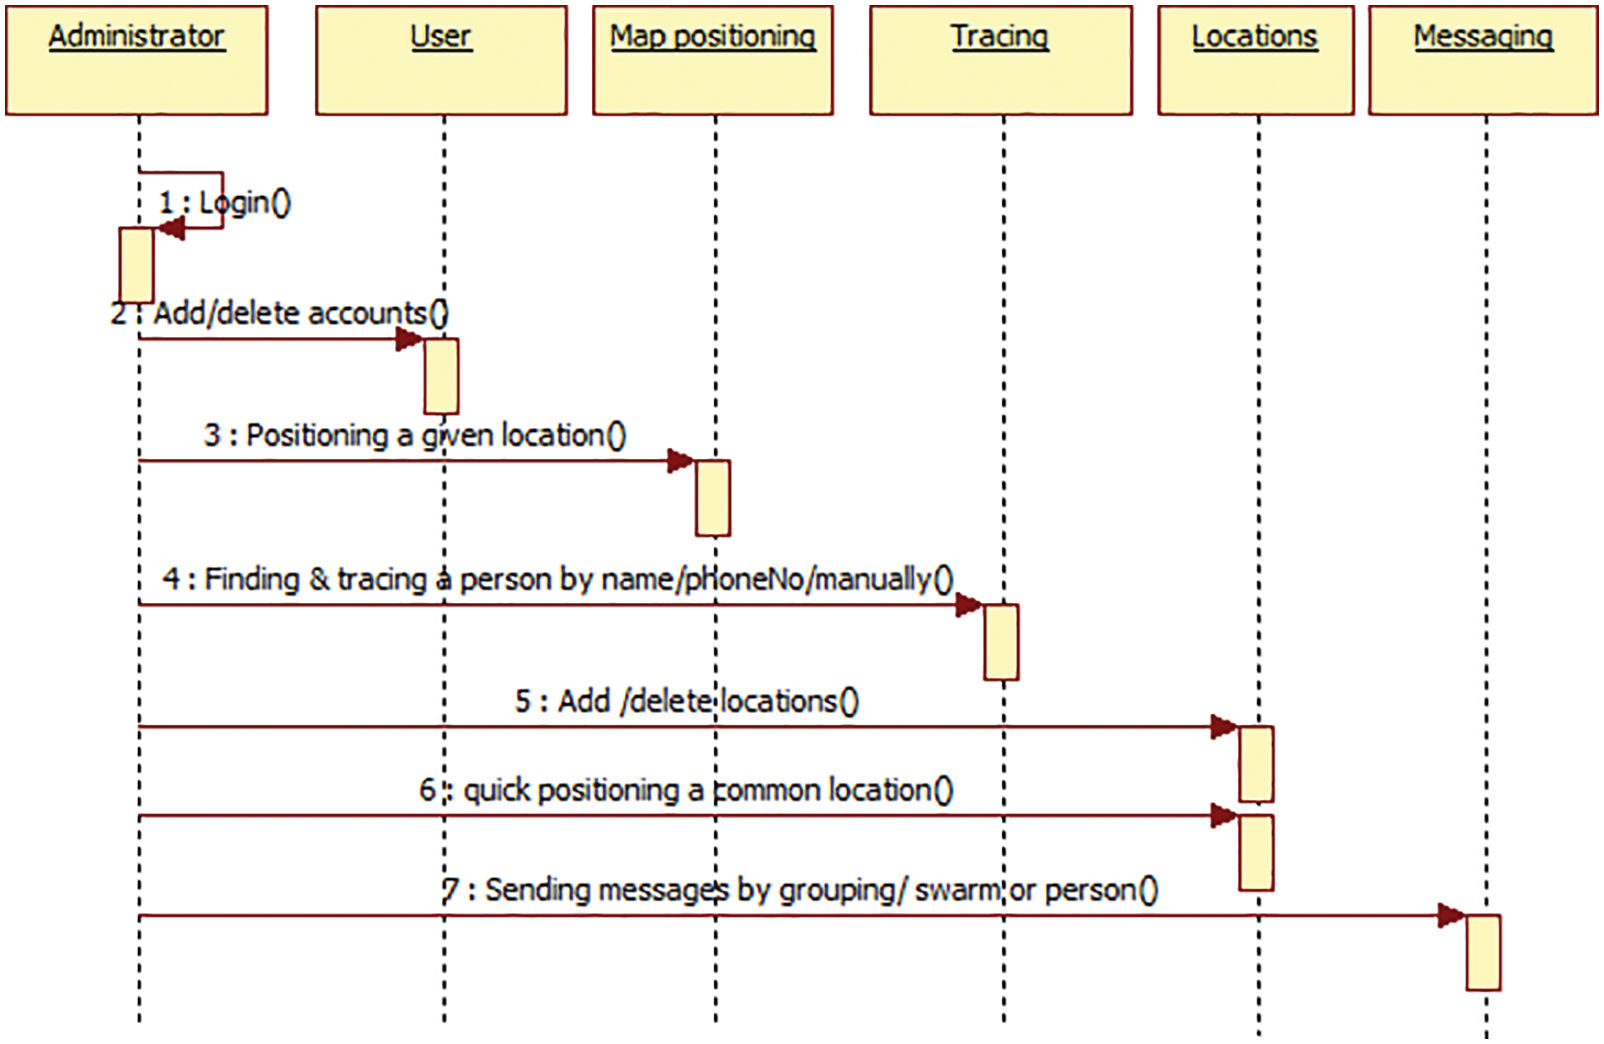
Figure 4: Sequence diagram of servers
The administrator user can log in to the server management system through password authentication and operate relevant functions. Administrators can add administrator login accounts in the background. The main interface of the server management system in map mode and mixed mode is shown in Fig. 5. The navigation bar of the main interface provides quick links to various functions, including “map search”, “quick search”, “location management”, “account management”, “history tracking”, “message push” and so on. As shown in Fig. 4, we can seen the implementation of each function and the message transmission relationship between them.
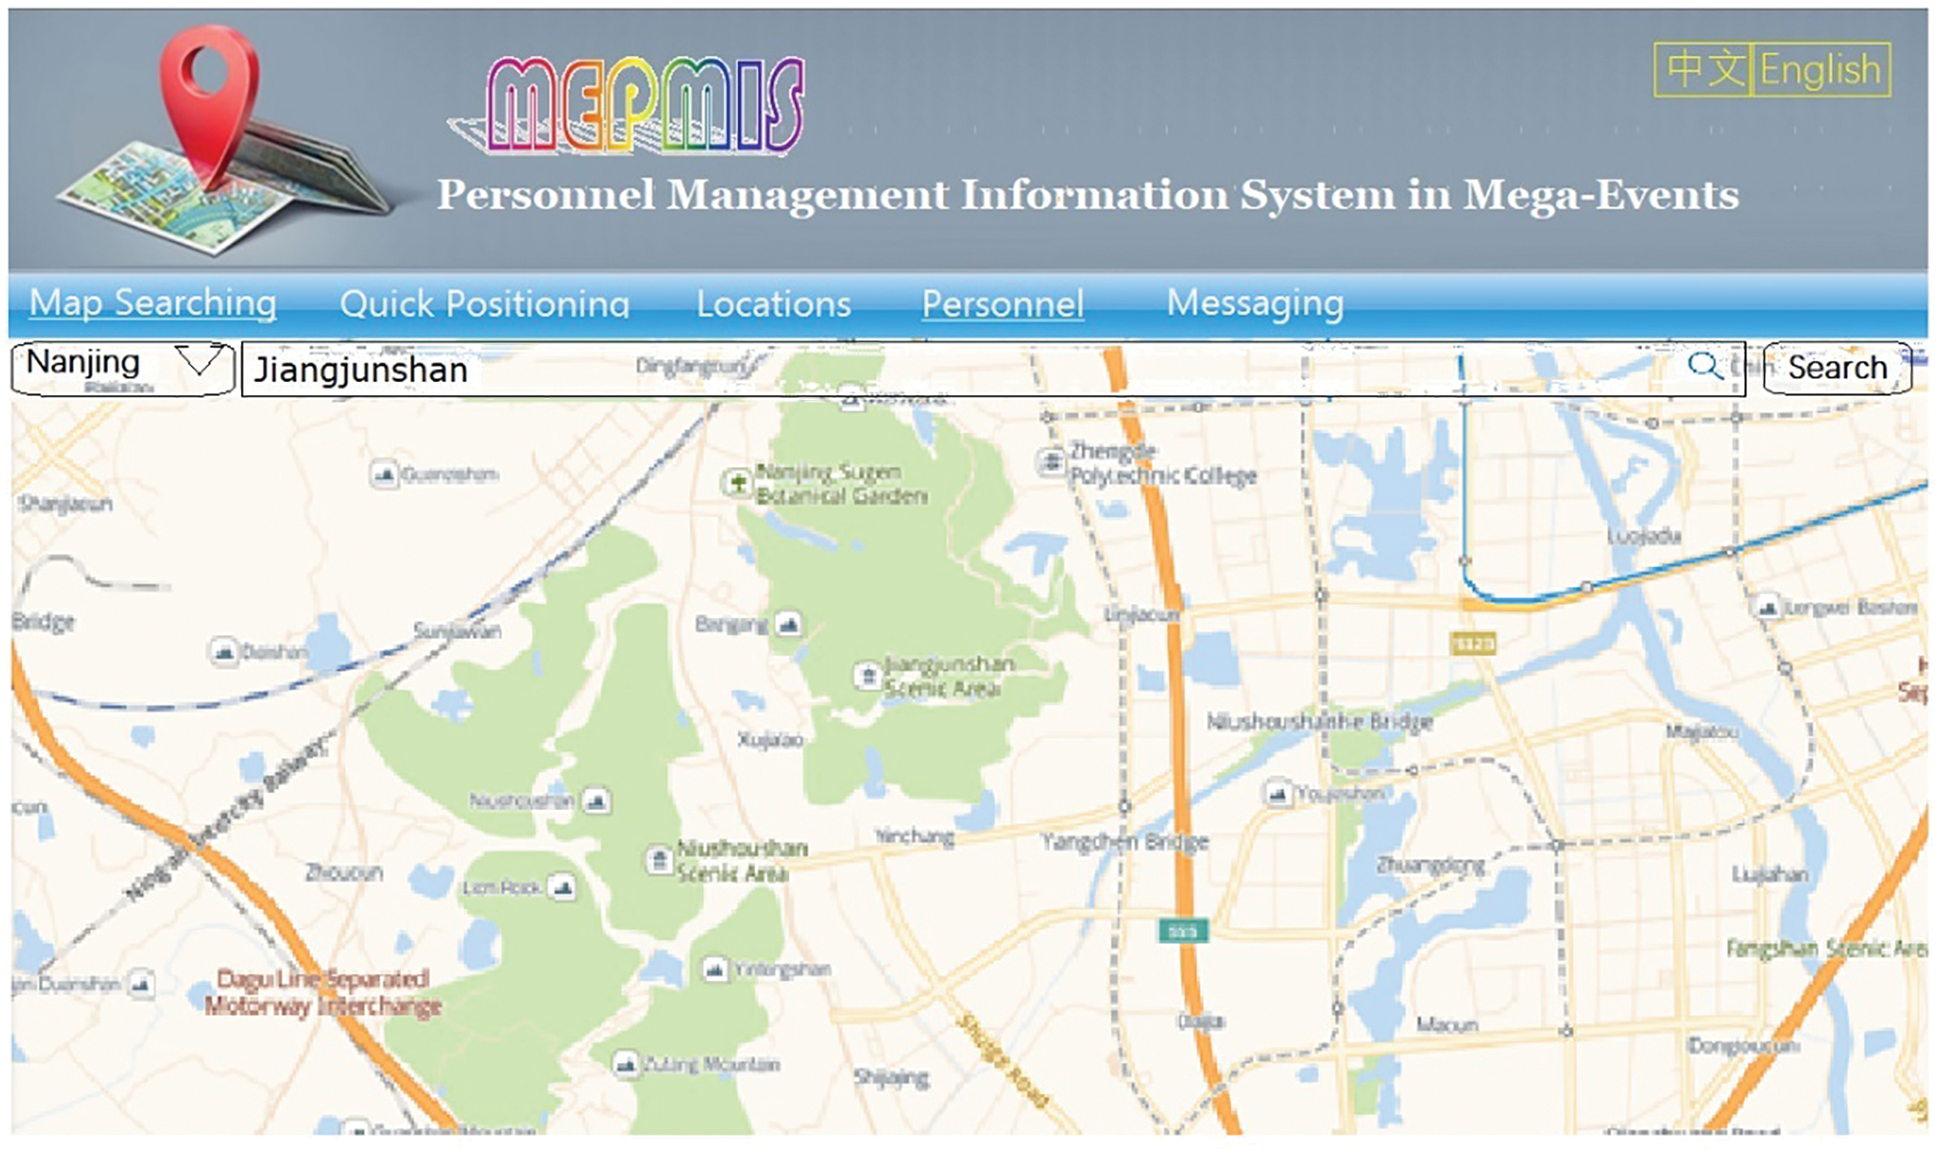
Figure 5: Homepage of MEPMIS server (map mode)
By using the map search function, the administrator user can visually find the real-time queried location and the personnel near these locations on the map. In the middle location search box (two modes as shown respectively in Figs. 5 and 6), as long as you enter the address name or part of the address, you can automatically prompt the relevant address. After confirmation, you can quickly locate the map to the address. If you enter “Jiangjunshan”, the map will immediately locate to Jiangjunshan scenic area. Baidu map API provides zoom control and layer selection control. The zoom control can zoom the map from 1 to 19 levels. The layer selection control can switch the map layer and provide two layers modes, namely, ordinary map mode and mixed map mode displaying Street satellite images. The method of calling Baidu BMap API by JavaScript (JS) in the homepage HTML of the server management system mainly includes loading the search control searchcontrol_min.js and various calling JavaScript programming based on control class and BMAP class index JS, and other related special effects used JS, stylesheet1. CSS is the style sheet that controls the style, checkvideo(); To check whether the browser supports HTML5, execute it before the DOM (document object model) is loaded. After the DOM is loaded, execute window onload = loadBaiduJs; To load the relevant JS class library of Baidu API.
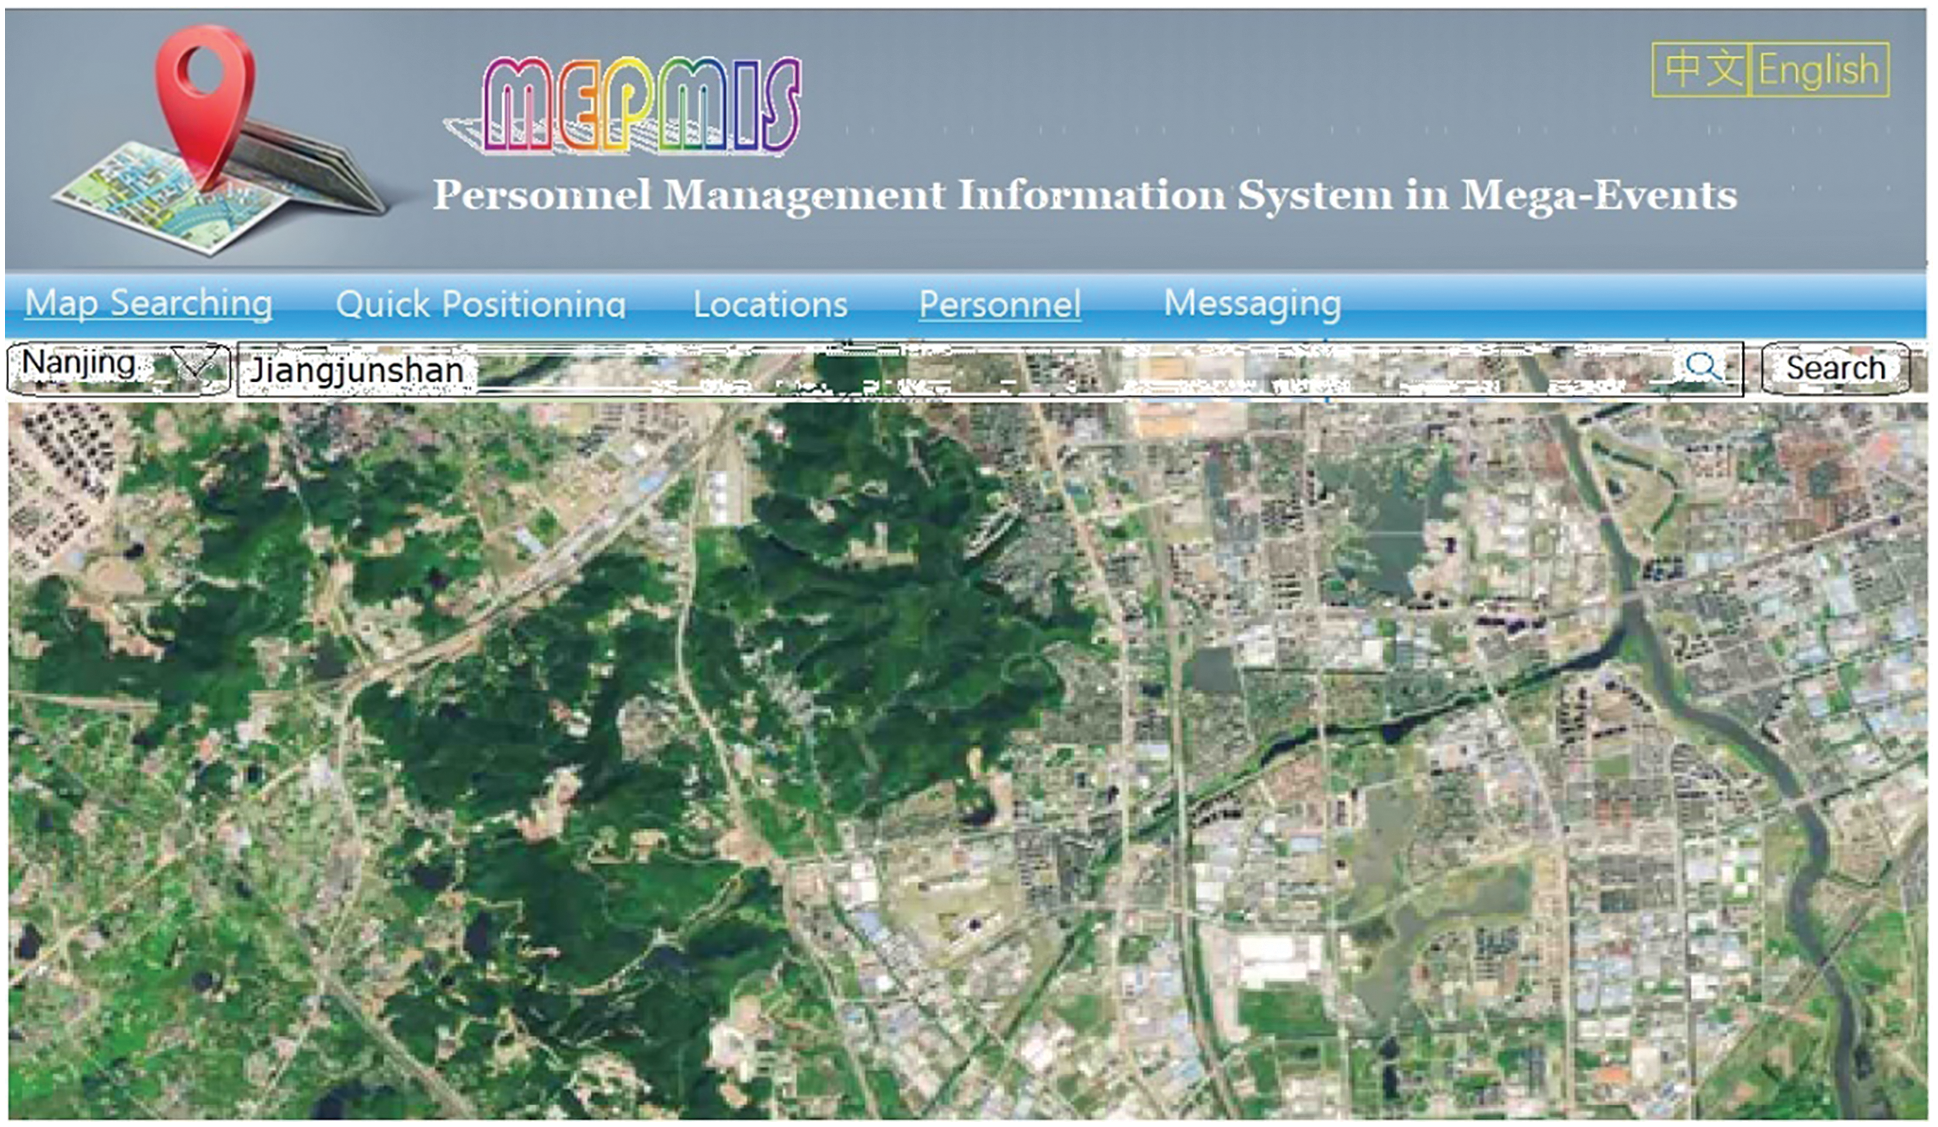
Figure 6: Homepage of MEPMIS server (mixed mode)
To develop a map application using Baidu Map Web Service API, you need to apply for a developer key and index it on the home page HTML or login file header references are as shown in Fig. 7 in which the below sentence:
<script type=“text/javascript” src=“http://api.map.baidu.com/api?v=2.0&ak=Passwords”>
is to create a map instance and add the instantiated map to the div area of the container for display which are ‘Map Searching’, ‘Quick Positioning’, ‘Locations’, ‘Personnel’, and ‘Messaging’.
var map = new BMap.Map(“container”);
Set the map center coordinates, such as Jiangjunshan, that is, set the map position in the middle of the screen: var point = new BMap.Point(118.76913,31.932346); // coordinates of a given location
Set the map zoom level. Baidu map API supports map zoom levels of 1–19:
map. centerAndZoom(point, 15);
The larger the zoom level, the smaller the map display area, the smaller the zoom level and the larger the map display area.
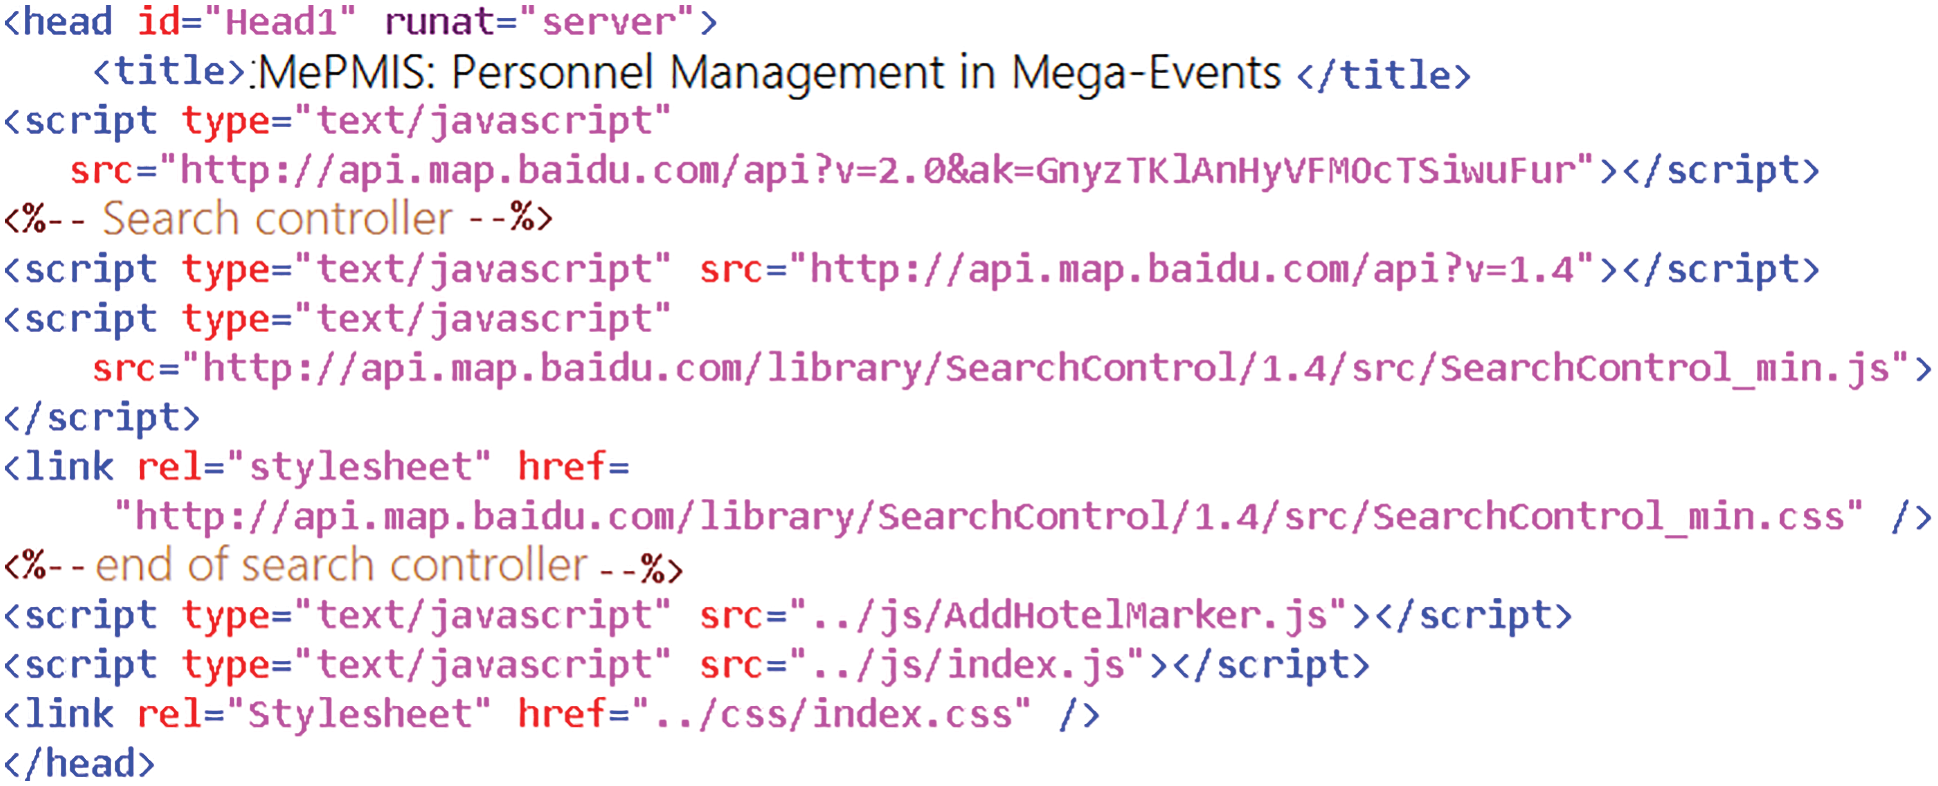
Figure 7: Loading search controller in HTML header
Add a zoom control to the map
var top_left_navigation = new BMap.NavigationControl();
map.addControl(top_left_control);
Add 2D map / hybrid satellite map conversion control
var mapType = new BMap.MapTypeControl({
mapTypes: [BMAP_NORMAL_MAP, BMAP_HYBRID_MAP]});
map.addControl(mapType);
Add default map thumbnail control
var overView = new BMap.OverviewMapControl();
var overViewOpen = new BMap.OverviewMapControl({
isOpen:true, anchor: BMAP_ANCHOR_BOTTOM_RIGHT});
map.addControl(overView);
map.addControl(overViewOpen);
3.3 Location Search and Area Query
Location query is to use the server management system to locate and query the current location of any designated person at any time. The system will directly display the current location of the query target on the electronic map and query the detailed location description information. The user search interface as shown in Figs. 8a–8c, provides three search methods, “manual search”, “mobile search” and “name search”. “Manual search” uses Ajax dynamic loading to load user information, which can be filtered according to units and groups. Ajax asynchronous loading technology does not need to refresh the whole page, providing a good user experience. “Mobile search” is used to enter the mobile phone number of the client user and directly locate and search. “Name search” is used to enter the name of the client user and directly locate the search. Once the above three search and query methods find that the user has uploaded the coordinate information and the coordinate information is valid for more than 10 min, it will be identified on the map.
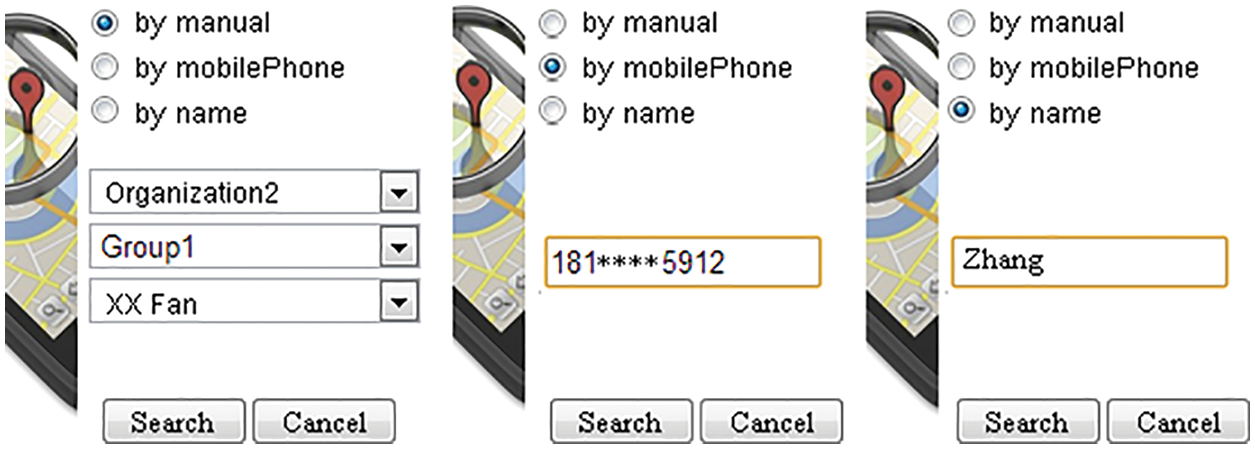
Figure 8: Searching companions’ locations (a) by manual (b) by mobile phone (c) by name
Distribution query and area query: the administrator can query the distribution of all or part of the active personnel in a certain area at any time, the active personnel in the specified area at any time, and whether the specified persons are in the specified area. The query results will be directly displayed on the electronic map, as shown in Fig. 8. At the same time, it can also directly reposition the query results or send group SMS, which is convenient for managers to dispatch and manage personnel.
3.4 Obtaining the Coordinates of the Visible Area of the Map
Usually, add events to map drag, obtain the coordinates of the current area, and send the coordinates of the visual area to the server. The server retrieves the points in the visual area as shown in Fig. 9, which can reduce the pressure on the server and speed up the speed of browsing and processing the data returned by the server.
var bounds = map.getBounds(); //Get the coordinates of the visual area of the map
(bounds.getSouthWest().lng, bounds.getNorthEast().lat); //Upper left coordinates
(bounds.getNorthEast().lng,bounds.getSouthWest().lat); //Lower right coordinates
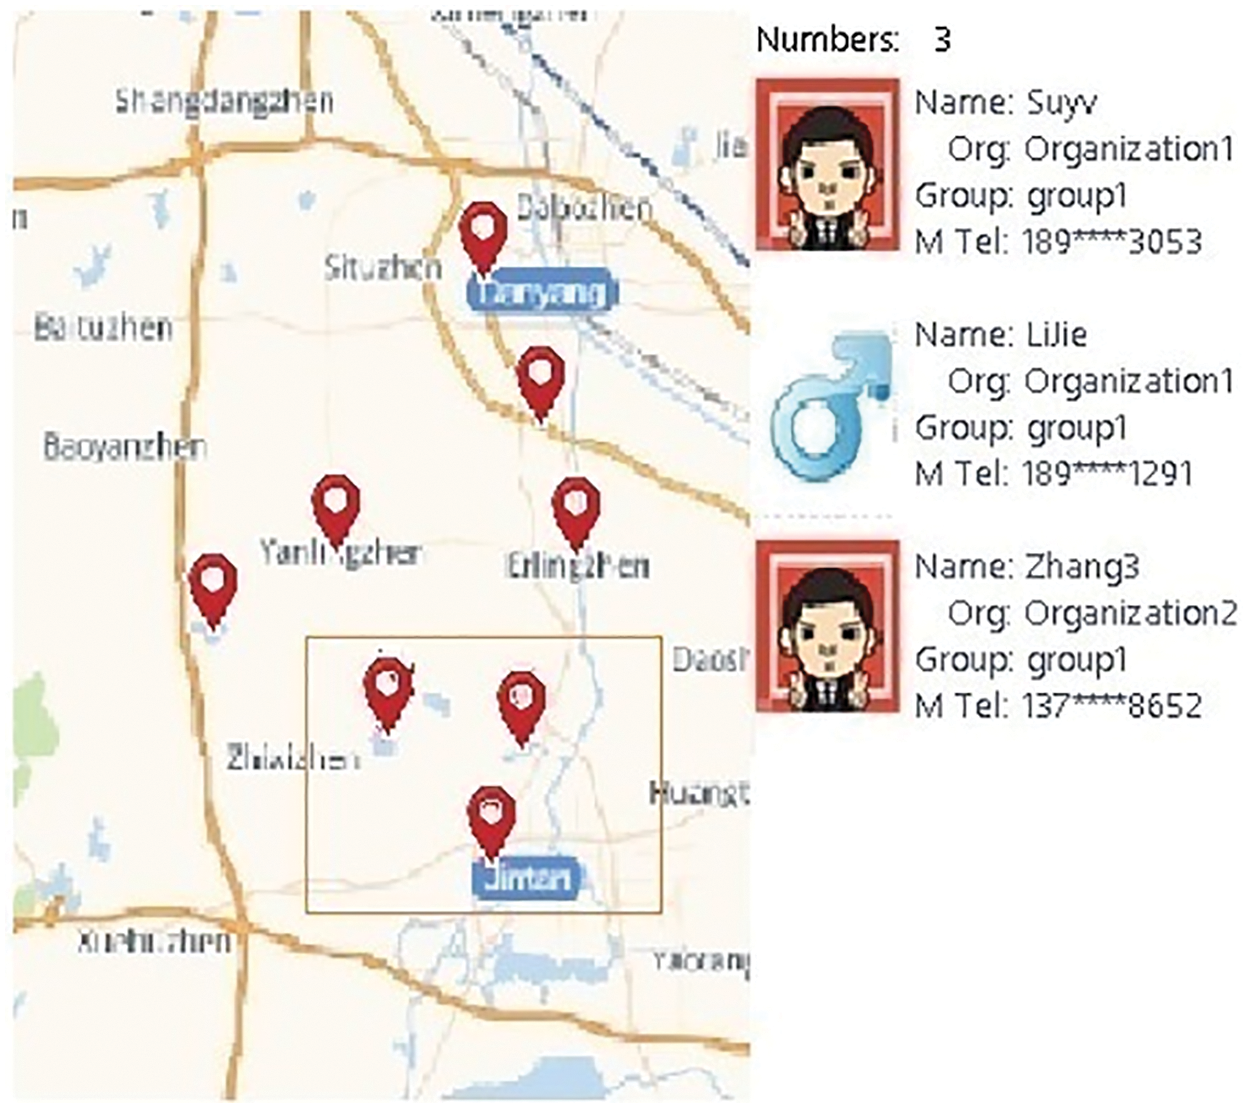
Figure 9: Persons in a selected visible area
3.5 Map Annotation and Optimization
At first, the page is used to send a request directly to the database background to obtain the last location coordinates of all users and mark them on the map. This method is also feasible when the number of active staff users is small. During the test, with the continuous addition of staff and users, when the number of users reaches about a given threshold, the data loading will become abnormally slow each time, and the browser will be stuck. Careful research shows that Baidu map API should not add too many annotation points each time, and map should be used in time Clearoverlays() removes unused annotations to free up memory resources. Therefore, the original design scheme is improved, and drag events are added to the map. Each time the map changes in the visible area of the screen (including drag and direct location), the coordinates of the visible area of the map, including the upper left position coordinates and the lower right position coordinates, are obtained as shown in Fig. 10. First, all annotation points of the original map layer are deleted, then load the users within the coordinates of the visual area and mark them on the map, so that the amount of data loaded each time is greatly reduced. In addition, by removing the expired labels in time, the memory can be released in time, which solves the problem of jamming when the number of users is large. The key implementation code is as follows:
map.addEventListener("dragend", function showInfo() {
RefreshMarker(); // Add event to map drag });
function RefreshMarker() { // Drag and drop to add event handling
var point1lng = map.getBounds().getSouthWest().lng;
var point1lat = map.getBounds().getSouthWest().lat;
var point2lng = map.getBounds().getNorthEast().lng;
var point2lat = map.getBounds().getNorthEast().lat;
map.clearOverlays(); // Clear all outdated annotation points on the map to free up memory
// Reload the dimension points that meet the criteria of the visual area
loadKeShi(point1lng, point1lat, point2lng, point2lat);
}
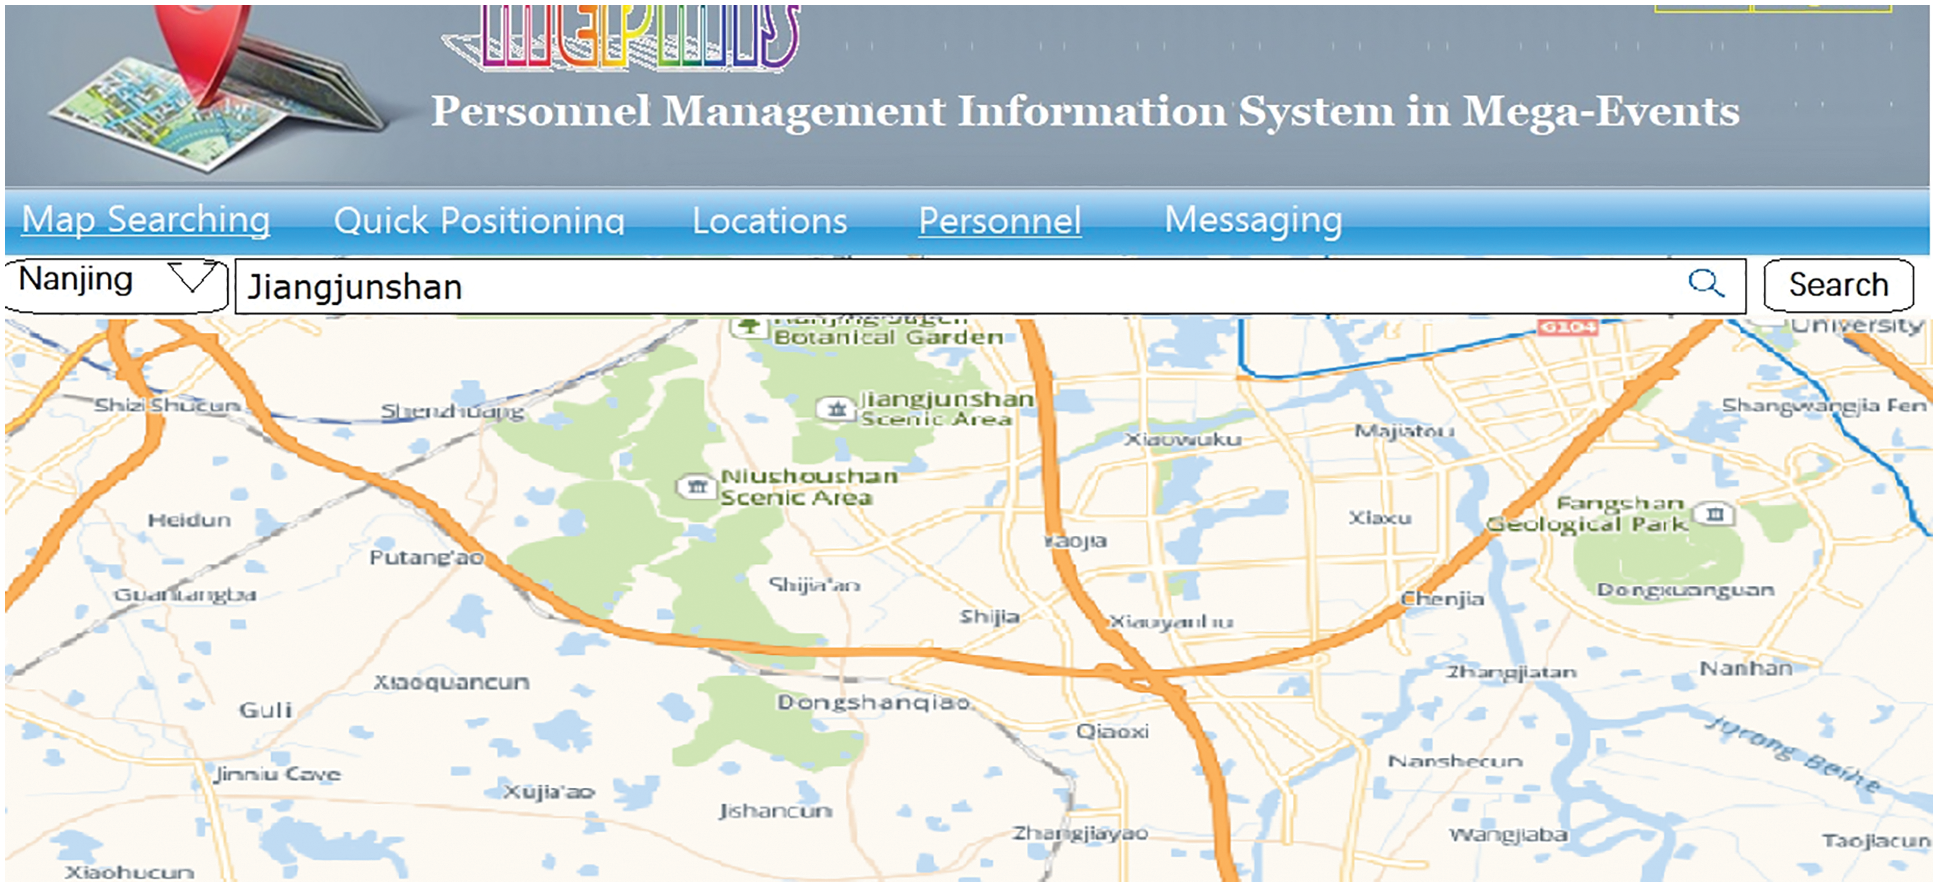
Figure 10: Quick positioning for common locations
3.6 Personnel Position Overlap
In the actual use process, it is found that when the coordinate positions of more than two users are very close or the map zoom level is small, multiple annotation points will overlap as shown on the left of Fig. 11. At this time, it is impossible to click the underlying annotation points to view the specific user information. After careful consideration, the solution is to dynamically add a list window on the right. When there are users in the visual area, the list on the right lists the users in the visual area and counts the number of users in the visual area. Through the search function on the right panel, you can quickly find the location of the target user and pop up the information window. Or click the user information on the list to pop up the corresponding information window, as shown on the right of Fig. 10.
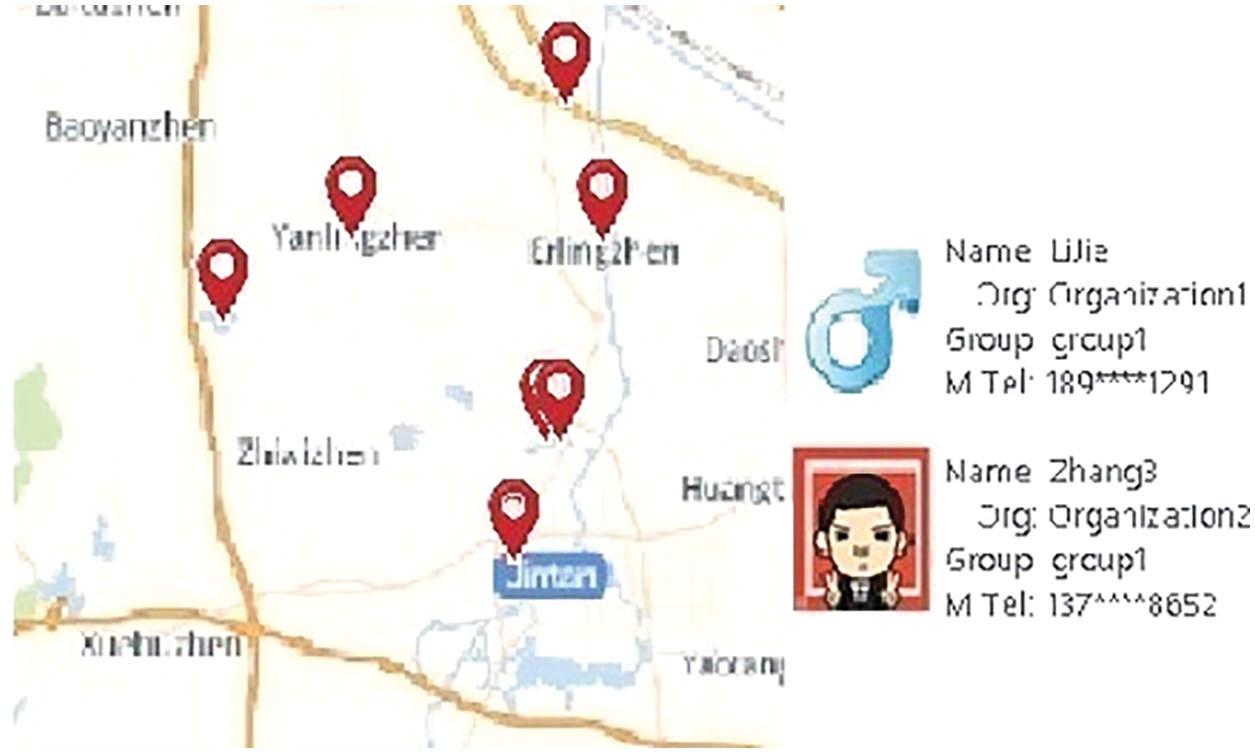
Figure 11: Schematic diagram of persons’ positions overlap during map annotation
When dragging the map, the JavaScript code obtains the upper left location coordinates and lower right vertex coordinates of the visible area of the map and sends them to the server. The server finds the users in the range through the database and returns Json data. The JavaScript code parses the Json data and adds the users in the range to the map in the form of labels.
4 Design and Implementation of Client App
The client app is developed by Android. Its function is to regularly send the current geographical location information of personnel to the server, and the mobile terminal can view the location of nearby peers and call nearby peers. Other client assisted management, such as modifying personal avatar, modifying user password, fuzzy finding partner location, fuzzy search and displaying partner information list, so as to realize some auxiliary functions, such as fast SMS and phone calls, social sharing, history query and so on.
4.1 Main Function Design of Client App
The client login interface is shown in Fig. 12a. Enter the login account and password assigned by the server to log in. The map of the main interface after successful login reflects the current position of the staff user, as shown in the blue origin in Figs. 12b and 12c, and provides two selection methods: common layer as shown in Fig. 12b and satellite layer as shown in Fig. 12c. After “follow” is checked, when the mobile phone position of the client moves, the map center coordinate will follow.
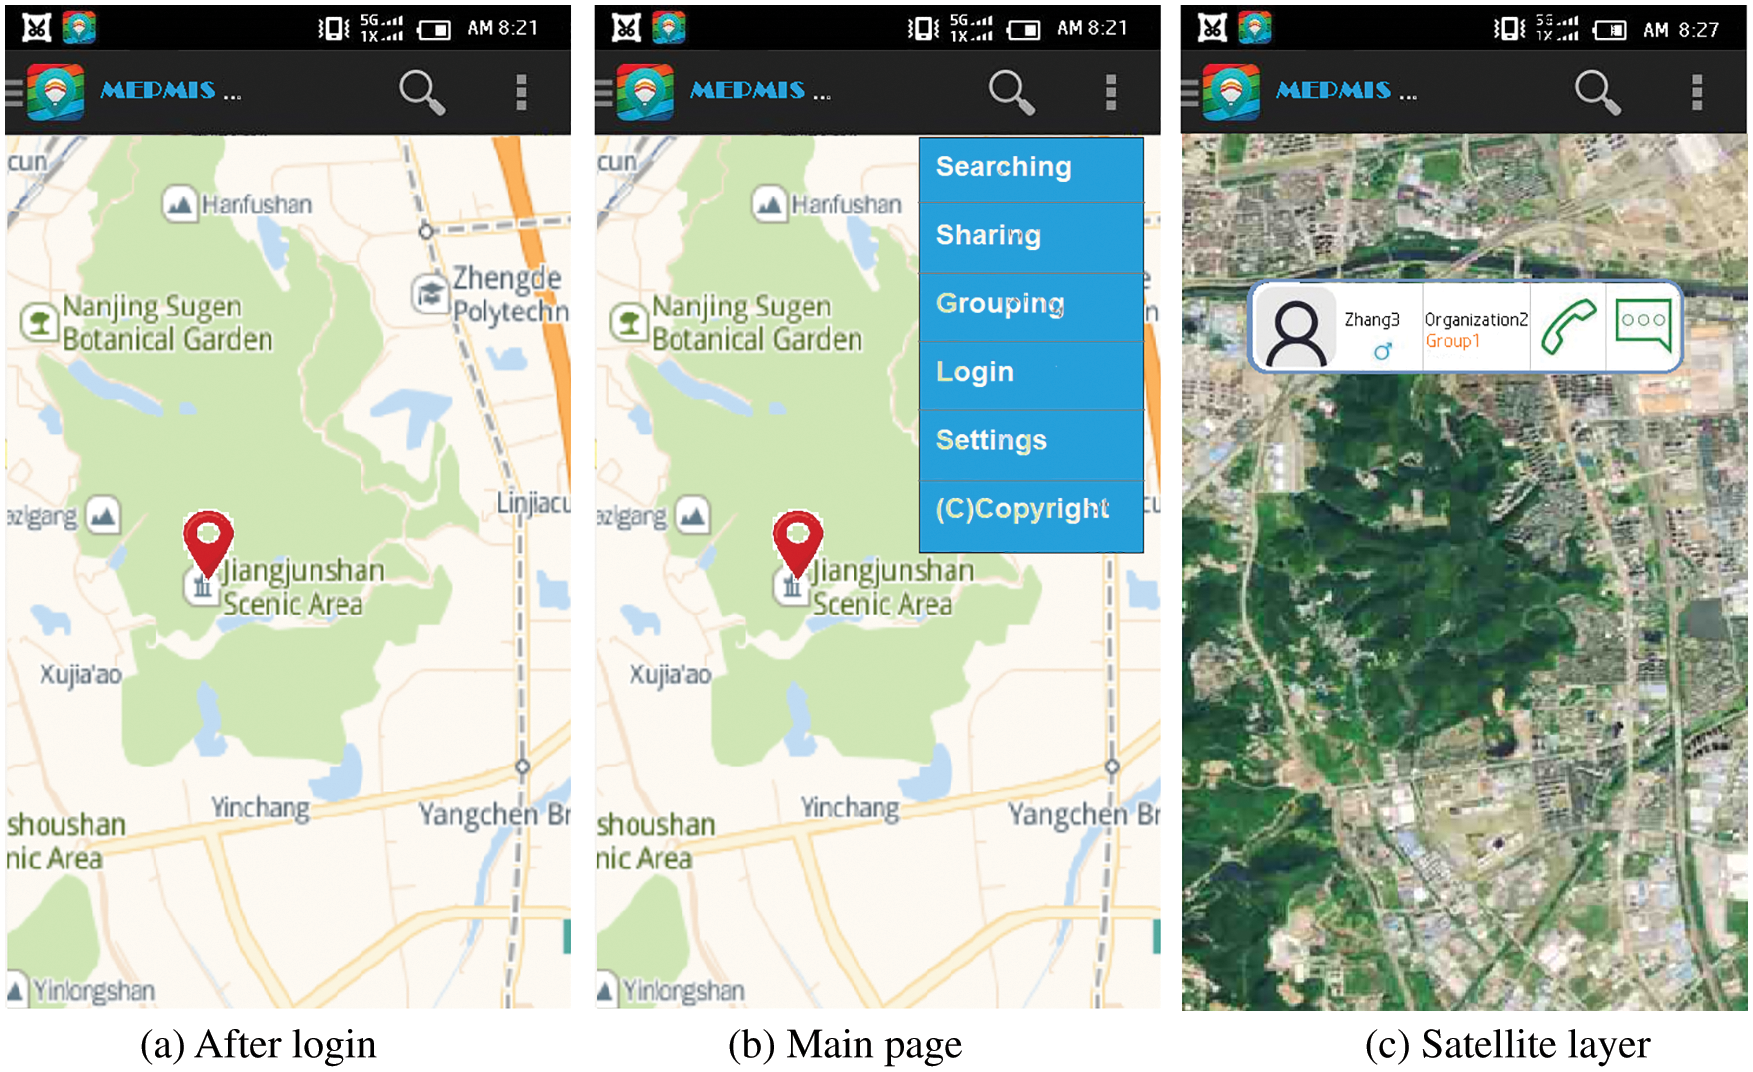
Figure 12: Client interface
Click the drop-down menu on the main interface, as shown in Fig. 12a, with the function notices of “Searching”, “Sharing”, “Grouping”, “Login”, “Settings” and “(C) Copyright”. Click the “Searching” button to search out other staff within 1 km around the server for easy contact. As shown in Fig. 12b, the red label shows the people around, and provides contact information and corresponding quick operations of dialing, scoring and sending text messages.
The fuzzy information query function only needs to input incomplete names to search all matching personnel lists and display them in the form of a list, as shown in Fig. 12c. The list provides the searcher’s name, organization, group and contact information. Dialing and SMS buttons make the contact operation more convenient.
4.2 Client Map Annotation Optimization
The initial method is that the client sends a request to the server, and the server returns the location information of all online clients. After receiving the data, the client marks it on the mobile phone. When the number of online clients reaches a certain number, on the one hand, there is too much data returned, the mobile phone processing is relatively slow, and the map layer is stuck. On the other hand, too much data will waste expensive traffic. After optimization, the client sends a request to the server. The server obtains the coordinate position of the client, then calculates all online clients with a distance of no more than 50 m from the client through a formula, and returns the client information within a radius of 50 m.
The client takes the parsing name fuzzy query as an example, omits the code requesting the server, and raw Json data is the Json format data returned by the server. The client uses the Jackson framework to parse Json data. It can easily convert Java objects into Json objects and XML documents. It can also convert Json and XML into Java objects. Only jackson-core-2.4.0 Jar can be imported into the project of the key codes as below:
private List<Friend> parseJsonToFriendList(String json)
throws JsonParseException, JsonMappingException, IOException {
List<Friend> list = mObjectMapper.readValue(json,
TypeFactory.defaultInstance().constructCollectionType(
List.class, Friend.class));
return list;
}
In the development of this subject, based on Net + MySQL7.6 and Baidu MLBS API, designed and implemented a web-based intelligent positioning system for outdoor personnel in large-scale activities. Through demand analysis, system design, detailed implementation, testing, deployment and trial operation, the function and performance of the system are verified to meet the requirements of users.
After functional performance test and pressure test, it meets the requirements and specifications, and the system has strong functional practicability; Support a variety of mainstream browsers with good compatibility; Multi data source interface, good scalability; Static code review and automatic scanning, with good security, robustness and portability; The interactive response speed is fast, the interface is consistent, the process is intuitive and visual, and the information transmission is clear and efficient. The goal of transparency and visualization of personnel management of major events is realized, and the user experience satisfaction is high.
At present, promoting the development of cloud computing innovation and cultivating the new format of information industry has become a national strategy. The rapid development of cloud computing has become the catalyst for real-time geographic information and personalized location service, which greatly promoted the application and development of MLBS. The Internet plus era has arrived, and user centered location intelligence is booming. Location-based service is related to the core system of urban function. Location-based service technology is needed to monitor, collect, transmit and distribute basic data. Location based services can promote the construction of smart city in multiple dimensions, including equipment, maps, management software and network services. MLBS is also the booster of smart city construction. As MLBS services have opened up online and offline channels, MLBS + SNS is leading the innovative development of information technology services and business models, and the commercial value of the Internet mobile revolution has been realized.
On the other hand, although mobile MLBS technology brings convenience to our work and life, there is also a risk of location trajectory privacy disclosure. Privacy protection technologies for user location and trajectory data mainly include privacy protection methods based on encryption technology, distortion technology, anonymity technology and differential privacy technology, security performance and energy consumption of mobile location edge computing system of Internet of vehicles. Therefore, the application of location-based services will also face new challenges, such as privacy protection, environmental sensitivity, energy-saving optimization and so on. Since major events usually involve a wide range of venues and many people, how to improve and improve the organization and management efficiency of major events, build a location service platform by using mobile Internet, cloud computing and SaaS software technology, and accurately locate and intelligently perceive the staff of major events is one of the important tasks of smart city construction and smart management. Through large-scale activities, the intelligent positioning system of field personnel can grasp the location of staff at any time, so as to quickly respond to service needs, improve response speed and service quality, and improve the efficiency of organization, management and decision-making of large-scale activities through the visual query of geographic information such as maps, addresses and paths. Further research work in the future can add more visualization functions such as message management, historical track playback, statistical analysis of location and personnel, etc. Therefore, it has important theoretical significance and practical value to study MLBS technology and its application in major events management.
Acknowledgement: The work is supported by the Tianjin Planning Project of Philosophy and Social Science under Grant No. TJGL20-018 for Dr. L.J. Hou of Tianjin Normal University, China.
Funding Statement: The authors received no specific funding for this study.
Conflicts of Interest: The authors declare that they have no conflicts of interest to report regarding the present study.
References
1. L. Tarachucky, J. Sabatini-Marques, Y. Tan, M. J. Baldessar and S. Pancholi, “Mapping hybrid cities through location-based technologies: A systematic review of the literature,” Cities, vol. 116, no. 9, pp. 103296, 2021. [Google Scholar]
2. Y. Su, L. J. Hou, S. N. Li, Z. C. Jiang and K. M. Ding, “Research and application progress of mobile location-based services,” Journal of Jinling Institute of Technology, vol. 37, no. 4, pp. 55–60, 2021. [Google Scholar]
3. H. S. Huang, X. Angela Yao, J. M. Krisp and B. Jiang, “Analytics of location-based big data for smart cities: Opportunities, challenges, and future directions,” Environment and Urban Systems, vol. 90, no. 3, p. 101712, 2021. [Google Scholar]
4. G. Sun, F. H. Li and W. D. Jiang, “Brief talk about big data graph analysis and visualization,” Journal on Big Data, vol. 1, no. 1, pp. 25–38, 2019. [Google Scholar]
5. C. Guo, M. Y. Wang, K. F. Gao, J. N. Liu and W. W. Zuo, “Location-based service technologies for major public health events: Illustrated by the cases of COVID-19 epidemic,” Geomatics and Information Science of Wuhan University, vol. 46, no. 2, pp. 150–158, 2021. [Google Scholar]
6. Baidu, “Mobile positioning_Baidu encyclopedia,” 2020. [Online]. Available: http://baike.baidu.com/view/252596.htm?func=retitle. [Google Scholar]
7. K. Geetha and A. Kannan, “An efficient information system for providing location based services in network environments,” Wireless Personal Communications, vol. 109, no. 3, pp. 2377–2398, 2019. [Google Scholar]
8. Y. Xue, Y. Wang and J. Y. Liang, “A self-adaptive mutation neural architecture search algorithm based on blocks,” IEEE Computational Intelligence Magazine, vol. 16, no. 3, pp. 67–78, 2021. [Google Scholar]
9. Q. J. Wen, Z. J. Ren, H. Lu and J. F. Wu, “The progress and trend of BIM research: A bibliometrics-based visualization analysis,” Automation in Construction, vol. 124, no. 2, p. 103558, 2021. [Google Scholar]
10. M. A. Mujahid, K. A. Bakar, T. S. J. Darwish and F. T. Zuhra, “Cluster-based location service schemes in VANETs: Current state, challenges and future directions,” Telecommunication Systems, vol. 76, no. 3, pp. 471–489, 2021. [Google Scholar]
11. H. M. Hussien, Y. N. Shiferaw and N. B. Teshale, “Survey on indoor positioning techniques and systems,” in Lecture Notes of the Institute for Computer Sciences, Social Informatics and Telecommunications Engineering, vol. 244, Cham: Springer, pp. 46–55, 2018. [Google Scholar]
12. F. Furfari, A. Crivello, P. Baronti, P. Barsocchi and J. Torres-Sospedra, “Discovering location-based services: A unified approach for heterogeneous indoor localization systems,” Internet of Things, vol. 13, no. 3, p. 100334, 2021. [Google Scholar]
13. S. B. Su, W. Zhao and C. S. Wang, “Parallel swarm intelligent motion planning with energy-balanced for multirobot in obstacles environment,” Wireless Communication and Mobile Computing, vol. 2021, p. 8902328, 2021. [Google Scholar]
14. M. Elhajj and W. Y. Ochieng, “Urban bus positioning: Location based services and high-level system architecture,” Case Studies on Transport Policy, vol. 8, no. 1, pp. 12–21, 2020. [Google Scholar]
15. G. Ortiz, J. Boubeta-Puig, J. Criado, D. Corral-Plaza, A. Garcia-De-Prado et al., “A microservice architecture for real-time IoT data processing: A reusable Web of things approach for smart ports,” Computer Standards & Interfaces, vol. 81, no. 4, pp. 103604, 2022. [Google Scholar]
16. V. Filipov, V. Schetinger, K. Raminger, N. Soursos, S. Zapke et al., “Gone full circle: A radial approach to visualize event-based networks in digital humanities,” Visual Informatics, vol. 5, no. 1, pp. 45–60, 2021. [Google Scholar]
17. W. Lu, G. Yuan, H. Yang, H. Yang, X. Zhao et al., “Visualization of reactor core based on triangular mesh method,” Intelligent Automation & Soft Computing, vol. 30, no. 2, pp. 689–699, 2021. [Google Scholar]
18. D. Spatharakis, I. Dimolitsas, D. Dechouniotis, G. Papathanail and S. Papavassiliou, “A scalable edge computing architecture enabling smart offloading for location based services,” Pervasive and Mobile Computing, vol. 67, no. 9, p. 101217, 2020. [Google Scholar]
19. Baidu, “WEB Service API,” 2021. [Online]. Available: http://developer.baidu.com/map. [Google Scholar]
20. A. Enfroy, “15+ Best data visualization tools of 2022 (with examples),” 2022. [Online]. Available: https://www.adamenfroy.com/data-visualization-tools. [Google Scholar]
21. A. C. Umaquinga, D. H. Peluffo-Ordóez, P. D. Rosero-Montalvo, P. E. Godoy-Trujillo and H. Benítez-Pereira, “Interactive visualization interfaces for big data analysis using combination of dimensionality reduction methods: A brief review,” in Advances in Intelligent Systems and Computing, vol. 1110, Cham: Springer, pp. 193–203, 2020. [Google Scholar]
22. W. D. Jiang, J. Wu, G. Sun, Y. X. Ouyang, J. Li et al., “A survey of time series data visualization methods,” Journal of Quantum Computing, vol. 2, no. 2, pp. 105–117, 2020. [Google Scholar]
23. S. C. Deng, J. Q. Zhang, X. D. Zhang, L. P. Jia and Z. H. Li, “Research and development of a COVID-19 epidemic visualization system based on WebGIS,” Journal of Beijing University of Civil Engineering and Architecture, vol. 36, no. 4, pp. 93–99, 2020. [Google Scholar]
24. Y. F. Sheng, W. D. Chen, H. Wen, H. J. Lin and J. J. Zhang, “Visualization research and application of water quality monitoring data based on ECharts,” Journal on Big Data, vol. 2, no. 1, pp. 1–8, 2020. [Google Scholar]
Cite This Article
 Copyright © 2023 The Author(s). Published by Tech Science Press.
This work is licensed under a Creative Commons Attribution 4.0 International License , which permits unrestricted use, distribution, and reproduction in any medium, provided the original work is properly cited.
 Downloads
 Citation Tools