
 Submit a Paper
 Propose a Special lssue
 Open Access
ARTICLE

Customer Churn Prediction Framework of Inclusive Finance Based on Blockchain Smart Contract
1 College of Information Engineering, Qingdao Binhai University, Qingdao, 266555, China
2 School of Computer and Software, Dalian Neusoft University of Information, Dalian, 116023, China
3 College of Information Engineering, Shandong Vocational and Technical University of International Studies, Rizhao, 276826, China
4 School of Intergrated Circuit, Wuxi Vocational College of Science and Technology, Wuxi, 214028, China
5 School of Mathematics and Statistics, University College Dublin, Dublin, Ireland
* Corresponding Author: Ning Cao. Email:
Computer Systems Science and Engineering 2023, 47(1), 1-17. https://doi.org/10.32604/csse.2023.018349
Received 06 March 2021; Accepted 01 May 2021; Issue published 26 May 2023
 View Full Text
 Download PDF
Abstract
In view of the fact that the prediction effect of influential financial customer churn in the Internet of Things environment is difficult to achieve the expectation, at the smart contract level of the blockchain, a customer churn prediction framework based on situational awareness and integrating customer attributes, the impact of project hotspots on customer interests, and customer satisfaction with the project has been built. This framework introduces the background factors in the financial customer environment, and further discusses the relationship between customers, the background of customers and the characteristics of pre-lost customers. The improved Singular Value Decomposition (SVD) algorithm and the time decay function are used to optimize the search and analysis of the characteristics of pre-lost customers, and the key index combination is screened to obtain the data of potential lost customers. The framework will change with time according to the customer’s interest, adding the time factor to the customer churn prediction, and improving the dimensionality reduction and prediction generalization ability in feature selection. Logistic regression, naive Bayes and decision tree are used to establish a prediction model in the experiment, and it is compared with the financial customer churn prediction framework under situational awareness. The prediction results of the framework are evaluated from four aspects: accuracy, accuracy, recall rate and F-measure. The experimental results show that the context-aware customer churn prediction framework can be effectively applied to predict customer churn trends, so as to obtain potential customer data with high churn probability, and then these data can be transmitted to the company’s customer service department in time, so as to improve customer churn rate and customer loyalty through accurate service.Keywords
The concept of inclusive finance was first put forward at the “International Year of Microfinance” Conference held by the United Nations in 2005. In China, inclusive finance mainly targets three types of customer groups: 1. The “agriculture, rural areas and farmers”; 2. Small and micro enterprises and individual industrial and commercial households; and 3. Low- and middle-end community residents.
The customer base of inclusive finance generally lacks mortgage assets, so they are heavily dependent on subjective evaluation of credit ratings. Currently, the credit advisory service system for small and micro enterprises and low-income groups is relatively weak. If a risk control model is established through smart contracts by using block-chain’s naturally credible account data and tamper proof technical features and based on real-world electronic license data, it is possible to better solve the problem that the inclusive-finance groups lack the authentic and credible formal financial data and the assets to be mortgaged.
Context awareness comes from the study of pervasive computing. It collects the current environmental information with the help of sensors and other equipment as well as related technologies, to help with system analysis and adjust and monitor the environment based on the analysis results. Currently, the context awareness technology is mainly composed of three parts: context acquisition, context representation and context use. Acquisition of contextual information through multiple channels is called contextual acquisition. Contextual information mainly includes user context, environmental context, and task context [1]. Acquisition methods of contextual information mainly include explicit acquisition, implicit acquisition, and inference acquisition [2]. Commonly seen solutions to context modeling include key-value pair model [3], process calculus model [4–6], graph model [7–9], object-oriented model [10,11], logical model [12,13], vector model and ontology model [14–16]. The context awareness processing process is mainly composed of two parts: contextual utilization and contextual organization. The purpose of context use is to obtain specific contextual information. The purpose of context organization is to collect contextual information, abstract it into contextual models, and then give contextual explanations. The contextual information is stored for easy retrieval.
With the rapid development of the industry, the competition has become increasingly intensified and the inclusive financial services available for customers have become more and more diversified; accordingly, an increasingly serious problem of customer churn has appeared. This study will use data mining technology to build a framework for predicting the churn of inclusive-finance customer groups, to obtain data on the potential customers with a high probability of churn. The data are then passed to the corporate customer service departments in a timely manner, who may improve the loyalty of predicted churning customers through precise services.
Starting from the related research on context-aware technology, to address the problem of dimensionality reduction and predictive generalization ability in feature selection, this study proposes a customer churn prediction framework under improved meta-inspired algorithm based on context awareness. By introducing the contextual factors of customers’ environments into the prediction framework, it is possible to further explore the relationship among customers, their contexts, and the characteristics of the predicted churning customers. An improved hybrid leapfrog algorithm is used to optimize the search and analysis of the characteristics of predicted churning customers and filter out key indicators’ combination, to obtain the data about the potential churning customers.
2.1 Current Status of Customer Churn Prediction Research
There are many methods for predicting customer churn, and this paper divides them into the following five categories.
One category is based on traditional statistics, and typical methods include decision trees, clustering algorithms, and regression analysis. Combining the advantages of the decision tree and logistic regression method, an early warning model of customer churn was proposed by Yanni Xu [17]. By setting different weight parameters for the clustering algorithm the data category imbalance and large-scale problem were solved by Xiaojuan Jiang [18]. TingYin proposed a Bayesian decision tree algorithm in 2014. The addition of Bayesian nodes compensates for the shortcomings of the decision tree method and provides a new research idea and analysis method for customer churn early warning analysis. The above method has the advantages of strong model interpretability and good effect of processing the classification and continuity data. However, there is also poor flexibility and generalization ability, and the data processing effect is large for multidimensional and multidimensional nonlinear data processing.
The second category is based on artificial intelligence research. Typical methods include artificial neural networks, self-organizing maps, and evolutionary learning. Ling Tian proposed a prediction model based on a neural network in 2007. Yisheng Dai and Yongsheng Yang used artificial intelligence technology to construct a customer churn prediction model based on a learning vector quantization (LVQ) neural network in 2011. Kasiran Z and others helped predict the loss of mobile phone users through cyclic neural networks and enhanced learning in 2014. Such methods mainly rely on the principle of empirical risk minimization, the logical derivation and mathematical proof are not strict, and the generalization ability is relatively weak.
The third category is based on the study of statistical learning theory. Typical methods include naive Bayes and support vector machines. Suli Qian introduced cost-sensitive learning theory into customer churn prediction and established a churn prediction model based on an improved support vector machine in 2007. Bangzhu Zhu and Qiuju Zhang built a three-stage predictive model of customer churn based on systems, man and cybernetics (SMC) and a least squares support vector machine to predict whether customers are lost in 2010. Kirui C predicted customer churn through naive Bayes and Bayesian networks in 2013. Guoen Xia used a support vector machine to study network customer churn prediction that incorporates customer value characteristics and emotional characteristics in 2018. The support vector machine is a typical method in statistical learning theory research that can solve small sample, nonlinear and pattern recognition problems and has certain advantages. However, its typical disadvantage is that the choice of parameters determines the accuracy of the prediction.
The fourth category is based on the study of integrated learning theory. The core of the theory is to predict customer churn through the integrated use of multiple methods. Chunlin Wang and Jianmin He proposed a churn prediction model based on a combined classifier in 2007. The experimental results show that the combined classifier trained by the AdaBoost algorithm can effectively improve the prediction accuracy. Bin Luo proposed a new customer churn prediction model based on rough set theory, a neural network, and a bee colony algorithm linear integrated multi-classifier in 2011. Coussement K, De Bock K W and others predicted online customer churn through integrated learning methods in 2013.
The fifth category is based on social network analysis research. The core of the theory is that there is a certain relationship between pre-loss customers and churn customers or in the same community. Based on the call network, Phadke C predicted customer churn by losing the customers’ net cumulative impact value in 2013.
An important research branch in pervasive computing is context awareness [19]. Context awareness is simply a situation in which the context of the user is perceived and automatically adjusted to adapt to change. After the customer big data in the inclusive financial field are collected, only the data mining through this part of the data cannot bring about a significant improvement in the performance of the customer churn prediction. Customer behavior changes dynamically with changes in contextual information, and the influence of external situation factors on customers is introduced into the framework of the prediction model, which can realize the detailed portrayal of customer behavior scenes, indirectly map out the causes of customer behaviors, and significantly improve the effectiveness of customer churn predictions. Context awareness usually includes three parts: context data acquisition, context model establishment and the analysis and processing of context data. Contextual data can be divided into direct context and indirect context according to different acquisition methods [20]. Direct context acquisition generally relies on sensors, databases, the Internet and other channels, and contextual data filtering, impurity removal, formatting and other preprocessing become available contextual information. Indirect context acquisition needs to be obtained by reasoning and verifying direct contextual information through certain constraints and reasoning methods. Contextual information forms a context model based on a certain algorithm. The model uses contextual reasoning to find hidden information and analyzes the feature attribute set of customer churn, which provides the basis for the next feature optimization.
2.3 Impact of Customer Attributes on Project Interest
When customers choose projects, their own attributes will have a certain impact on their choice tendency. For example, 25-year-old customers will have differences with 45-year-old customers when choosing, and men and women will also have significant differences when choosing. The smaller the age difference, the smaller the impact on customer selection. According to the literature [21], the age difference threshold of customers is set to 5. Customers with age difference less than 5 think they are the same in age attribute. Assume that the age of customer m is Am and the gender is Gm; The age of client n is An, and the gender is Gn; The calculation of the similarity of customer age to project interest is shown in Eq. (1).
The calculation of the similarity of customer gender to project interest is shown in Eq. (2),
2.4 Impact of Project Hotspots on Customer Interest
When customers choose hot projects, their starting point may not be from their own interests, but from the influence of financial institutions’ propaganda and marketing methods, or out of curiosity about hot projects. Therefore, in the calculation of customer interest similarity, the weight of the impact of projects with high hotspots on interest similarity should be reduced, that is, the impact rate of projects with high hotspots is low.
When calculating the interest similarity of two customers, there needs to be a common scoring behavior for some items between the two customers. The more common scoring items between the two customers, the more similar the interest tendencies of the two customers are. The more common scoring items between customers and the smaller the scoring variance, the greater the interest similarity between customers.
Assume that the item set of customer m with scoring behavior is Im, and the item set of customer n with scoring behavior is In; Then the calculation of project hot spot rate and customer interest similarity is shown in Eq. (3).
2.5 Customer Satisfaction with the Project
When customers choose projects, they have their own interest tendency. When customers rate the project, they have their own judgment on whether some features of the project meet their expectations. For example, a customer who likes a financial derivative project gives a low score to the project, which does not mean that the customer does not like the project, but that the project may not meet some special requirements of the customer and fails to meet the customer’s expectations of the financial derivative project.
Assume S is a set of items with the same characteristics in the common scoring items of customer m and customer n. The larger the project set S, the more similar the two customers’ preferences for project characteristics. The larger the project set S, the smaller the difference in satisfaction of project characteristics between customers, and the greater the similarity of interests between customers, as shown in Eq. (4),
To sum up, the customer’s own attributes, hotspot impact rate and project satisfaction should be considered when calculating the customer’s interest similarity in the project. Therefore, the customer’s interest similarity is calculated as shown in Eq. (5).
2.6 Feature Set Clustering Based on Context Awareness
Feature set clustering under context awareness conditions is the process of dividing feature sets into multiple subsets composed of similar feature objects. Each feature object is like to other feature objects of this set, but different from other feature objects of other sets. K-means algorithm is a simple and effective clustering algorithm. K represents the number of feature sets to be divided, means represents the mean of all feature objects in the set, and the similarity between feature objects is measured by their distance. The smaller the distance, the higher the similarity between feature objects, and the more they should be divided into the same set. The specific process of feature set clustering algorithm under context awareness is as follows.
Input: set Q is composed of p feature objects, k is the number of feature sets, km_ max_ iter is the maximum number of iterations.
Output: k feature sets
Steps:
(1) Select k initial features randomly from Q.
(2) Calculate the distance from the remaining feature objects in Q to each initial feature and divide them all into the nearest set.
(3) Calculate the mean value of all feature objects in each set as the new initial feature.
(4) Repeat steps 2 and 3 until the initial characteristics no longer change or reach the set km_ max_ iter.
2.7 Singular Value Decomposition Algorithm Combined with Time Decay Function
The collaborative filtering algorithm performs well in dealing with complex and unstructured objects and has fast operation speed and strong robustness. The collaborative filtering algorithm is currently mainly used in recommendation and prediction systems. It collects data from customers’ behaviors to predict and depends on the relationship between customers and projects [22]. This algorithm mainly includes customer-based collaborative filtering [23] and project-based collaborative filtering [24]. The core idea of customer-based collaborative filtering algorithm is to use similarity to find customers with similar interests to current customers and output the interests and preferences of these customers as prediction results. The core idea of the project-based collaborative filtering algorithm is to use the similarity to find the scores of K neighboring projects adjacent to the current project and calculate the weighted average of these scores as the predicted score output of the project.
The collaborative filtering algorithm mainly has the following two problems: first, data sparsity. Due to the huge amount of data of customers and the project itself, the effective customer scoring data is scarce, resulting in data sparsity. Second, the algorithm itself is not real-time enough. Customer preferences will change with time. The collaborative filtering algorithm itself does not consider the impact of time characteristics, resulting in low prediction accuracy, low real-time, and weak scalability.
Liu Qingqing et al. [25] used Singular Value Decomposition (SVD) algorithm to decompose and fill in the scoring matrix, which effectively alleviated the problem of data sparsity, but did not consider customer scoring habits and relevant situational factors, resulting in average prediction scoring effect. Generally, the customer’s interest in the project is not static. However, the customer’s recent scoring behavior can better reflect the customer’s current interest in the project as time changes. This paper introduces a time decay function to optimize the SVD algorithm.
The meaning of the
The first half of Loss is the square error term, the second half is the regularization term, and
3 The Establishment of an Inclusive Financial Customer Churn Prediction Framework under Contextual Awareness in the Smart Contract Layer
The distributed ledger technology in the blockchain technology solves the problem of the original information asymmetry, so that each participating subject is an information unit, and the information between multiple subjects is recorded and shared on each unit. The problems of “difficult financing and expensive financing” for small and medium-sized small and medium-sized enterprises in traditional supply chains are very prominent. The unit will more actively participate in the supply chain activities, understand the information, and adopt corresponding strategies. The basic structure of inclusive finance on the blockchain is shown in Fig.1.
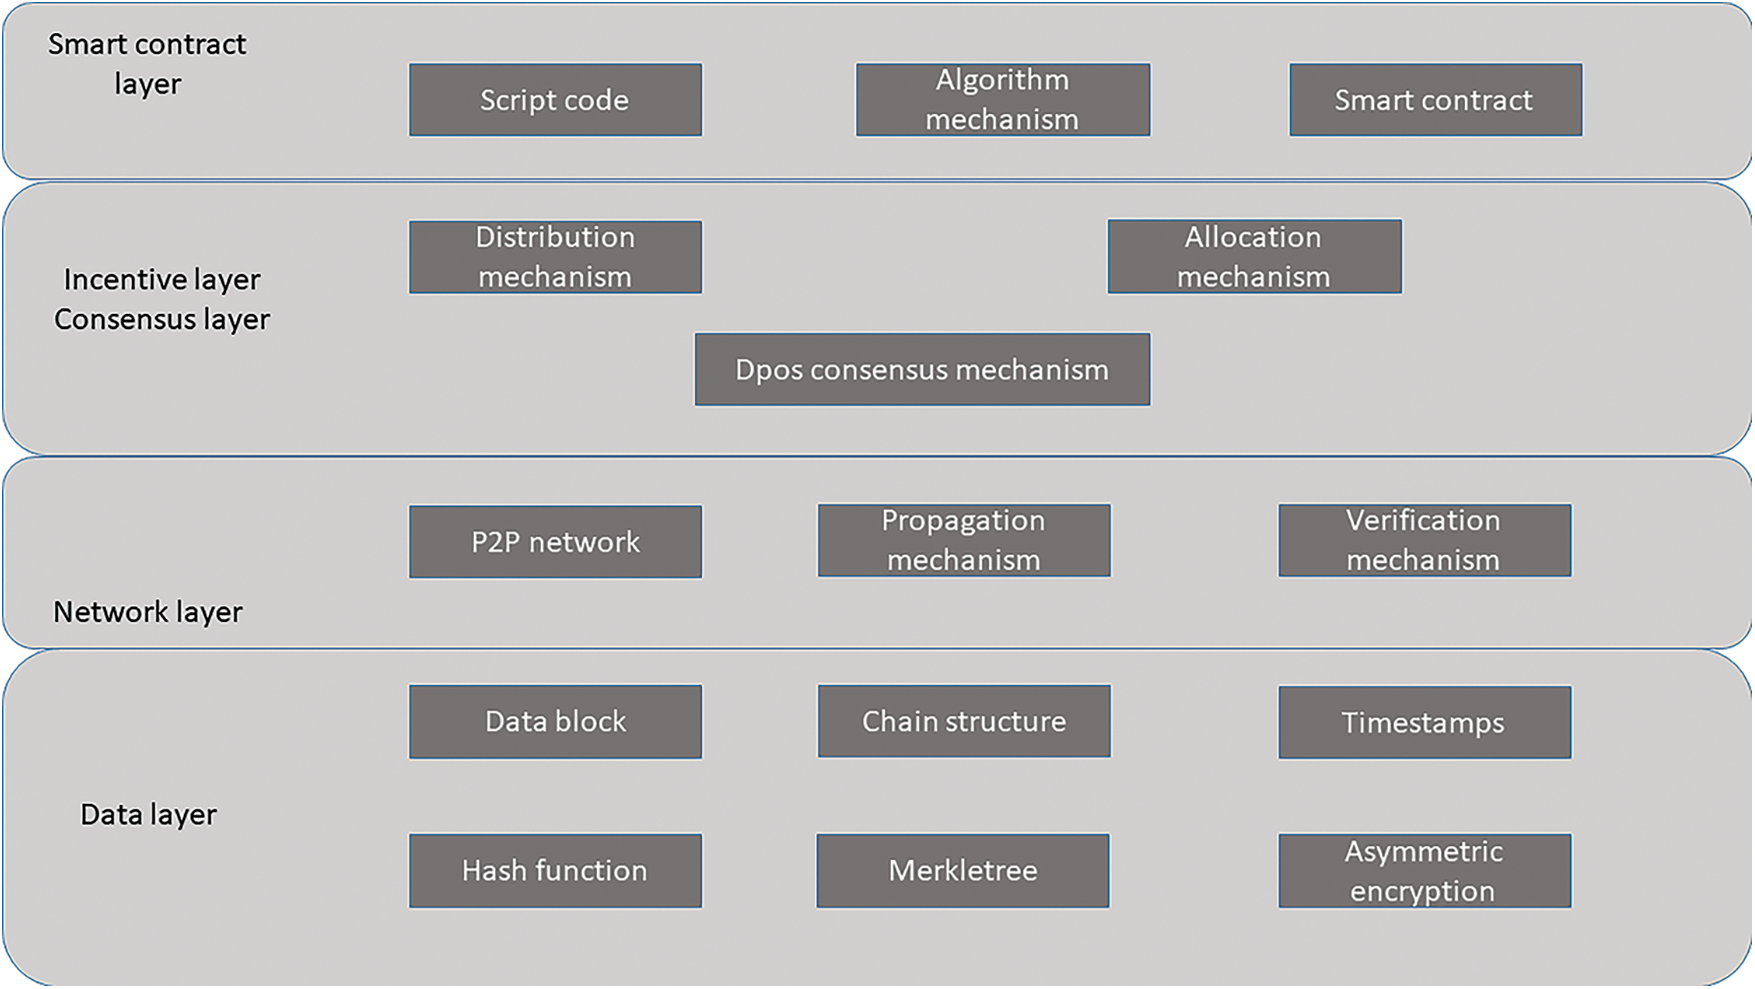
Figure 1: The basic structure of inclusive finance on the blockchain
Financing entities obtain financing from commercial banks through collateral, and collateral value data interacts with the blockchain through information transfer [26–30]. When the market information is continuously updated, the bank will re-evaluate the market value of the collateral in real time. If the evaluation result is that the current value of the collateral is equal to or higher than the original mortgage value, it will remain unchanged; The bank issues an alarm when the mortgage value is reached, and the blockchain uses smart contract technology to trigger the sale of the collateral value or automatically fill the collateral based on the contract content based on the condition that the value of the collateral value in the smart contract is lower than the original value, as shown in Fig.2.
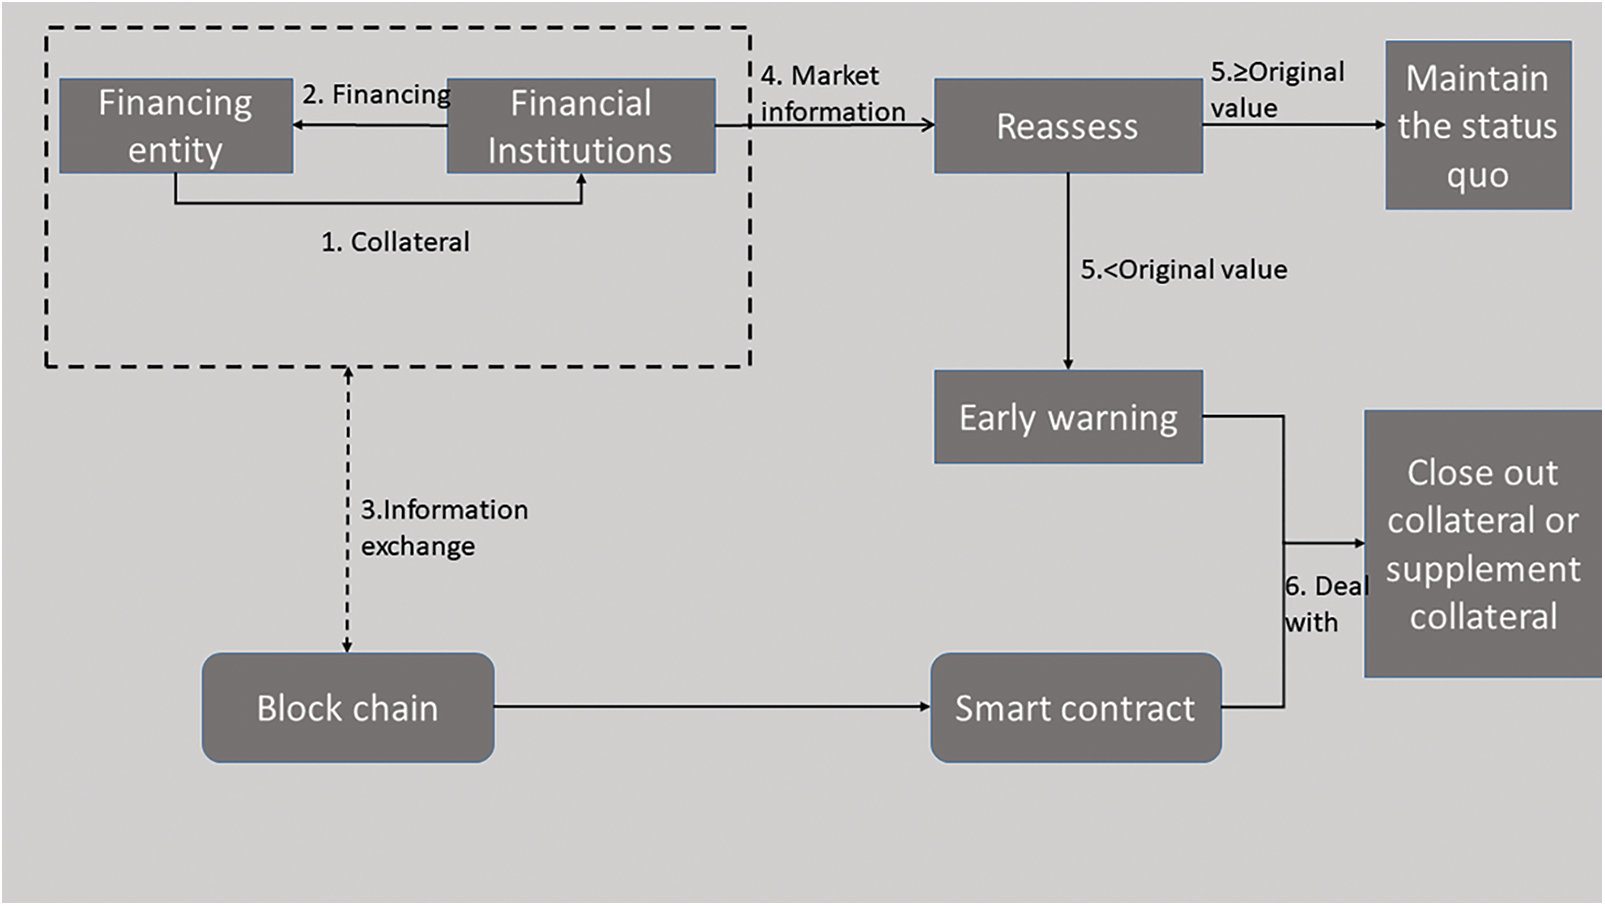
Figure 2: Blockchain helps inclusive financial institutions resist market risks
The prediction framework of inclusive financial customer churn under context awareness in the smart contract layer mainly includes five stages: data acquisition, data preprocessing, feature selection, churn prediction, and result evaluation. Feature selection is mainly to reduce the subjectivity existing in the original data, reduce the “noise” of the data, and reduce the data dimension without loss or with less loss of data information. Feature selection mainly refers to selecting a set of feature subsets with the best classification prediction performance from all the features of the data set using a certain measurement method. When the data dimension is large, it takes considerable time to combine and select the optimal feature subset.
For the input multi-source data, the data preprocessing based on feature engineering should be carried out first. The specific operations are as follows: (1) Initial feature selection, such as removing the data with minimal correlation with the target feature. (2) Normalization and discretization of continuous numerical type features. For example, divide the customer’s age into 10 age stages from small to large. (3) One-Hot coding is used for non-numeric features. For example, the customer’s gender is coded with 0 and 1. The financial items are divided into 29 types and coded with 1, 2, 3, etc. according to the sequence of type assumptions. After data preprocessing, the customer characteristic matrix A, the customer-project scoring matrix R and the project type characteristic matrix B can be obtained.
Use the term frequency-Inverse Document Frequency (TF-IDF) to get the customer-project preference matrix H.
It can be seen from Eq. (17) that the higher the frequency of a certain type of item in a customer’s review list, and the smaller the proportion of items of this type in all items, the larger the corresponding
Finally, the customer matrix W can be obtained by combining the customer characteristic matrix A, the customer-project scoring matrix R and the customer-project preference matrix H. The specific expression is as follows.
3.2 Feature Selection Under Context Awareness
Because the data set contains more non-numerical data, such as customer gender, project type and other information, cosine similarity can better describe the similarity between two customer feature vectors. The cosine similarity is defined as follows.

Figure 3: Multi-source data feature selection process
The customer’s interest in the project is not static, but gradually changes with the passage of time, in line with the law of Ebenhaus forgetting curve. Add the time change to the calculation as follows:
When evaluating the target project, customers need to consider whether the attributes of the project are still attractive to individuals. Therefore, the above time change calculation formula needs to be further updated.
x is the target project, and T is the collection of projects that have the same characteristics as project x and have been evaluated by customer m.
The final project evaluation prediction equation is as follows.

Figure 4: Customer churn prediction process
4 Empirical Study on the Prediction Framework of Inclusion Financial Customer Churn Based on Contextual Awareness
First, select the CM1, KC1, KC3, MC2, MW1, PC1, PC3, PC4, and PC5 data sets on NASA for software defect prediction to verify the prediction performance of the prediction framework proposed in this paper. Then use inclusive financial customer churn data provided by a financial company (the company name is hidden for privacy reasons) to further verify the effectiveness of the forecasting framework. There are 70,000 customer records in these data set, and each record contains 60 attribute indicators in six categories: the customer’s basic information, deposit and loan information, transfer information, transaction data, consumption data, and financial management methods. Among them, the ratio of the number of lost customers to the number of non-churn customers is approximately 2.5: 7.5, which demonstrates an obvious data imbalance.
In the experiment, logistic regression, naive Bayes, and decision trees are used to build the prediction model, which is used to compare with the inclusive financial customer churn prediction framework under the context awareness in this paper. The prediction results of the framework are evaluated from four aspects: accuracy, precision, recall and F-measure.
In the text, you should reference a table as such: For example, see Table 1.

Accuracy: the number of modules with correct classification results accounts for the proportion of all test cases. TP is a case (also known as a positive case) of has been correctly classified. FN is a case of a misclassification, but it mistakenly considered as a positive example. TN is a case (also called a negative case) that has been correctly classified. FP is an example that is misclassified, but it mistakenly considered as a negative example.
Precision: the proportion of the number of defective modules whose prediction results are consistent with the actual situation to the predicted defective modules.
Recall: the probability that it predicted as a defective module in the actual situation.
F-measure: the harmonic average of precision and recall.
AUC refers to the area at the lower right of the ROC curve. If Recall is used as the Y axis of the coordinate axis, TP/(TP + TN) is used as the X axis of the coordinate axis, and the prediction results of the prediction model on the prediction data set are reflected on this axis Connected in parallel to form a smooth curve, this curve is called ROC curve. The closer the ROC curve is to the upper left corner, the larger the AUC value, and the better the performance of the prediction model. The closer the ROC curve is to the lower right corner, the smaller the AUC value and the worse the performance of the prediction model.
4.3 Experimental Results and Analysis
In the experiment, logistic regression, naive Bayes, and decision trees are used to build the prediction model, which is used to compare with the inclusive financial customer churn prediction framework under the context awareness in this paper. The prediction results of the framework are evaluated from four aspects: accuracy, precision, recall and F-measure.
4.3.1 AUC Performance of Different Prediction Methods on NASA Data Set
Three types of methods in integrated learning, AdaBoostM1, Bagging, Random Subspace, Information Gain (IG), Chi-Square (CS), and ReliefF (RF), were selected to predict defects on some data sets on NASA. The base classifier of the three integrated learning methods selects the J48 classifier, IG, RF, and CS use C4.5 as the classifier, use 10-fold cross-validation, and select the AUC index as the performance measure. The AUC indicator can be seen from Fig. 5: From the perspective of mean (AVG), the performance of the contextual perception of the inclusive financial customer churn prediction framework is better than the classification effect of the above six methods; Look, the prediction framework proposed in this paper has advantages; from the perspective of prediction performance, the prediction framework also has advantages compared with the other six methods.

Figure 5: AUC performance of different prediction methods
4.3.2 Prediction Performance of Different Prediction Methods on Financial Customer Data Set
As seen from Table 2, the prediction framework of inclusive financial customer churn under contextual awareness has better prediction results. Comparing the data, it is found that the results of the prediction framework in this paper are relatively good in terms of accuracy, which are 0.1%, 0.33%, and 0.15% higher than the three algorithms, such as logistic regression. The precision rate represents the correct rate in the sample predicted for churn customers. The precision rate of the framework of this paper is the highest, indicating that in the sample set predicted to be churn customers, the proportion of the frame prediction is relatively higher. In terms of recall rate, the results of this framework are lower than those of the naive Bayes and decision tree algorithms, which indicates that the framework of this paper has a lower proportion of correct predictions in the actual loss sample set. In terms of accuracy, the framework of this paper also performs better than the other three algorithms, indicating that the framework of this paper predicts more churn samples and non-churn samples. In terms of the measurement value, the results of this framework are also better than those of the other three algorithms. The F-measure value is a weighted average of precision and recall. The precision of this framework is higher than other algorithms and the recall is lower than other algorithms. However, the F-measure value is the highest, and the test data have a serious category imbalance, which indicates that the comprehensive performance of the prediction framework in this paper is better.

After expanding the original data set by N times, the original minority class, the prediction framework of this paper, SVM, and neural network model are used for prediction and analysis. Fig.6 shows that the accuracy rate of the prediction framework in this paper is at a high level, and Fig.7 shows that the area under the curve (AUC) value of the prediction framework in this paper is the closest to 1 when the AUC value is 3 times the minority class, reaching the highest value. These data show that for the data set with an obvious imbalance, the prediction framework of this paper has high prediction accuracy. In the research of customer churn prediction, the problem of data imbalance affects the prediction accuracy, resulting in low accuracy and a small AUC value. The prediction framework of this paper balances the problem of the proportion of majority and minority samples so that high-risk factors existing in the data set can be found in time and limited-service resources can be concentrated to deal with such high-risk factors in time and effectively.

Figure 6: Accuracy values for the different models

Figure 7: AUC values for the different models
With the rapid development of the industry, the competition has become increasingly fierce, and the inclusive-finance services available to customers have got more and more diversified. As a result, an increasingly serious problem of customer churn has appeared. Starting from the related research of context-awareness technology, and to address the problem of dimensionality reduction and prediction generalization ability in feature selection as well as the imbalance in the data set itself, this study proposes a customer churn prediction framework based on context awareness. By introducing the contextual factors of customers’ environments into the forecasting method, it is possible to further explore the relationship among customers, their context and the characteristics of the predicted churning customers. The experimental results show that the framework has achieved the expected performance in predicting customers’ churns. There are still much to be further discussed and researched in this study. The next research will consider that the information related to inclusive-finance customers will change over time. In addition, when processing the current information, the cyclic neural network will involve the information that appeared before. Compared with the independent characteristics of different samples under artificial neural network, cyclic neural network pays more attention to mining the time series association between samples. Therefore, the future study will attempt to introduce the cyclic neural networks into the current customer churn prediction framework, to better solve the impact of time variables on prediction performance.
Funding Statement: This work was supported by Shandong social science planning and research project in 2021 (No. 21CPYJ40).
Conflicts of Interest: The authors declare that they have no conflicts of interest to report regarding the present study.
References
1. L. Baltrunas and F. Ricci, “Context-based splitting of item ratings in collaborative filtering,” in Proc. ACM Conf. on Recommender Systems RecSys, New York, NY, USA, pp. 23–25, 2009. [Google Scholar]
2. R. Giaffreda, A. Karmouch, A. Jonsson, A. M. Karlsson, M. I. Smirnov et al., “Wireless world research forum (WWRF) context-aware communication in ambient networks,” in LNCS. Berlin/Heidelberg: Computer Science, vol. 13479–3479, 2005. [Google Scholar]
3. S. François, H. Zedan and A. Cau, “The calculus of context-aware ambients,” Journal of Computer and System Sciences, vol. 77, no. 4, pp. 597–620, 2011. [Google Scholar]
4. W. Wang, Z. Qin and Y. Cao, “Context-awareness model based on process algebra,” Journal of Xian Jiaotong University, vol. 39, no. 10, pp. 1060–1063, 2005. [Google Scholar]
5. S. W. Wu, P. L. Wei and H. W. Zhong, “A process calculus for context-aware systems,” in IEEE Int. Conf. on Services Computing, IEEE Computer Society, 2013. [Google Scholar]
6. W. B. Yan, S. Q. Yang and S. T. Liu, “Multi-target tracking algorithm based on spatio-temporal context,” Computer Knowledge and Technology: Academic Edition, vol. 6Z, no. 1, pp. 207–210, 2019. [Google Scholar]
7. R. Milner, “Bigraphical reactive systems,” in Proc. of the 12th Int. Conf. on Concurrency Theory, Aalborg, Denmark, 2001. [Google Scholar]
8. L. Birkedal, D. Søren and E. Elsborg, “Bigraphical models of context-aware systems,” in European Joint Conf. on Foundations of Software Science & Computation Structures, Springer-Verlag, 2006. [Google Scholar]
9. K. Cheverst, K. Mitchell and N. Davies, “Design of an object model for a context sensitive tourist GUIDE,” Computers & Graphics, vol. 23, no. 6, pp. 883–891, 1999. [Google Scholar]
10. K. Henricksen, J. Indulska and A. Rakotonirainy, “Modeling context information in pervasive computing systems,” in Int. Conf. on Pervasive Computing, Berlin Heidelberg, Springer, 2002. [Google Scholar]
11. H. U. Bo, “Context-aware knowledge acquisition and reasoning based on description logic,” Computer Science, vol. 40, no. 4, pp. 199–203, 2013. [Google Scholar]
12. J. Mccarthy, “Notes on formalizing context,” in Int. Joint Conf. on Artifical Intelligence, Artificial Intelligence, Morgan Kaufmann Publishers Inc, 1993. [Google Scholar]
13. Y. G. Wang, Z. Zheng and Y. Li, “Word2Vec-ACV: Word vector generation model with OOV contextual meaning,” Journal of Computer Applications, vol. 6, no. 1, pp. 247–257, 2019. [Google Scholar]
14. C. Bettini, O. Brdiczka and K. Henricksen, “A survey of context modelling and reasoning techniques,” Pervasive and Mobile Computing, vol. 6, no. 2, pp. 161–180, 2010. [Google Scholar]
15. P. J. Lu, J. P. Chen and F. Yuan, “Target detection algorithm based on context and multi-scale information fusion,” Computer Science, vol. S1, no. 1, pp. 281–282, 2019. [Google Scholar]
16. J. R. You, Y. Sha and Q. Liang, “Variation word reduction method based on effective context information,” Journal of Computer Applications, vol. 7, no. 1, pp. 719–753, 2019. [Google Scholar]
17. Y. N. Xu, X. Y. Liu and F. Fan, “Construction of telecommunications customer churn early warning model,” China Science and Technology Information, vol. 1, no. 1, pp. 77–112, 2012. [Google Scholar]
18. X. J. Jiang and Y. N. Guo, “Telecommunications customer churn prediction analysis based on improved clustering,” Journal of Taiyuan University of Technology, vol. 45, no. 4, pp. 532–536, 2014. [Google Scholar]
19. B. Schilit, N. Adams and R. Want, “Context-aware computing applications,” in Workshop on Mobile Computing Systems & Applications (WMCSA), Santa Cruz, California, USA, pp. 85–90, 1994. [Google Scholar]
20. A. K. Dey, “Providing architectural support for building context-aware applications,” Georgia Institute of Technology, pp. 127–154, 2000. [Google Scholar]
21. X. M. Ke, J. Chen and G. H. Luo, “An improved recommendation algorithm based on interest similarity,” Computer Engineering, vol. 46, no. 8, pp. 7, 2020. [Google Scholar]
22. L. Y. Hao and J. Wang, “Collaborative filtering TopN recommendation algorithm based on project popularity,” Computer Engineering and Design 10:145–149, 2013. [Google Scholar]
23. Z. Jia, Y. Yang, W. Gao, et al. “User-based collaborative filtering for tourist attraction recommendations,” in IEEE Int. Conf. on Computational Intelligence and Communication Technology, Piscataway, NJ, IEEE, pp. 22–25, 2015. [Google Scholar]
24. P. Pirasteh, J. J. Jung and D. Hwang, “Item-based collaborative filtering with attribute correlation: A case study on movie recommendation,” in Asian Conf. on Intelligent Information and Database Systems, Cham, Springer, 2014. [Google Scholar]
25. Q. Q. Liu, Y. L. Luo, Y. F. Wang, X. Y. Zheng and W. Chen, “Hybrid recommendation algorithm based on SVD filling,” Computer Science, vol. 46, no. 6, pp. 5, 2019. [Google Scholar]
26. B. Bordel, R. Alcarria, D. Martín and Á. Sánchez-Picot, “Trust provision in the internet of things using transversal blockchain networks,” Intelligent Automation & Soft Computing, vol. 25, no. 1, pp. 155–170, 2019. [Google Scholar]
27. B. L. Nguyen, E. L. Lydia, M. Elhoseny, I. V. Pustokhina, A. D. Pustokhin et al., “Privacy preserving blockchain technique to achieve secure and reliable sharing of IoT data,” Computers, Materials & Continua, vol. 65, no. 1, pp. 87–107, 2020. [Google Scholar]
28. C. T. Li, Y. S. Xu, J. H. Tang and W. J. Liu, “Quantum blockchain: A decentralized, encrypted and distributed database based on quantum mechanics,” Journal of Quantum Computing, vol. 1, no. 2, pp. 49–63, 2019. [Google Scholar]
29. G. Sun, S. Bin, M. Jiang, N. Cao, Z. Zheng et al., “Research on public opinion propagation model in social network based on blockchain,” Computers Materials & Continua, vol. 60, no. 3, pp. 1015–1027, 2019. [Google Scholar]
30. J. Liu, X. Sun and K. Song, “A food traceability framework based on permissioned blockchain,” Journal of Cyber Security, vol. 2, no. 2, pp. 107–113, 2020. [Google Scholar]
Cite This Article
 Copyright © 2023 The Author(s). Published by Tech Science Press.
This work is licensed under a Creative Commons Attribution 4.0 International License , which permits unrestricted use, distribution, and reproduction in any medium, provided the original work is properly cited.
 Downloads
 Citation Tools