
 Submit a Paper
 Propose a Special lssue
 Open Access
ARTICLE

Performance Evaluation of Topologies for Multi-Domain Software-Defined Networking
1 School of Computer Science and Technology, Hainan University, Haikou, 570100, China
2 School of Cyberspace Security, Hainan University, Haikou, 570100, China
3 School of Software, Beijing Jiaotong University, Beijing, 10004, China
4 University of British Columbia, Vancouver, V5K1K5, Canada
* Corresponding Author: Deshun Li. Email:
Computer Systems Science and Engineering 2023, 47(1), 741-755. https://doi.org/10.32604/csse.2023.031531
Received 20 April 2022; Accepted 20 June 2022; Issue published 26 May 2023
 View Full Text
 Download PDF
Abstract
Software-defined networking (SDN) is widely used in multiple types of data center networks, and these distributed data center networks can be integrated into a multi-domain SDN by utilizing multiple controllers. However, the network topology of each control domain of SDN will affect the performance of the multi-domain network, so performance evaluation is required before the deployment of the multi-domain SDN. Besides, there is a high cost to build real multi-domain SDN networks with different topologies, so it is necessary to use simulation testing methods to evaluate the topological performance of the multi-domain SDN network. As there is a lack of existing methods to construct a multi-domain SDN simulation network for the tool to evaluate the topological performance automatically, this paper proposes an automated multi-domain SDN topology performance evaluation framework, which supports multiple types of SDN network topologies in cooperating to construct a multi-domain SDN network. The framework integrates existing single-domain SDN simulation tools with network performance testing tools to realize automated performance evaluation of multi-domain SDN network topologies. We designed and implemented a Mininet-based simulation tool that can connect multiple controllers and run user-specified topologies in multiple SDN control domains to build and test multi-domain SDN networks faster. Then, we used the tool to perform performance tests on various data center network topologies in single-domain and multi-domain SDN simulation environments. Test results show that Space Shuffle has the most stable performance in a single-domain environment, and Fat-tree has the best performance in a multi-domain environment. Also, this tool has the characteristics of simplicity and stability, which can meet the needs of multi-domain SDN topology performance evaluation.Keywords
Software-defined networking (SDN) [1], a kind of network technology, separates the control plane and forwarding plane, and effectively enhances the flexibility of the network by providing an open programmable Systems Network Architecture (SNA) [2]. SDN accelerates the expansion of the network scale and the increase of users. However, the performance of a network composed of a single SDN controller can no longer serve the purpose. Therefore, multi-domain SDN [3], where controllers connect and interact in a certain way while each controller controls its management domain, is valued academically and economically, as shown in Fig. 1.
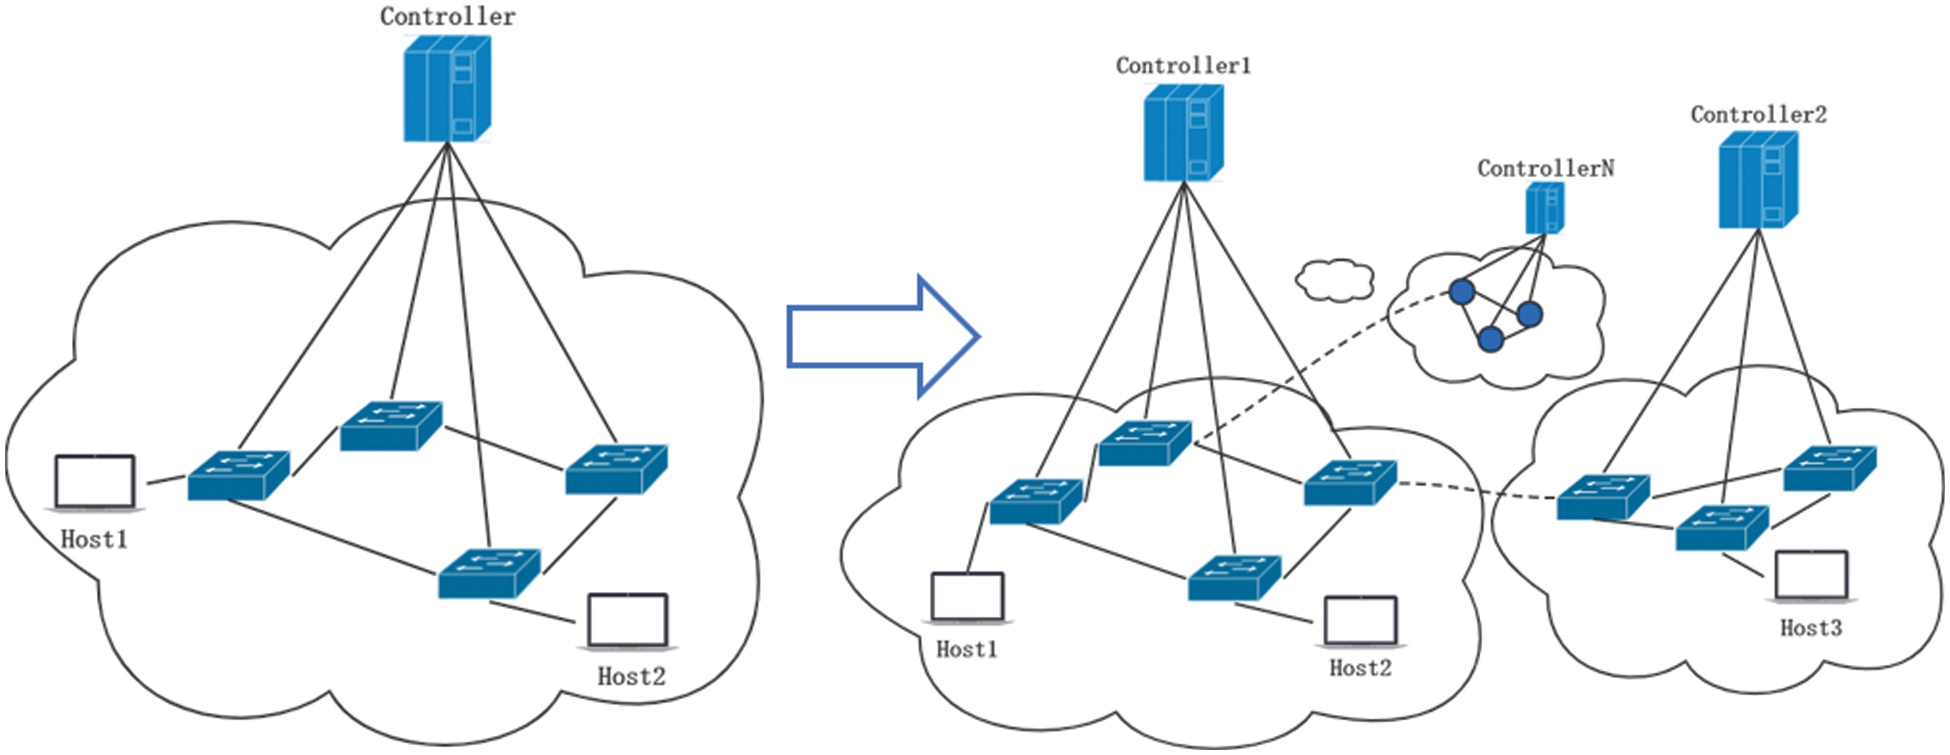
Figure 1: Single-domain SDN to multi-domain SDN
Due to the widespread use of new technologies such as Cloud Computing, Big Data, and the Internet of Things [4], the centralized data center network architecture is unable to meet the needs of the new era of business. While, the distributed data center network architecture provides a solution with much safer data storage, faster transmission service, and lower transaction costs. For example, today, when the novel coronavirus is rampant [5], the SDN-based data center can provide more demanding medical computing [6].
The network topology used in a multi-domain SDN network can affect the performance of the data center network, so sufficient testing and evaluation work are required before deployment. To build a real large-scale topology, a large amount of network equipment is required to test the actual deployment of the SDN network. Multiple deployments of different topologies are required, but it is too expensive. Therefore, a simulation test is required.
In the past, network testing required users to do a lot of programming to build an emulation network with a custom topology. Creating a large-scale network was a very cumbersome process and prone to human error. Therefore, a method that can automatically build, test, and evaluate the emulation network is needed.
This paper proposes a framework that provides users with multiple data center network topologies and integrates network simulation tools with network performance testing tools. Users are free to choose parameters such as topology type and network scale. The framework can generate the corresponding topology and run it by invoking simulation tools fast. After that, the framework can automatically test and evaluate the topology performance.
Mininet is an emulator for deploying large networks on the limited resources of a simple single computer or virtual machine. Many SDN-related researchers have applied Mininet as a simulation tool [7,8]. Using the framework of this article, we designed and implemented a Mininet-based simulation tool. This tool can build multiple network control domains according to users’ needs, run the network topology selected by the user for each control domain, and connect different controllers respectively to achieve a multi-domain SDN simulation environment. After that, the tool can test the network performance and evaluate the overall performance of the network topology based on parameters such as network transmission hops, bandwidth, and latency.
We used the tools implemented in this paper to conduct experiments, and respectively tested the performance under single-domain and multi-domain conditions of four experimental topologies: fat-Tree, Space Shuffle, small-world Ring, and Small-World 2DTor. According to the test results, in a single-domain environment, Small-World has the best performance in small-scale networks, but the performance will decline sharply when the network scale expands. Space Shuffle has relatively stable and excellent performance. Fat-tree performs best in a multi-domain environment.
The contributions of this paper are as follows:
• This paper proposes a framework that integrates various simulation tools with test tools to evaluate network topology performance. This framework focuses on multi-domain SDN, and as far as we know, it is the first performance evaluation framework for multi-domain SDN topology.
• According to the framework of this paper, we have implemented a simulation tool, which can configure various parameters of network equipment according to the needs of users. After configuration, the tool can quickly build a multi-domain SDN simulation environment and carry out automatic performance evaluation and testing.
• We use the tools in this paper to test and evaluate various topologies and the performance of several topologies in single-domain/multi-domain environments respectively.
The structure of this paper is as follows: The second section introduces some related work. In Section 3, the performance evaluation framework proposed in this paper is described. Section 4 describes the tools we completed. The fifth section conducts performance tests on some network topologies in single-domain and multi-domain SDN environments. The sixth section summarizes research results and expresses future expectations.
2.1 Optimization of Emulation Tools
Pal et al. [9] proposed a framework to simplify the steps of custom topology generation using Mininet. The user used the prescribed grammar to write the topology content into the text. Then the framework read the text content to generate the corresponding Mininet imperative statement for the topology. The user just needed to enter simple grammar instead of writing a script. Nandi [10] proposed two topology generators, one was to use a Network tool to generate random topology, and the other was to build topology by calling the SNAP (Stanford Network Analysis Project) format data set.
Their research simplified the process of Mininet building network topology, but they all have certain flaws. For example, the framework of Chandan Pal et al. required users to input text commands to convert to the needed topology, which took time. Still, human error may occur, and the readability of the text was poor. The random topology in the research of Sunit Kumar Nandi et al. was completely random and did not represent the real environment. Besides, the two frameworks were both not well applied to multi-domain SDN. It requires additional steps to remove meaningless disconnected parts and improve the flexibility of calling the SNAP data set.
2.2 Design and Test for Data Center Topology
Al-Fares et al. [11] proposed the Fat-tree data center topology to deal with the traditional data center’s problems of low line utilization and high cost. Fat-tree can be constructed using commodity switches and can provide multiple equal paths between any pair of servers. It achieved several advantages: high line and bandwidth utilization, affordable and easy replacement of components. Space Shuffle (S2) [12] topology is a data center network topology proposed by Ye Yu and Chen Qian. S2 allocated a set of virtual coordinates to each switch and connects them in multiple virtual spaces according to the corresponding coordinates to form a ring topology. The switch was connected to the left and right adjacent switches to achieve the advantages of high bandwidth, low latency, and flexible modification. Shin et al. [13] and Koibuchi et al. [14] also proposed a variety of data center network topologies with randomness, which were achieved by adding random links to classic topologies (such as rings, cubes, etc.). This greatly reduced the diameter and the average shortest path length of the network, realizing a lower latency.
Their research has optimized the data center network topology and tested its performance in traditional networks through experiments, but they have not tested or evaluated its topology in the SDN environment.
López et al. [15] conducted a logic circuit-based method for testing SDN switches. They regarded the switch as a forwarding device with a set of configured rules, which could be modeled and analyzed as a “stateless” system. They used appropriate logic circuits or networks to emulate switch behavior. This method of testing was theoretical and abstract, not practical. Jiang et al. [16] proposed another test framework for switches, which used the advantages of Central Processing Unit (CPU) and Field Programmable Gate Array (FPGA) co-design, providing flexible Application Programming Interfaces (APIs) and accurate timestamps for testing the protocol correctness and performance of SDN switch prototypes. Their work could test the correctness and performance of SDN switches, but they just targeted SDN switches, without focusing on the entire network.
Jawaharan et al. [17] used Mininet, Cbench, and Wireshark packet capture tools to analyze the performance of three controllers (ONOS, OpenMUL, and POX). After comparison, they proposed a new performance index: topology discovery time. Arahunashi et al. [18] also followed up their work and compared the performance of various SDN controllers (such as Ryu, OpenDayLight, Floodlight, and ONOS controllers). For different numbers of connections, three different topologies were used to analyze the performance (average latency and throughput) of these controllers. Mamushiane et al. [19] evaluated and compared the performance of various controllers. Their test focused on the comparison of controller performance, but the evaluation of topology performance was not in-depth enough.
Existing works are dedicated to topology design, topology performance test evaluation in traditional data center networks, SDN controller performance tests, SDN switch tests, and studies on multi-domain SDN methods [20,21]. In their research, they did not study the performance of the data center network or topology in the SDN environment. In contrast, this paper digs into the subject and finds that in the simulation network environment of SDN, the performance of different topologies varies from each other. Details are given in Section 4 of this paper.
3 Performance Evaluation Framework
Considering the shortcomings of the existing multi-domain SDN testing research, this paper proposes a performance evaluation framework, which can realize faster construction of simulation network environment with more effective test and evaluation performance.
Fig. 2 shows the overall architecture of the framework. The frame has a three-tier structure.
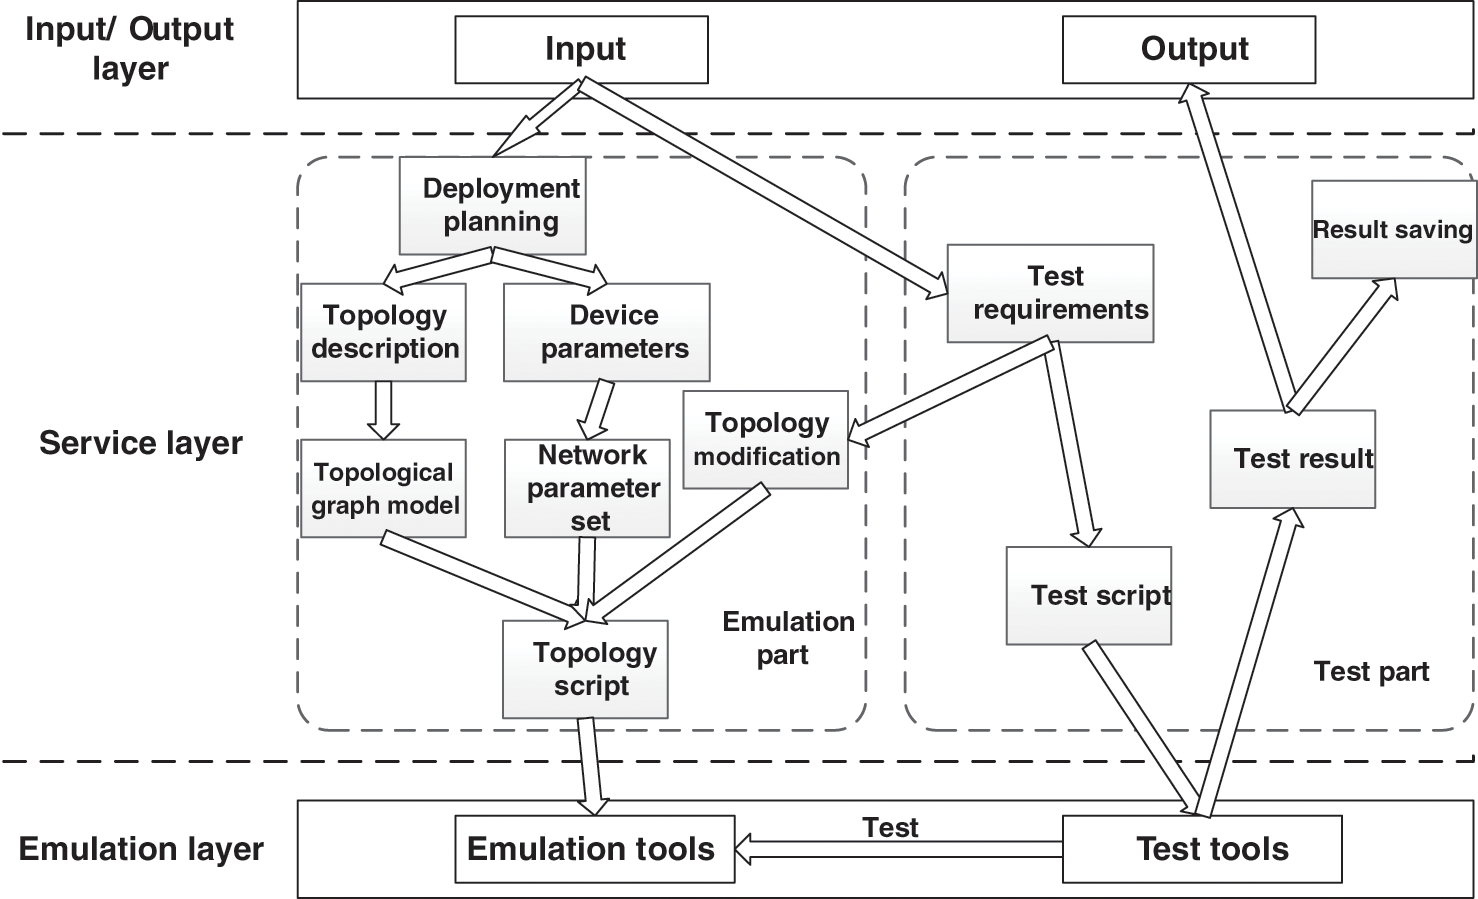
Figure 2: Overall architecture of the framework
The first layer is the input layer, which uses input and output interfaces to provide users with functions for operating and monitoring experiments.
The second layer is the service layer, which is mainly divided into two parts: the test bed generation part and the test evaluation part. The testbed generation part aims to help users efficiently build the required network simulation environment, and realize functions related to topology calculation and network simulation. The test evaluation part realizes the test evaluation of the network, mainly some test functions of the network and data analysis of the test results.
The third layer is the simulation layer, which is composed of two tools, running framework integrated network simulation tools (such as Mininet, OVS, Kathará, etc.) and network performance testing tools (Iperf, Qperf, Netperf, etc.). It is used to realize the simulation and testing work required by users.
The testbed generation part is designed to help users build the simulation network needed for test evaluation, and transform the topology description into the corresponding SDN emulation network through the network emulation tool integrated with the framework.
The framework provides a variety of data center networks. The user enters the type of network topology and the network scale (number of switches, number of hosts, links, etc.), then the framework will automatically calculate the topology map structure according to the corresponding topology generation method, and the user can continue to configure attributes for the network node links (nodes and links). After that, the framework generates the topology script supported by the simulation tool and calls the simulation tool to run. In this way, the multi-domain SDN network required by the user is completed.
After the simulation network is constructed, users can choose to modify the configuration of the network environment to match the requirements of the test much more accurately. Then you can enter the test evaluation part to test the network performance, and the network can be modified at the appropriate time during the test. In this way, the cost of repeatedly building a network can be reduced in repeated experiments with few variables.
In the testbed generation module, the user can input the topology information that needs to be created through the input page, such as the number of control domains, the topology type of each domain, link information, etc. After the topology requirements are entered, the Mininet, OVS, and other simulation tools are called through our framework to generate the corresponding network topology, and the required SDN controller is connected to realize the construction of the simulation network. The user can choose whether to modify the configuration of the simulation network when appropriate.
The test evaluation part performs automated test work for the generated simulation network. The framework receives the user’s test requirements, generates a test script, and then calls the corresponding test tool to perform the simulation test. Equations in display format are separated from the paragraphs of the text.
After building the simulation network, the framework automatically calculates the path length between all host pairs in the network and calculates the average value. In an SDN network, the path of traffic is determined by the controller default or the routing algorithm assigned to the controller by the upper application. Due to the wide variety of SDN controllers and applications, the routing algorithms are different (Random Walk, Shortest Path, etc.) [22]. The framework supports the use of various routing algorithms to calculate the average path length of the topology. In theory, a topology with a shorter average path length will have lower latency.
The framework integrates a variety of network performance test tools (such as Iperf, Netperf, Qperf, etc.) for users, and the test functions they can achieve are different, such as the type of test traffic (TCP, UDP, etc.), data packet size, and test time, Cycle test, etc. They can test various performance indicators such as network delay, bandwidth, jitter, and packet loss rate. The most important indicators are network delay [23] and bandwidth [24]. Network delay represents the time required for the data stream to be transmitted from the source node to the destination node and is positively correlated with the transmission distance. Bandwidth represents the total amount of data that the link can transmit in a unit of time (usually 1 s) and reflects the ability of this link to transmit data.
After the framework has completed the network test, it can also save the test results as a file for users to refer to. It’s able to process and calculate the test results, such as average, variance, standard deviation, etc., and then output the test results to the user.
Using the framework of this article, we have implemented a simulation tool Mperf, which is implemented in Python (V3.6), and the overall architecture diagram is shown in Fig. 3. Mperf uses CLI as the input and output interface, and the core is the manager. It is responsible for transforming topology description and test description. The topology generator implements topology scripts and calls Mininet and Quagga for network simulation. The tester generates a test script according to the test description and tests the network through the Qperf/Iperf tool. The structure diagram of Mperf is shown in Fig. 3.
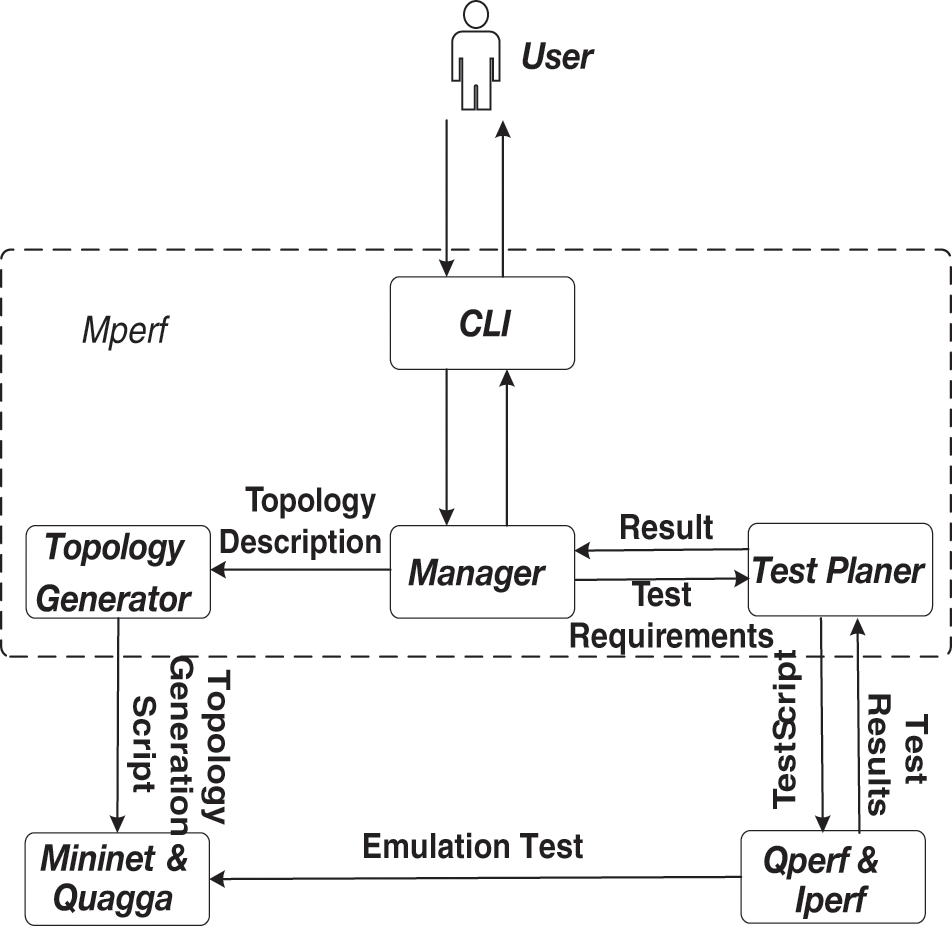
Figure 3: Structure diagram of Mperf
Mperf uses the command-line interface to operate and monitor the test and evaluation process. Mperf is for testers. The command-line interface can meet the needs of input and output, and save the resources of the computer system.
The manager is the main component of Mperf, responsible for maintaining and managing the simulation network and managing test requirements.
The topology generator receives the topology description transmitted by the manager, parses it into a graphic structure, converts it into a corresponding topology script, and calls Mininet to build a simulation environment.
The test planer receives the test requirements from the manager, generates test scripts, and calls the test tool Qperf/Iperf for testing. The tester can calculate the shortest path length between each pair of hosts.
We integrated Mininet as the realization of network simulation. Mininet is now the most commonly used lightweight simulation tool that supports SDN networks. It supports the OpenFlow protocol and can well adapt to the simulation and test work we need.
Run Quagga software routing between each single-domain topology instance, and support the use of OSPF, BGP, and other protocols. We will use Quagga routing to transmit cross-domain traffic between SDN domains.
As for the testing tools, Qperf and Iperf are selected, which are the most commonly used network performance testing tools.
Next, we will introduce the important components and their interaction in detail.
Mperf allows users to input the required network configuration to realize network simulation and test evaluation. Users need to declare the following configurations: number of simulated SDN network domains, the type of network topology and network scale (such as the number of switches, hosts, and links) used by each domain, the Interzone protocol, default node configuration (bandwidth and frequency) and link configuration (bandwidth, delay, and packet loss rate). If a node or link is different from the default configuration, set it separately.
After the topology description (such as the number of SDN domains, topology types, etc.) passed from the CLI interface is verified as legal input by the manager, the topology generator converts it into a simulated network, and the topology generator performs the following operations:
• According to the topology type and network scale selected by the user for each domain, use the corresponding topology generation algorithm to calculate the corresponding topology graph G = (V, E), G includes the node set V and the link set E.
• Set up one or more Quagga routes for each domain, and inter-domain communication needs to be forwarded by Quagga routers.
• Connect multiple SDN domains through Quagga routing, and configure different network segments for each domain.
• Set the link according to the bandwidth, delay, packet loss rate, and other parameters set by the user, and generate the topology script.
• If the user chooses to run, the generator will run the topology script to build a simulated network on Mininet.
After the simulation network is set up, you can choose to enter the CLI interface of Mperf or the CLI interface of Mininet. If you choose the Mperf interface, the user can use Mperf to test the simulation network. The user can choose a combination of multiple test functions, which is verified by the manager, The test planer uses various test tools to implement the user’s test requirements. First, the test planer will convert test requirements into test plans based on the user’s input. Second, he will generate a test script based on the test scheme. Then, the test planer will run the test script, invoke the network performance test tool, save and output the test result. If you need to modify the topology again, call the topology generator to modify the topology and return to the first step.
Experiments have proved that the emulation network realized by this tool has no obvious performance difference from the emulation network realized by Mininet’s own topology generation method. However, this framework is time-saving and less prone to error. The automated test function implemented by this tool has completed the topology performance evaluation in multi-domain SDN well. The automatic test function realized by this tool has well completed the topology performance evaluation in multi-domain SDN.
Experimental environment: The test work in this article uses i7-9750H 2.60 GHz, memory 16G, windows 10 system runs Ubuntu18.04 virtual machine, virtual machine allocates 10G memory, test tools are all running on ubuntu18.04 virtual machine.
The tool implemented in this paper can build and run a variety of customized network topologies. Each topology is connected to a controller, which can be regarded as an autonomous region. Quagga software is used to connect multiple SDN autonomous regions to form a multi-domain network environment, simulating the network conditions of distributed data centers. An example of multi-domain SDN for experimental use is shown in Fig. 4.
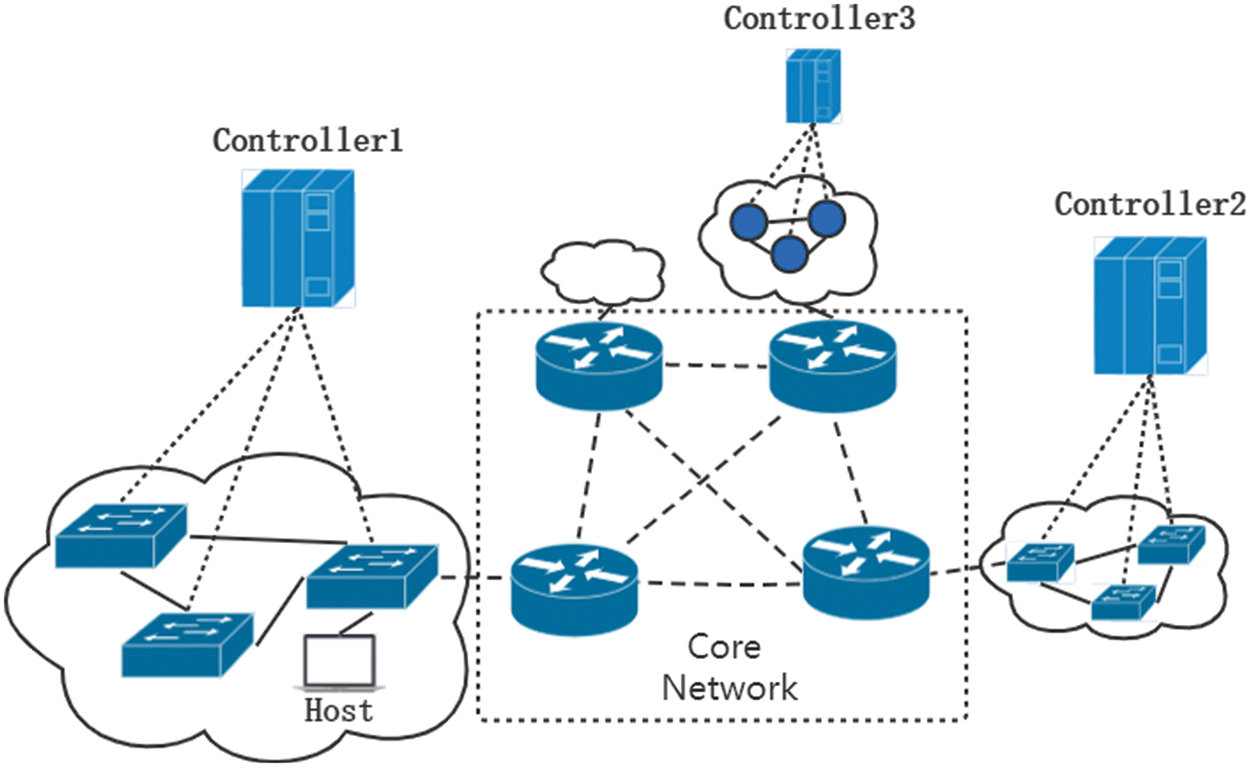
Figure 4: Muti-domain network environment
Fig. 4 is a simplified schematic diagram of the multi-domain SDN network we have implemented. The entire network is composed of several SDN domains and core networks. Several controllers manage the SDN switches in their control domains. All hosts connected to the SDN switches can be discovered by the controller. In this way, we get multiple SDN control domains and set the host IPs in the same domain to the same network segment, so that the transmission within the domain can be managed by the controller.
For inter-domain communication, we use Quagga software routing to emulate real inter-domain routing. As shown in Fig. 4, each domain has a Quagga route directly connected, and routes can be connected in pairs (Support the use of OSPF [24], BGP [25], and other protocols). After the deployment is completed, it only takes tens of seconds for the Quagga router to realize automatic routing updates, so that cross-domain transmission can be realized.
The edge of each domain is connected to a Quagga route. A simplified example of the boundary is shown in Fig. 5:
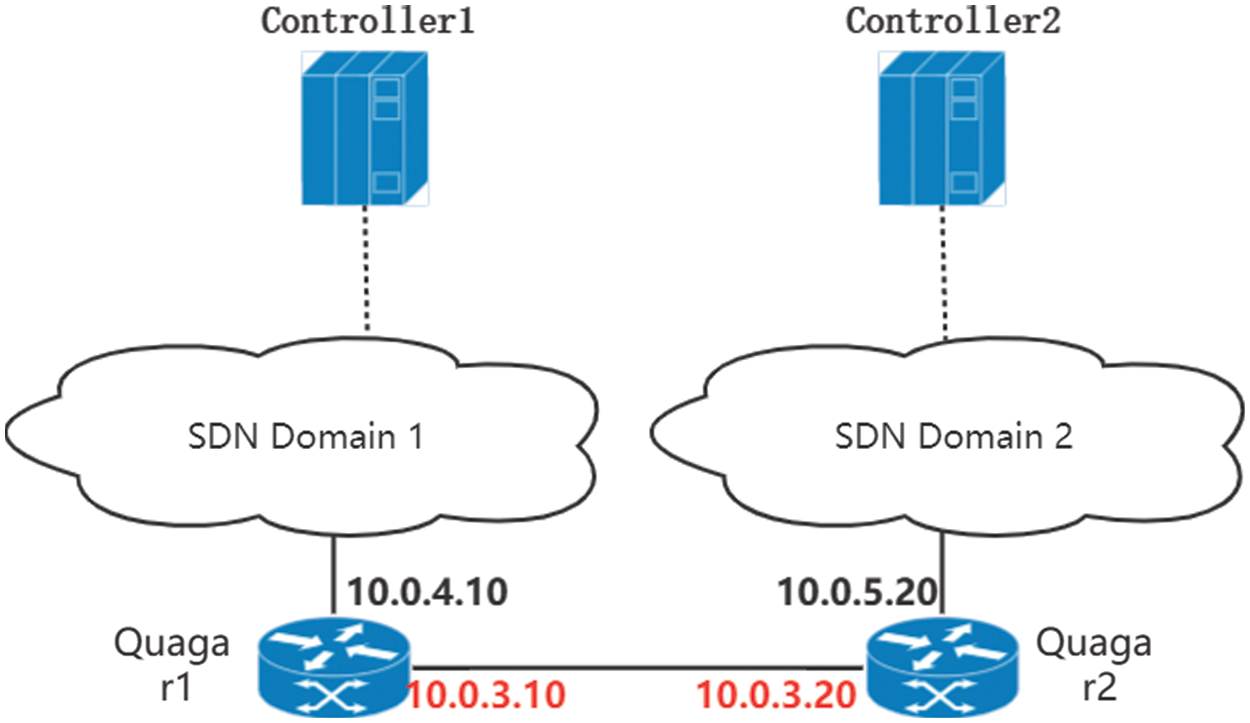
Figure 5: Multi-domain configuration
As shown in Fig. 5, Controller1 and Controller2 manage one or more SDN switches (for clarity, the details are not shown in this figure). They connect to hosts with IP addresses in different network segments. If Host1 connects to S1 of Controller1 (they are in SDN domain 1), its IP address is set to 10.0.4.100 and its subnet mask is 255.255.255.0. Accordingly, Host2 is in SDN domain 2, and the IP address is set to 10.0.5.100. The hosts in a single domain are on the same network segment, and each management domain is a subnet.
Each of our subnets has a Quagga routing connection. One port IP of r1 is set to 10.0.4.10 in the same network segment as Host3, and the other port is set to 10.0.3.10 in the “core network” segment connected to r2. Similarly, r2 operates accordingly. Through the BGP protocol, all Quagga routes can update routing information to forward cross-domain traffic.
In the multi-domain SDN network established by us, when Host1 in SDN domain 1 and Host2 in SDN domain 2 interact for the first time, the traffic of Host1 is first transmitted to S1, which is directly connected to it. Since there is no relevant flow table matching in S1, packet-in messages need to be sent to the controller. After receiving the packet-in message, the controller determines that the destination IP address is not in the control domain. Therefore, the controller sends the packet-out message to the related switch in the control domain, so that the traffic is forwarded to route R1. R1 forwards the traffic to R2 connected to the subnet where H2 resides according to BGP, and R2 forwards the traffic to the switch in control domain 2. Controller 2 controls the traffic and forwards it to Host2. In this way, two hosts in different SDN domains communicate.
In our experiment, we set the latency of each link to 1 ms, and use the Qperf tool to test the bandwidth and latency between all host pairs in the topology. Details of the experiment and statistical data are shown below.
With the tool of this research, we can build the required test environment faster. We have prepared a network emulation environment for several data center topologies under multiple network scales and randomly selected host pairs in the network for latency and bandwidth tests. Different from the research of Islam et al. [25], this paper pays more attention to the overall performance evaluation of the network. After repeating the test several times, the test results are as follows.
Fig. 6 shows the network performance of the four topologies in the SDN network environment we built under different numbers of switches. Generally speaking, the average network latency varies on the average number of hops between hosts. Other performance will be affected by changes in various conditions such as topology type, switch/host ratio, switch port number, link number, etc. We have analyzed the performance differences of several topologies and possible causes in the following comparison chart.
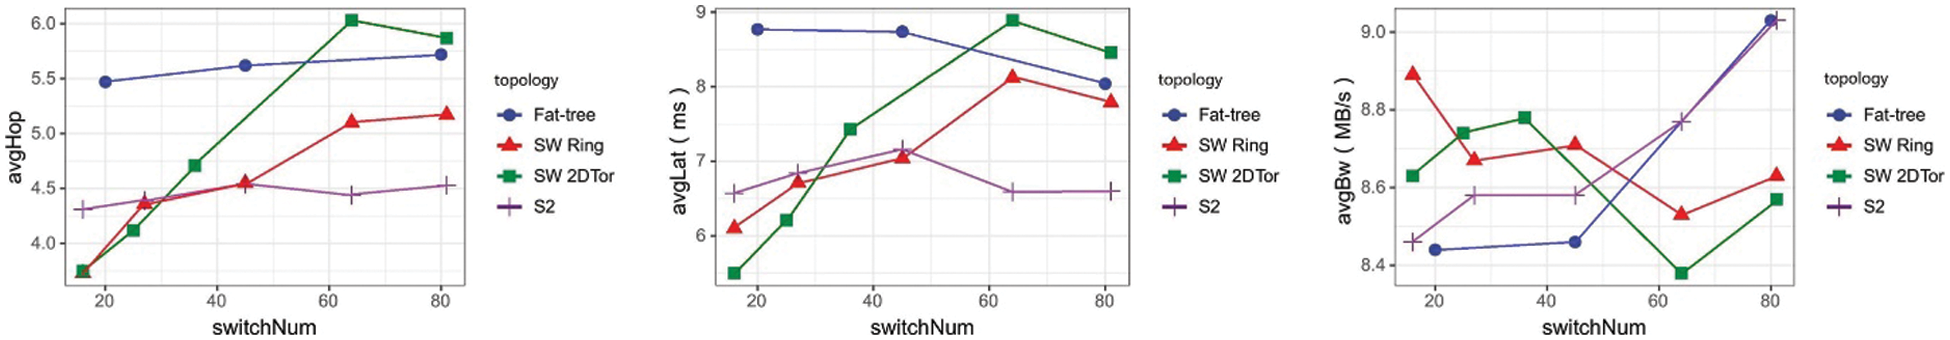
Figure 6: Performance of topologies with different switches
We divide the experiment into several groups according to the number of hosts carried in the network.
1) The comparison of the four topologies under the scale of 16 hosts is shown in Fig. 7: It can be seen that the average number of hops between servers of Small-World Ring and Small-World 2DTor is much lower than that of the other topologies. According to the description of A Case for Random Shortcut Topologies for HPC Interconnects, the number of ports used by each switch in Small-World is 6, which is larger than Fat-tree and S2, so the bandwidth performance and latency performance of Small-World Ring and Small-World 2DTor have great advantages. We compare Fat-tree and Space Shuffle with the same number of ports. Space Shuffle uses fewer switches, which has lower latency and close bandwidth compared to Fat-tree.
2) The comparison of the four topologies under the scale of 54 hosts is shown in Fig. 7. At this time, the switches of the four topologies all take 6 ports. Small-World Ring (27 switches), Small-World 2DTor (36 switches), and Space Shuffle (27 switches) have achieved higher performance than Fat-tree while being able to use fewer switch costs. Meanwhile, when Small-World Ring and Space Shuffle uses the same number of 45 switches as Fat-tree, the latency performance is reduced to a certain extent (Small-Word Ring: 4.9%, Space Shuffle: 4.7%), but it is still higher than Fat-tree, and the bandwidth performance has increased or remained stable.
3) Fig. 7 shows the comparison of the four topologies when the number of hosts is 54. At this time, the switches of the four topologies use 6 ports. Small-World Ring, Small-World 2DTor, and Space Shuffle can use fewer ports in the case of switch cost, maintaining higher performance than Fat-tree.
4) Combining the experiment and the description in [9], adding random edges to the basic topology can effectively improve the latency and bandwidth performance of the topology. We conduct further experiments to increase the number of switch ports in the two topologies of Small-World, not only the 6 ports mentioned in the paper but the same number of ports as Fat-tree and Space Shuffle, which are more ports than before. We establish a random connection between the switches and perform the same experiment as the previous article.
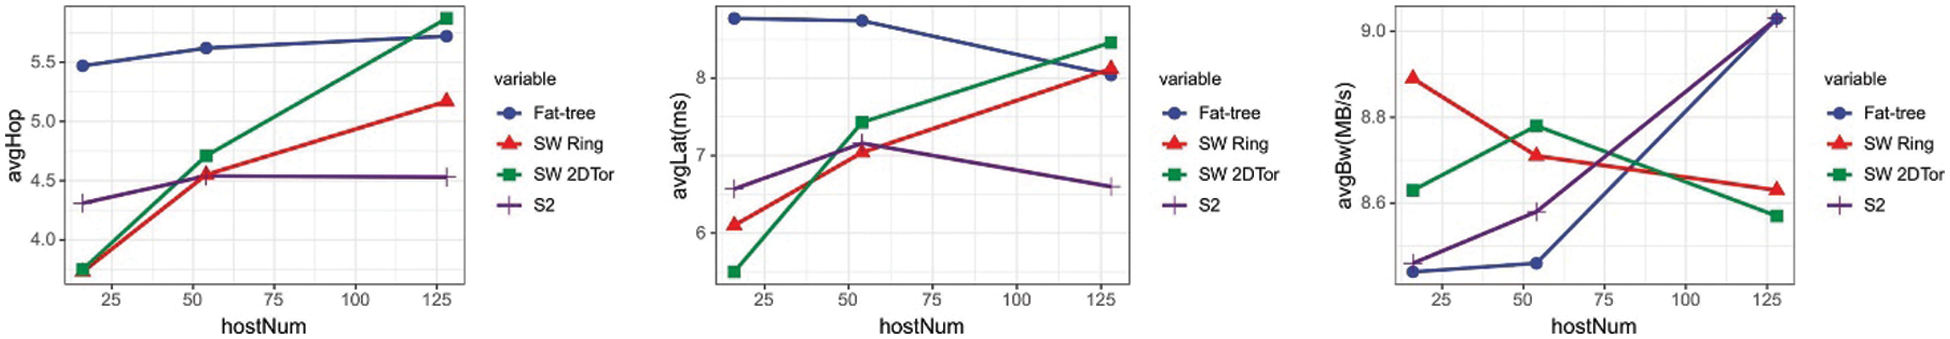
Figure 7: Performance of topologies with different switches
From the experimental result Fig. 8, after adding two ports to all switches and adding random links between the added ports, it can be seen that in the two topologies of Small-World-Ring and Small-World 2DTor, the overall performance of the network has been improved. The latency performance exceeds Fat-tree and is similar to Space Shuffle.
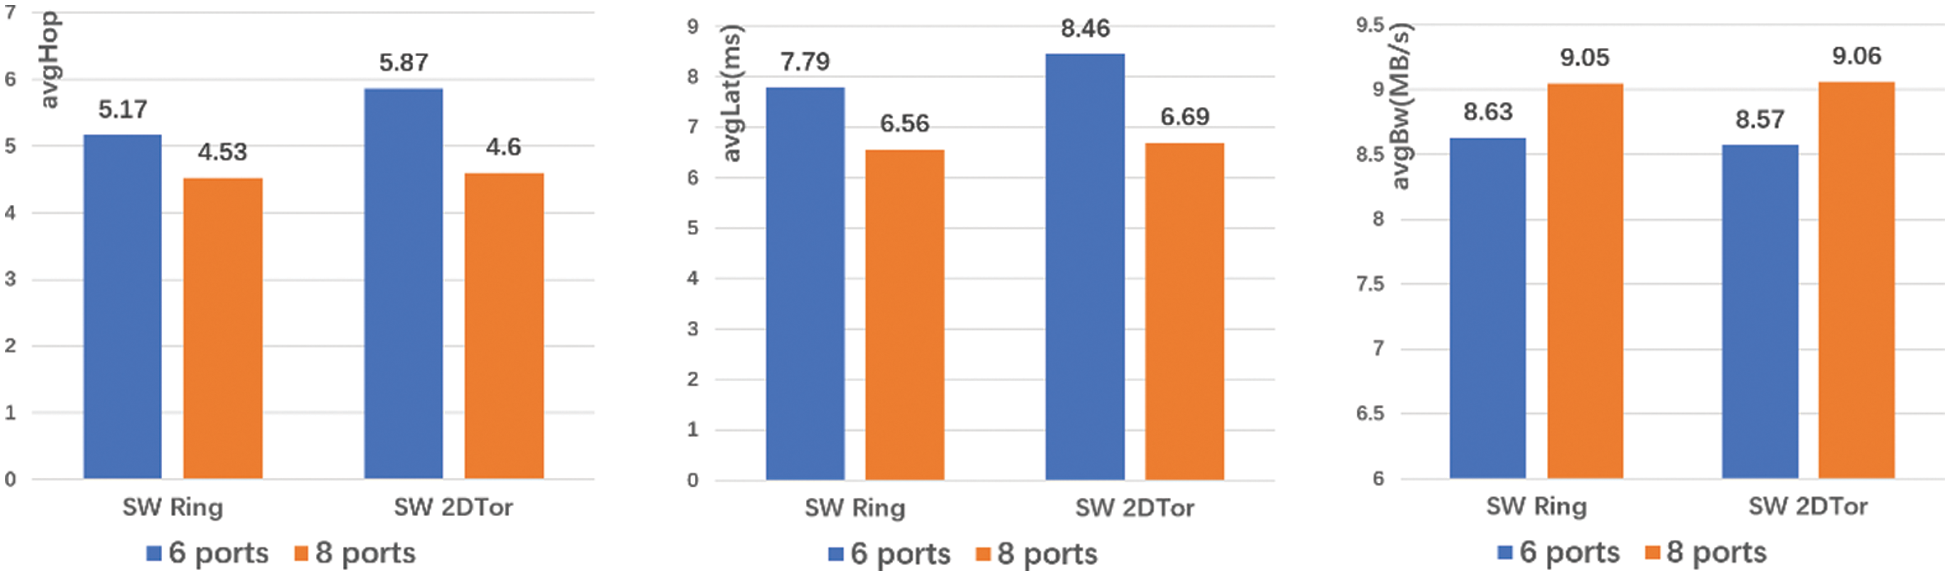
Figure 8: Performance of topologies with different switches
It can be seen that in the case of a single domain, Small-World Ring and Small-World 2DTor topologies have advantages in latency and bandwidth performance in small-scale networks, but the performance decreases significantly when the network scale expands. Space Shuffle has the best bandwidth and latency performance in medium and large-scale networks.
We divided the multi-domain SDN test into two groups--using only one topology and mixing two different topologies, and tested the network performance under the network scale of 128 hosts and 81 switches (The number of switches in the fat tree is 80) in each domain. The specific test results are as follows:
5.3.1 Single Topology Multi-Domain Test
We set each domain to the same topology and set the number of autonomous domains to 4. In the multi-domain test, the cross-domain traffic latency and bandwidth are tested to compare the performance of each topology in the case of multi-domain SDN.
The multi-domain test results of a single topology are shown in Fig. 9. It can be seen that the average cross-domain bandwidth of several topologies has little difference, but things are different in latency. Fat-tree has the lowest latency, Space Shuffle, and Small-World Ring and Small-World 2DTor increase in order.
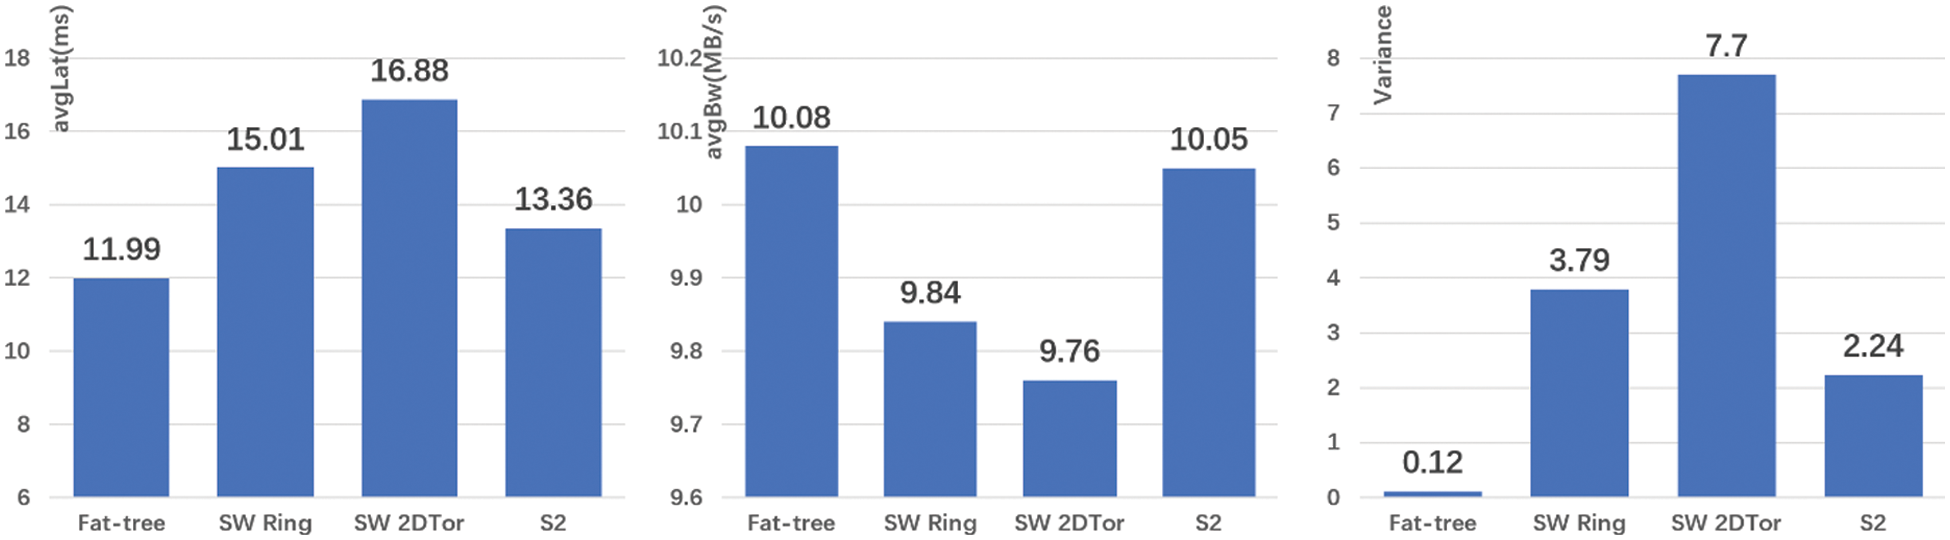
Figure 9: Single topology multi-domain test result diagram
We tallied the results of each latency test and calculated the variance of all latency test results. The specific results are shown in Fig. 9. Due to Fat Tree’s special topological nature, when we connect cross-domain routing to the core switch, the number of hops for any host connected to this switch is 3, so Fat-tree’s cross-domain latency performance is extremely stable. In other topologies, the hosts are evenly connected to all switches, causing the distance between the host and the cross-domain switch to be far or short, so the latency test results are relatively discrete. It can be considered that Fat-tree has the best performance in cross-domain transmission.
5.3.2 Hybrid Topology Multi-Domain Test
We also conducted two kinds of topological mixing multi-domain tests, choosing two from several kinds of topology, each topology has two domains. The result of the experiment is shown in Fig. 10. You can see their cross-domain bandwidth performance has little difference, while latency performance has a bigger difference, within which latency performance of Fat-tree&S2 is the lowest. But their average latency is close to the average of the single-type multi-domain networks that make up the two topologies.
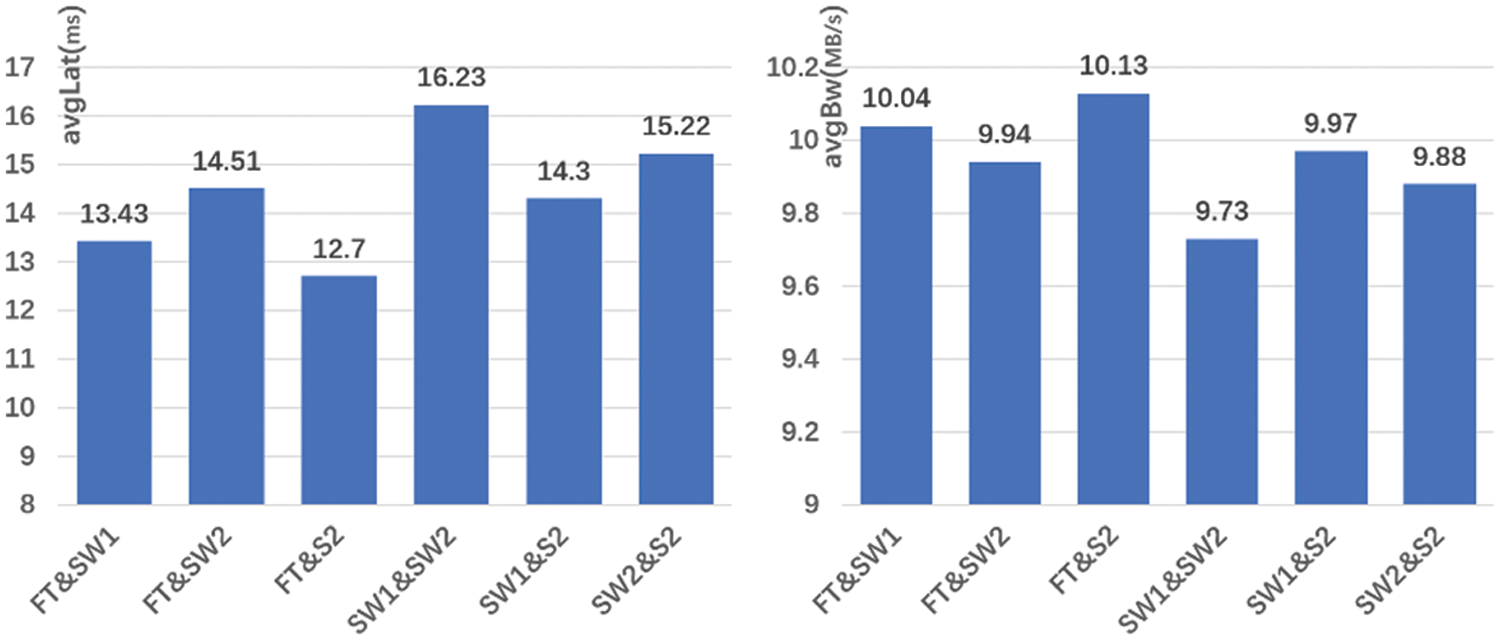
Figure 10: Hybrid topology multi-domain test results diagram
In the case of multi-domain SDN (only cross-domain traffic is tested), the bandwidth performance difference of several topologies is small, but it is still numerically negatively correlated with latency. Different from the single-domain case, the Fat-tree topology has better bandwidth and latency performance than other topologies in the case of cross-domain traffic transmission. Besides, in every latency test, Fat-tree topology is the most stable and its latency variance is the smallest.
We have tested the average latency and bandwidth of various topologies under single-domain, cross-domain and multi-domain conditions. However, in a real distributed data center network environment, the possibility for intra-domain traffic or Cross-domain traffic to exist separately is low. So we have to consider the mixed conditions.
If we assume that the proportion of intra-domain traffic in a distributed data center network is x, the average latency of intra-domain traffic is α(ms), and the average latency of inter-domain traffic is β(ms), we can simply estimate the overall average latency L: L = αx + β(1 − x). We calculate the latency of mixed traffic of several topologies under 81 switches (The number of switches in the fat-tree is 80) and 128 hosts, and the statistical results are shown in Fig. 11:
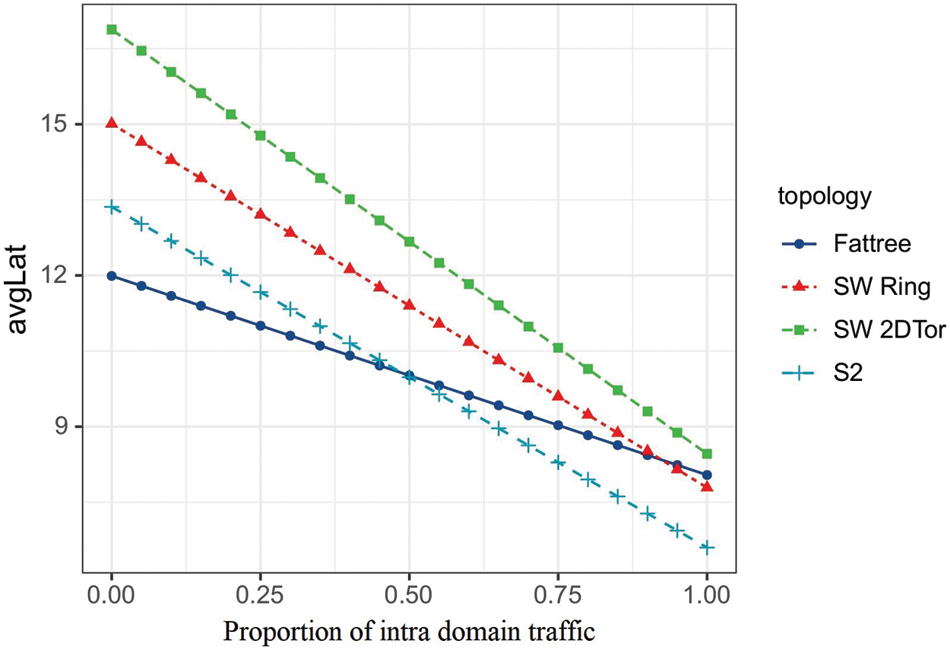
Figure 11: Variation of average latency with traffic proportion in the domain
As can be seen from Fig. 11, Fat-tree has the lowest average latency when the intra-domain traffic proportion is lower than 49%, while Space Shuffle has the lowest average latency when the intra-domain traffic proportion exceeds 49%. When the intra-domain traffic proportion of Small-World Ring reaches over 92%, average latency becomes lower than Fat-tree, but still consistently higher than Space Shuffle.
According to the test, in the single-domain test, Space Shuffle can freely allocate the number of switches and servers due to its special topology characteristics, saving the cost of network construction, and has good performance in various network scales. In Small-World, the number of switch ports is limited to 6. However, with the expansion of the network scale, 6 ports became the bottleneck of performance. We also tested its performance in the case of more ports, and its bandwidth latency performance was greatly improved. However, when it comes to multi-domain, Fat-tree, which has poor performance in a single-domain environment, has the most stable latency performance in a multi-domain environment. The other topologies, due to their topology characteristics, have discrete test results and higher average latency than Fat-tree. Finally, we conclude that Fat-tree topology is the optimal solution when intra-domain traffic proportion is low, and Space Shuffle is a better choice when intra-domain traffic proportion is high.
The research in this paper realizes a network simulation framework based on Mininet. After the user inputs the simulation network requirements, the framework automatically generates the topology and uses Mininet for network simulation. The framework supports a variety of data center topologies and some classic topologies, which can be completed in a few seconds. The previous cumbersome, time-consuming, and error-prone multi-domain SDN simulation environment construction process is greatly optimized. At the same time, the framework supports the overall performance testing of the generated network. Using this framework, we designed and implemented a multi-domain SDN simulation tool, and conducted test experiments. According to the experimental results, Space Shuffle has the best bandwidth and delay performance in a single-domain network. In the case of multiple domains, Fattree topology performance is best when the intra-domain traffic is low, and Space Shuffle is the best when the intra-domain traffic is high.
The tool of this paper has been tested. Each module of the tool runs well, and the emulation network is built quickly, which brings convenience to testers, greatly reduces human error during topology creation, and has little influence on the performance of the Mininet emulation tool.
Our work is continuing, and in the future, we will refine our tool to support more topology graph production algorithms, support some other simulation tools, and integrate more testing capabilities to accommodate more testing efforts needed.
Acknowledgement: We are thankful to all the collaborating partners.
Funding Statement: This work was supported by the Fundamental Research Funds for the Central Universities (2021RC239), the Postdoctoral Science Foundation of China (2021 M690338), the Hainan Provincial Natural Science Foundation of China (620RC562, 2019RC096, 620RC560), the Scientific Research Setup Fund of Hainan University (KYQD(ZR)1877), the Program of Hainan Association for Science and Technology Plans to Youth R&D Innovation (QCXM201910) and the National Natural Science Foundation of China (61802092, 62162021).
Conflicts of Interest: The authors declare that they have no conflicts of interest to report regarding the present study.
References
1. D. Kreutz, S. Azodolmolky and S. Uhlig, “Software-defined networking: A comprehensive survey,” Proceedings of the IEEE, vol. 103, no. 1, pp. 14–76, 2014. [Google Scholar]
2. R. Alkanhel, A. Ali, F. Jamil, M. Nawaz, F. Mehmood et al., “Intelligent transmission control for efficient operations in SDN,” Computers, Materials & Continua, vol. 71, no. 2, pp. 2807–2825, 2022. [Google Scholar]
3. F. X. Wibowo, M. A. Gregory, K. Ahmed and K. M. Gomez, “Multi-domain software defined networking: Research status and challenges,” Journal of Network and Computer Applications, vol. 87, pp. 32–45, 2017. [Google Scholar]
4. J. E. Lozano-Rizk, J. I. Nieto-Hipolito, R. Rivera-Rodriguez, M. A. Cosio-Leon, M. Vazquez-Briseño et al., “QOSCOMM: A data flow allocation strategy among sdn-based data centers for IoT big data analytics,” Applied Sciences, vol. 10, no. 21, pp. 7586, 2020. [Google Scholar]
5. X. Zhang, J. Zhou, W. Sun and S. K. Jha, “A lightweight CNN based on transfer learning for COVID-19 diagnosis,” Computers, Materials & Continua, vol. 72, no. 1, pp. 1123–1137, 2022. [Google Scholar]
6. X. Zhang, X. Sun, W. Sun, T. Xu, P. Wang et al., “Deformation expression of soft tissue based on BP neural network,” Intelligent Automation & Soft Computing, vol. 32, no. 2, pp. 1041–1053, 2022. [Google Scholar]
7. D. Kumar and M. Sood, “Analysis of impact of network topologies on network performance in SDN,” in Int. Conf. on Innovative Computing and Communications, New Delhi, India, pp. 357–369, 2020. [Google Scholar]
8. D. Kumar and M. Sood, “Software defined networks (SDNExperimentation with Mininet topologies,” Indian Journal of Science and Technology, vol. 9, no. 32, pp. 1–7, 2016. [Google Scholar]
9. C. Pal, S. Veena, R. P. Rustagi and K. Murthy, “Implementation of simplified custom topology framework in mininet,” in 2014 Asia-Pacific Conf. on Computer Aided System Engineering (APCASE), South Kuta, Bali, Indonesia, pp. 48–53, 2014. [Google Scholar]
10. S. K. Nandi, “Topology generators for software defined network testing,” in 2016 Int. Conf. on Electrical, Electronics, and Optimization Techniques (ICEEOT), Chennai, India, pp. 2984–2989, 2016. [Google Scholar]
11. M. Al-Fares, A. Loukissas and A. Vahdat, “A scalable, commodity data center network architecture,” ACM SIGCOMM Computer Communication Review, vol. 38, no. 4, pp. 63–74, 2008. [Google Scholar]
12. Y. Yu and C. Qian, “Space shuffle: A scalable, flexible, and high-bandwidth data center network,” in 2014 IEEE 22nd Int. Conf. on Network Protocols, Research Triangle area of North Carolina, USA, pp. 13–24, 2014. [Google Scholar]
13. J. -Y. Shin, B. Wong and E. G. Sirer, “Small-world datacenters,” in Proc. of the 2nd ACM Symp. on Cloud Computing, Cascais, Portugal, pp. 1–13, 2011. [Google Scholar]
14. M. Koibuchi, H. Matsutani, H. Amano, D. F. Hsu and H. Casanova, “A case for random shortcut topologies for HPC interconnects,” in 2012 39th Annual Int. Symp. on Computer Architecture (ISCA), Portland, USA, pp. 177–188, 2012. [Google Scholar]
15. J. López, N. Kushik, A. Berriri, N. Yevtushenko and D. Zeghlache, “Test derivation for sdn-enabled switches: A logic circuit based approach,” in IFIP Int. Conf. on Testing Software and Systems, Cádiz, Spain, pp. 69–84, 2018. [Google Scholar]
16. Y. Jiang, X. Yang, H. Chen, W. Quan, Z. Sun et al., “ORTF: Open-source reconfigurable testing framework for SDN switches,” in 2019 IEEE 21st Int. Conf. on High Performance Computing and Communications, Zhangjiajie, China, pp. 1188–1196, 2019. [Google Scholar]
17. R. Jawaharan, P. M. Mohan, T. Das and M. Gurusamy, “Empirical evaluation of sdn controllers using mininet/wireshark and comparison with cbench,” in 2018 27th Int. Conf. on Computer Communication and Networks (ICCCN), Hangzhou, China, pp. 1–2, 2018. [Google Scholar]
18. A. K. Arahunashi, S. Neethu and H. R. Aradhya, “Performance analysis of various sdn controllers in mininet emulator,” in 2019 4th Int. Conf. on Recent Trends on Electronics, Information, Communication & Technology (RTEICT), Bangalore, India, pp. 752–756, 2019. [Google Scholar]
19. L. Mamushiane, A. Lysko and S. Dlamini, “A comparative evaluation of the performance of popular SDN controllers,” in 2018 Wireless Days (WD), Dubai, UAE, pp. 54–59, 2018. [Google Scholar]
20. N. Khan, R. B. Salleh, I. Ali, Z. Khan, N. Mazhar et al., “Enabling reachability across multiple domains without controller synchronization in SDN,” Computers, Materials & Continua, vol. 69, no. 1, pp. 945–965, 2021. [Google Scholar]
21. S. Krishnamoorthy and K. Narayanaswamy, “SDN controller allocation and assignment based on multicriterion chaotic salp swarm algorithm,” Intelligent Automation & Soft Computing, vol. 27, no. 1, pp. 89–102, 2021. [Google Scholar]
22. N. A. El-Hefnawy, O. A. Raouf and H. Askr, “Dynamic routing optimization algorithm for software defined networking,” Computers, Materials & Continua, vol. 70, no. 1, pp. 1349–1362, 2022. [Google Scholar]
23. M. Beshley, H. Beshley, O. Kochan, N. Kryvinska and L. Barolli, “Measuring end-to-end delay in low energy SDN IoT platform,” Computers, Materials & Continua, vol. 70, no. 1, pp. 19–41, 2021. [Google Scholar]
24. K. Lei, J. Huang, X. Li, Y. Li, Y. Zhang et al., “HOPASS: A two-layer control framework for bandwidth and delay guarantee in datacenters,” Journal of Network and Computer Applications, vol. 196, no. 1, pp. 103224, 2021. [Google Scholar]
25. M. Islam, N. Islam and M. Refat, “Node to node performance evaluation through RYU SDN controller,” Wireless Personal Communications, vol. 112, no. 1, pp. 555–570, 2020. [Google Scholar]
Cite This Article
 Copyright © 2023 The Author(s). Published by Tech Science Press.
This work is licensed under a Creative Commons Attribution 4.0 International License , which permits unrestricted use, distribution, and reproduction in any medium, provided the original work is properly cited.
 Downloads
 Citation Tools