
 Submit a Paper
 Propose a Special lssue
 Open Access
ARTICLE

A Unique Discrete Wavelet & Deterministic Walk-Based Glaucoma Classification Approach Using Image-Specific Enhanced Retinal Images
School of Computer Science and Engineering, VIT-AP University, Inavolu, Beside AP Secretariat, Amaravati-522237, AP, India
* Corresponding Author: Soubhagya Sankar Barpanda. Email:
Computer Systems Science and Engineering 2023, 47(1), 699-720. https://doi.org/10.32604/csse.2023.036744
Received 11 October 2022; Accepted 21 December 2022; Issue published 26 May 2023
 View Full Text
 Download PDF
Abstract
Glaucoma is a group of ocular atrophy diseases that cause progressive vision loss by affecting the optic nerve. Because of its asymptomatic nature, glaucoma has become the leading cause of human blindness worldwide. In this paper, a novel computer-aided diagnosis (CAD) approach for glaucomatous retinal image classification has been introduced. It extracts graph-based texture features from structurally improved fundus images using discrete wavelet-transformation (DWT) and deterministic tree-walk (DTW) procedures. Retinal images are considered from both public repositories and eye hospitals. Images are enhanced with image-specific luminance and gradient transitions for both contrast and texture improvement. The enhanced images are mapped into undirected graphs using DTW trajectories formed by the image’s wavelet coefficients. Graph-based features are extracted from these graphs to capture image texture patterns. Machine learning (ML) classifiers use these features to label retinal images. This approach has attained an accuracy range of 93.5% to 100%, 82.1% to 99.3%, 95.4% to 100%, 83.3% to 96.6%, 77.7% to 88.8%, and 91.4% to 100% on the ACRIMA, ORIGA, RIM-ONE, Drishti, HRF, and HOSPITAL datasets, respectively. The major strength of this approach is texture pattern identification using various topological graphs. It has achieved optimal performance with SVM and RF classifiers using biorthogonal DWT combinations on both public and patients’ fundus datasets. The classification performance of the DWT-DTW approach is on par with the contemporary state-of-the-art methods, which can be helpful for ophthalmologists in glaucoma screening.Keywords
Glaucoma is an incurable retinal distortion caused by an increase in intraocular pressure (IOP) due to uneven generation and flowing “aqueous humor” [1]. A thorough examination of the retinal structures such as the optic disc (OD) and the cup (OC) can prevent glaucoma. Expert ophthalmologists clinically examine the human eye for glaucoma using several practices, such as fundus (retinal) image structural analysis [2]. However, these are tedious and error-prone due to their non-mechanical nature. As technology advances, CAD has become a standard medical practice for ophthalmologists in making quick and accurate glaucoma diagnoses. The CAD follows a fixed approach that contains major phases such as retinal image pre-processing, region-of-interest (ROI) segmentation, feature extraction, and classification using artificial intelligence (AI) approaches. The initial CAD phase is pre-processing, which usually eliminates noise existing in the image and applies various approaches to enhance the retinal image for a clear structural view. The feature extraction phases identify significant texture patterns in enhanced images for auto-screening by AI approaches.
In contrast to ordinary images, the structural analysis of fundus images is highly sophisticated due to the complex retinal tissue textures. In most cases, the textures of both the glaucomatous and healthy eyes are usually similar, and their discrimination requires a high level of cognitive processing. In the proposed CAD approach, complex texture analysis has been carried out on qualitatively improved retinal images using the combination of DTW and DWT for proper identification of the glaucomatous eye. It extracts the significant retinal texture patterns for the accurate designation of glaucomatous images. The rest of the paper is presented in different sections: Section 2 gives existing CAD-based glaucoma detection approaches that are motivated for the proposed approach; Section 3 demonstrates the proposed retinal image enhancement and the new feature extraction approach for glaucoma image classification; Section 4 investigates the classification results for scientific findings, and; Section 5 concludes the paper with the future work.
2 Existing Glaucoma Practices and Motivation
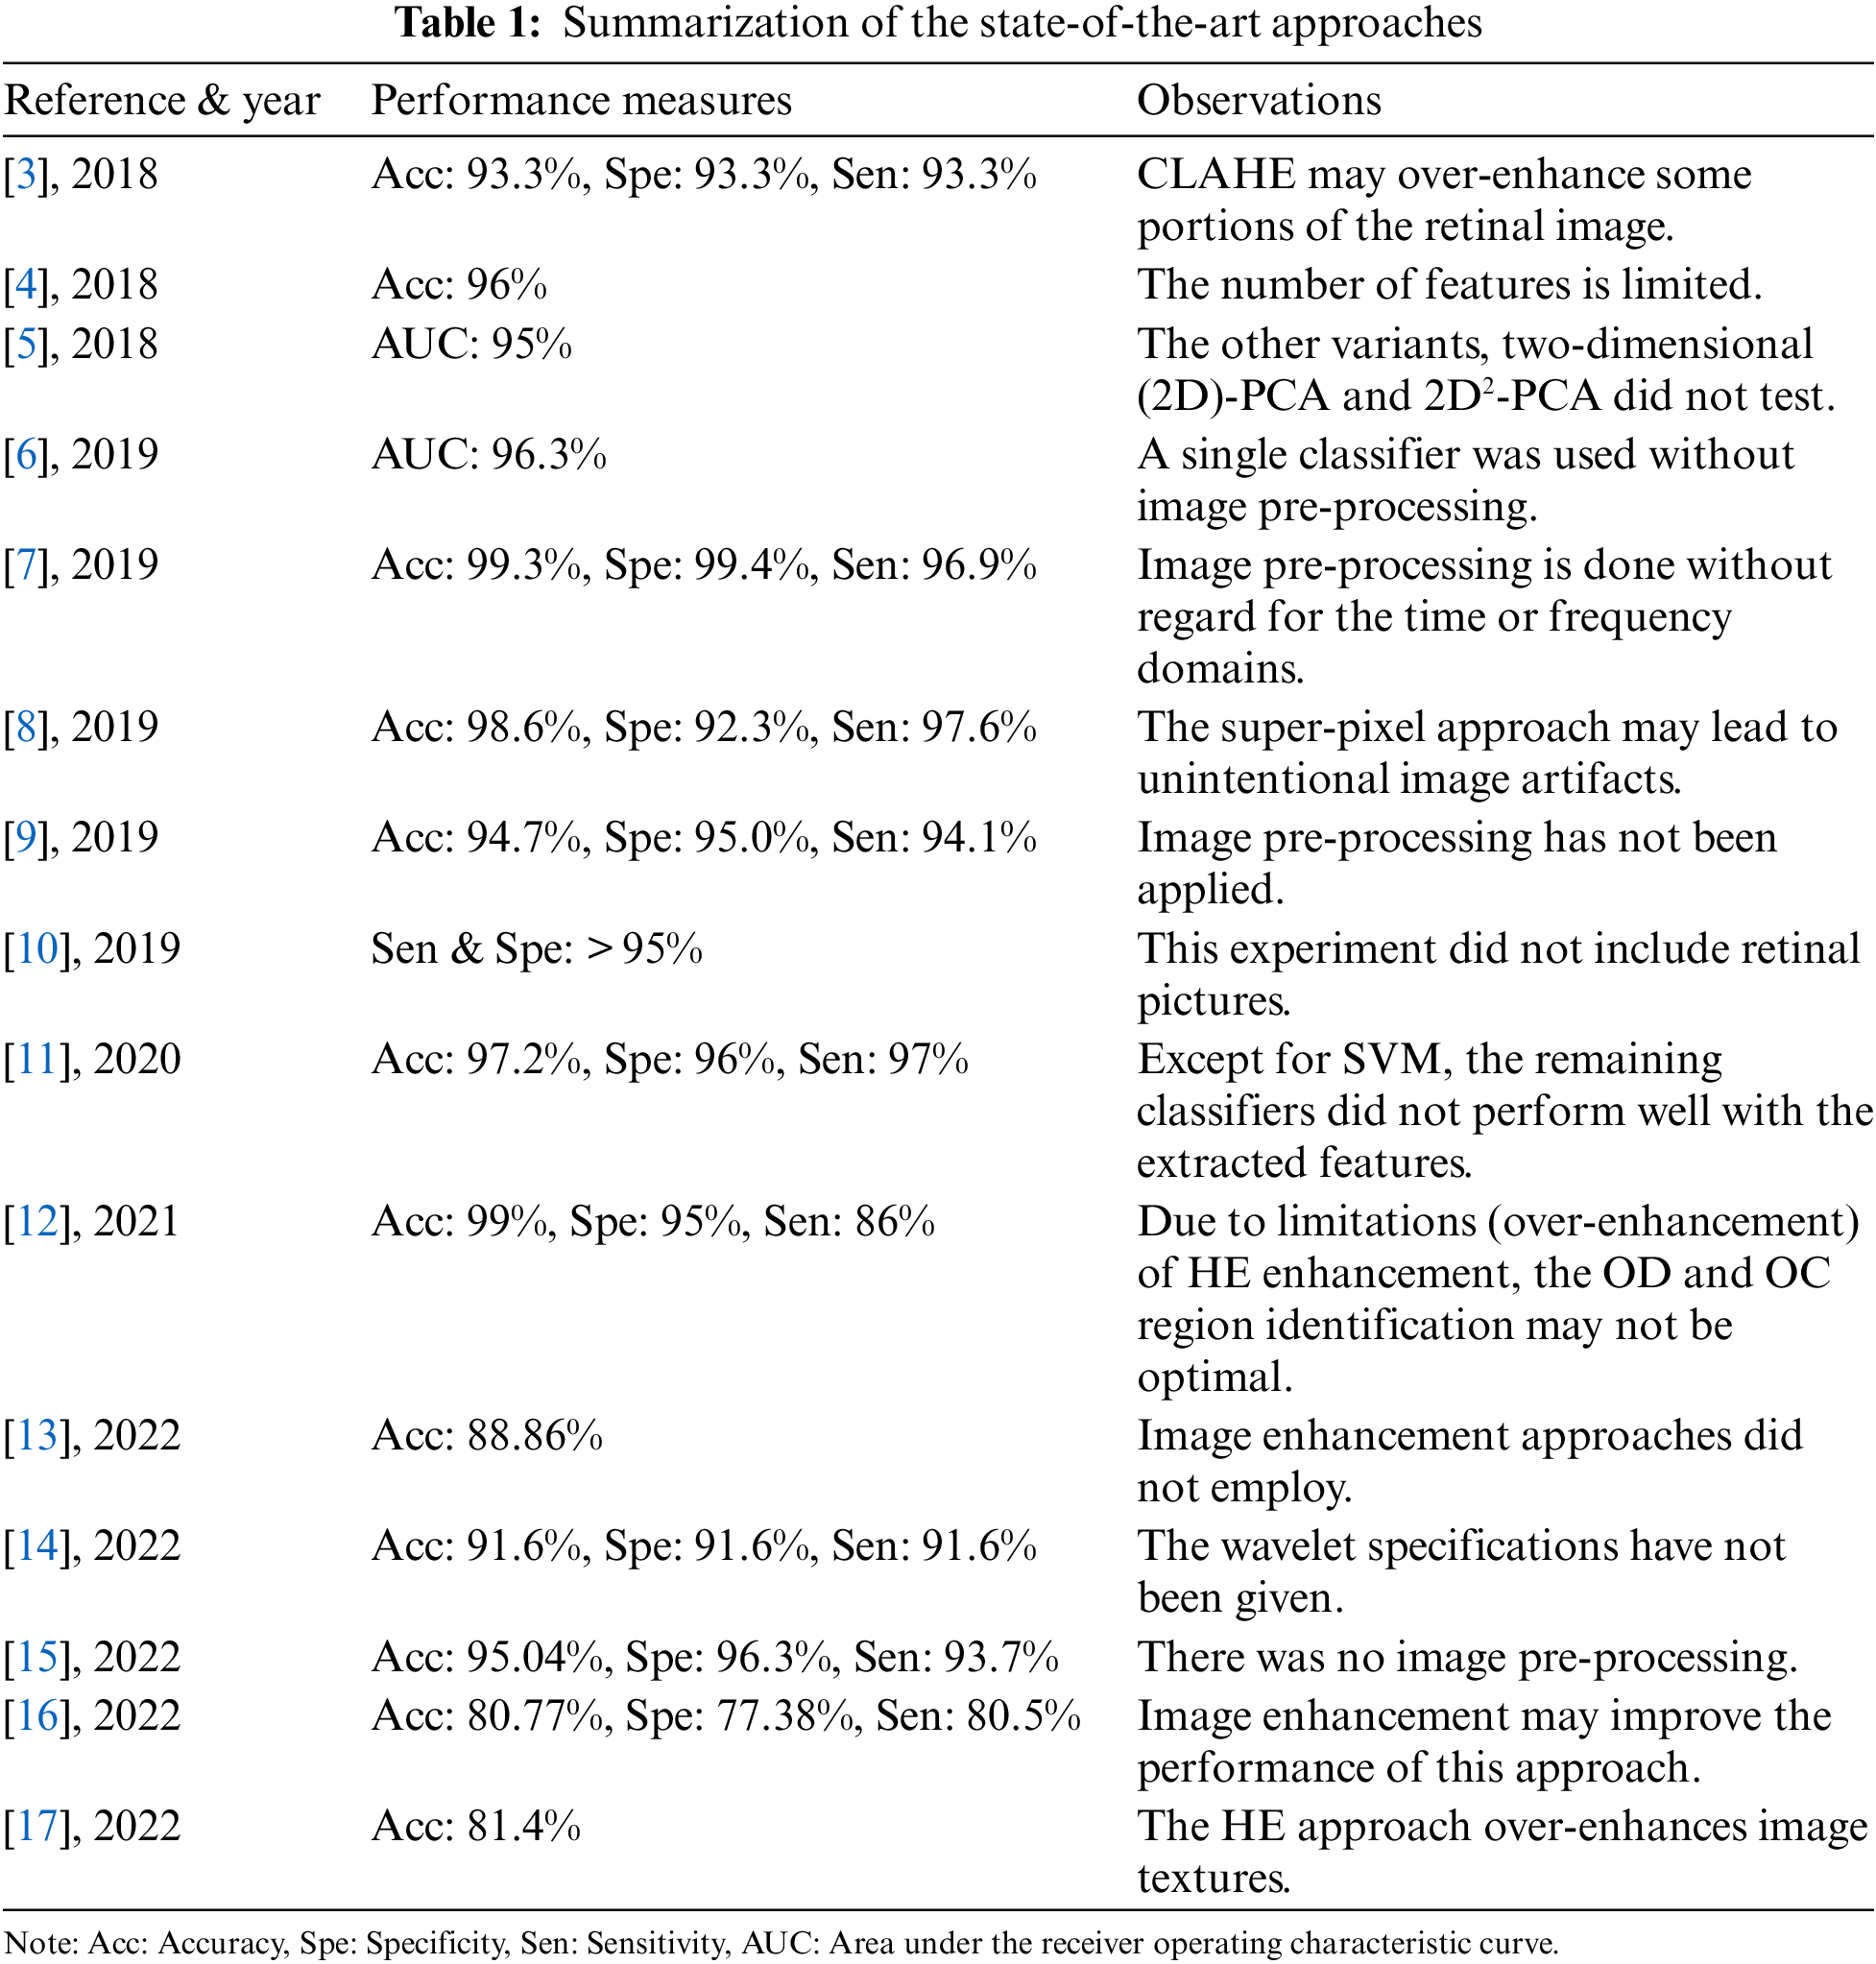
There are currently several existing works in the field of CAD-based glaucoma classification. This section presents a detailed investigation of them in terms of CAD’s major phases: image pre-processing, feature extraction, and classification. Muthmainah et al. [3] extracted first-order statistical (FoS) features from contrast-limited adaptive histogram equalization (CLAHE)-based enhanced retinal images. Then these features are ranked and fed to support vector machines (SVM) and k-nearest neighbor (k-NN) approaches for glaucoma screening. Afterward, Belgacem et al. [4] extracted the cup/disc ratio (CDR) of retinal images for glaucoma identification. Later, principal component analysis (PCA) features are extracted by Christopher et al. [5] to diagnose the glaucoma progression. Next, both texture and structural features are extracted by An et al. [6] using Visual Geometry Group (VGG)-19-based transfer learning (TL) approaches, and the classification is done with a random forest (RF) classifier. Subsequently, Rehman et al. [7] extracted statistical and fractal features from denoised and edge-enhanced images for glaucoma identification using SVM, RF, Ada, and RusBoost ML approaches. Later, an anisotropic diffusion filter is utilized by Mohamed et al. [8] for retinal image denoising before correcting image illumination. Then, the enhanced images’ super-pixel-based features were classified using the SVM classifier. Afterward, Oh et al. [9] collected retinal features using a convolutional neural network (CNN) along with the visual field (VF) test characteristics and then selected using a chi-square test. SVM, RF, and XGBoost classifiers were used in their study. Thomas et al. [10] then applied artificial neural networks (ANN) to human eye visual fields for glaucoma screening. Later, Thakur et al. [11] extracted both structural features such as CDR from vessel-free retinal images and non-structural features of different orders from grayscale images. These features are ranked and classified using Naive Bayes (NB), SVM, k-NN, and RF classifiers. Next, histogram-based (HE) enhanced retinal images are segmented by Shanmugam et al. [12] using an adaptive network (Au-Net) for OD and OC proportions. Nawaldgi et al. [13] extracted the co-occurrence matrix of gray-level (GLCM) characteristics. Then, DWT features were extracted from electro-retinography signals by Gajendran et al. [14]. ML classifiers used these DWT features for early-stage glaucoma detection. Patel et al. [15] then split the color channels of retinal images into bit-planes to generate local-binary patterns (LBP) for classification. Later, the retinal image color channels’ LBP features were extracted and classified using SVM by Rebinth et al. [16]. Next, Arsyan et al. [17] extracted invariant moment features from the HE-enhanced retinal OC and blood vessels. Then k-NN is applied by considering the five nearest neighbors. Table 1 summarizes the literature survey done for the proposed method.
2.1 The Proposed Approach’s Contributions
The in-depth literature survey has identified some CAD phase-wise research limitations such as Image pre-processing: (i) Most of the pre-processing approaches were designed for gray-scale medical images, (ii) The parameter values for enhancement were manually assigned, (iii) Texture intensity and structure improvement did not address jointly; Feature extraction & classification: (i) Image features have extracted without or with minimal usage of time- or frequency-domains, (ii) Most of the feature extraction approaches are limited by constraints such as threshold values, image dimensions, and directions, (iii) Inter-pixel relations are extracted with simple mathematical operations, and (iv) Texture patterns are extracted by considering only immediately adjacent pixels.
The proposed CAD approach has been motivated and designed to address the identified limitations with the following contributions:
Image pre-processing:
• Color retinal images’ brightness and texture improvement are jointly considered.
• Image-specific parameters are scientifically calculated and employed in the enhancement.
Feature extraction and classification:
• Retinal image textures are analyzed using orthogonal (e.g., Daubechies (Db)) and biorthogonal (e.g., Bior Nr. Nd or Bi Nr. Nd) wavelets.
• Texture patterns have been extracted using graph theory and traveler’s walks for various memory constraints.
• Texture pattern extraction considers both immediate and non-immediate neighboring pixels.
• All significant graph-based features are extracted to build powerful feature vectors.
3 The Proposed CAD Glaucoma Approach
In this study, retinal images were considered from various public datasets: ACRIMA [18] (396: glaucomatous, 309: normal), ORIGA [19] (168: glaucomatous, 482: normal), RIM-ONE [19] (325: glaucomatous, 458: normal), Drishti [16] (70: glaucomatous, 31: normal), and HRF [16] (15: glaucomatous, 15: normal). Furthermore, patients’ retinal images (110: glaucomatous, 110: normal) are collected from the Goutami Eye Institute [20] (HOSPITAL) to test the proposed approach’s performance. This approach has balanced retinal image illumination and structure improvement, and extracted pixel intensity relationships using DTW on graphs generated from DWT of images. DWT is a time-frequency localization approach. It explores the frequency and spatial information concurrently from the given 2D input image using a decimation operation with wavelet filter banks. High-pass and low-pass filters in filter banks extract details and approximate information from fundus images in the form of wavelet coefficients. The DTW operation can be interpreted as a tourist planning to visit randomly located locations on a multi-dimensional graph (map). The traveler begins his journey at a given point and proceeds to the next-nearest place in a deterministic manner, i.e., move to the next-nearest place that has not been visited in the most recent steps. This travel can explore neighboring relationship patterns that characterize the given map. The overall procedure is shown in Fig. 1 and explained in the following sub-sections.
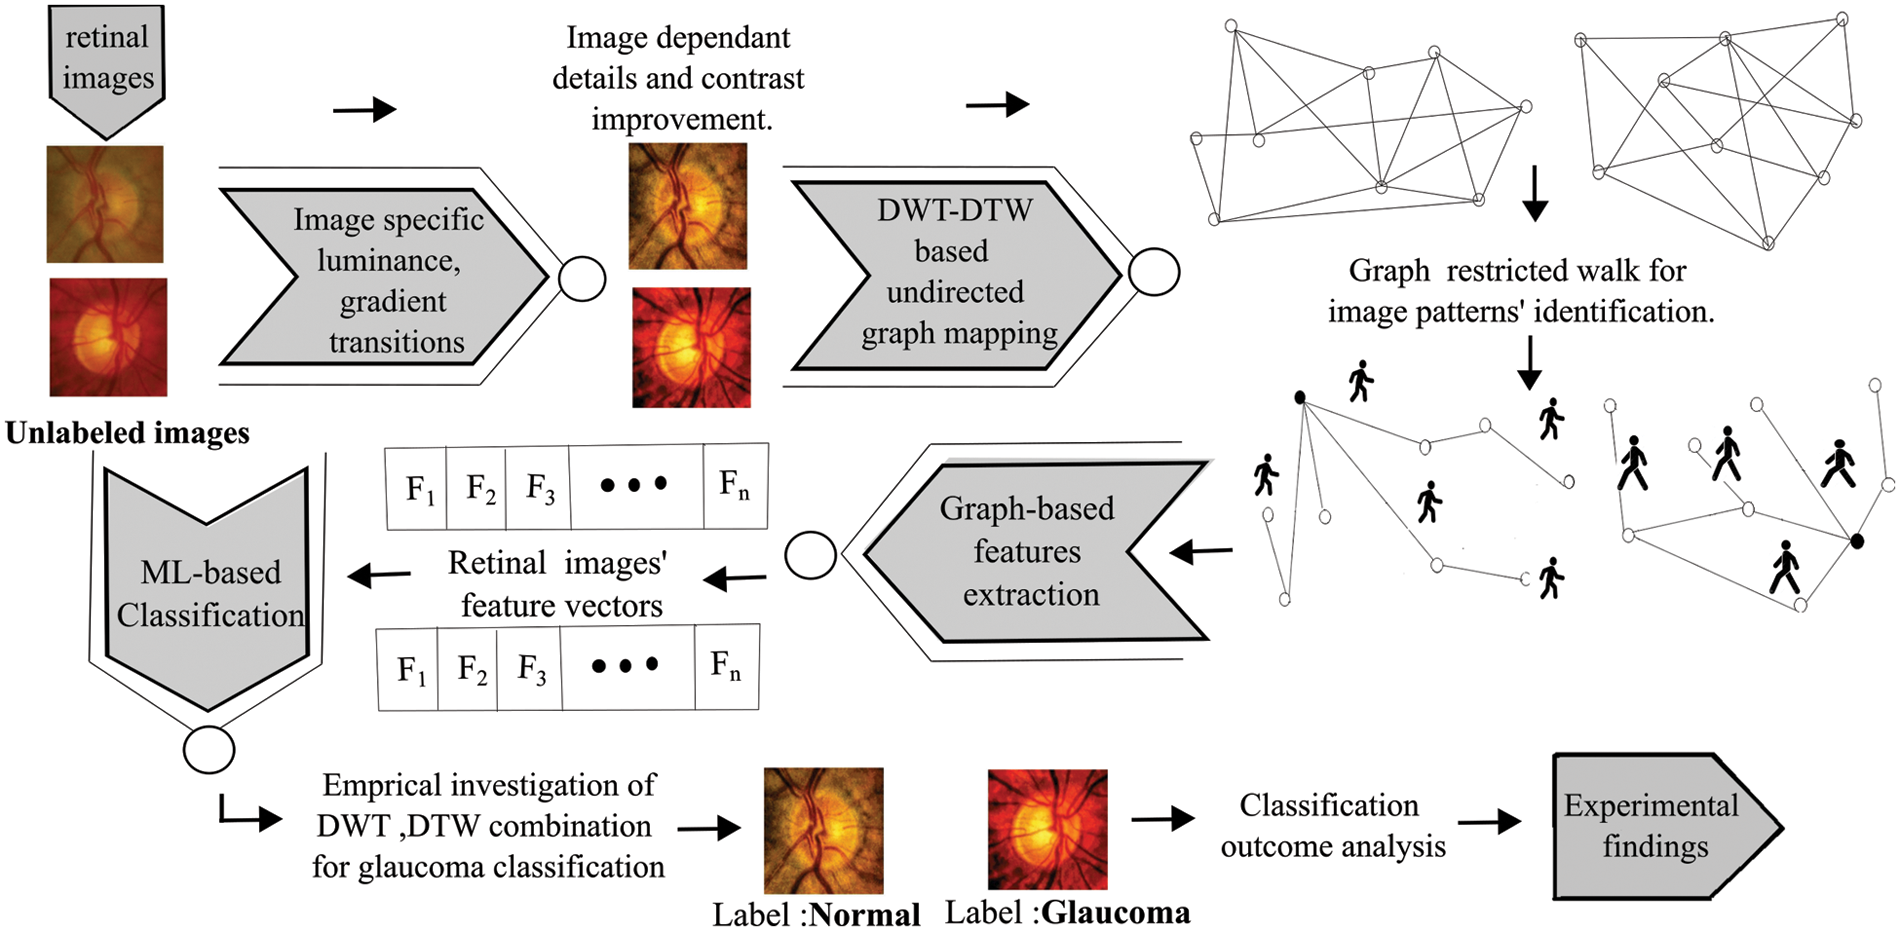
Figure 1: The procedural flow of the DWT-DTW-based glaucoma classification approach
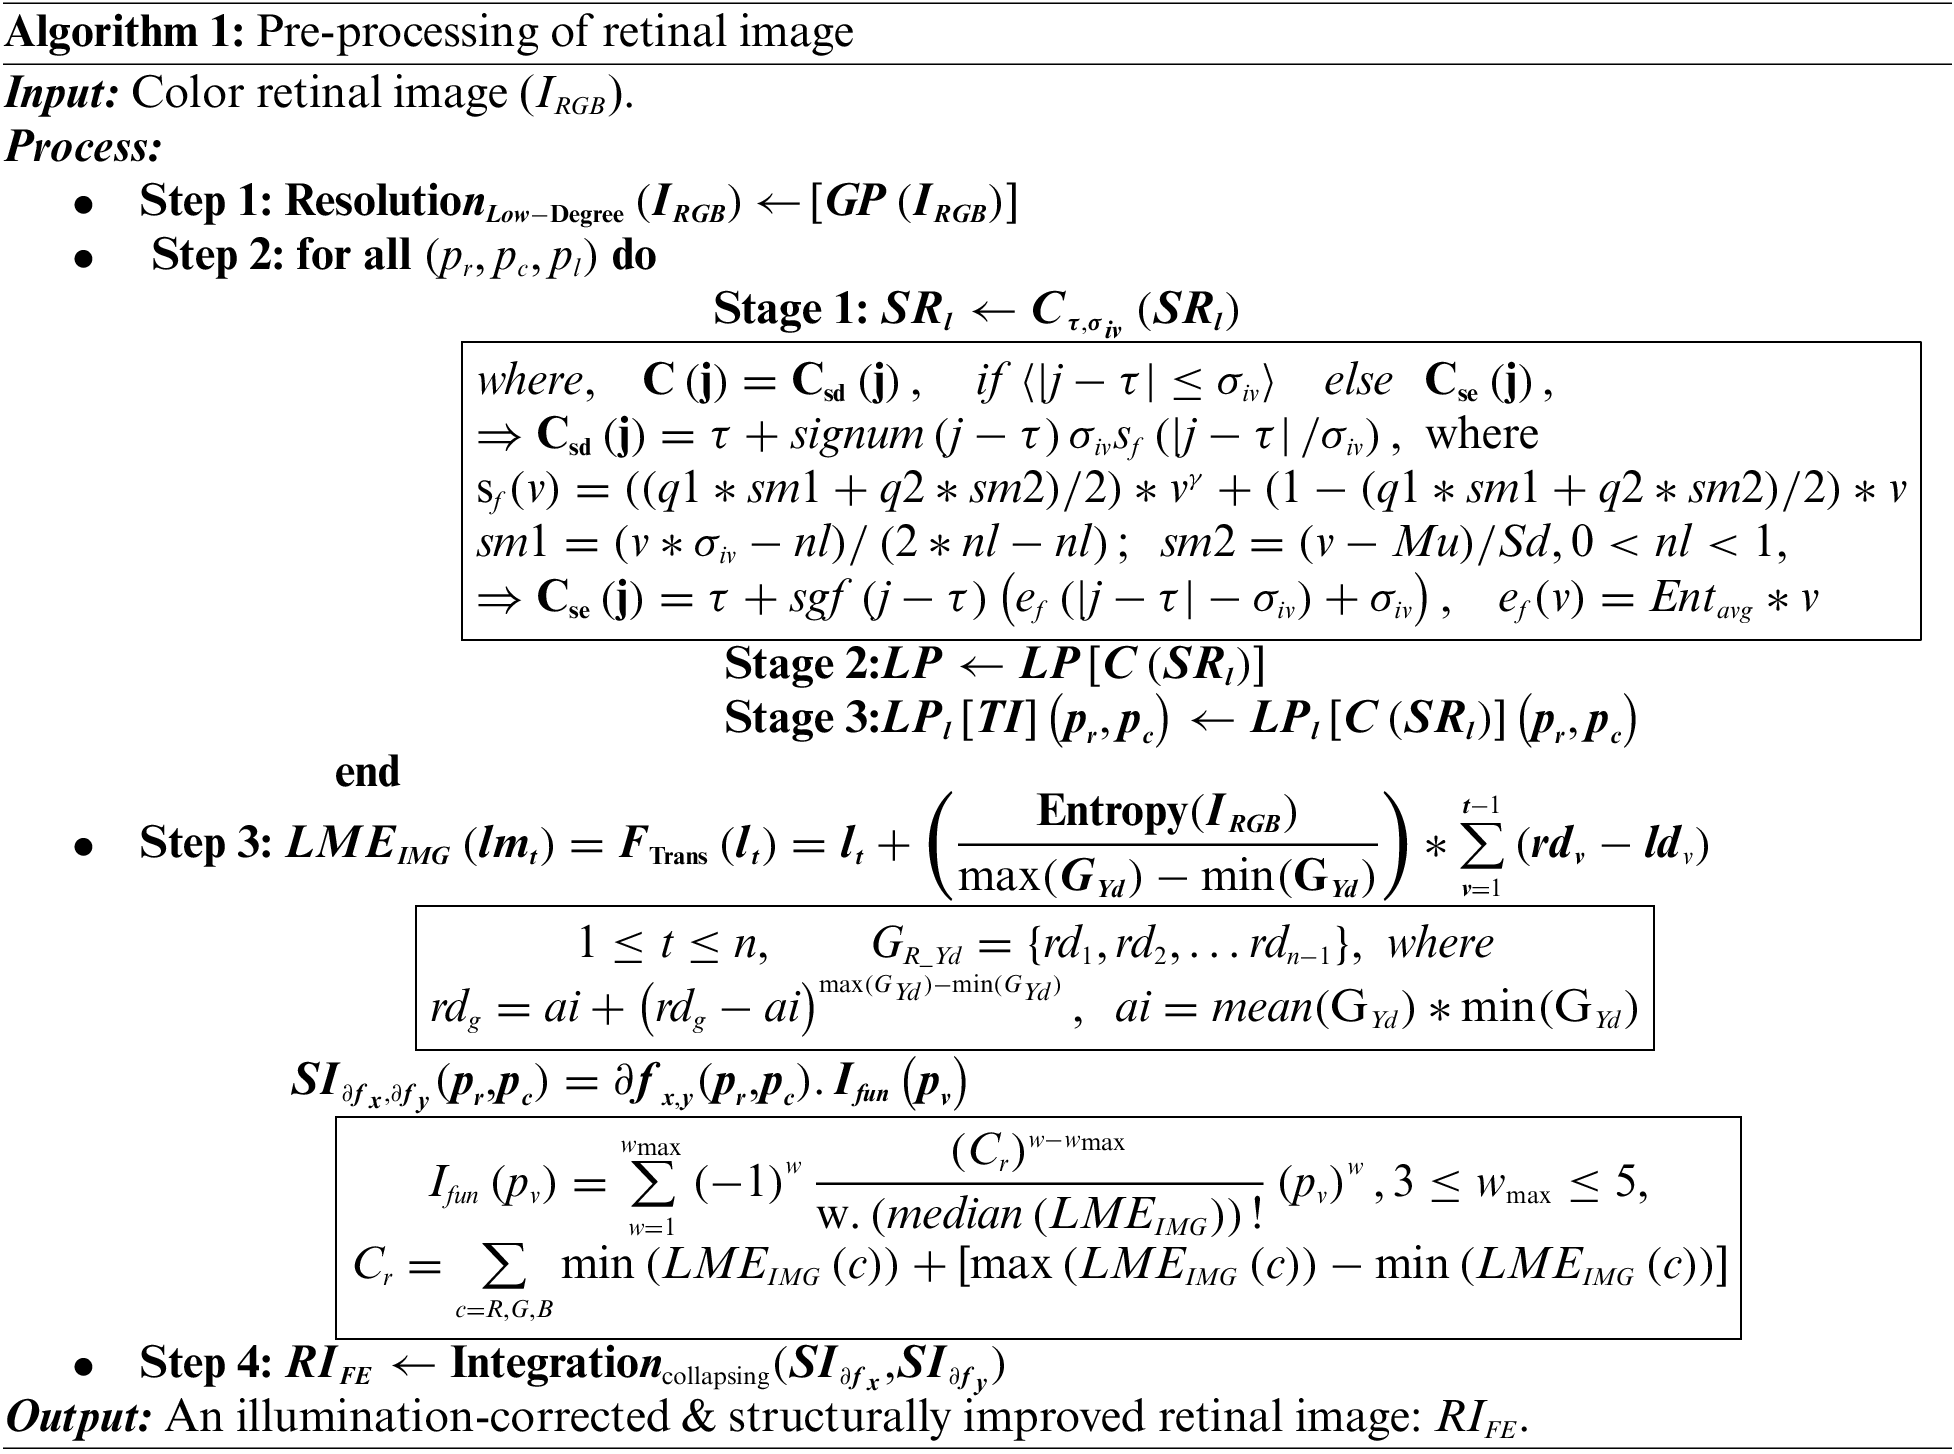
3.1 Retinal Image Pre-Processing
The proposed pre-processing has been divided into two stages: Image visual quality improvement and details enhancement. The entire approach is given in Algorithm 1 (A1) and explained w.r.t step numbers (A1: Sn). In this study, image edges are preserved by the Regional Laplacian-Filtering (RLF) approach that constructs Gaussian-pyramid (GP) for each image (IRGB) resolution. It extracts image lower-resolutions level by level (GPlevel) (A1: S1) by successive down-sampling. The discriminating details of each successive GPlevel are used to generate Laplacian-pyramid levels (LPlevel). The RLF is applied image-level-wise as well as coefficient-wise. These are designated by the position (pr, pc) and pyramid levels (pl) (A1: S2), using three stages:
• Stage 1: Remapping computation: Each sub-region (SRl) is processed with a remapping computation C(.) using Csd and Cse, operations and
• Stage 2: SR-pyramid generation: Generates a Laplacian pyramid
• Stage 3: Updating the output pyramid: The generated level-wise LP coefficients, i.e.,
It is followed by a series of image-specific luminance and gradient modulations on
3.2 The Proposed Retinal Image Feature Extraction
The objective is to extract retinal image (i.e., RIFE) texture patterns using various Db and Bior Nr. Nd wavelets and tourists’ walks. As per the existing literature, our proposed approach is the first one that extracts DWT and DTW-based retinal image features for glaucoma classification. In this approach, an undirected graph constructed with DTW trajectories formed using the image’s DWT coefficients of
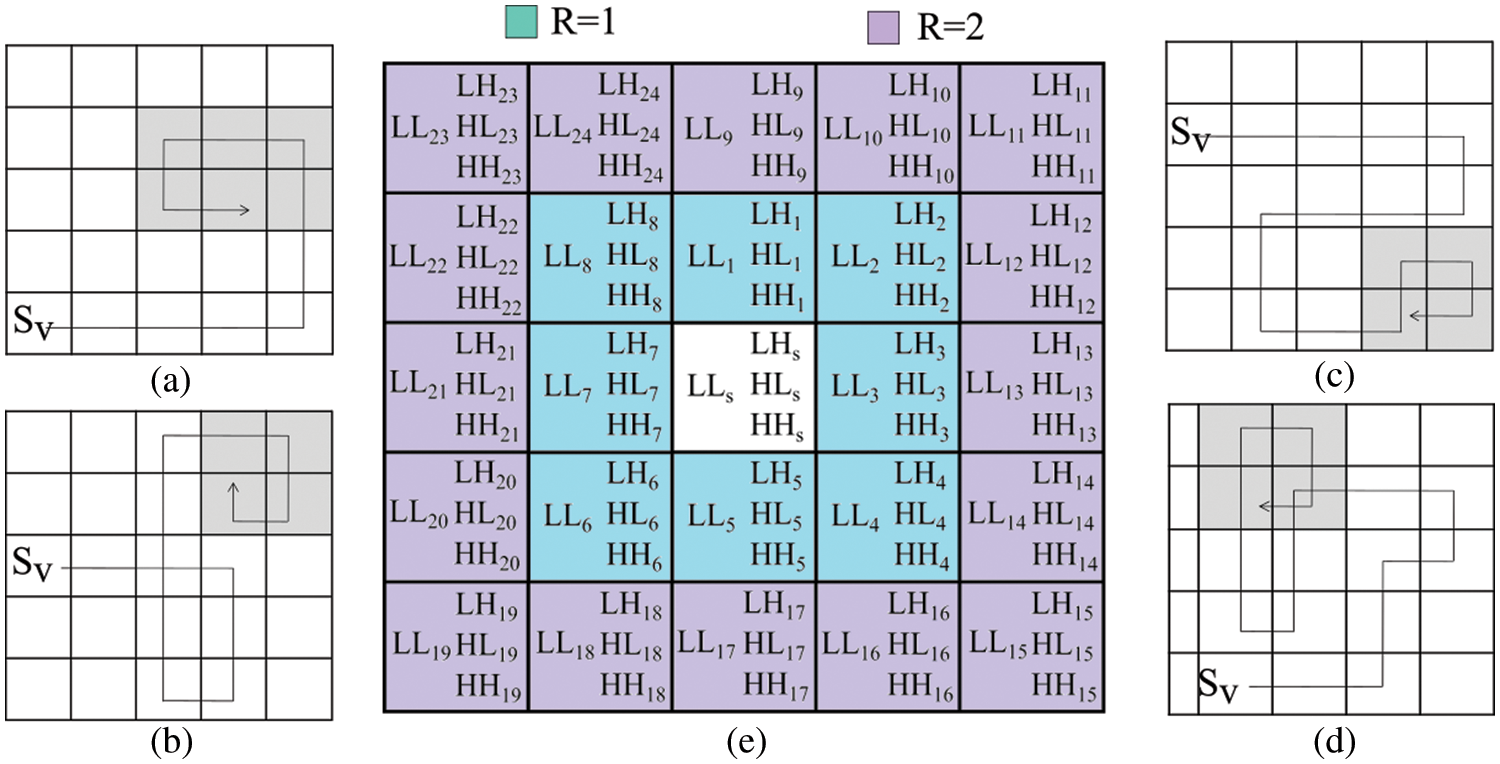
Figure 2: The neighborhood test for various ‘R’ values along with sample DTW whirlpool trajectories
As shown in Eq. (1), the distance covered by R between the source (center) and participating (Ps) vertices is calculated by a metric
where (xs, ys) is the Sv vertex position, and (xp, yp) is the Ps vertex position. The weight function, Ws is measured using cosine similarity between positional DWT coefficients using Eq. (2),
where LLs, LHs, HLs, and HHs are DWT coefficients of Sv and LLp, LHp, HLp, and HHp are DWT coefficients of Ps. The
Tourists’ walks start by considering each vertex
where,
Detection of a whirlpool in DTW is a challenging task. During the DTW progression, a vertex can revisit. According to the second rule of MP, in the current step, recently visited vertices (from the last RM steps) cannot be considered. Sample whirlpool situations have shown in Figs. 2a−2d, and their early detection can save computing resources. A new policy has been adopted for the detection of whirlpool situations. It is based on the sequence of vertices revisited during DTW, as shown in Fig. 3. Our policy has utilized a 1D vector Mwp to keep track of visited vertices and a structure Swp for each vertex that records the number of times it has been visited. The whirlpool identification policy (Ipolicy) is designed using Eq. (5).
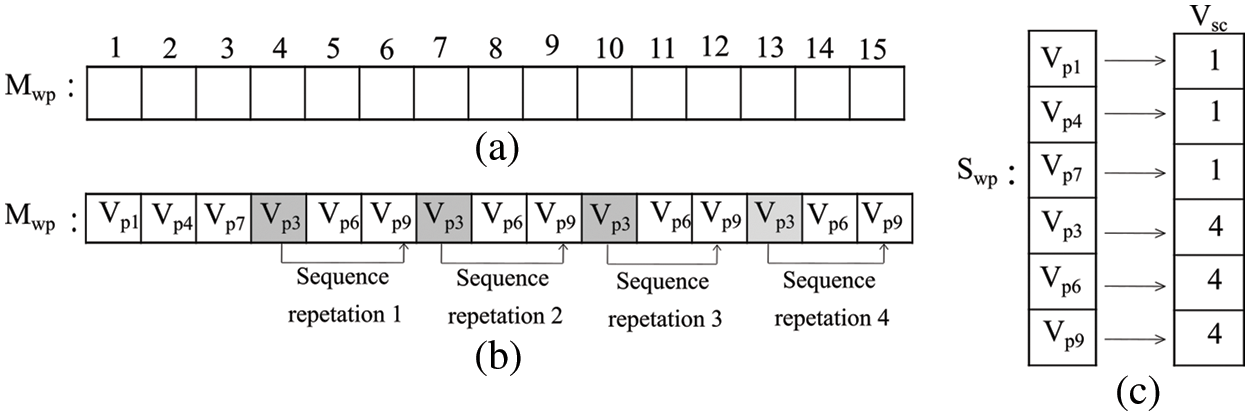
Figure 3: (a) The track of DTW’s visited vertices (b) an example of a situation that can lead to a whirlpool for the DTW trajectory (c) vertex’s visited record structure
This policy covers three situations: (1) the maximum number of times (Pmax), a vertex pattern (Vpr) appears; (2) a vertex visited step count (Vsc) with a maximum limit (Lmax), and; (3) the DTW trajectory T that covers the maximum area Amax.
In the proposed approach, Pmax and Lmax values are 3 and 5 respectively. The maximum edge count (Amax) is set at 25, to avoid boundless paths. Once a whirlpool occurs, DTW progression stops, and the vertices covered in that journey form a trajectory corresponding to that Vs. This process repeats for all available vertices in Vs. Finally, an undirected graph (RIG) is constructed by considering all these DTW trajectories corresponding to each vertex. The proposed approach has generated individual RIG for different RM values. Retinal image texture patterns are then captured using graph-based features (Table 2) of RIG.
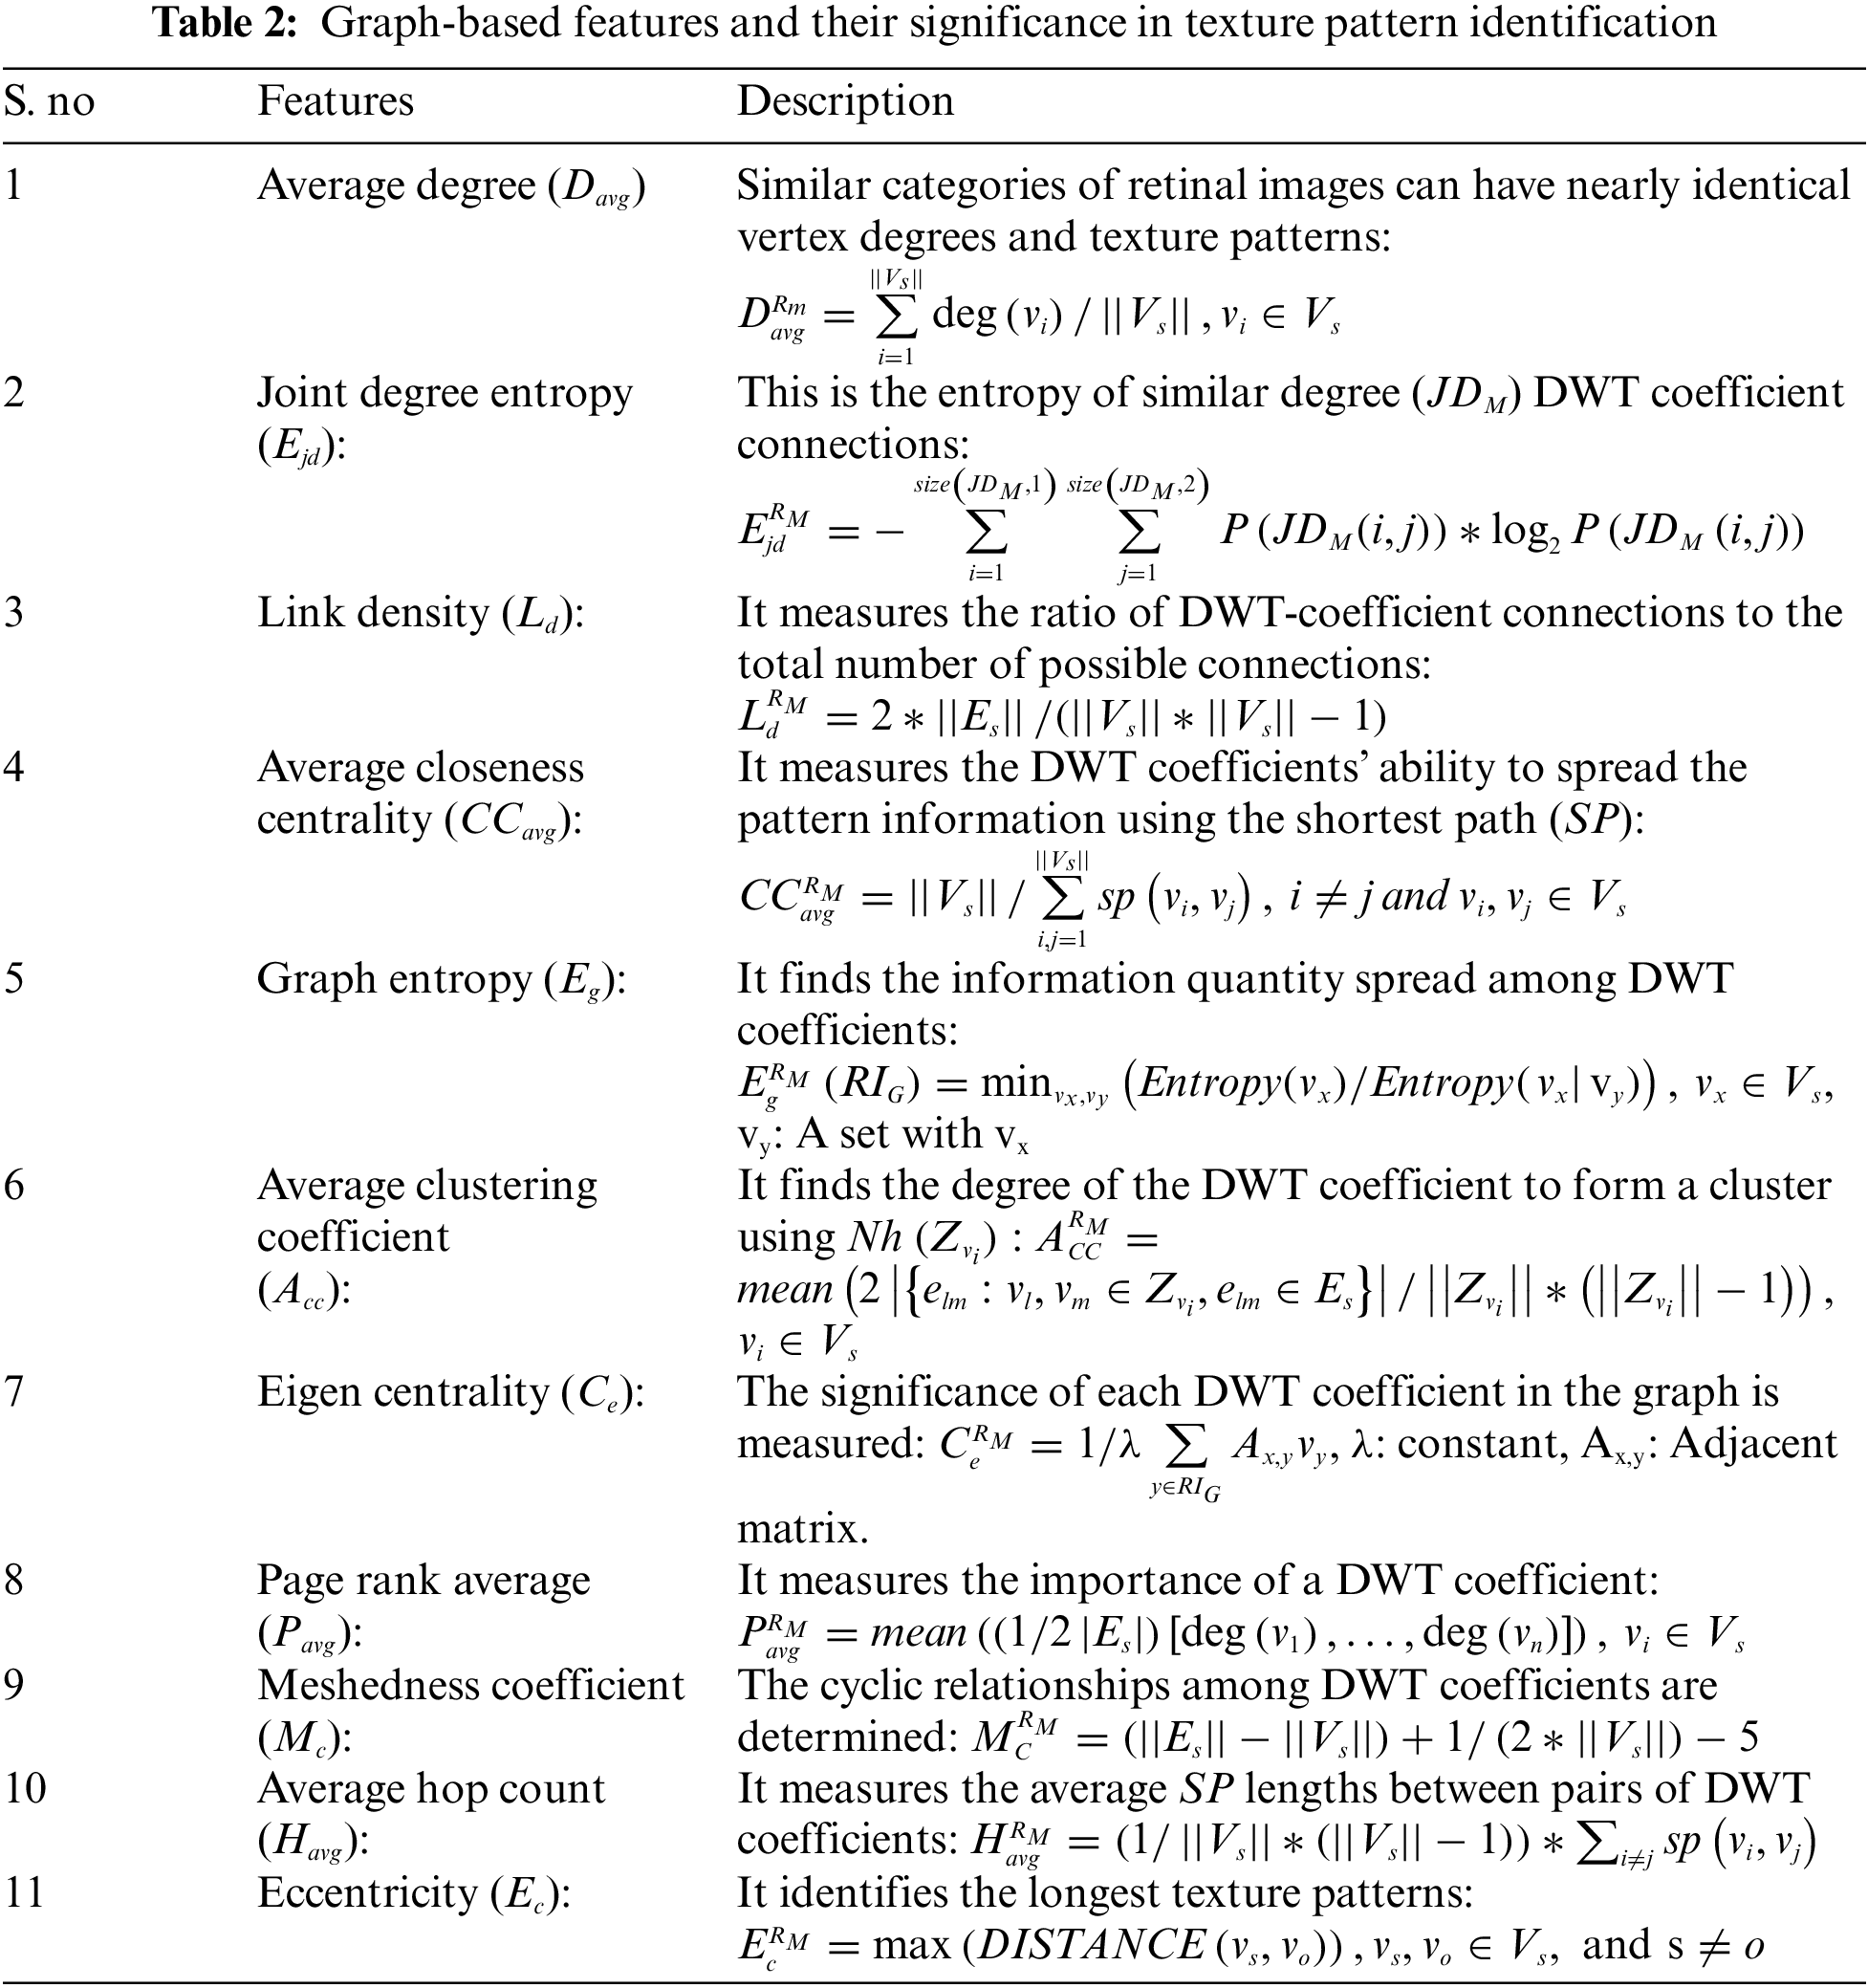
Using these graph-based features corresponding to each RIG, a feature vector is constructed for each retinal image. This study considers RM values from 1 to 6.
All extracted
The entire experiment was carried out on the ROI (i.e., OC and OD areas) of color retinal images. The whole procedural flow is shown in Fig. 4. Initially, the retinal images’ intensity is improved using the image-specific edge and details modifier controllers Cse and Csd of the RLF approach. Then LT and GT operations are applied for luminance enhancement and texture improvement, respectively. Image-specific parameter-based preprocessing produces better-quality retinal images than existing methods, such as LM&GM [21] and CLAHE [22]. Some sample results are shown in Fig. 5. When compared to the CLAHE and LM&GM approaches, the qualitative results show strong evidence for both luminance and structural image improvement.
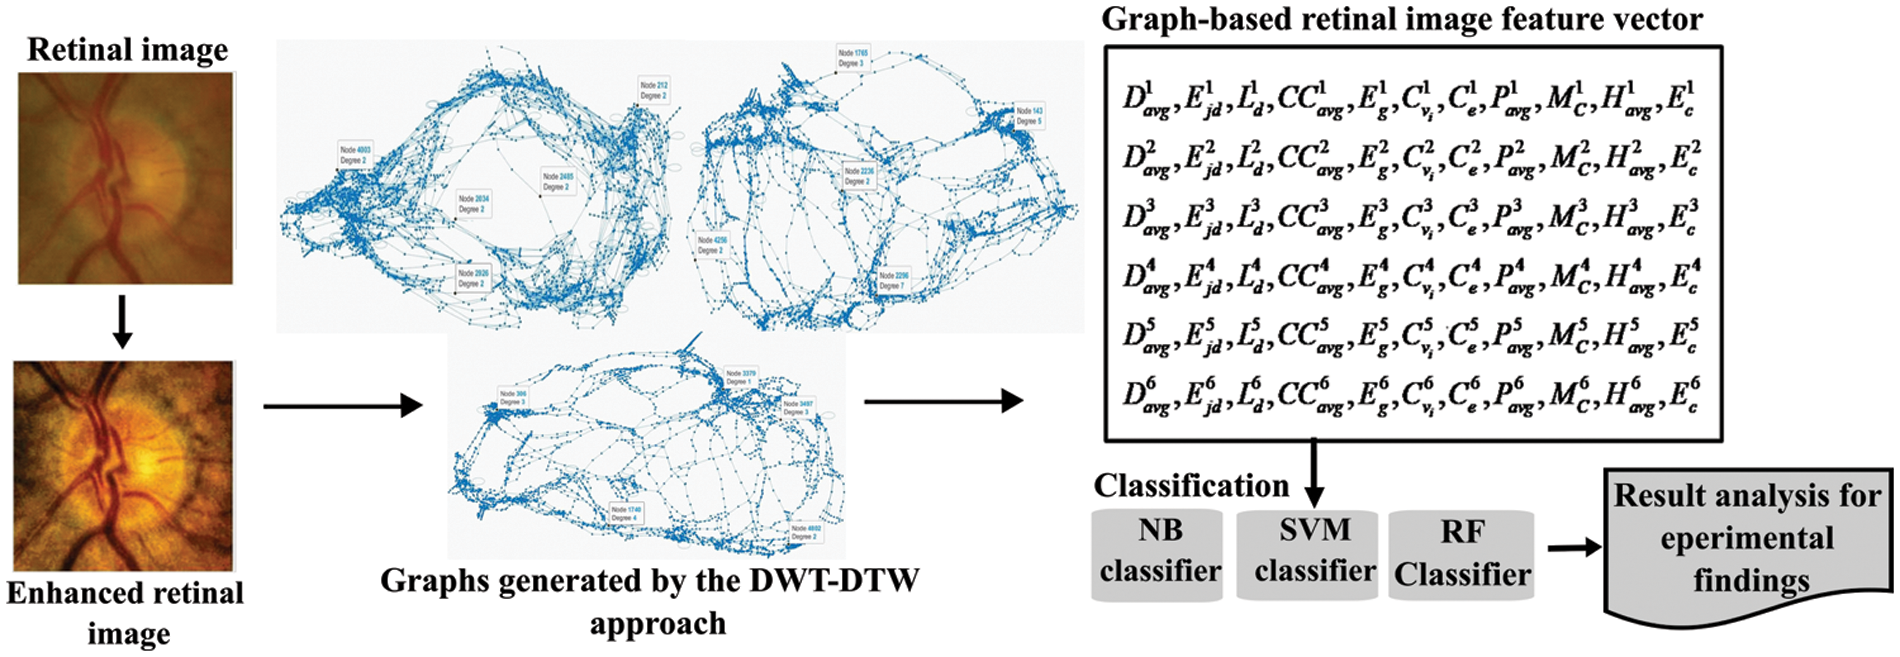
Figure 4: The block diagram of the proposed glaucoma screening approach
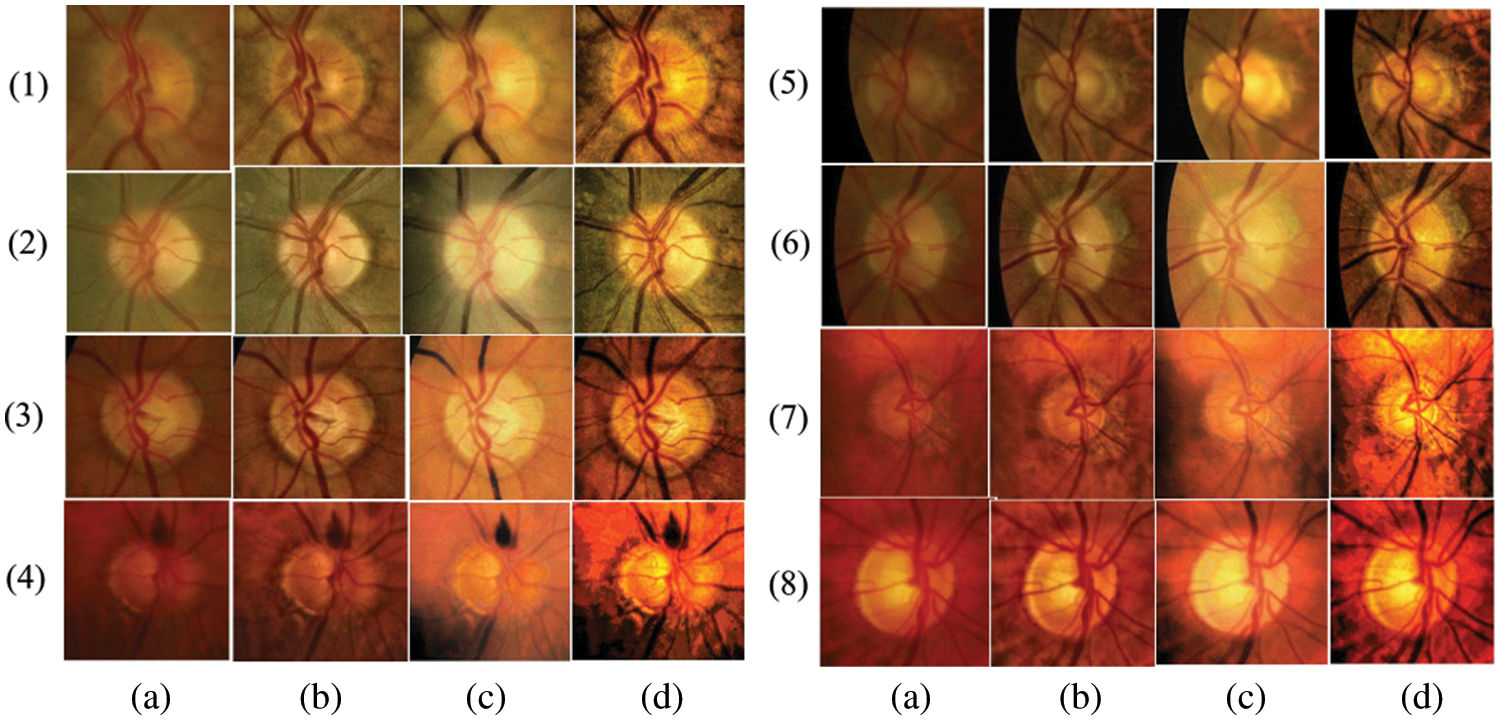
Figure 5: (a) Original input images, (b), (c), and (d) enhanced images by CLAHE, LM&GM, and the proposed pre-processing
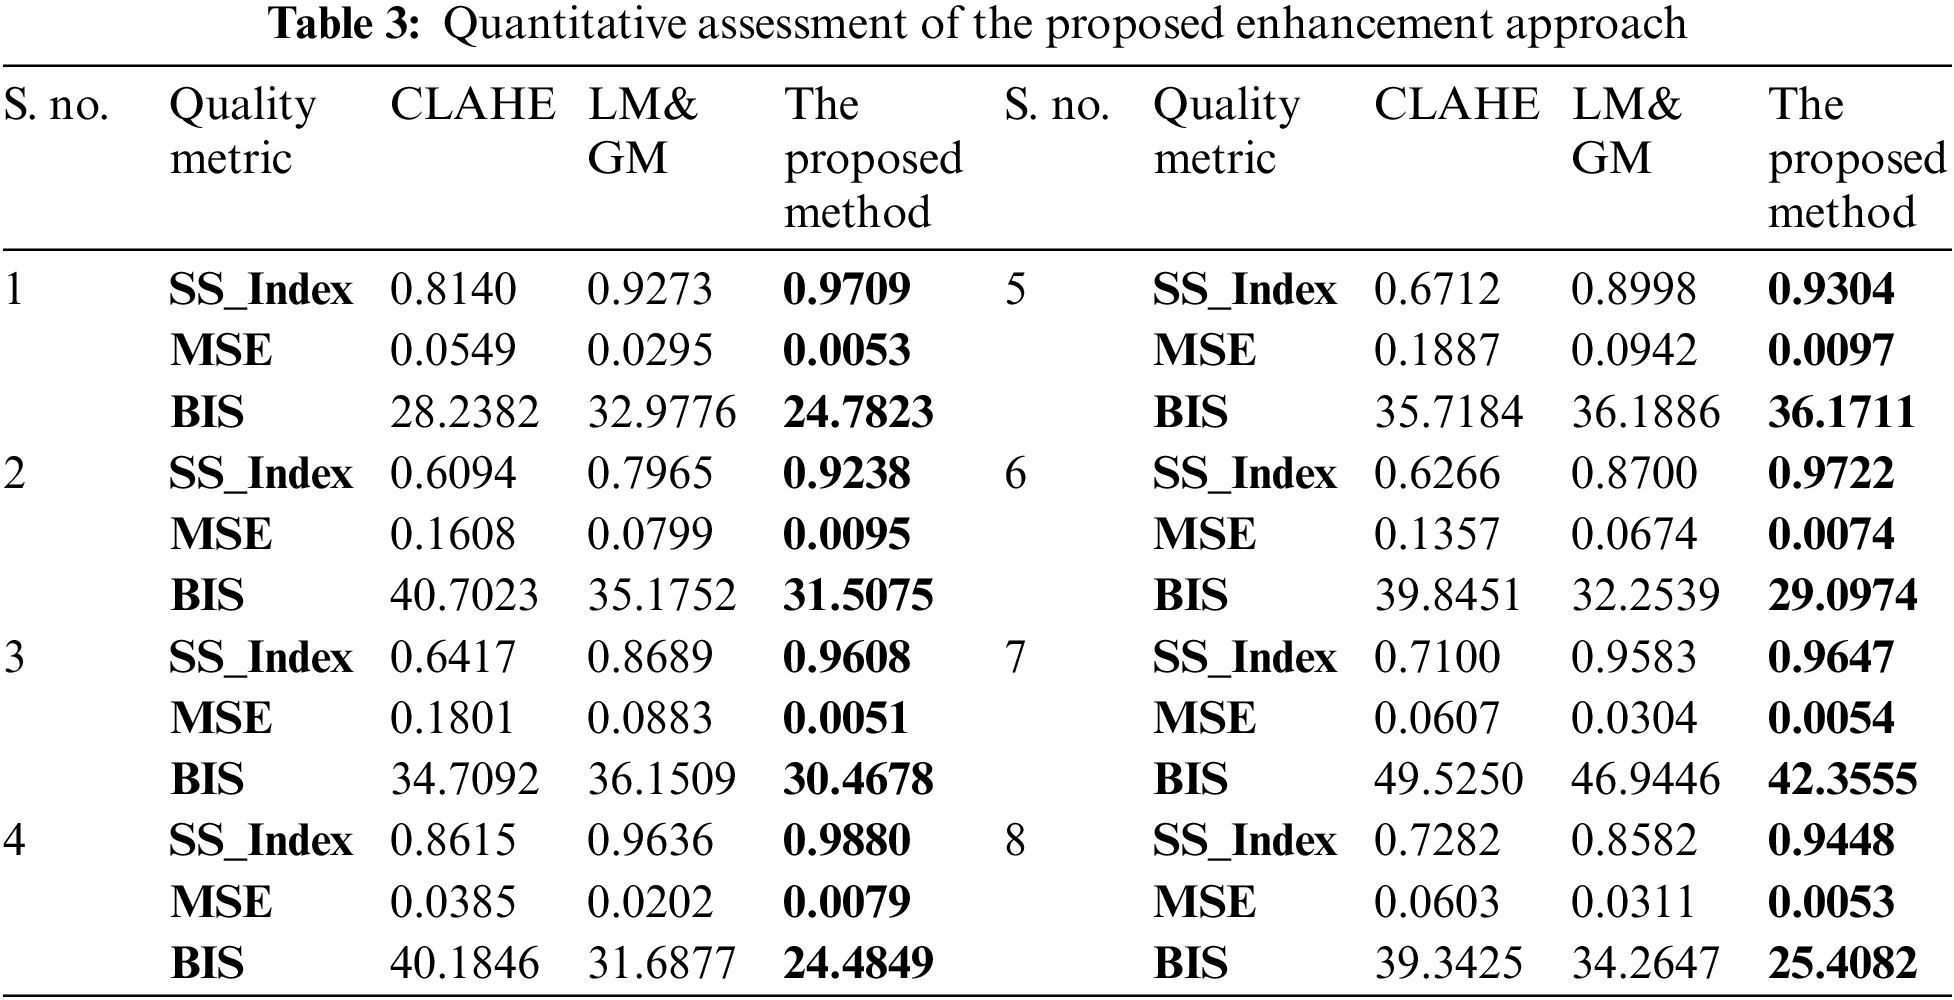
The quantitative assessment of the proposed enhancement approach is carried out using three quality metrics: (i) Structural Similarity Index (SS_Index): It measures the image similarity, which is a product of image structure, contrast, and luminance, (ii) Mean Square Error (MSE): It measures the difference between original and enhanced images. A lower MSE value indicates qualitative image enhancement, and (iii) Blind Image Spatial quality (BIS): It is a blind (no reference) image spatial measurement for image quality. It returns a non-negative value between [0, 100]. The lower value indicates a better qualitative image. All these measures for the same sample images from Fig. 5 are reported in Table 3.
The histogram plots in Fig. 6 show the performance of the proposed enhancement over other existing approaches. The proposed enhancement keeps the images’ texture similarity (Fig. 6a) much closer to the original images, and the MSE values (Fig. 6b) are significantly lower than those of the CLAHE and LM&GM-based enhanced images. The proposed methodology has achieved qualitatively enhanced retinal images in terms of spatial measurement, i.e., BIS (Fig. 6c), compared to the other approaches.
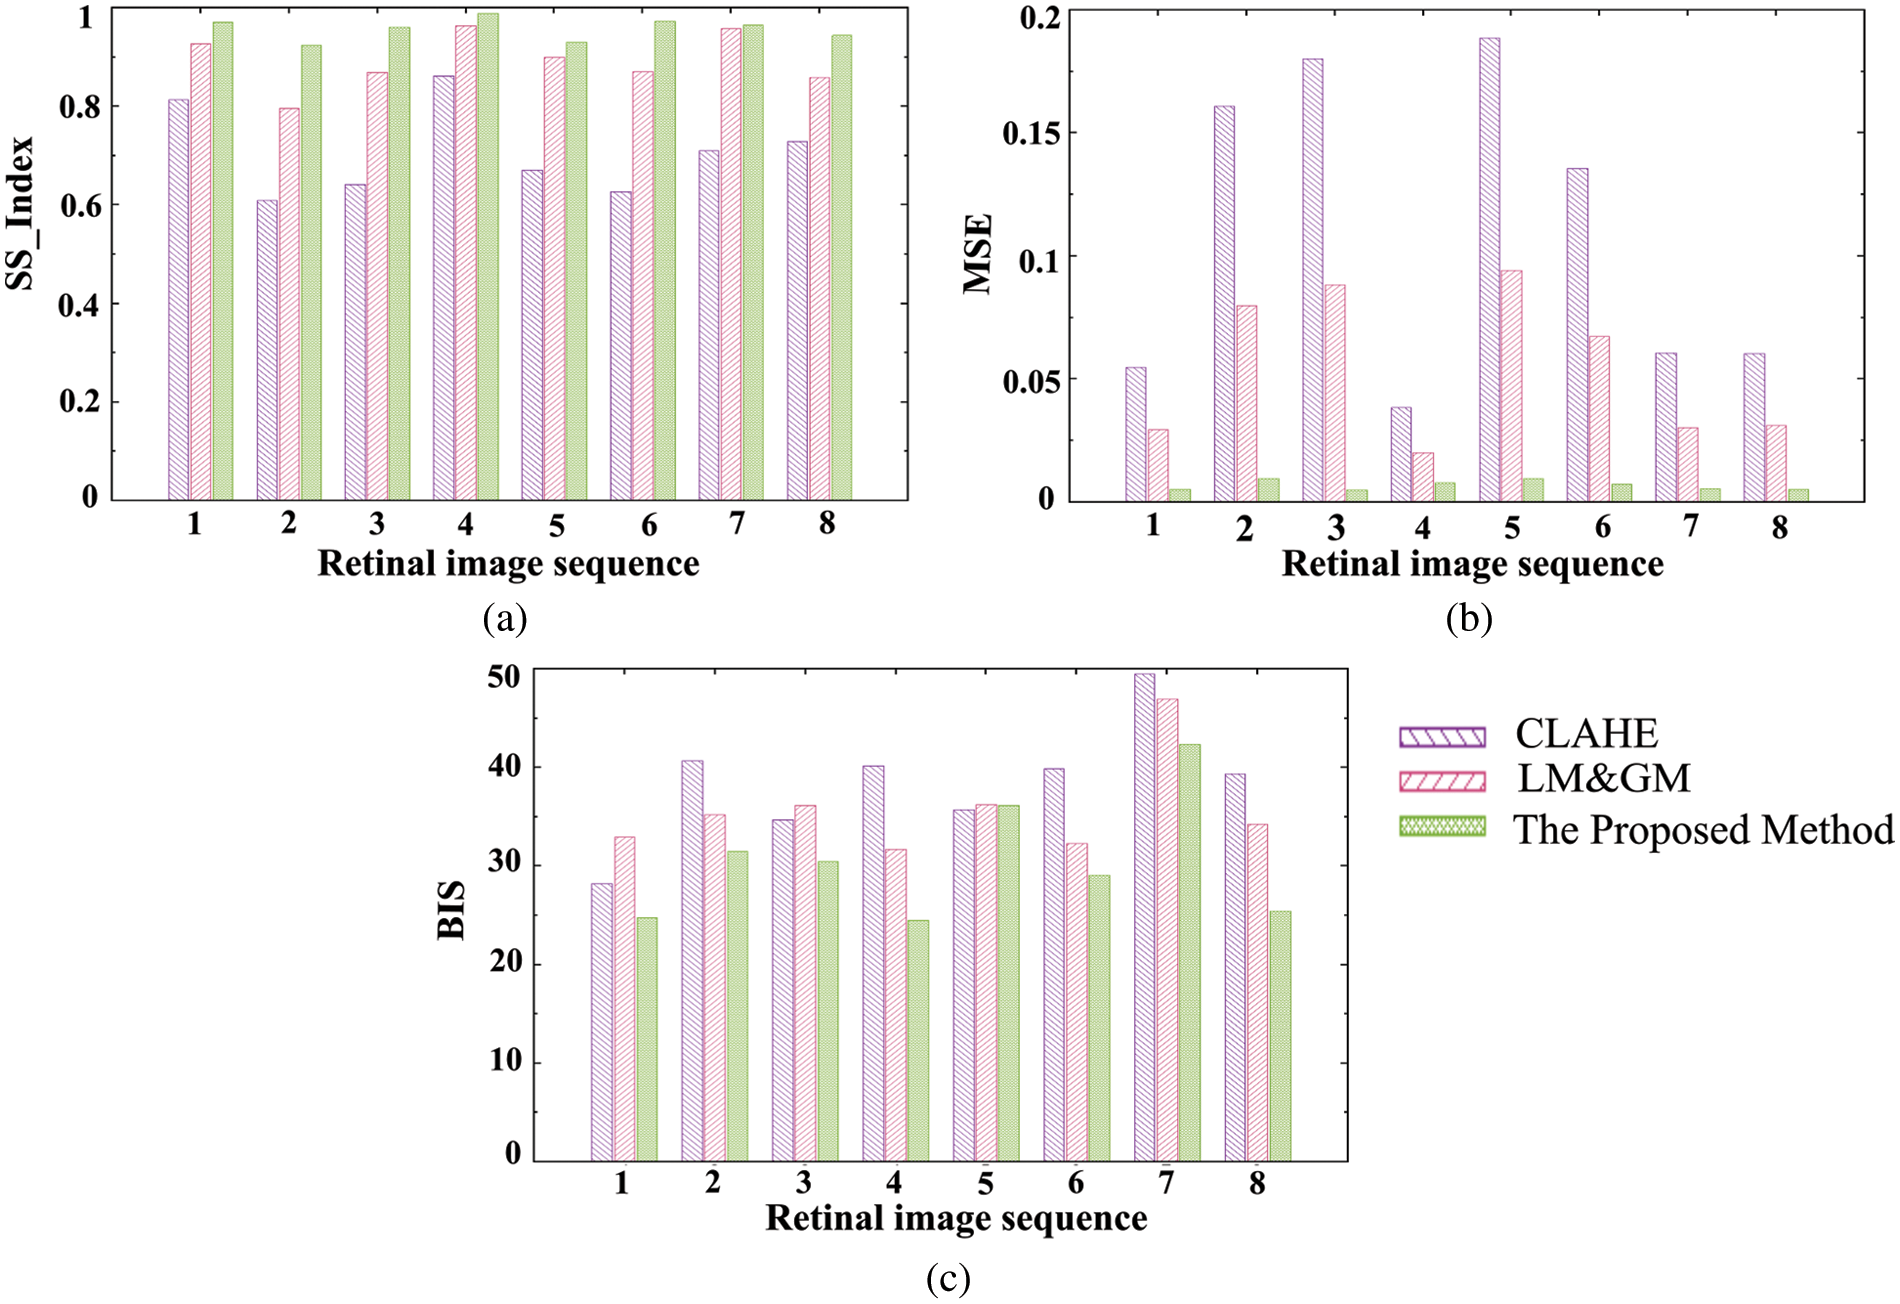
Figure 6: Image quality assessment plots by various measures: (a) SS_Index, (b) MSE, and (c) BIS
In this approach, six undirected graphs are built for each retinal image, accounting for all RM values using DTW trajectories. Sample retinal image-mapped graphs (for images in Fig. 5) are shown in Fig. 7. Each DWT and RM combination produced a distinct topological complex graph. This crucial property enables the proposed approach to retrieve significant texture patterns. The architecture of each graph depends on the images’ DWT coefficient inter-relationships. Unlike conventional graphs, the DWT-DTW-based graph’s structurality will dynamically change according to the image’s texture, which can capture all possible patterns. This characteristic of the DWT-DTW approach is essential for analyzing retinal (medical) image textures.
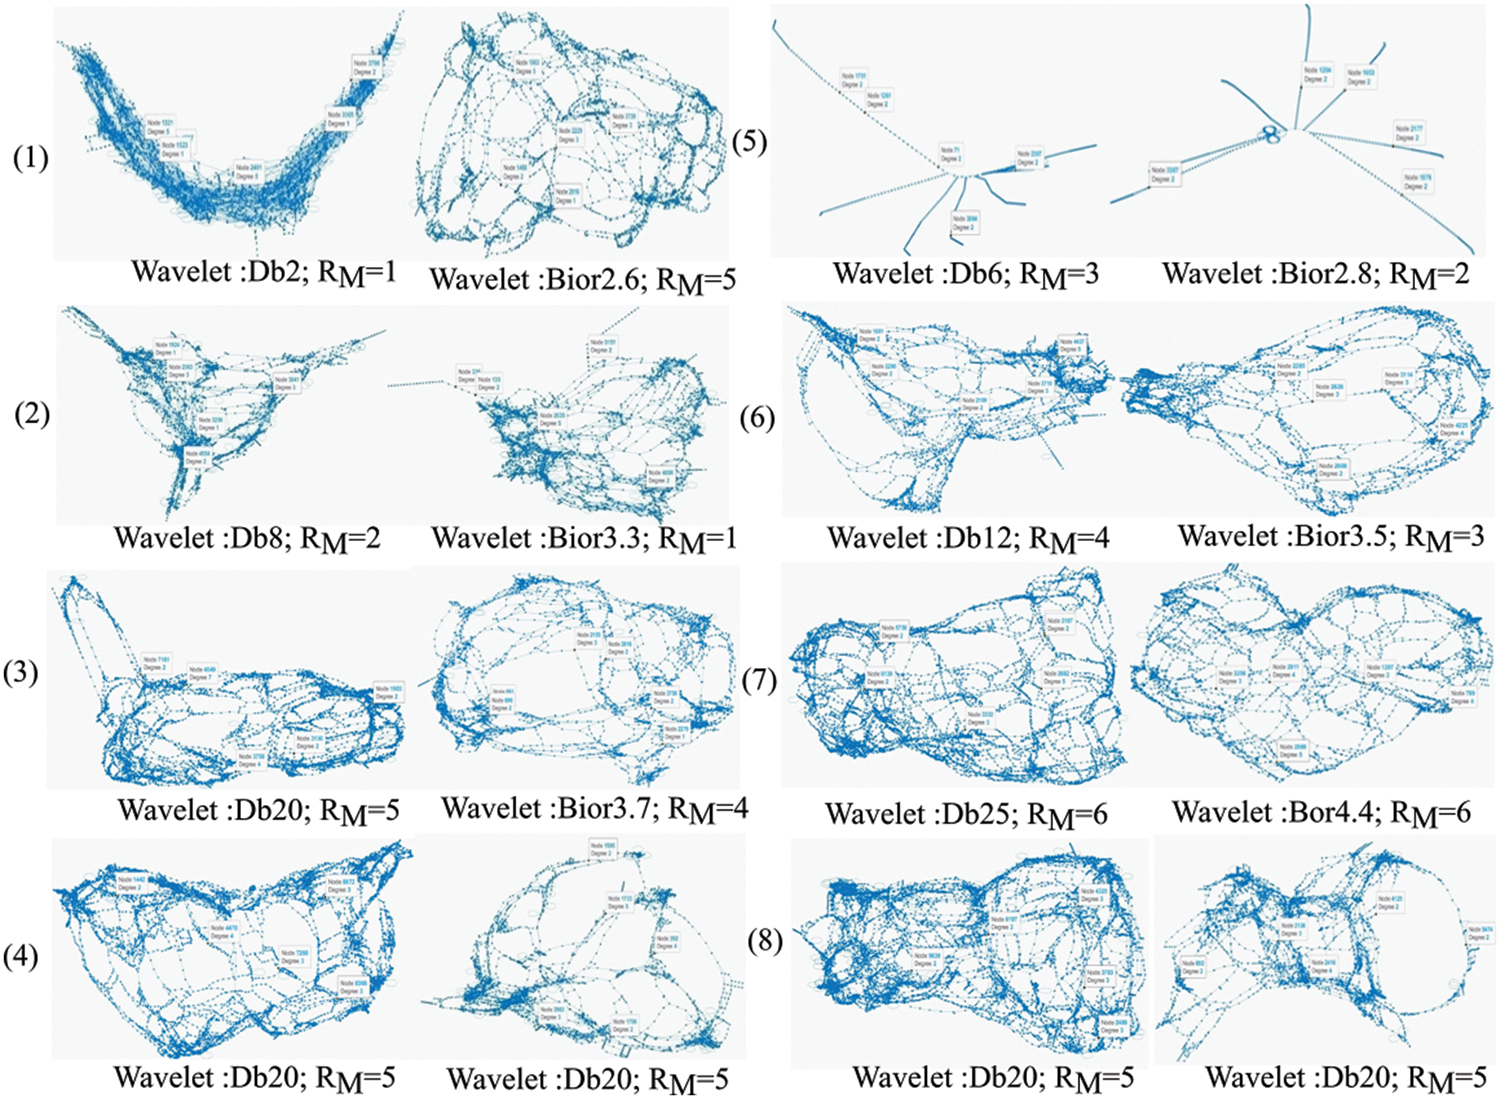
Figure 7: Sample graphs generated from retinal image mapping using the DWT-DTW approach
Once all the DWT-DTW graphs are generated, graph-based features are extracted to form feature vectors (
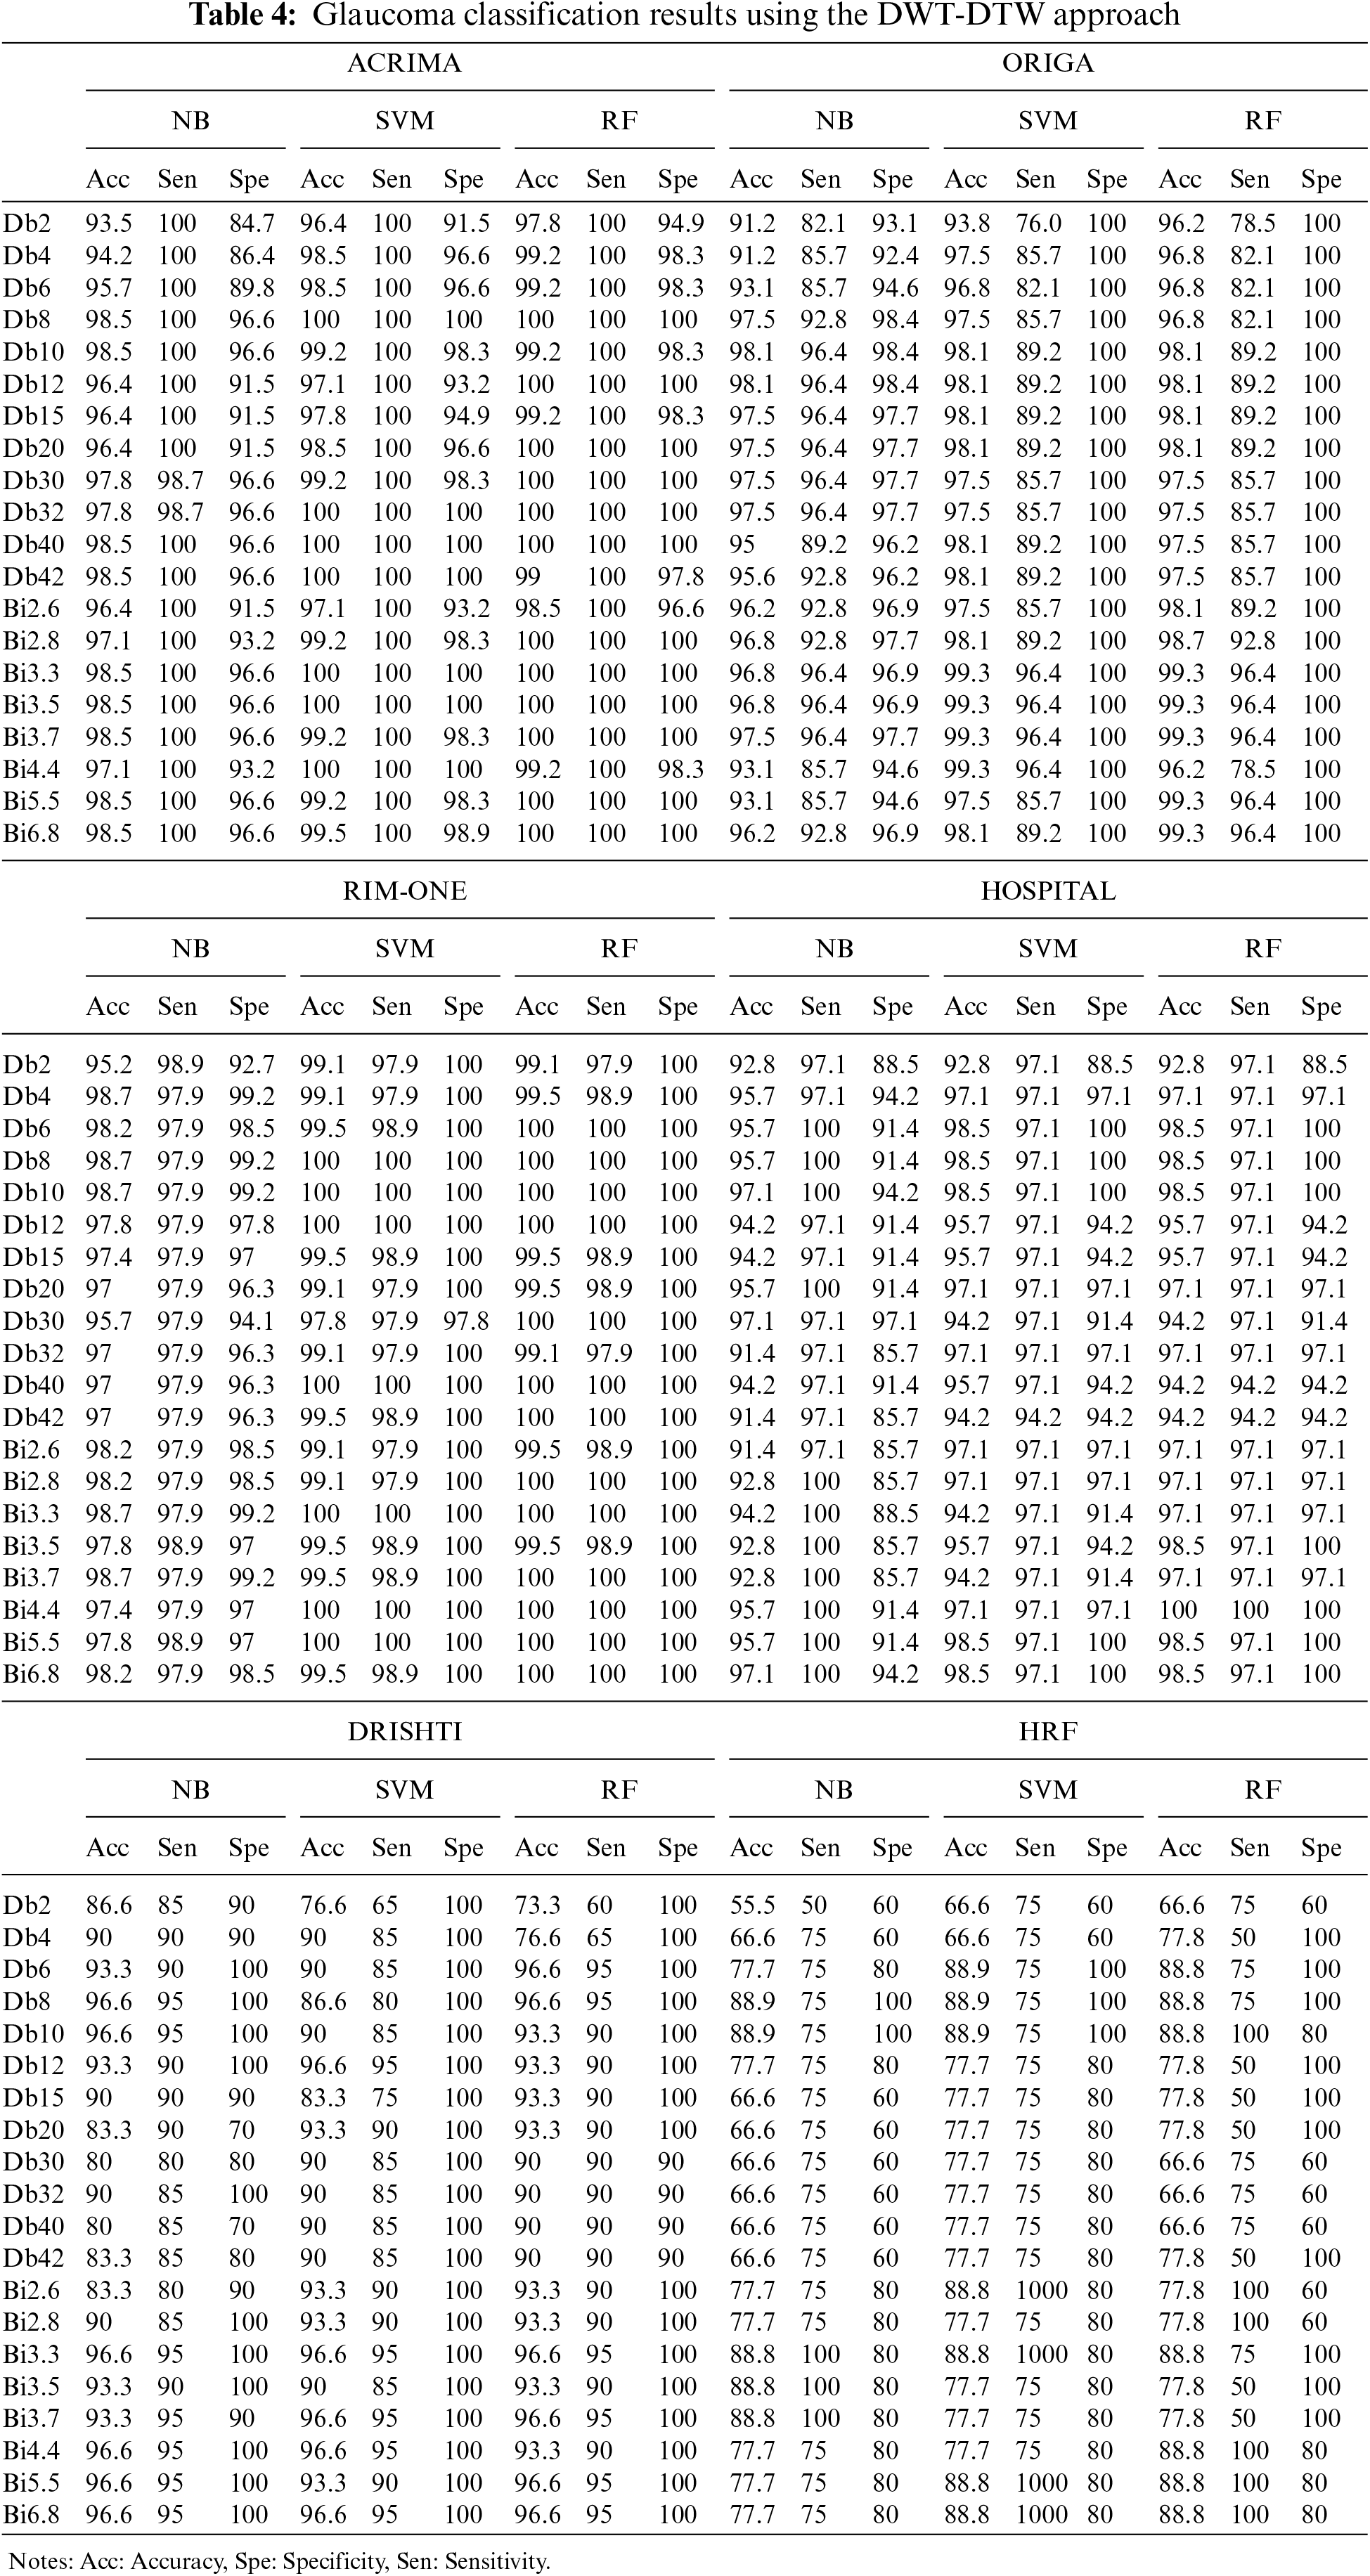
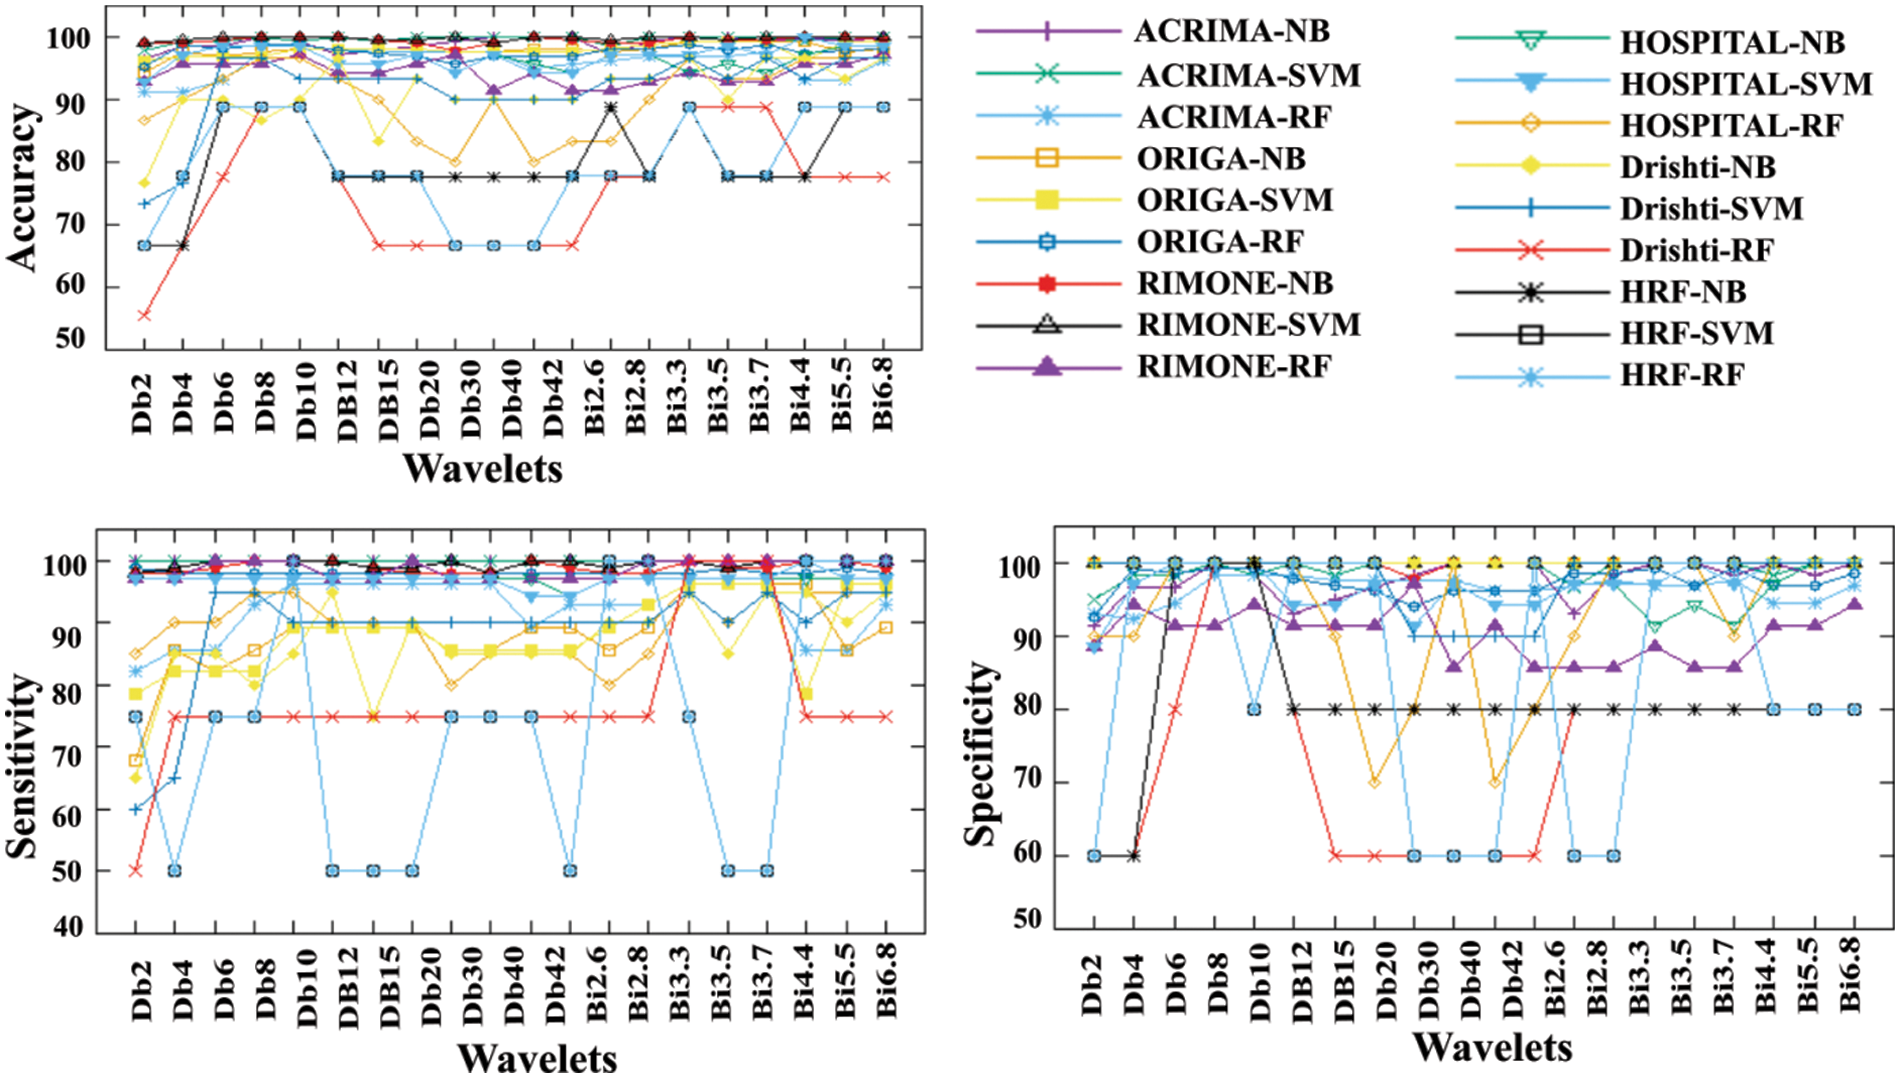
Figure 8: The DWT-DTW glaucoma classification (a) accuracy, (b) sensitivity, and (c) specificity graphs
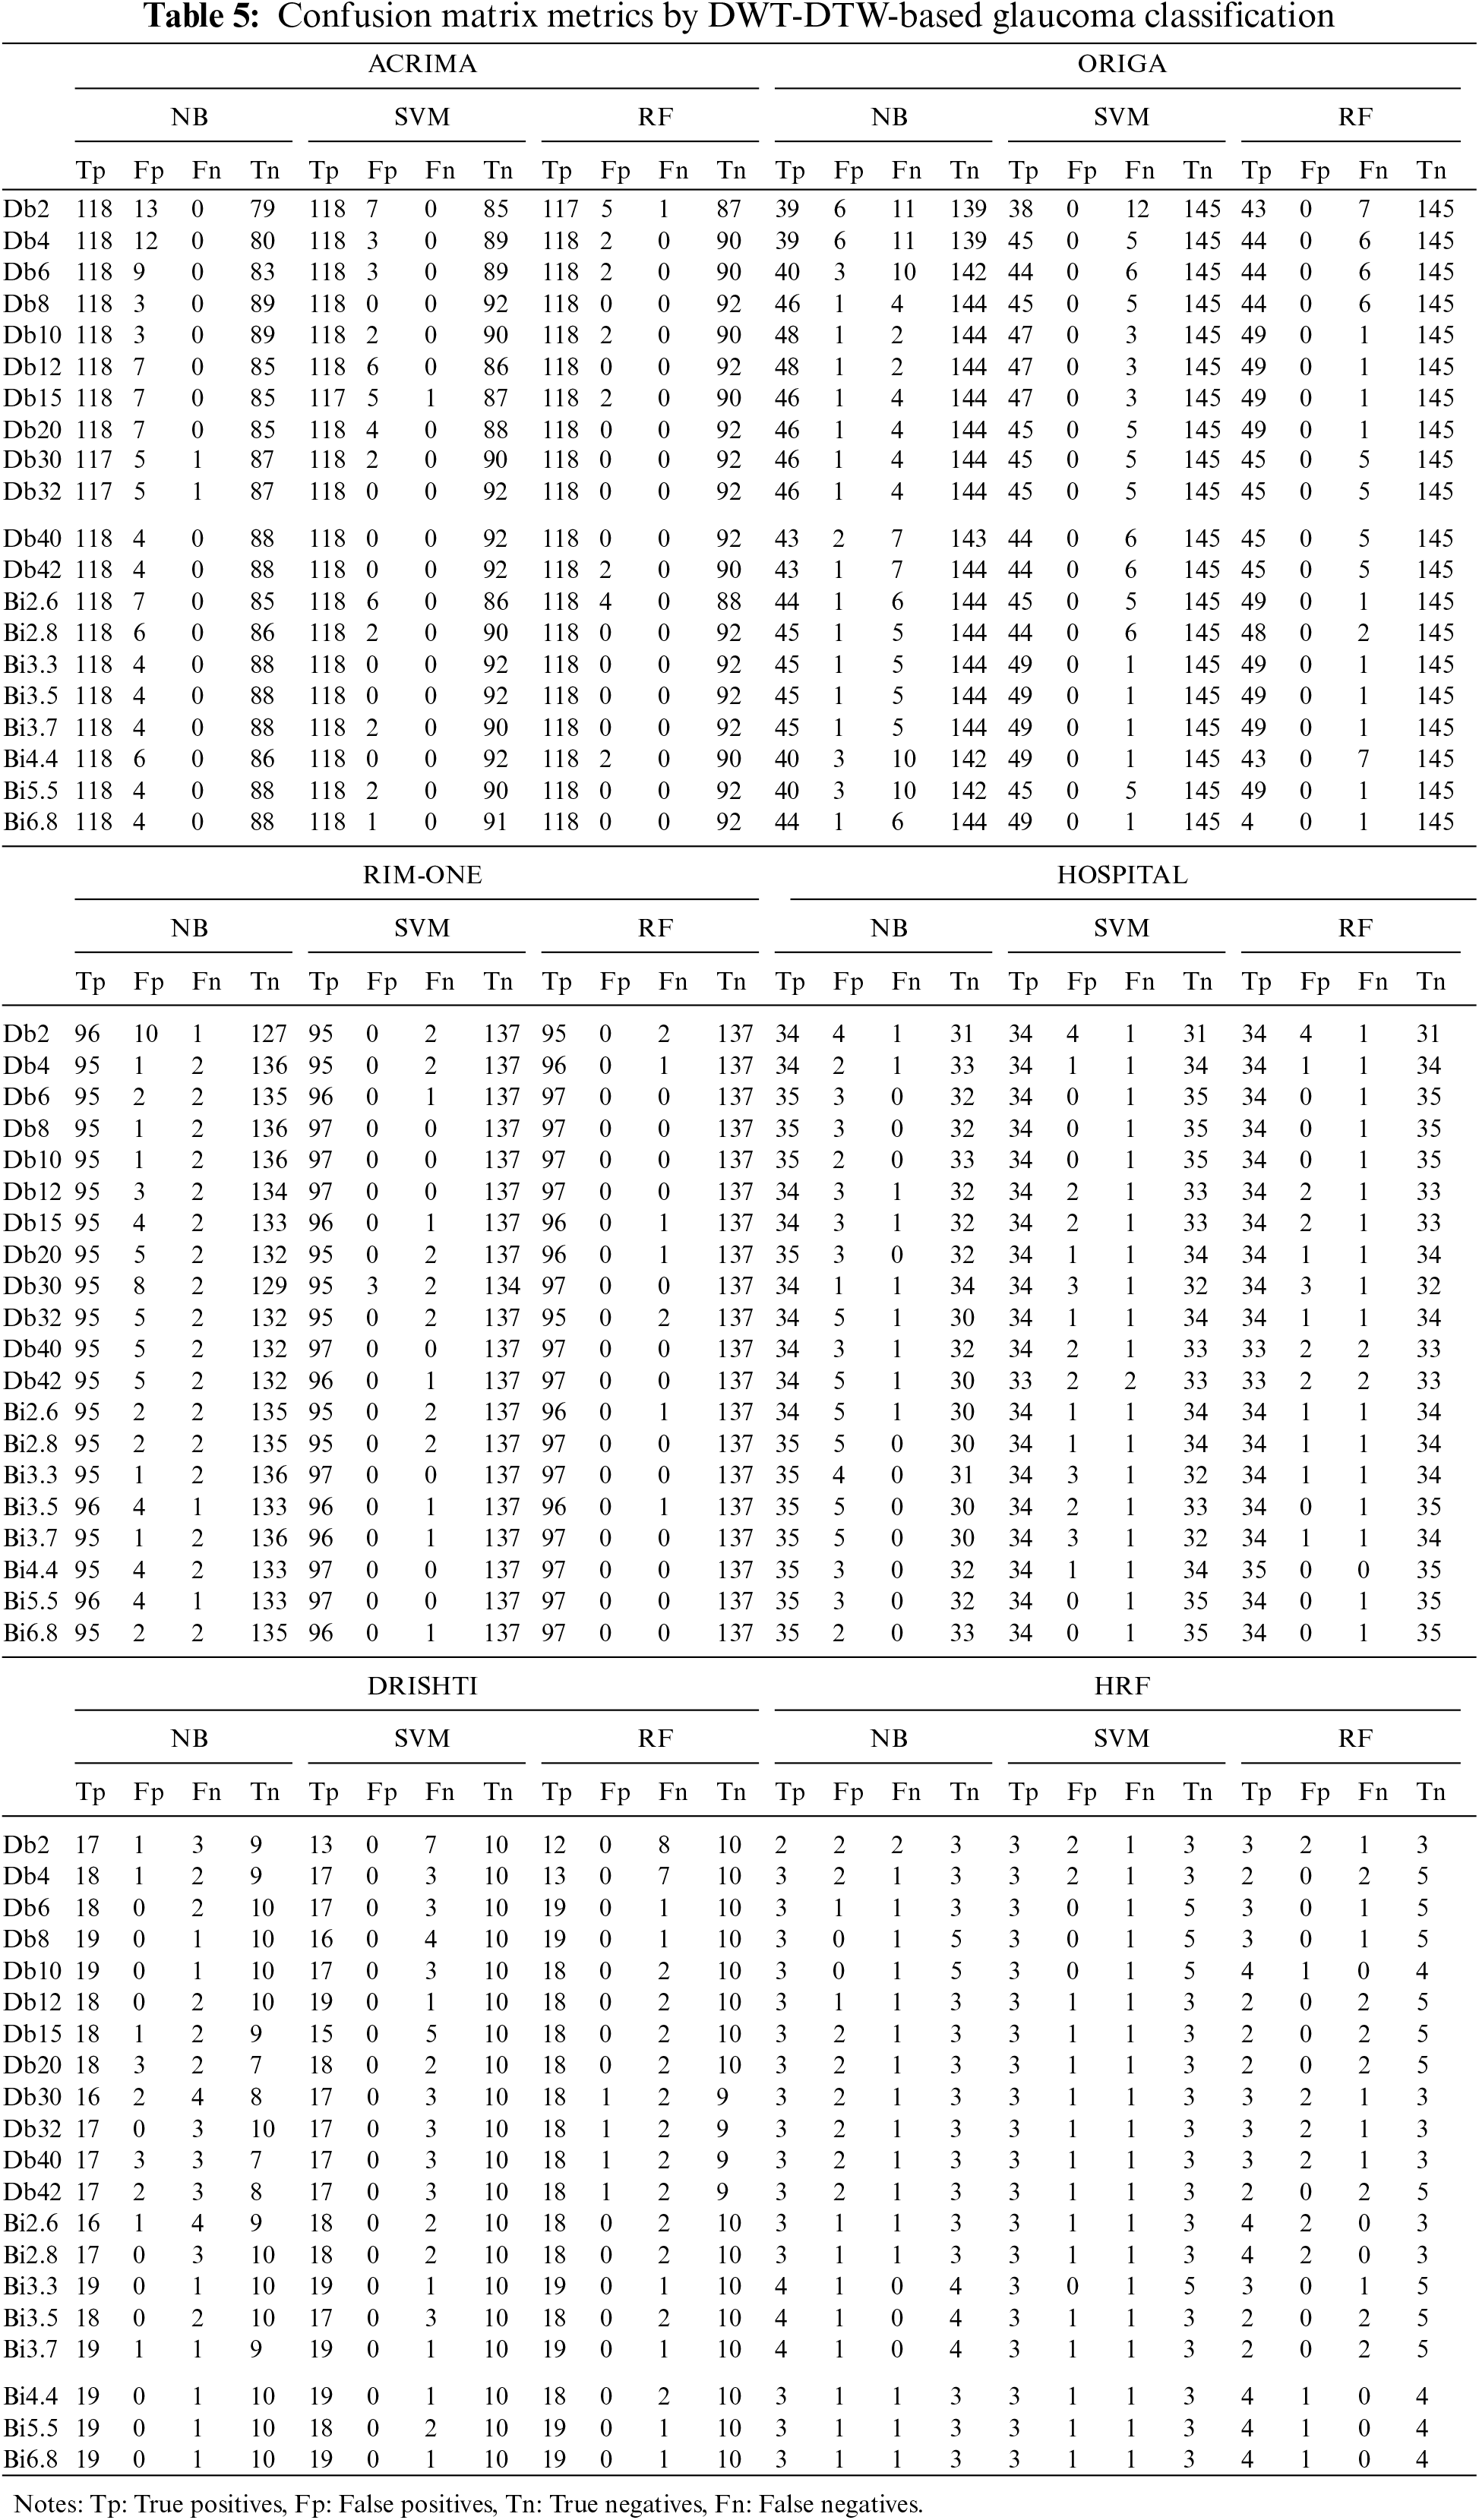
Due to the moderate patient data size, the NB classifier has attained lower classification accuracy than other cases. In this DWT-DTW approach, the performance plots of all classifiers with RIM-ONE data are more consistent and reliable. More fluctuations are seen in classification accuracy plots by orthogonal wavelets than by biorthogonal wavelets. Referring to the other classification measures, the proposed approach has more stable true-negative prediction rates (i.e., specificity) than true-positive prediction rates (i.e., sensitivity). Because regularity improves with the order, all performance plots hit the minimal values only with the lower-order orthogonal wavelets rather than with the higher-order orthogonal and biorthogonal wavelets. The corresponding confusion matrix metrics, such as true and false positives and negatives, are shown in Table 5. The proposed approach has either 0 or 1 false-negative prediction, with a maximum of 9 false-positive predictions for the ACRIMA dataset. In the case of ORIGA data, the approach has both types of false predictions with the NB classifier but zero false-positive predictions with other classifiers. This approach has very few incorrect predictions with RIM-ONE data. The proposed approach has generated a considerably lower range of incorrect predictions in the patient retinal dataset case. In the case of the Drishti dataset, the approach has higher true-negative predictions by all three classifiers. This approach also achieved steady, correct predictions with the HRF dataset.
The proposed DWT-DTW glaucoma classification approach’s performance has been compared with similar state-of-the-art methods, as shown in Table 6. Irrespective of feature extraction approaches, the SVM classifier is widely used. Several approaches have attained an accuracy range above 97% with the RIM-ONE dataset. The highest classification measures reported [23] among existing methods are 97.6% accuracy, 94.33% sensitivity, and 99.09% specificity in various cases. The application of the time-frequency domain (i.e., DWT) is utilized by several approaches [24] and [25] for feature extraction. In the case of patient retinal data, the performance of the existing approaches [26] and [27] is moderately low.
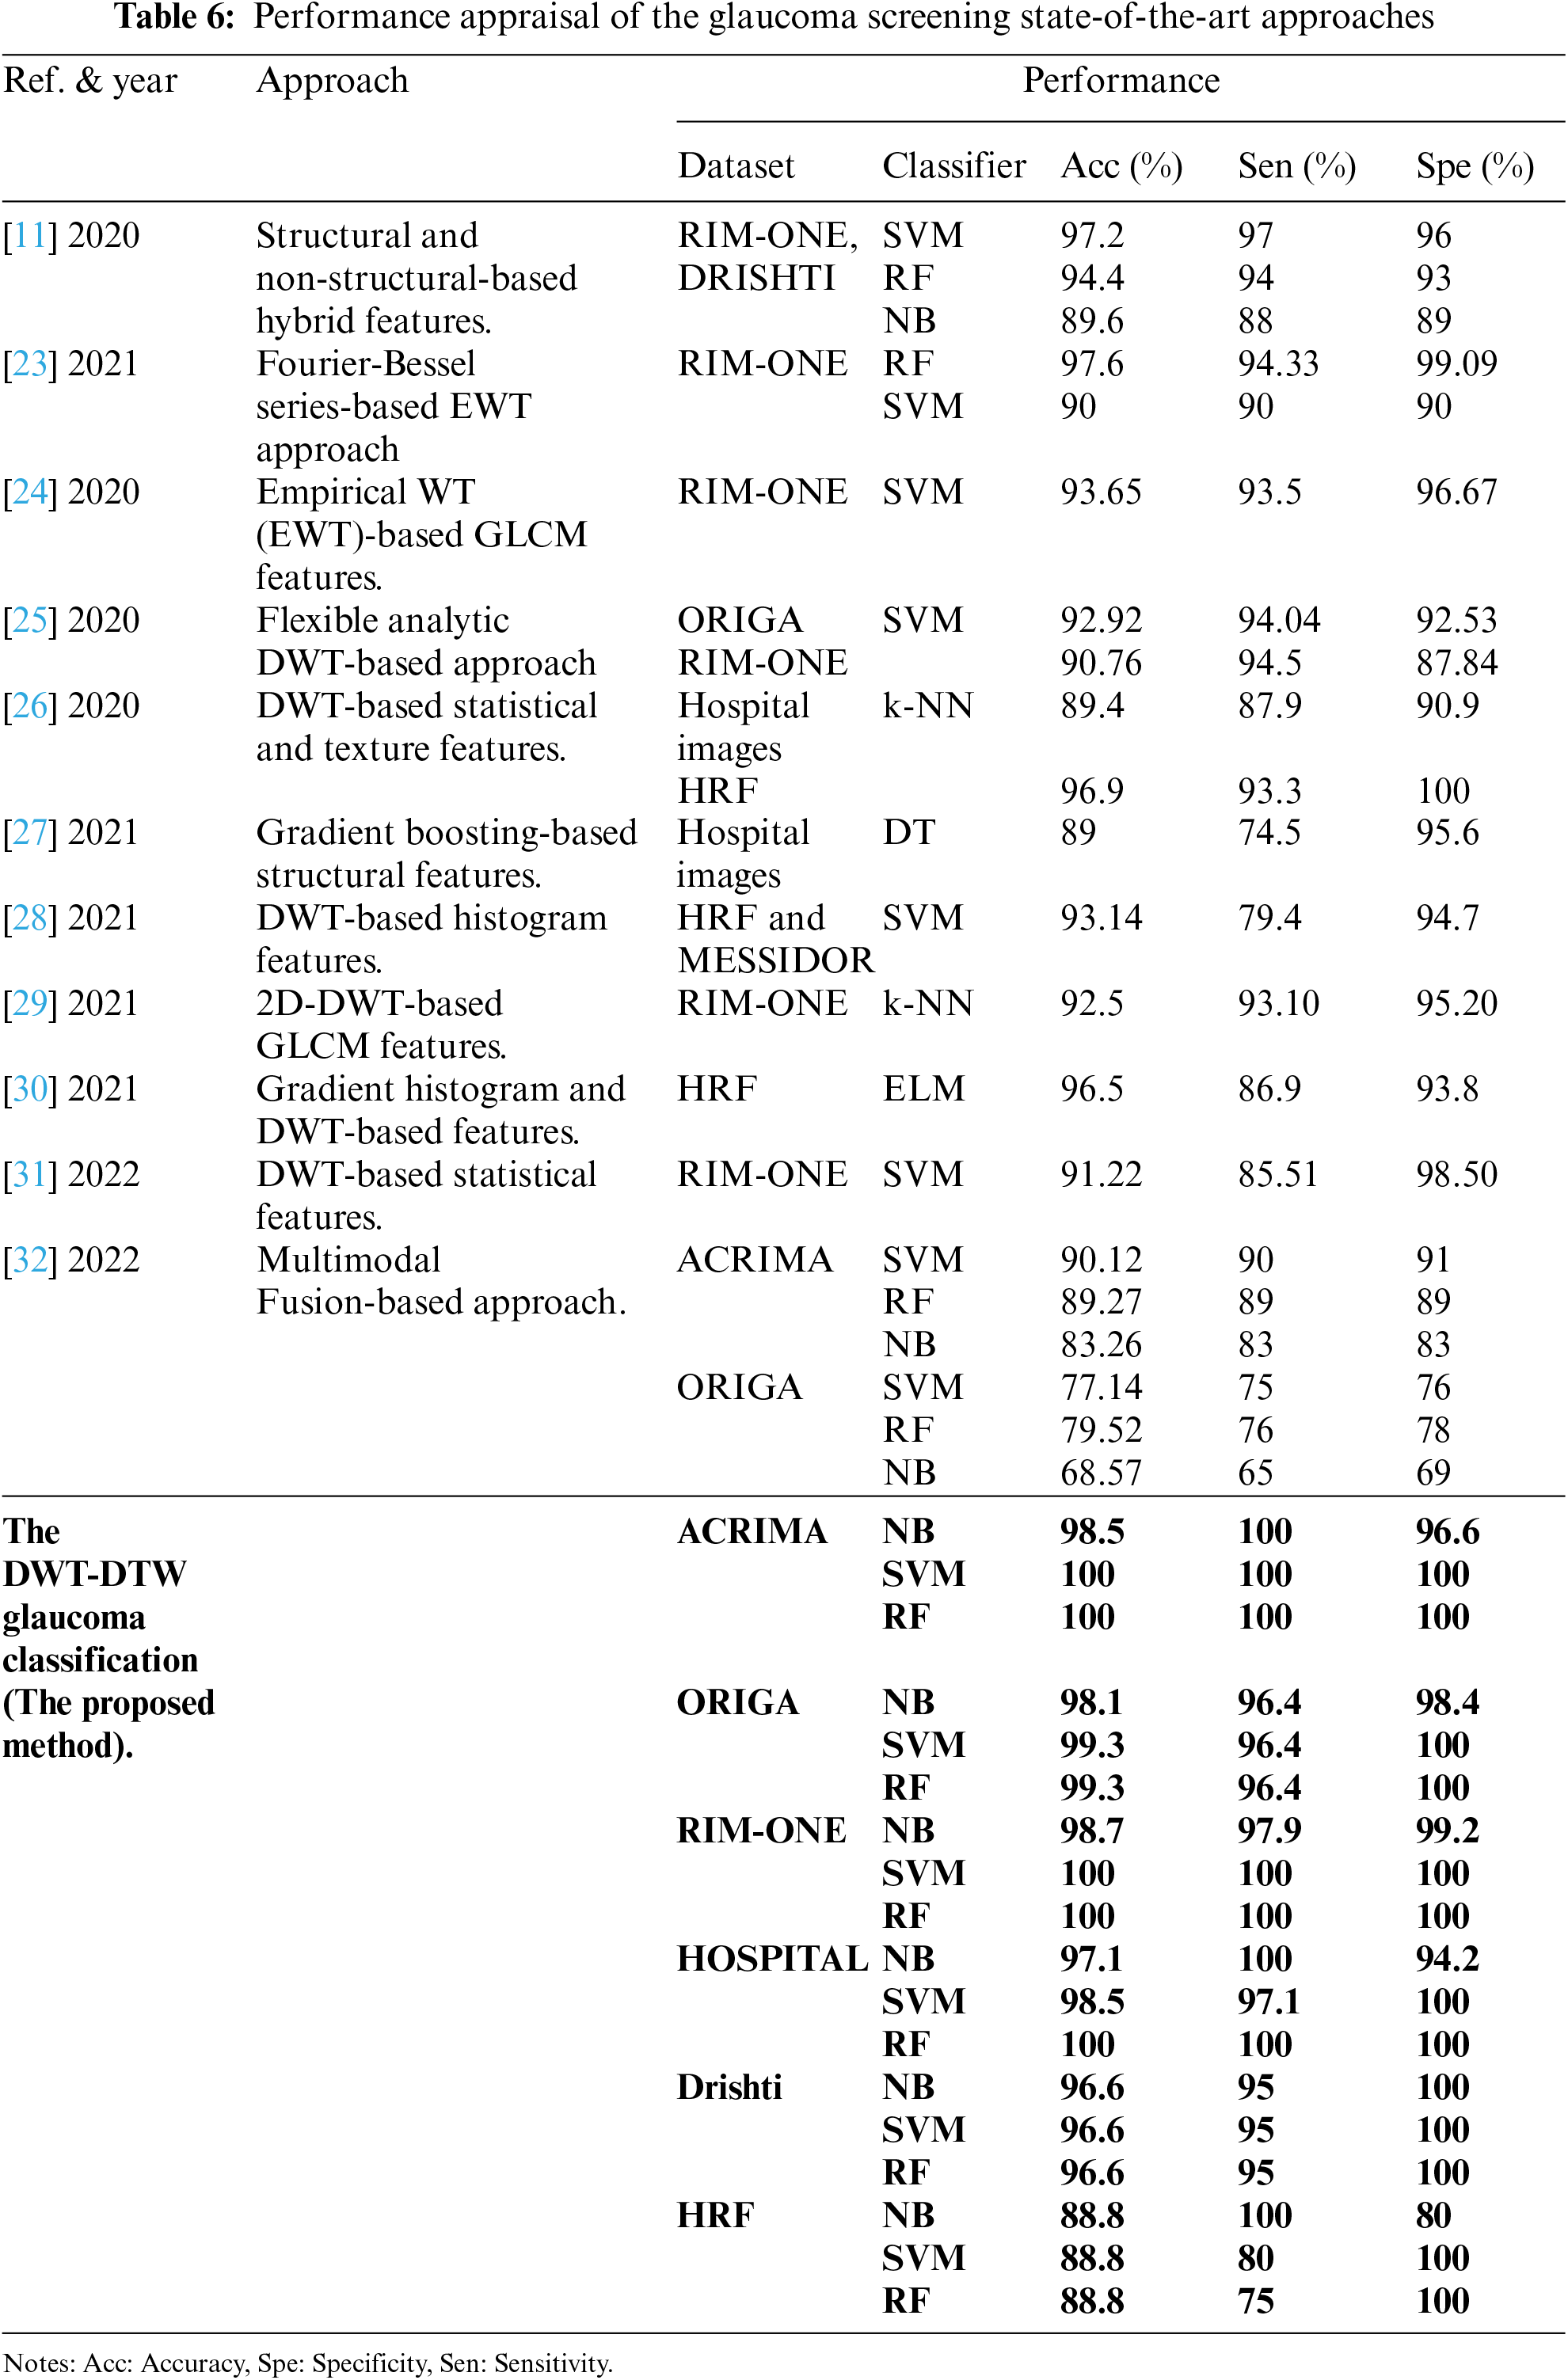
In the proposed approach, using DWT-DTW-based retinal image features, NB classifiers attained 98.5%, 98.1%, 98.7%, 96.6%, 88.8%, and 97.1% accuracies on the ACRIMA, ORIGA, RIM-ONE, Drishti, HRF, and HOSPITAL datasets, respectively. The SVM and RF classifiers attained similar performance, i.e., 100%, 99.3%, 100%, 96.6%, 88.8%, and 98%–100% accuracy on the considered datasets, respectively. In the case of patients’ retinal datasets, this approach has attained 97% accuracy with extremely high correct prediction rates.
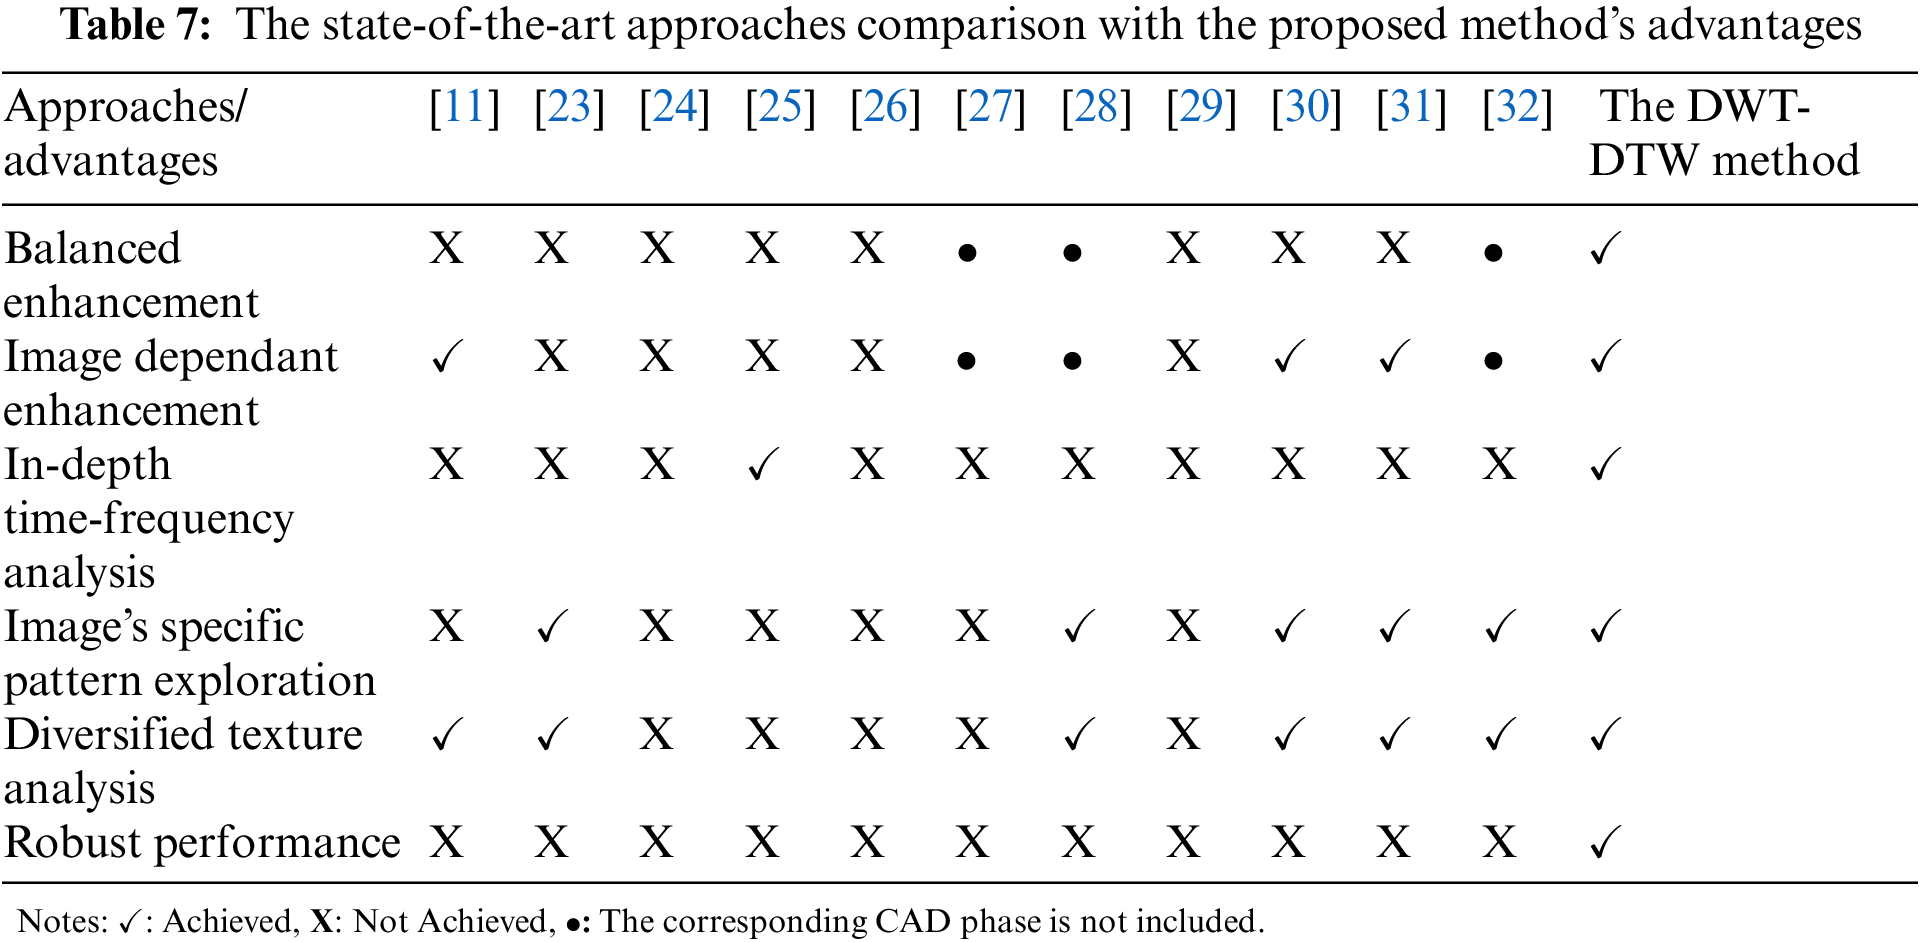
The optimal performance of the DWT-DTW method is due to an extensive retinal texture enhancement and analysis, which offers the following benefits:
• Pre-processing:
1. Balanced enhancement: Images’ textures, as well as illumination, are jointly improved.
2. Image-dependent enhancement: The enhancement process considered image-specific details rather than manually supplied constant values.
• Feature extraction and classification:
1. In-depth time-frequency analysis: An extensive image’s time-frequency domain analysis has been done using various wavelets for texture identification.
2. Image’s specific pattern exploration: Image texture-dependent methodologies (such as image-mapped graphs) are utilized in pattern extraction.
3. Diversified texture analysis: Each image texture is analyzed in various dimensions using special techniques (such as different graph architectures).
4. Robust performance: The classification performs well on public retinal repositories and patients’ retinal data.
These advantages are compared with the state-of-the-art approaches (from Table 6). The summarized report has been given in Table 7. It shows a strong reason for using the DWT-DTW method for glaucoma classification rather than existing approaches.
Further, the phase-wise research findings of the proposed CAD-based glaucoma screening method are as follows:
• Retinal image pre-processing: (i) Qualitative retinal images have been generated due to enhancement of the images’ luminance and texture; (ii) The suggested approach improves the images without affecting the original texture using image-specific characteristics.
• Retinal image feature extraction: (i) DTW trajectories corresponding to various wavelets’ coefficients and RM values enable us to extract significant image texture patterns; and (ii) Various topological graphs make the texture analysis powerful.
• Retinal image classification: (i) Biorthogonal wavelet-based graph features are stronger for glaucoma classification than orthogonal wavelets; (ii) SVM and RF classifiers have achieved high glaucoma classification accuracy.
Overall, it has been determined that the combination of the biorthogonal wavelet family and DTW-based graph theory is optimal for glaucoma screening.
The proposed CAD-based glaucoma classification is a unique approach that utilizes the combination of time-frequency localization and graph theory. Images’ textures are improved in a balanced way using image-dependent details. Various topological graphs have been generated for each retinal image to explore pixels’ neighborhood relationships using in-depth time-frequency analysis. It identifies significant directional texture patterns for accurate screening. Results have proven that the proposed enhancement improves the images’ quality without altering their texture patterns. The proposed DWT-DTW-based glaucoma screening has achieved an average accuracy of 99.5%, 98.9%, 99.56%, 96.6%, 88.8%, and 98.5%, sensitivity of 100%, 96.4%, 99.3%, 95%, 100%, and 99.03%, and specificity of 98.06%, 99.4%, 99.7%, 100%, 80%, and 98.06% on the ACRIMA, ORIGA, RIM-ONE, Drishti, HRF, and HOSPITAL datasets, respectively. Our approach has achieved optimal performance for biorthogonal DTW and RF or SVM classifiers combination. Moreover, the DWT-DTW method has achieved highly satisfactory classification accuracy in the case of patient data. The performance of the proposed method has been compared with state-of-the-art methods, and its performance is far better than existing methodologies. Thus, this CAD approach will become a powerful aid for ophthalmologists in providing faster and more accurate glaucoma screening. However, the proposed approach has fewer limitations, which include that the classification accuracy is slightly lower with smaller datasets and that this approach suffers from incorrect predictions for some combinations. These limitations will be addressed in our future work using multi-level graph CNNs.
Acknowledgement: The fundus images used in this study were given by the Goutami Eye Institute, Rajamahendravaram-533105, Andhra Pradesh, India. We would like to express our deep and sincere gratitude to Dr. Y. Srinivas Reddy, M.S. (Ophthal), and Dr. A. Prasanth Kumar, M.S. (Ophthal), for providing corresponding information and the fundus images.
Funding Statement: The authors received no specific funding for this study.
Conflicts of Interest: The authors declare that they have no conflicts of interest to report regarding the present study.
References
1. J. Katz and A. P. Costarides, “Facts vs. fiction: The role of cannabinoids in the treatment of glaucoma,” Current Ophthalmology Reports, vol. 7, no. 3, pp. 177–181, 2019. [Google Scholar]
2. A. C. de Moura Lima, L. B. Maia, R. M. P. Pereira, G. B. Junior, J. D. S. de Almeida et al., “Glaucoma diagnosis over eye fundus image through deep features,” in 2018 25th Int. Conf. on Systems, Signals and Image Processing (IWSSIP), June 2018, Maribor, Slovenia, IEEE, pp. 1–4, 2018. [Google Scholar]
3. M. U. Muthmainah, H. A. Nugroho and B. Winduratna, “Analysis of retinal fundus images for classification of glaucoma,” in 2018 1st Int. Conf. on Bioinformatics, Biotechnology, and Biomedical Engineering-Bioinformatics and Biomedical Engineering, Yogyakarta, Indonesia, IEEE, vol. 1, pp. 1–6, 2018. [Google Scholar]
4. R. Belgacem, I. T. Malek, H. Trabelsi and I. Jabri, “A supervised machine learning algorithm SKVMs used for both classification and screening of glaucoma disease,” New Front. Ophthalmol., vol. 4, no. 4, pp. 1–27, 2018. [Google Scholar]
5. M. Christopher, A. Belghith, R. N. Weinreb, C. Bowd, M. H. Goldbaum et al., “Retinal nerve fiber layer features identified by unsupervised machine learning on optical coherence tomography scans predict glaucoma progression,” Investigative Ophthalmology & Visual Science, vol. 59, no. 7, pp. 2748–2756, 2018. [Google Scholar]
6. G. An, K. Omodaka, K. Hashimoto, S. Tsuda, Y. Shiga et al., “Glaucoma diagnosis with machine learning based on optical coherence tomography and color fundus images,” Journal of Healthcare Engineering, vol. 2019, pp. 48–57, 2019. [Google Scholar]
7. Z. U. Rehman, S. S. Naqvi, T. M. Khan, M. Arsalan, M. A. Khan et al., “Multi-parametric optic disc segmentation using super pixel-based feature classification,” Expert Systems with Applications, vol. 120, pp. 461–473, 2019. [Google Scholar]
8. N. A. Mohamed, M. A. Zulkifley, W. M. D. W. Zaki and A. Hussain, “An automated glaucoma screening system using cup-to-disc ratio via simple linear iterative clustering super pixel approach,” Biomedical Signal Processing and Control, vol. 53, no. 7, pp. 101454, 2019. [Google Scholar]
9. S. Oh, Y. Park, K. J. Cho and S. J. Kim, “Explainable machine learning model for glaucoma diagnosis and its interpretation,” Diagnostics, vol. 11, pp. 11, 2021. [Google Scholar]
10. P. Thomas, T. Chan, T. Nixon, B. Muthusamy and A. White, “Feasibility of simple machine learning approaches to support detection of non-glaucomatous visual fields in future automated glaucoma clinics,” Eye, vol. 33, no. 7, pp. 1133–1139, 2019. [Google Scholar] [PubMed]
11. N. Thakur and M. Juneja, “Classification of glaucoma using hybrid features with machine learning approaches,” Biomedical Signal Processing and Control, vol. 62, pp. 102137, 2020. [Google Scholar]
12. P. Shanmugam, J. Raja and R. Pitchai, “An automatic recognition of glaucoma in fundus images using deep learning and random forest classifier,” Applied Soft Computing, vol. 109, pp. 107512, 2021. [Google Scholar]
13. S. Nawaldgi and Y. S. Lalitha, “Automated glaucoma assessment from color fundus images using structural and texture features,” Biomedical Signal Processing and Control, vol. 77, pp. 103875, 2022. [Google Scholar]
14. M. K. Gajendran, L. J. Rohowetz, P. Koulen and A. Mehdizadeh, “Novel machine-learning based framework using electro-retinography data for the detection of early-stage glaucoma,” Frontiers in Neuroscience, vol. 16, 2022. [Google Scholar]
15. R. K. Patel and M. Kashyap, “Automated screening of glaucoma stages from retinal fundus images using BPS and LBP based GLCM features,” International Journal of Imaging Systems and Technology, vol. 33, pp. 246–261, 2022. [Google Scholar]
16. A. Rebinth and S. M. Kumar, “Glaucoma diagnosis based on color and spatial features using kernel SVM,” Cardiometry, no. 22, pp. 508–515, 2022. [Google Scholar]
17. A. R. Arsyan and W. F. Al Maki, “Classification of glaucoma using invariant moment methods on k-nearest neighbor and random forest models,” Building of Informatics, Technology and Science (BITS), vol. 3, no. 4, pp. 466–472, 2022. [Google Scholar]
18. P. Elangovan and M. K. Nath, “Glaucoma assessment from color fundus images using convolutional neural network,” International Journal of Imaging Systems and Technology, vol. 31, no. 2, pp. 955–971, 2021. [Google Scholar]
19. I. J. Mac Cormick, B. M. Williams, Y. Zheng, K. Li, B. Al-Bander et al., “Accurate, fast, data efficient and interpretable glaucoma diagnosis with automated spatial analysis of the whole cup to disc profile,” PloS One, vol. 14, no. 1, pp. e0209409, 2019. [Google Scholar] [PubMed]
20. Goutami Eye Institute.1, RV Nagar, Rajamahendravaram–533105, AP, India, Website: www.goutami.org [Google Scholar]
21. C. Zhao, Z. Wang, H. Li, X. Wu, S. Qiao et al., “A new approach for medical image enhancement based on luminance-level modulation and gradient modulation,” Biomedical Signal Processing and Control, vol. 48, pp. 189–196, 2019. [Google Scholar]
22. A. W. Setiawan, T. R. Mengko, O. S. Santoso and A. B. Suksmono, “Color retinal image enhancement using CLAHE,” in Int. Conf. on ICT for Smart Society, IEEE, pp. 1–3, 2013. [Google Scholar]
23. P. K. Chaudhary and R. B. Pachori, “Automatic diagnosis of glaucoma using two-dimensional Fourier-bessel series expansion based empirical wavelet transform,” Biomedical Signal Processing and Control, vol. 64, pp. 102237, 2021. [Google Scholar]
24. D. Parashar and D. K. Agrawal, “Automatic classification of glaucoma stages using two-dimensional tensor empirical wavelet transform,” IEEE Signal Processing Letters, vol. 28, pp. 66–70, 2020. [Google Scholar]
25. D. Parashar and D. K. Agrawal, “Automated classification of glaucoma stages using flexible analytic wavelet transform from retinal fundus images,” IEEE Sensors Journal, vol. 20, no. 21, pp. 12885–12894, 2020. [Google Scholar]
26. L. Abdel-Hamid, “Glaucoma detection from retinal images using statistical and textural wavelet features,” Journal of Digital Imaging, vol. 33, no. 1, pp. 151–158, 2020. [Google Scholar] [PubMed]
27. C. S. F. Escamez, E. M. Giral, S. P. Martinez and N. T. Fernandez, “High interpretable machine learning classifier for early glaucoma diagnosis,” International Journal of Ophthalmology, vol. 14, no. 3, pp. 393, 2021. [Google Scholar]
28. F. Ajesh, R. Ravi and G. Rajakumar, “Early diagnosis of glaucoma using multi-feature analysis and DBN based classification,” Journal of Ambient Intelligence and Humanized Computing, vol. 12, no. 3, pp. 4027–4036, 2021. [Google Scholar]
29. D. Parashar and D. Agrawal, “Improved classification of glaucoma in retinal fundus images using 2D-DWT,” in 2021 Int. Conf. on Advances in Electrical, Computing, Communication and Sustainable Technologies (ICAECT), IEEE, pp. 1–5, 2021. [Google Scholar]
30. N. J. Shyla and W. S. Emmanuel, “Automated classification of glaucoma using DWT and HOG features with extreme learning machine,” in 2021 Third Int. Conf. on Intelligent Communication Technologies and Virtual Mobile Networks (ICICV), IEEE, pp. 725–730, 2021. [Google Scholar]
31. S. I. Khan, S. B. Choubey, A. Choubey, A. Bhatt, P. V. Naishadhkumar et al., “Automated glaucoma detection from fundus images using wavelet-based denoising and machine learning,” Concurrent Engineering, vol. 30, no. 1, pp. 103–115, 2022. [Google Scholar]
32. L. K. Singh and M. Khanna, “A novel multimodality based dual fusion integrated approach for efficient and early prediction of glaucoma,” Biomedical Signal Processing and Control, vol. 73, pp. 103468, 2022. [Google Scholar]
Cite This Article
 Copyright © 2023 The Author(s). Published by Tech Science Press.
This work is licensed under a Creative Commons Attribution 4.0 International License , which permits unrestricted use, distribution, and reproduction in any medium, provided the original work is properly cited.
 Downloads
 Citation Tools