
 Submit a Paper
 Propose a Special lssue
 Open Access
ARTICLE

Location and Capacity Determination Method of Electric Vehicle Charging Station Based on Simulated Annealing Immune Particle Swarm Optimization
1 Key Laboratory of Smart Grid of Education Ministry, Tianjin University, Tianjin, 300072, China
2 Tianjin Electric Power Company, State Grid, Tianjin, 300010, China
* Corresponding Author: Yanbo Che. Email:
Energy Engineering 2023, 120(2), 367-384. https://doi.org/10.32604/ee.2023.023661
Received 07 May 2022; Accepted 11 June 2022; Issue published 29 November 2022
 View Full Text
 Download PDF
Abstract
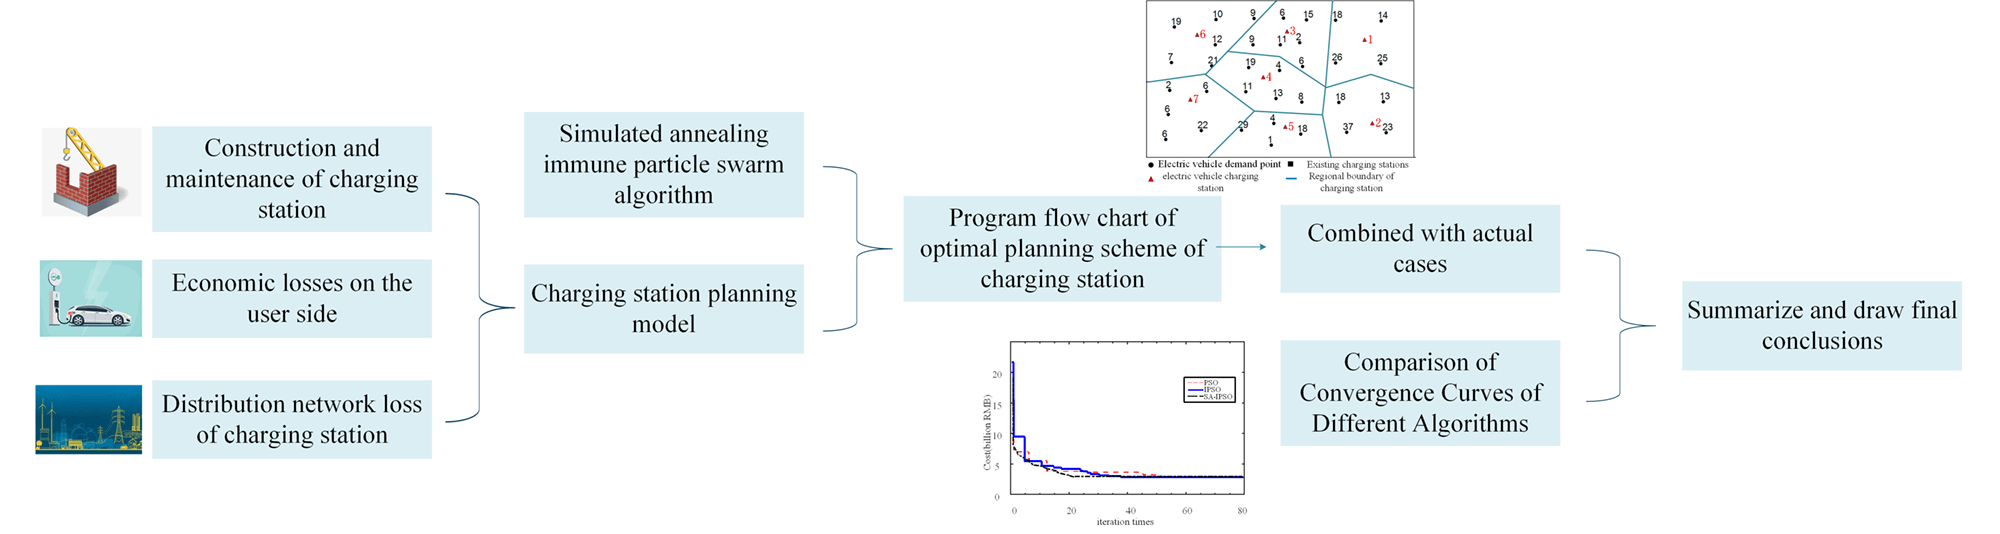
As the number of electric vehicles (EVs) continues to grow and the demand for charging infrastructure is also increasing, how to improve the charging infrastructure has become a bottleneck restricting the development of EVs. In other words, reasonably planning the location and capacity of charging stations is important for development of the EV industry and the safe and stable operation of the power system. Considering the construction and maintenance of the charging station, the distribution network loss of the charging station, and the economic loss on the user side of the EV, this paper takes the node and capacity of charging station planning as control variables and the minimum cost of system comprehensive planning as objective function, and thus proposes a location and capacity planning model for the EV charging station. Based on the problems of low efficiency and insufficient global optimization ability of the current algorithm, the simulated annealing immune particle swarm optimization algorithm (SA-IPSO) is adopted in this paper. The simulated annealing algorithm is used in the global update of the particle swarm optimization (PSO), and the immune mechanism is introduced to participate in the iterative update of the particles, so as to improve the speed and efficiency of PSO. Voronoi diagram is used to divide service area of the charging station, and a joint solution process of Voronoi diagram and SA-IPSO is proposed. By example analysis, the results show that the optimal solution corresponding to the optimisation method proposed in this paper has a low overall cost, while the average charging waiting time is only 1.8 min and the charging pile utilisation rate is 75.5%. The simulation comparison verifies that the improved algorithm improves the operational efficiency by 18.1% and basically does not fall into local convergence.Graphic Abstract
Keywords
With the increasingly urgent energy shortage and global warming, EVs with low emissions and low noise have become a choice for many people to travel [1]. However, compared with traditional fuel vehicles, EVs do not generally occupy the domestic market. Among them, the lack of battery endurance of EVs, unreasonable construction and planning of relevant charging supporting Settings represented by charging stations, inconvenient charging for users and long charging time are all important constraints [2]. In the future, when the number of EVs increases and users’ charging demand increases, the load of EVs will further increase the pressure on the power supply of the distribution network. Therefore, reasonable planning for the location and volume of charging stations to ensure the convenience of users and reduce the impact on the distribution network side has become a top priority in the next development of EV related fields [3].
In recent years, scholars have carried out studies on the problem of siting and capacity determination of EV charging stations. In establishing the charging station planning model, the literature [4] established a charging load estimation model based on the actual measured vehicle arrival hotspot map, fully considered the actual operational constraints of the distribution network, and introduced a multi-objective planning model. The literature [5] provided an overview of electric vehicles and charging station design for various configurations. The charging stations are classified according to the power used, and various optimization algorithms and methods are proposed to obtain the optimal solution. The literature [6] developed a multi-cycle optimization model for EV charging station planning based on the mobile refueling location model and verified the effectiveness of the proposed model by using real traffic flow data of the Korean highway network as an example. The literature [7] proposed a multi-objective collaborative planning strategy for locating EVCS with a mathematical model that aims to simultaneously minimize the total annual investment cost and energy loss and maximize the annual traffic captured by the charging station.
At the level of considerations of the model, literature [8] integrated the cost of multiple, which includes charging time and location identification, and combines these elements to minimize the total minimized operating cost as the objective for optimization analysis. The literature [9] considered constraints in the siting and capacity planning, including parking conditions, land use, traffic density conditions, user-side requirements, etc., and focuses on quantifying the total cost and convenience of the user side for the siting and capacity of charging stations. The literature [10] took uncertainty, qualitative and quantitative factors into account in the siting evaluation and introduces the BN algorithm as a powerful decision tool for siting and capacity selection in the context of power management. The literature [11] focused on the location delineation of urban charging stations, the determination of the power supply range, and the combination of traditional Voronoi diagrams and real-time traffic flow map information to finalize the implementation plan. The above study contains many factors affecting charging station planning and provides new ideas for solving charging station planning problems.
Currently, several algorithms have been applied to the location and capacity planning of charging stations. The literature [12] used an immune clone selection algorithm, which performs a search for the lowest annual cost of the charging station, to arrive at a siting and capacity solution. The literature [13] established a multi-objective charging station planning problem,and combines the hybrid particle swarm optimization (HPSO) algorithm with the entropy-based technique for order preference by similarity to the ideal solution (ETOPSIS) method to solve such a problem.
In summary, as a hot issue, the siting and capacity planning of EV charging stations has received much attention from scholars both at home and abroad. However, at present, the existing charging pile location and capacity planning schemes are not studied in depth when considering the distribution network side. They only consider the constraints of the distribution network side, such as the upper limit of capacity constraints, and do not quantitatively consider the access of EVs to the power distribution network side. The influence of the access of EVs on the power quality of the distribution network side is not quantitatively considered; in addition, many existing models only target benefits, only seek the minimum cost and ignore the needs of the user side, such as waiting time, average charging time, etc. On the other hand, the current algorithms suffer from low operational efficiency, poor convergence, and tend to fall into local optimal solutions, and even some improved algorithms do not take into account these shortcomings.
With the objectives of reducing the construction and maintenance costs of charging stations, improving the convenience of EV owners and maintaining the safety and stability of the power system, this paper analyses and quantifies three types of costs, including the construction and maintenance costs of charging stations, the distribution network losses of charging stations and the economic losses on the EV user side, and proposes a model for siting and capacity planning of EV charging stations in conjunction with the distribution network constraints. Secondly, to address the problems of low efficiency and insufficient global search capability of existing algorithms, this paper introduces the principle and characteristics of the simulated annealing immune particle swarm algorithm and details how to solve the optimal solution for charging station siting and capacity selection using the designed model and related algorithms, where the service area corresponding to each charging station can be divided by a Voronoi diagram. Finally, the optimal number and location of charging stations and the corresponding number of charging posts in each charging station are determined using a district in Tianjin as an example, and the solution solved by the simulated annealing immune particle swarm algorithm is compared with the conventional algorithm.
Compared to existing studies on the siting and capacity of charging stations, this paper transforms some difficult to calculate cost losses into quantitative economic losses, the model covers more comprehensive factors, and the use of the simulated annealing immune particle swarm algorithm makes the optimal solution finding process more efficient and accurate. The use of the simulated annealing immune particle swarm algorithm makes the process of finding the optimal solution more efficient and accurate.
2 Quantification of Uncertainty
In order to ensure the comprehensiveness of the designed model, some variables that cannot be directly calculated, such as the queuing time loss during charging and the potential loss caused by grid harmonics, are quantified and incorporated into the model using statistical methods [14,15].
2.1 Quantification of Distribution Network Measurement Loss
2.1.1 Harmonic Losses at the Distribution Network Side
In the economic loss analysis on the distribution network side, the simplified EV charging model can be generally used in order to facilitate the analysis of the harmonics of the charger. The battery charging duration is set to 300, so the charger output voltage
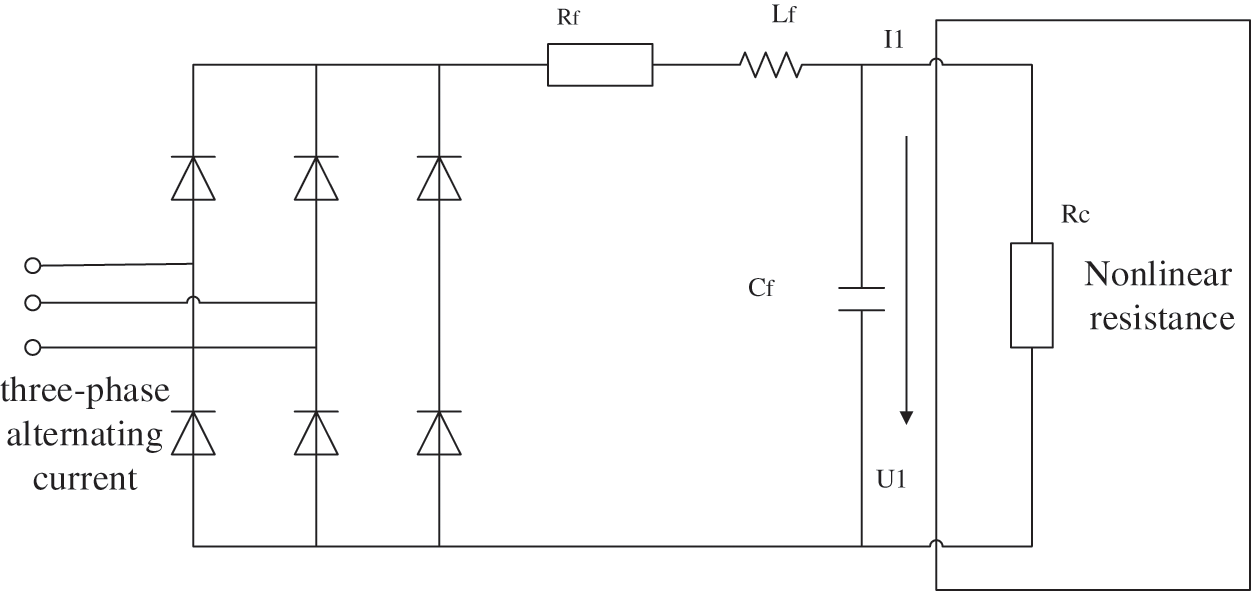
Figure 1: Equivalent model of the uncontrollable charger
The losses caused by harmonics are mainly affecting the service life of lines, transformers, capacitors, inductors, etc. [16]. For a specific charging station, the harmonic situation generated by the distribution network is directly related to the number of charging pile units connected. For a transformer, the model for the evaluation of its service life under the effect of harmonics is as follows.
where
For each charging station
where
Similarly, it is assumed that
where,
2.1.2 Load Operation and Voltage Deviation Effects
The ratio of the standard deviation of the load to the mean value of the load is the load fluctuation rate, which indicates the degree of load dispersion per unit average load. The greater the load dispersion, the greater the standard deviation, and the greater the load volatility, i.e., the greater the load volatility; on the contrary, the smaller the load volatility, the smoother the load [17,18]. The formula for calculating the average load volatility is as follows:
where
If the location or capacity of the charging station is not reasonable, the node voltage deviation may be too large when the charging load is connected on a large scale, which will lead to a sharp drop in the node voltage of the distribution network. The voltage deviation of each node after the charging station is connected is:
where
2.2 Charging Queuing Time Loss
In this paper, we use the queuing theory idea to calculate the time loss of EV users waiting in line for charging at charging stations.
Assuming that the charging process of EVs at charging stations belongs to a multi-service station model, the corresponding average queuing time in a day can be calculated as:
where
where
From the queuing time occupied per unit day, the total queuing loss cost can be calculated:
3 Charging Station Planning Modeling
3.1 Charging Station Siting and Capacity Determination Objective Function
In determining the siting and capacity model for charging stations, the common interests of multiple parties need to be considered. Fig. 2 shows the total cost analysis [19].
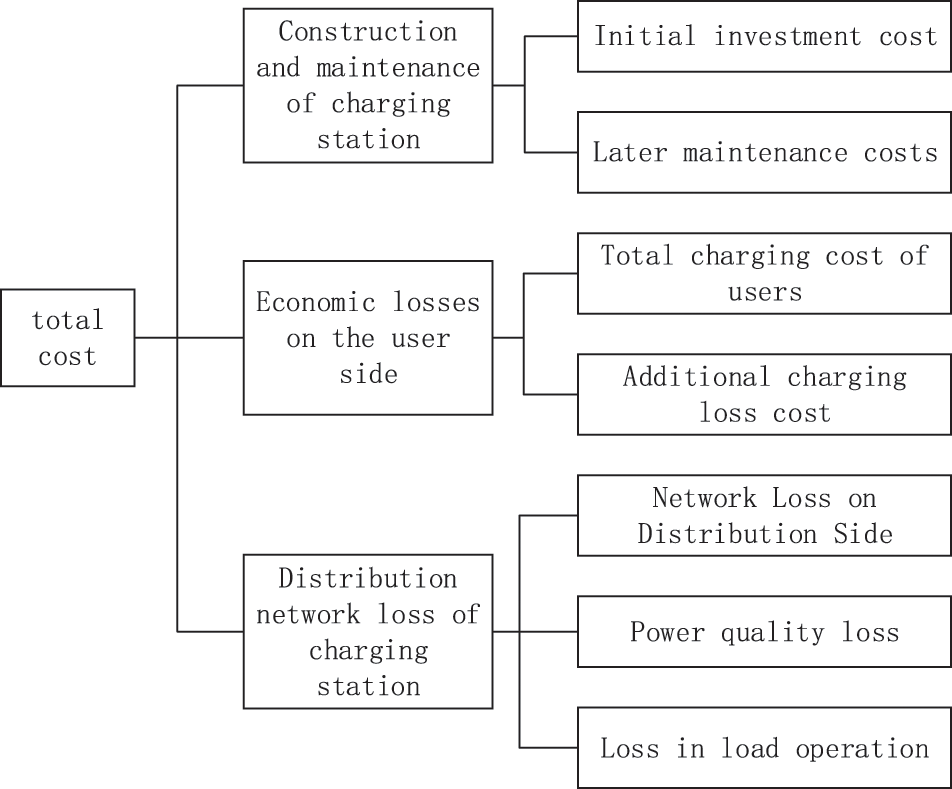
Figure 2: Total construction and operation cost of charging station
Based on the above analysis, the model is proposed or established as follows. Refining the total cost, the objective function is:
Among them, the initial investment construction cost of charging equipment of the charging station (
3.2 Investment and Maintenance Costs
The investment and construction costs of charging stations (
where for each charging station
The operation and maintenance costs of the charging station (
In the model of this paper, in addition to the construction and maintenance costs for the investors of charging stations, the usage costs on the user side of EVs also need to be considered.
3.3 User-Side Economic Expenditure
For charging stations
where
In contrast, the additional loss cost of charging per year for the user (
One of them is the cost of idle power loss incurred by the user during the charging journey:
where
The cost of time lost by the user
where
3.4 Distribution Network Side Cost Loss
The main adverse impact factors of EV charging load on the distribution network are shown in Fig. 3.
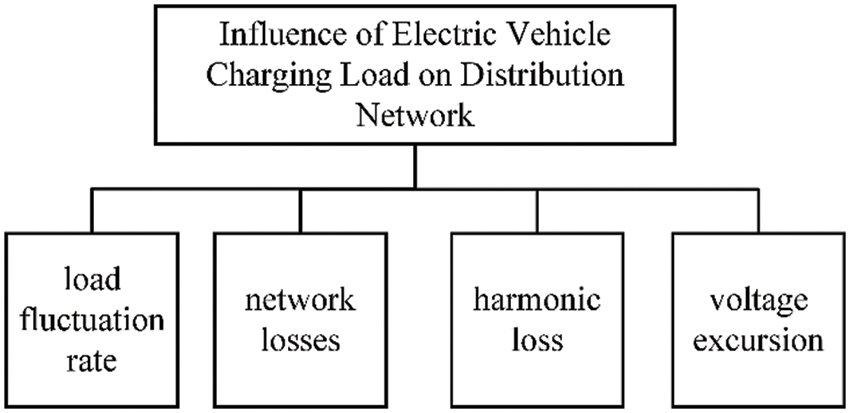
Figure 3: Source of distribution network loss caused by EV charging
When EVs are charged and EV charging posts are interactively coupled with the distribution network, especially when charging stations are connected to the distribution network on a large scale, they will have a non-negligible impact on the local distribution network, thus causing certain cost losses, such as network loss, harmonic pollution, current and voltage fluctuations, etc.
Network loss related power:
where
From the power loss formula of the distribution network, the network loss at the distribution side can be quantified as
where
The final distribution-side economic loss under the influence of harmonics is
The economic loss caused by load volatility and voltage excursion is
where
The above model considers the operation efficiency of the charging station, the loss of the distribution network side, and the convenience of charging from the perspective of the whole society. In this model, variables with high uncertainty such as user queuing time and harmonic loss are modeled and quantified as specific values, which can be optimized by changing the location and capacity of the charging station, and added to a specific model to find a comprehensive optimal solution.
4 Constraint Setting on the Distribution Network Side
In the siting and capacity planning of charging stations, relevant constraints need to be considered.
The above equation constraints can be interpreted as the tidal constraints of the charging station at the distribution network side Eq. (24) is the active power tidal constraint,
(1) Substation capacity constraint:
where
(2) The maximum charging power constraint of EVs allowed to be connected to the distribution network:
where for each charging station
(3) Feeder maximum current constraint:
(4) Capacity constraint of charging station access point:
where
5.1 Weighted Voronoi Diagram Algorithm
In the plane, there is a set of points where each vertex
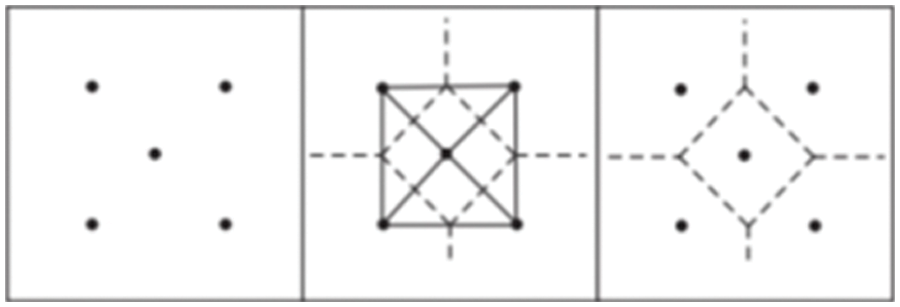
Figure 4: Method of generating Voronoi diagram
After the Voronoi diagram related program runs,
Because different charging stations have different capacities, it is necessary to introduce a weight value to determine their specific responsible range, i.e., a weighted diagram is needed. Assuming that the corresponding weight value of each point
The weights
From the above principle, each charging station is regarded as a certain point on the two-dimensional plane, and weighted by capacity, the charging stations with more charging posts and larger capacity are given higher weight values, and the corresponding weighted map is generated to finally arrive at the area responsible for each charging station, within which, according to the proximity principle, the total cost of the corresponding charging demand point going to the relevant charging station is smaller than the total cost of going to other charging stations.
5.2 Simulated Annealing Immune Particle Swarm Algorithm
Given that the siting and capacity determination of charging stations has the characteristics of a complex model and many variables, the traditional PSO algorithm has the problem of low efficiency, and may not be able to guarantee the search for the global optimal solution, thus causing certain economic and time losses.
Therefore, the immune algorithm is a stochastic search algorithm with jumping characteristics. In this algorithm, the optimal search problem of charging station siting is considered as the antigen and the feasible solution as the antibody, and the two interact with each other to obtain the final solution, and the antibody diversity is used to regulate itself, so that the particle population always maintains diversity and keeps the excellent particles with high adaptability, and iterates with the excellent particles saved by screening, so that the overall quality of the population particles is optimized, and the algorithm computing efficiency is enhanced, and the speed of the optimal search is improved, and finally the local convergence is effectively avoided.
In addition, it can be fused to join the simulated annealing algorithm and perform a collaborative search. SA algorithm has a strong ability of sudden jump, when the particle generates a new solution, the algorithm will judge the new solution according to the relevant acceptance criterion concerning the solid annealing process, so as to decide whether to update and optimize, in this way, the algorithm will not mention staying at the original local optimal solution, but will continue to search until finding the global optimal solution. At the same time, this cooling behavior likewise enhances the ability to determine the optimal solution, thus preventing the problem of missing the optimal solution due to particle swooping behavior.
In summary, the immune algorithm and the simulated annealing algorithm can be used simultaneously with the traditional particle swarm algorithm to improve the particle swarm algorithm for data processing work.
The specific steps of the EV charging pile siting and capacity planning using the Voronoi diagram and simulated annealing immune particle swarm algorithm together can be described in Fig. 5.
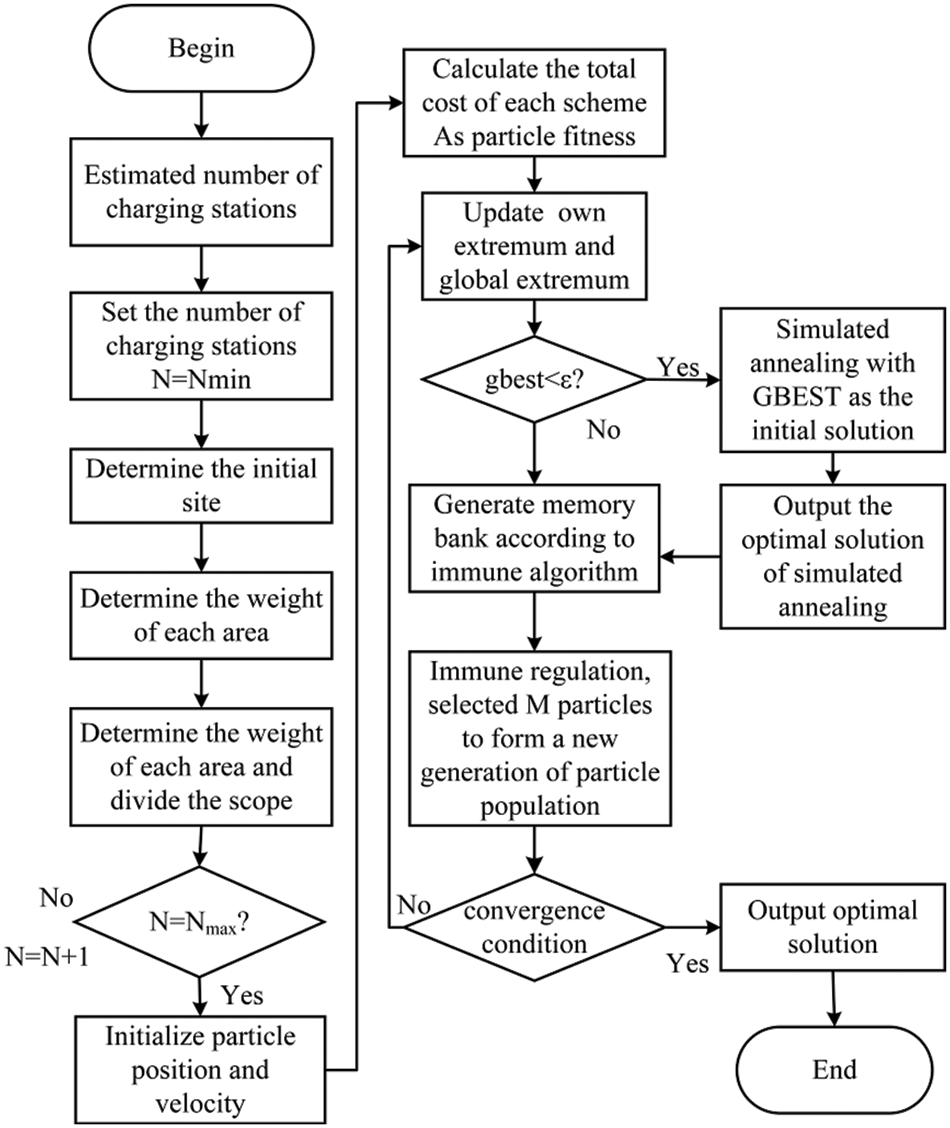
Figure 5: Flow chart of the model solving algorithm
(1) The initialization of the model data is done by inputting the known parameter variables from the second part of the model.
(2) The upper limit of the total number of charging stations
(3) The weights of each area are calculated using (32), and then the graph method considering the weights is used to divide the range situation responsible for each charging station and generate a specific area division graph from it.
(4) Initialization of algorithm parameters. This part can be divided into initialization of the basic particle swarm algorithm parameters, including the setting of the particle swarm dimension (each solution objective such as the horizontal and vertical coordinate positions of charging stations and the number of charging posts as one dimension), setting of the initial position x and initial velocity v under this dimension, particle swarm size
(5) Calculate each cost and the total cost of each scheme for different number of charging stations, and use the total cost as the adaptation degree of the particle.
(6) The particle’s own and global extremes are updated according to the criterion. The fitness of each particle is compared with the individual extreme values, where the smaller value is the better fitness value.
(7) Compare whether the global extremes are less than the computational accuracy
(9) Particle update. According to the introduction of linearly decreasing inertia weight update, M+N particles are randomly selected from the memory library to form a particle population for immune conditioning, and N particles are selected to form a new generation particle population.
(10) The convergence condition is judged. If the conditions are met, the data processing work is completed and the global optimal solution and location are output, at this time the obtained scheme is the three cost integrated optimal site selection and capacity planning scheme. Otherwise, return to Step (6) to iteratively update the particles again.
A street in Tianjin is selected as the planning object: The region covers an area of 63 km2 and is estimated to have a total volume of about 9,500 EVs in 2022. It is assumed that the average driving speed of EVs is 35 km/h, and the one-day fast charging probability is 0.05. Each fast charging takes 15 min to be fully charged, the charging power is 96 kW, the consumption of 15 kW·h of electricity per 100 km, and the maximum range of a single driving is 160 km.
Given the large area of the area under study, a large number of car ownership, and the complex distribution of car charging demand load, 34 road network nodes are delineated in this area, and the specific location and load of each point are shown in Fig. 6 (the numbers marked at the nodes in the figure indicate the normalized load size).
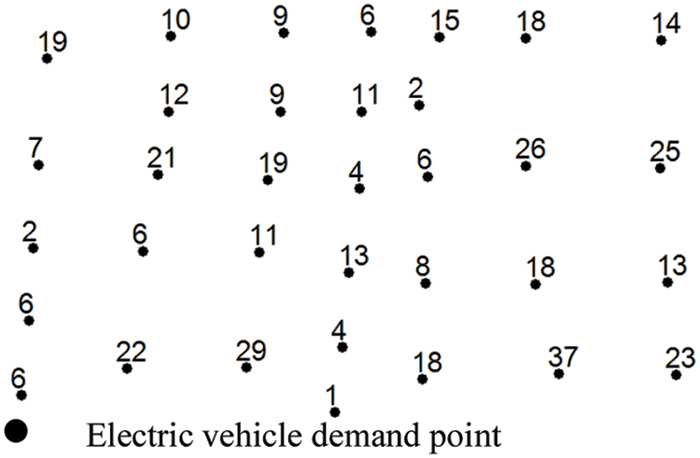
Figure 6: Street traffic density
For the distribution system, the IEEE33 node system is selected, and its distribution system wiring is shown in Fig. 7. The reference voltage and reference power are 12.66 kV and 10 MVA, respectively.
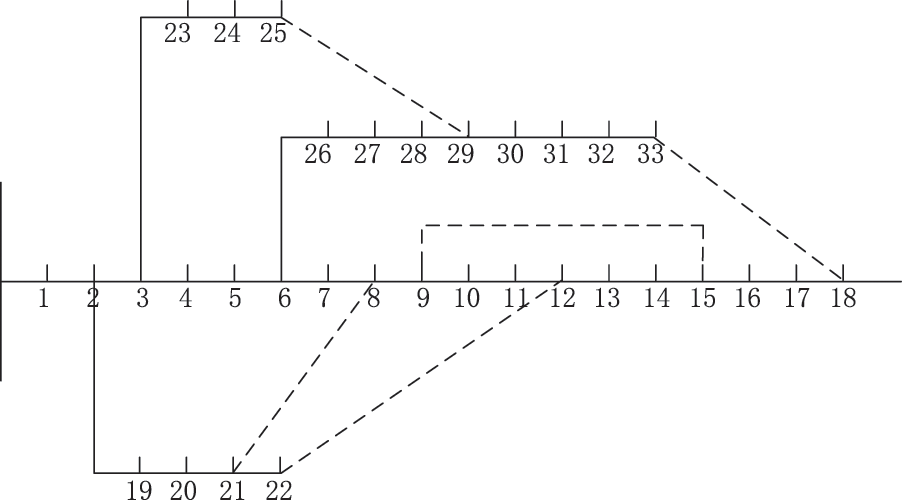
Figure 7: IEEE33 node power distribution system topology
6.2 Analysis of Charging Station Location and Capacity Results
According to the above data, the simulated annealing-based immune particle swarm algorithm is used to solve the problem, and the number of algorithm populations is set to 50, the number of iterations is 300, the learning factor is set to 2, the range of inertia weights is set to [0.2 1.2], and the immune algorithm in α = β = 0.5; δ = 0.5; γ = 0.8; the simulated annealing process parameters are set to: T = 100; T0 = 0.01; K = 0.9.
The relationship between the number of charging stations and the total cost is shown in Fig. 8. It can be seen that: when the number of charging stations is 7, the total annual social cost is the smallest, which is 209 million. At this point, the total investment and maintenance cost is ¥100.6 million, of which the initial construction cost is ¥91.5 million and the later maintenance cost is ¥9.1 million. The cost on the user side and the cost on the distribution network side are ¥75.2 million and ¥33.2 million, accounting for 36% and 16% of the overall proportion, respectively.
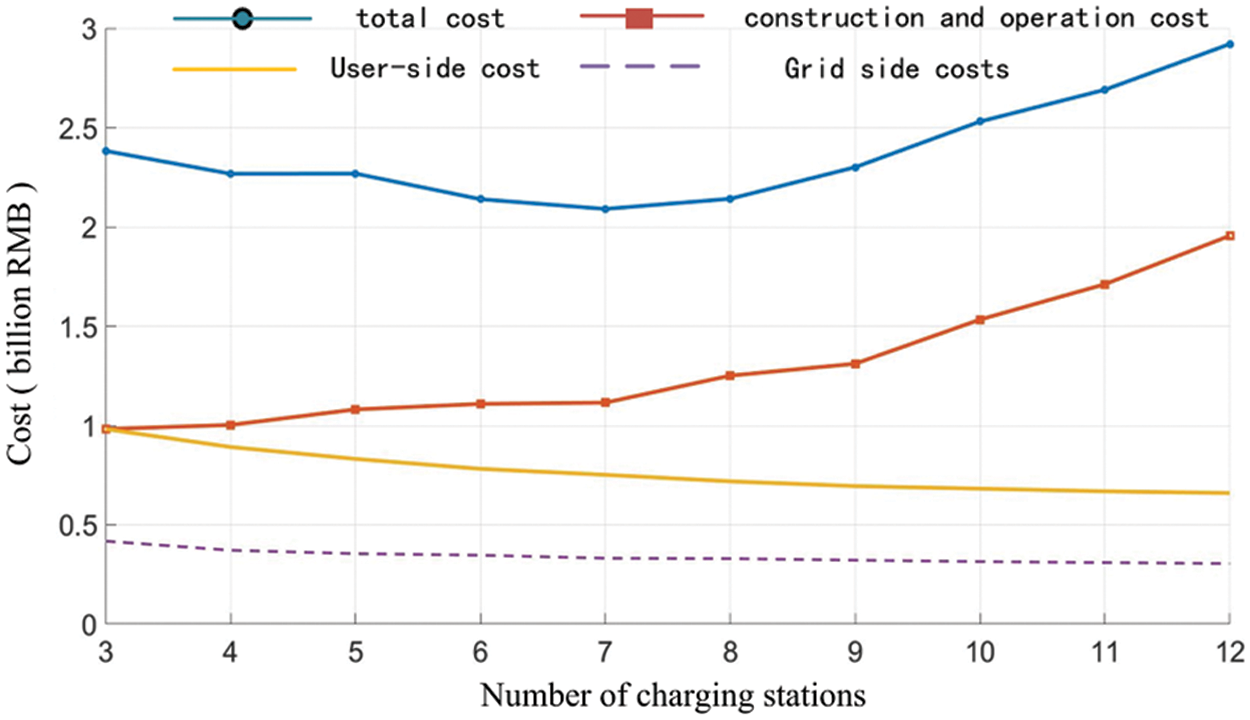
Figure 8: Relationship between number of charging stations and total cost
The grid straight line is generated from the Fig. 9, the service area is divided into boundaries with the lowest cost for the demand point to go to the corresponding charging station in the respective area.
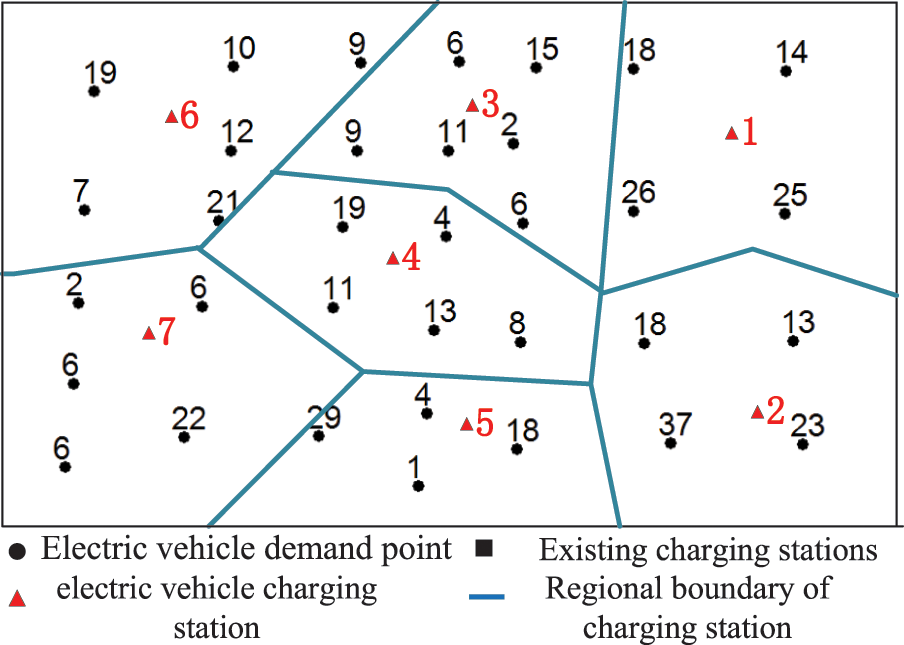
Figure 9: Optimal scheme and service area division of charging station
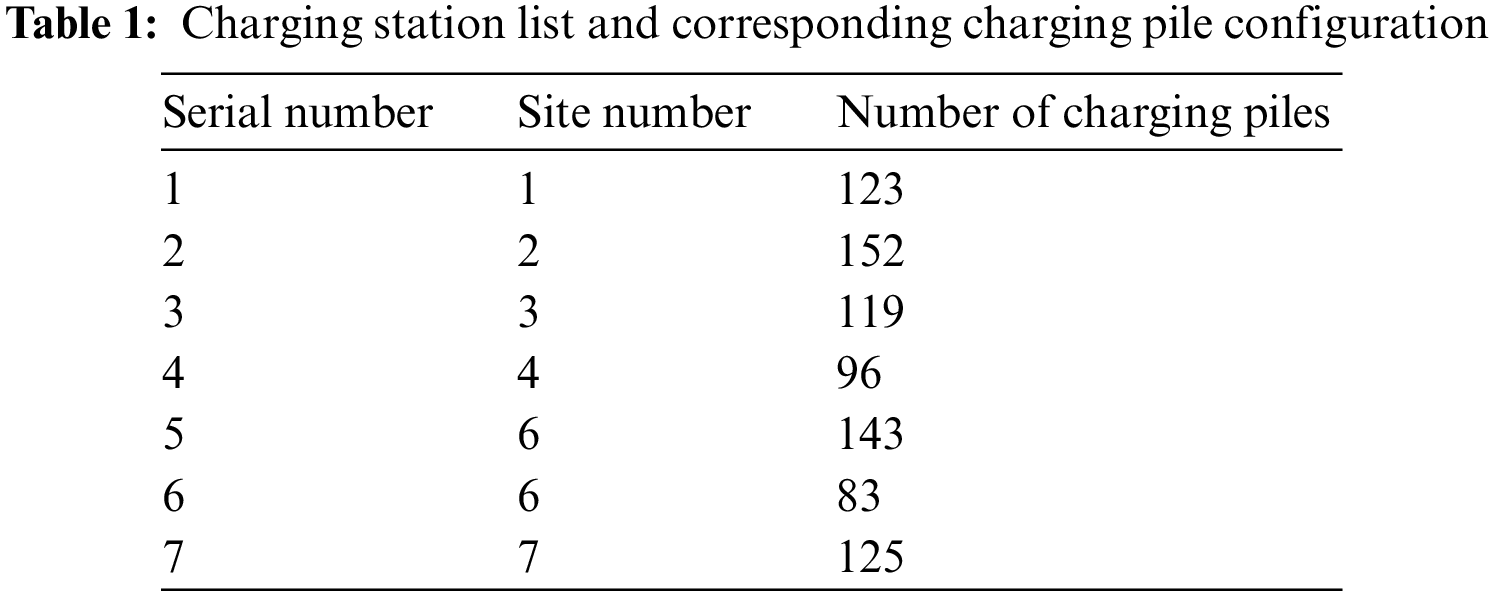
The corresponding station numbers and the respective number of charging posts configured for each charging station are shown in Table 1.
Based on the above siting and capacity setting of charging stations, indicators such as the average queue length and average stay time of each charging station can be calculated as shown in Table 2.
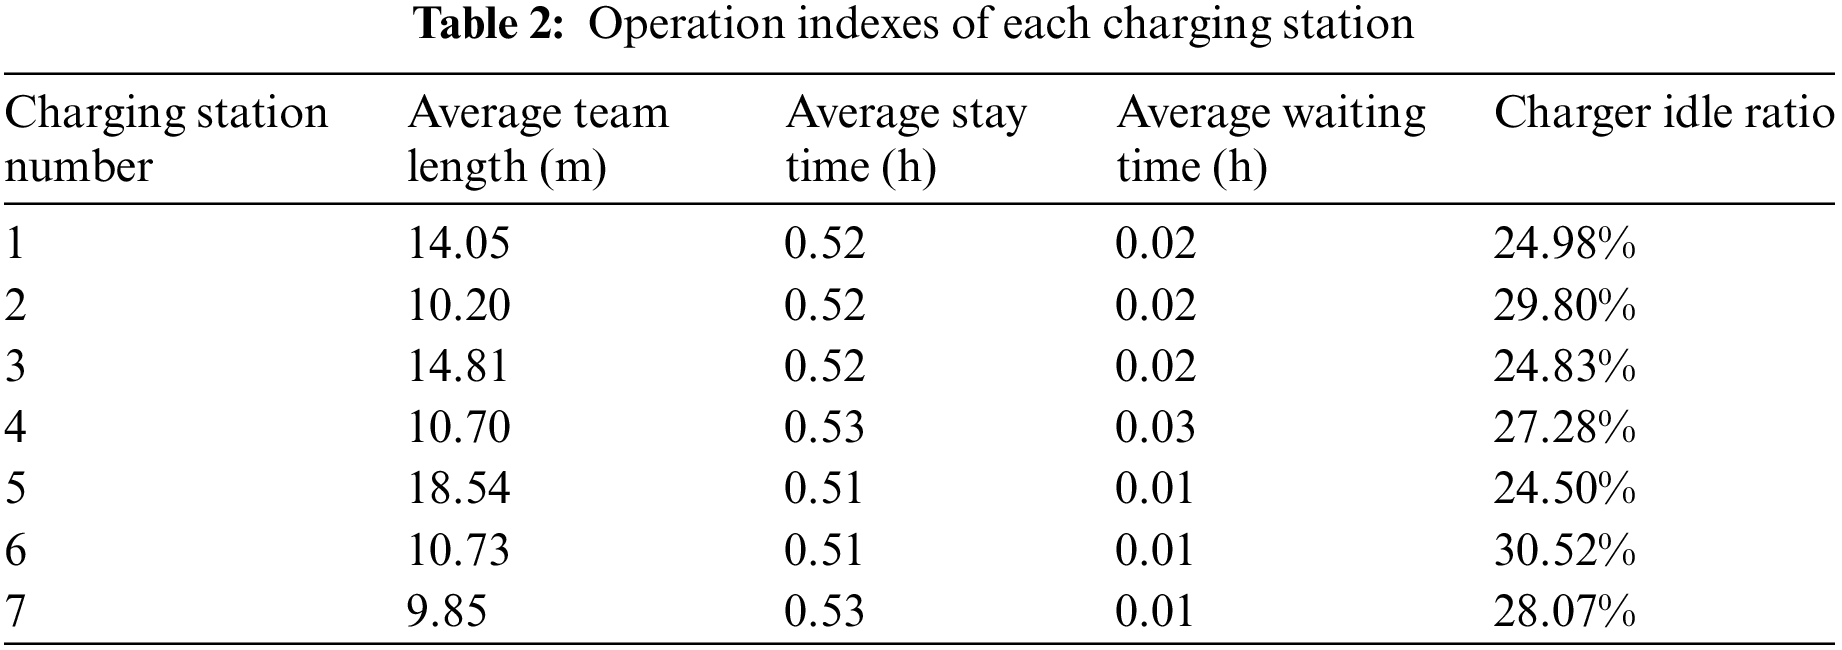
From Table 2, it can be seen that the average waiting time of customers at 7 charging stations does not exceed 1.8 min, the charging stations provide better service to customers, and the highest charger idle ratio is only 28.07%, i.e., the chargers of charging stations utilization rate reached 71.93% or more. The resources of the charging station are better utilized on the basis of satisfying the customers with high-quality services.
6.3 Comparison of Different Algorithms
In order to compare the advantages of using the SA-IPSO algorithm, this paper compares the SA-IPSO algorithm with the PSO algorithm and the IPSO algorithm and obtains their respective convergence curves and operating results.
From Fig. 10, it can be seen that, in terms of convergence speed, the curves derived from the SA-IPSO and IPSO algorithms obviously converge faster than those corresponding to the PSO algorithm, indicating that the addition of the immune algorithm can improve the convergence speed and operational efficiency; it falls into the local optimum earlier The curves obtained by the SA-IPSO algorithm basically do not fall into the local optimum.
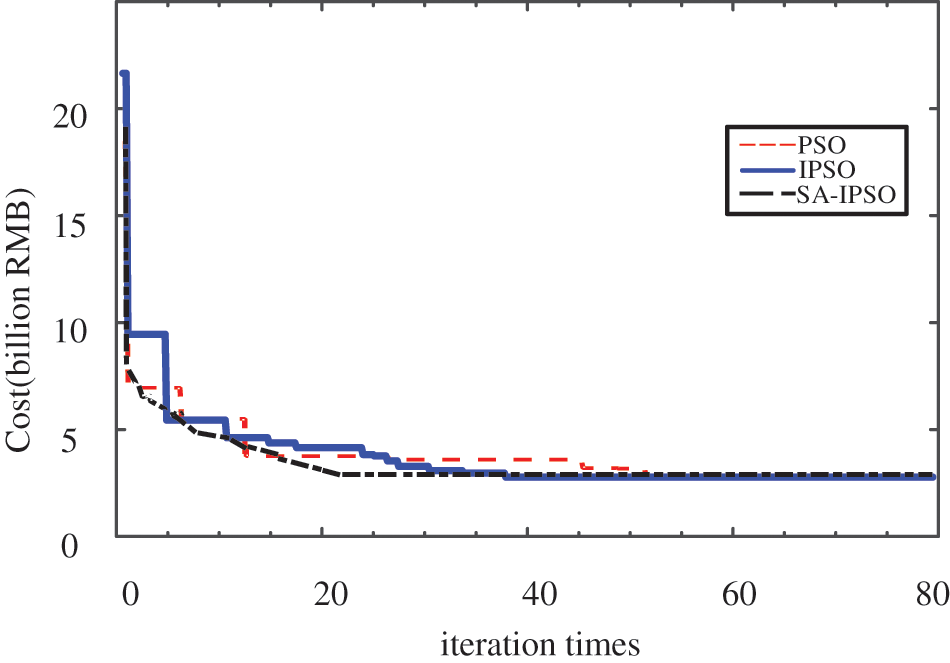
Figure 10: Comparison of convergence curves of different algorithms
The final optimal solution results, number of iterations, solution time, and global optimal finding capability using different algorithms for data processing are shown in Table 3. The results show that, in terms of the integrated cost, the resulting optimal scheme has the lowest integrated total cost, followed by IPSO; among them, the scheme corresponding to SA-IPSO has the lowest total cost even though the number of charging posts is significantly more than that of IPSO, indicating that the scheme corresponding to this algorithm significantly saves the user of usage costs and economic losses on the grid side. This shows that the inclusion of two hybrid algorithms allows the site-setting solution with a low total cost and high user convenience not to be missed because it stays in the local optimal solution or the example swoops too fast, etc.
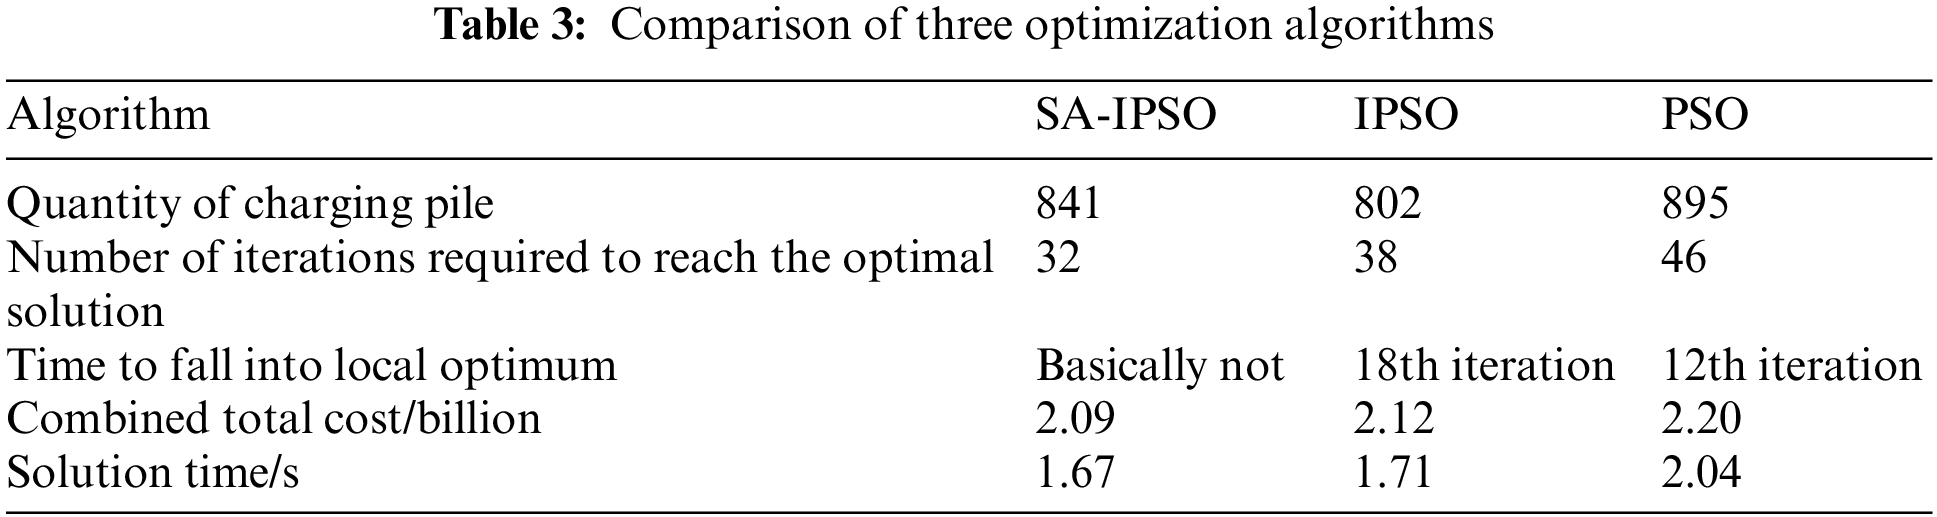
Furthermore, the SA-IPSO algorithm and IPSO algorithm with the addition of the immunization algorithm significantly reduce the solution time, with the SA-IPSO algorithm even reducing 18.1% of the time compared to the conventional PSO algorithm. This further illustrates the improvement in computing efficiency by introducing a hybrid algorithm.
This paper addresses the problem of siting and capacity determination of charging stations. Firstly, the construction and operation costs of charging stations are analysed, the consumption costs on the EV user side are derived by combining the queuing theory, and the cost losses on the distribution network side are quantified from various perspectives such as network loss and harmonics; using the above three perspectives combined with the distribution network constraints, a model for siting and capacity allocation of EV charging stations with the lowest total cost as the objective is derived. The model is then solved using the simulated annealing immune particle swarm algorithm combined with the Voronoi diagram algorithm for the number and location of charging stations in the target area, the number of charging posts in the stations and the area each charging station is responsible for; finally, the following conclusions are drawn by simulating an example of a region in Tianjin.
(1) The siting model proposed in this paper can reduce the construction and maintenance costs of charging stations while reducing the economic losses to EV owners and improving the power quality of the distribution network. In this paper, the average charging waiting time of EV owners is less than 1.8 min and the utilisation rate of chargers reaches 75.5%; while the total cost is as low as 209 million RMB, the economic losses such as harmonics and network losses on the distribution network side only account for 16% of the total cost.
(2) The SA-IPSO algorithm proposed in this paper is based on the PSO algorithm and introduces an immune algorithm to improve the convergence speed and solution efficiency of the algorithm; it introduces a simulated annealing algorithm to improve the ability of the algorithm to jump out of the local optimum, and compared with the traditional PSO algorithm, SA-IPSO reduces the required solution time by 18.1% and basically does not fall into local convergence.
Funding Statement: Key R&D Program of Tianjin, China (No. 20YFYSGX00060).
Conflicts of Interest: The authors declare that they have no conflicts of interest to report regarding the present study.
References
1. Kalaiselvi, K., Renuga, P., Kumar, V. S. (2018). CO2 emission and cost reduction by integrating electric vehicles and wind energy systems with thermal power plants. Energy Engineering, 115(4), 10–22. [Google Scholar]
2. Yan, D. X., Yin, H., Li, T., Ma, C. B. (2021). A two-stage scheme for both power allocation and EV charging coordination in a grid-tied PV-battery charging station. IEEE Transactions on Industrial Informatics, 17(10), 6994–7004. [Google Scholar]
3. Wang, S., Bi, S., Zhang, Y. A. (2019). Reinforcement learning for real-time pricing and scheduling control in EV charging stations. IEEE Transactions on Industrial Informatics, 17(2), 49–59. [Google Scholar]
4. Sakharov, V., Chernyi, S., Saburov, S. (2021). Automatization search for the shortest routes in the transport network using the Floyd-Warshell algorithm. Transportation Research Procedia, 54(5), 1–11. DOI 10.1016/J.TRPRO.2021.02.041. [Google Scholar] [CrossRef]
5. Narasipuram, R. P., Mopidevi, S. (2021). A technological overview & design considerations for developing electric vehicle charging stations. Journal of Energy Storage, 43, 103225. DOI 10.1016/J.EST.2021.103225. [Google Scholar] [CrossRef]
6. Sung, H. C., Changhyun, K. (2015). Multi-period planning for electric car charging station locations: A case of Korean Expressways. European Journal of Operational Research, 242(2), 677–687. DOI 10.1016/j.ejor.2014.10.029. [Google Scholar] [CrossRef]
7. Strickler, A., Castro Jr, O., Pozo, A. (2017). An investigation of the selection strategies impact on MOEDAs: CMA-ES and UMDA. Applied Soft Computing, 62, 963–973. DOI 10.1016/j.asoc.2017.09.031. [Google Scholar] [CrossRef]
8. Wang, Y. W. (2007). An optimal location choice model for recreation-oriented scooter recharge stations. Transportation Research Part D: Transport and Environment, 12(3), 231–237. DOI 10.1016/j.trd.2007.02.002. [Google Scholar] [CrossRef]
9. Chen, T. D., Kockelman, K. M., Khan, M. (2013). Locating electric vehicle charging stations: Parking-based assignment method for seattle, Washington. Transportation Research Record, 2385(1), 28–36. DOI 10.3141/2385-04. [Google Scholar] [CrossRef]
10. Gaagarin, A., Corcoran, P. (2018). Multiple domination models for placement of electric vehicle charging stations in road networks. Computers and Operations Research, 96, 69–79. DOI 10.1016/j.cor.2018.03.014. [Google Scholar] [CrossRef]
11. Zheng, H., He, X. Z., Li, Y. F., Srinivas, P. (2017). Traffic equilibrium and charging facility locations for electric vehicles. Networks and Spatial Economics, 17(2), 435–457. DOI 10.1007/s11067-016-9332-z. [Google Scholar] [CrossRef]
12. Karolemeas, C., Tsigdinos, S., Tzouras, P. G., Nikitas, A., Bakogiannis, E. (2021). Determining electric vehicle charging station location suitability: A qualitative study of greek stakeholders employing thematic analysis and analytical hierarchy process. Sustainability, 13(4), 1–21. [Google Scholar]
13. Bai, X. Z., Wang, Z. D., Zou, L., Liu, H. J., Sun, Q. et al. (2021). Electric vehicle charging station planning with dynamic prediction of elastic charging demand: A hybrid particle swarm optimization algorithm. Complex & Intelligent Systems, 8, 1035–1046. [Google Scholar]
14. Tan, H., Shen, B., Peng, K., Liu, H. (2020). Robust recursive filtering for uncertain stochastic systems with amplify-and-forward relays. International Journal of Systems Science, 51(7), 1188–1199. [Google Scholar]
15. Bagherzadeh, E., Ghiasuan, A., Rabiee, A. (2020). Long-term profit for electric vehicle charging stations: A stochastic optimization approach. Sustain Energy Grids Networks, 24, 121–133. DOI 10.1016/J.SEGAN.2020.100391. [Google Scholar] [CrossRef]
16. Callaway, D. S., Hiskens, I. A. (2011). Achieving controllability of electric loads. Proceedings of the IEEE, 99(1), 184–199. [Google Scholar]
17. Ren, Y., Shi, L., Zhang, Q., Han, W., Huang, S. (2011). Optimal distribution and scale of charging station for electric vehicles. Automotive Electrical Systems Work, 35(14), 53–57. [Google Scholar]
18. Liu, Y., Shen, B., Li, Q. (2019). State estimation for neural networks with Markov-based nonuniform sampling: The partly unknown transition probability case. Neurocomputing, 357, 261–270. [Google Scholar]
19. Zhang, H., Moura, S. J., Hu, Z., Song, Y. (2018). PEV fast-charging station siting and sizing on coupled transportation and power networks. IEEE Transactions on Smart Grid, 9(4), 2595–2605. [Google Scholar]
20. Sun, J., Wan, Y., Zheng, P., Lin, X. (2014). Coordinated charging and discharging strategy for electric vehicles based on demand sidemanagement. Transactions of China Electrotechnical Society, 29(8), 64–69. [Google Scholar]
21. Cui, Y., Liu, Y., Zhang, W., Alsaadi, F. E. (2021). Sampled-based consensus for nonlinear multiagent systems with deception attacks: The decoupled method. IEEE Transactions on Systems, Man, and Cybernetics: Systems, 51(1), 561–573. [Google Scholar]
Cite This Article
 Copyright © 2023 The Author(s). Published by Tech Science Press.
This work is licensed under a Creative Commons Attribution 4.0 International License , which permits unrestricted use, distribution, and reproduction in any medium, provided the original work is properly cited.
 Downloads
 Citation Tools