
 Submit a Paper
 Propose a Special lssue
 Open Access
ARTICLE

Energy-Efficient Approaches for a Machine Tool Building in a University through Field Measurement and Energy Modelling
1 Graduate Institute of Precision Manufacturing, National Chin-Yi University of Technology, Taichung, Taiwan
2 Department of Refrigeration, Air Conditioning and Energy Engineering, National Chin-Yi University of Technology, Taichung, Taiwan
* Corresponding Author: Fu-Jen Wang. Email:
Energy Engineering 2023, 120(6), 1387-1399. https://doi.org/10.32604/ee.2023.027459
Received 31 October 2022; Accepted 26 December 2022; Issue published 03 April 2023
 View Full Text
 Download PDF
Abstract
The heating, ventilating, and air conditioning (HVAC) system consumes nearly 50% of the building’s energy, especially in Taiwan with a hot and humid climate. Due to the challenges in obtaining energy sources and the negative impacts of excessive energy use on the environment, it is essential to employ an energy-efficient HVAC system. This study conducted the machine tools building in a university. The field measurement was carried out, and the data were used to conduct energy modelling with EnergyPlus (EP) in order to discover some improvements in energy-efficient design. The validation between field measurement and energy modelling was performed, and the error rate was less than 10%. The following strategies were proposed in this study based on several energy-efficient approaches, including room temperature settings, chilled water supply temperature settings, chiller coefficient of performance (COP), shading, and building location. Energy-efficient approaches have been evaluated and could reduce energy consumption annually. The results reveal that the proposed energy-efficient approaches of room temperature settings (3.8%), chilled water supply temperature settings (2.1%), chiller COP (5.9%), using shading (9.1%), and building location (3.0%), respectively, could reduce energy consumption. The analysis discovered that using a well-performing HVAC system and building shading were effective in lowering the amount of energy used, and the energy modelling method could be an effective and satisfactory tool in determining potential energy savings.Keywords
One of the largest consumer energy sectors worldwide is the buildings sector. Existing building stock represents the potential for energy-saving renovations. The building and service sector area is a substantial energy consumer accounting for around 40% of total primary energy consumption [1]. Energy savings are key demands for sustainable building refurbishment, especially in school buildings, and a case study of energy consumption in selected campus buildings in temperate climatic conditions was performed [2]. The lack of knowledge about building energy use patterns and how to promote their variation is currently the main barrier to fully exploiting the management of buildings [3]. The proposed building design is then economically evaluated to ensure its viability, and findings indicate an energy saving of 29% can be achieved [4].
The HVAC system dominated the energy usage and cost in a building [5]. Additionally, HVAC-related energy use represents 50% of the building and 20% of total energy consumption [6]. Several investigations identify the innovation concerning future HVAC systems and how to keep the indoor environment safe while maintaining energy-efficient operation in buildings [7]. In such a way, the perspective of an important way to reduce HVAC energy consumption is to adjust the set point temperature of the thermostat could save up to 30% [8]. Furthermore, temperature setpoints would reduce the annual energy demand by 0.9%–8.7% [9]. HVAC optimization framework that can provide optimal predictive control of the HVAC system based on the weather forecast and estimated indoor temperatures to minimize energy use by HVAC systems [10]. The strategy for reducing energy consumption in the building by optimizing a chiller system present to reduce the total power consumption with a variable COP is chosen, indicating a 12.3% cost reduction [11]. In addition, building shape might play an important role in its energy performance, especially due to self-shading, and to evaluate the impact of using different reference building shapes to develop a bottom-up benchmarking of building [12].
Building energy simulation using software to predict the energy consumption of the building into eight categories: prediction, estimation, consumption, optimal design, evaluation efficiency, management, and optimization [13]. Building energy consumption has been investigated to encourage suitable performance summary and managing or optimizing using software models and simulations [14]. A simulation conducted the research method for energy savings based on energy management strategies [15]. Several methodologies were implemented to estimate energy saving, predict the specific meteorological data of the year, and needed selected building data for real-time building energy consumption, then simulating the software model using the actual power consumption [16]. Research using simulation EnergyPlus can effectively reduce energy and money consumption pointed out the appropriate orientation and lighting control [17]. Simulations were performed by using EnergyPlus in order to measure the influence of behavior patterns on the building’s energy consumption [18]. On the other hand, building energy modelling is necessary to estimate energy consumption and determine the energy performance of the building during the design phase [19]. Many researchers have studied the important issue of daylight use to improve building energy performance [20]. The energy simulation using EnergyPlus is investigated; the Envelope Thermal Transfer Value (ETTV) was an effective process of the building, but it should be compared with the envelope heat of different walls of a warm and humid climate [21]. Furthermore, the building energy model has been widely used in building design because of the requirements from various green and energy-efficient building standards and certifications [22]. The Building Energy Management Systems (BEMS) installed in buildings contain a gold mine of data, which could be exploited for ongoing commissioning of the HVAC system [23]. BEMS systems could increase occupant satisfaction, create a comfortable and productive environment, and reduce energy consumption, operational costs, and environmental impacts, including carbon emissions [24]. The main goal of this study is to identify and minimize energy consumption utilizing a variety of strategies based on energy-efficient methods, including room temperature settings, chilled water supply temperature settings, chiller coefficient of performance (COP), shading, and building location.
The investigated building, which is a large infrastructure with a sustainable green environment and machinery tool building on the university campus, is characterized as forming metals or metal working equipment. It is situated in the central of Taiwan with a hot and humid weather conditions. Its total floorage is about 40,025 m2 from the B1 floor to 5F.
The schematic diagram of HVAC system is illustrated in Fig. 1. The overall cooling capacity of 210 refrigeration tons (RT), includes two screw-type chillers with a capacity of 200 RT (648 kW), and a chiller with a small capacity of 10 RT (35 kW). Chiller 1 (CH1) and Chiller 2 (CH2) are constant speed-driven chillers operated alternatively for base cooling load demand, while Chiller 3 (CH3) is a variable speed-driven chiller with an inverter for peak cooling load variation. There were chiller water pumps (11 kW) to distribute and supply chilling water for AHU purposes.
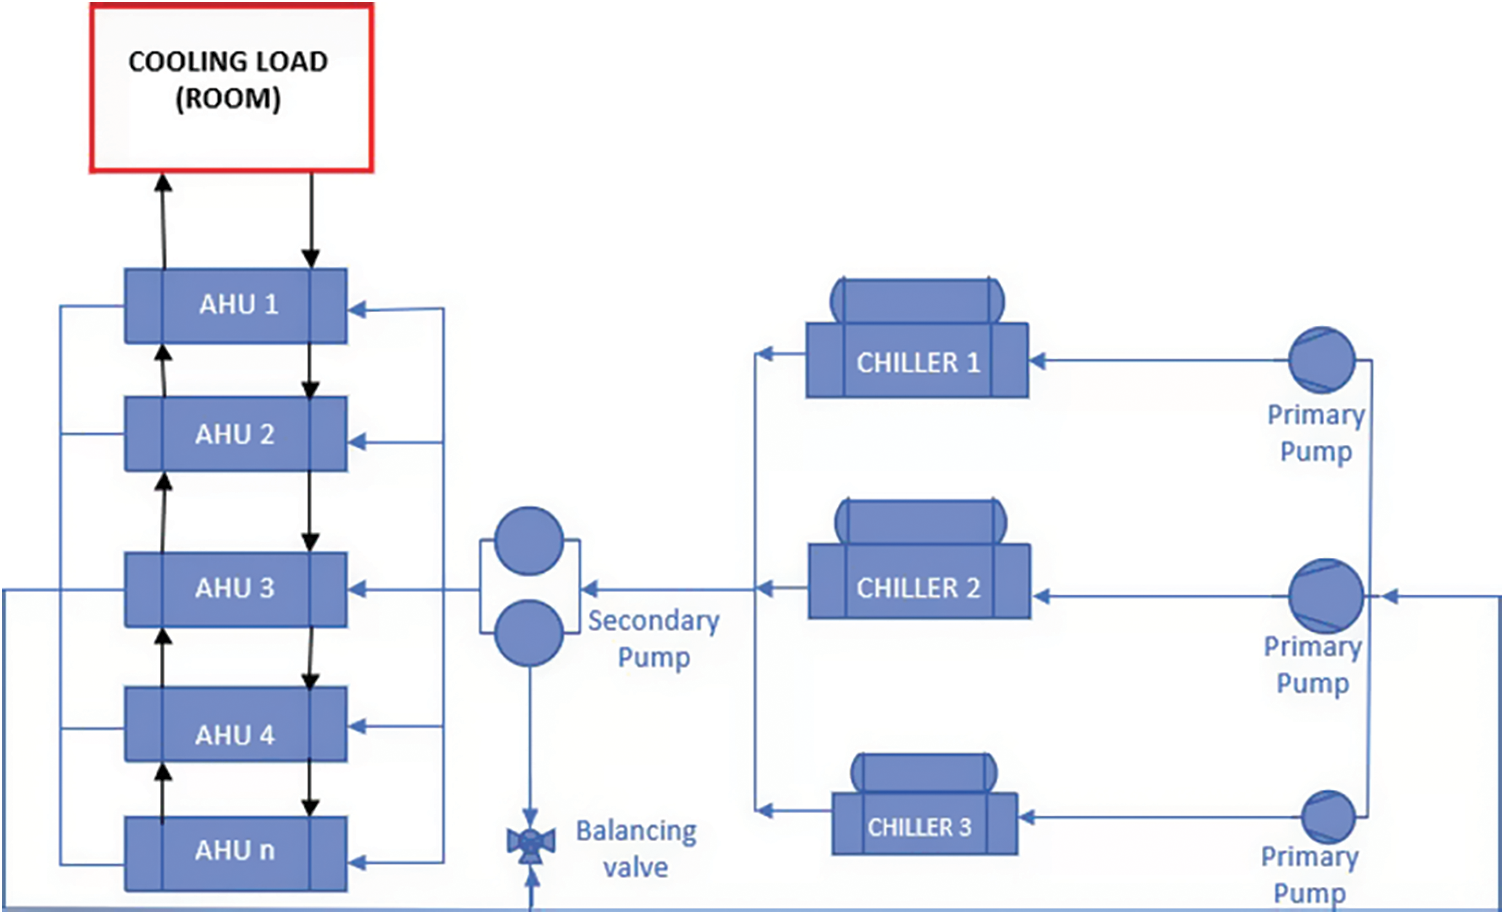
Figure 1: Schematic diagram of the chilled water system
The specifications of HVAC facilities are demonstrated in Table 1. The HVAC system’s specifications show that the chiller water supply temperature and return are 7°C and 12°C, respectively. Common space has a predetermined temperature of 24°C as designed. When used in conjunction with the air conditioning system, the two 100 RT chillers provide all standard rooms with the necessary cooling. While Chiller 3 (CH3) is a variable speed driven chiller with an inverter for peak cooling load variation, two chillers are screw chillers run alternately for base cooling load demand positioned on the rooftop. Enhancing the designs of their different integrated mechanical and electrical components is crucial to achieving effective HVAC systems, which play a significant role in buildings. Building energy consumption will be significantly reduced because of more effective HVAC systems.

The buildings are a crucial area for attaining sustainable development since building facilities’ energy consumption has become an exciting innovation for developers. The energy consumption of HVAC systems in school buildings should be reduced. Significant improvements in energy efficiency are the study’s main goal. There has been significant growth in the energy consumption of industrial environments, especially in tropical countries. In this work, the methodology that supported this research has been utilized. The BEMS, which has been installed at this building, provides the necessary data information collecting for one year. In addition, the data information is utilized to confirm the simulation data that will be used. On the other hand, the 3D geometry modelling for the energy modelling should have been created and divided into 6 HVAC cooling zones before starting the simulation.
To evaluate the building energy performance, a comprehensive field measurement needs to be carried out along with HVAC system testing, balancing, and adjusting (TAB), including water temperature, energy consumption, temperature, humidity, and airflow rate supply. Field measurement tests were conducted to provide reliable baseline data for comparison, and verify the simulation results for performance improvement, and find possibilities for energy efficiency in the building. The air temperature, humidity, and velocity in a typical room were monitored and recorded using a TSI-8380 air capture hood with an accuracy of 3%. The TSI-9569-P sensor recorded airflow rates at the accuracy of 3%, and the power meter apparatus model is HIOKI-3169-20/21 with operative range 0–600 Vrms, 0.5–5000 A. Next, the measurement is balancing valve apparatus model is PFM2050 with an operative range of up to 150 kPa the accuracy of equipment is 0.1 of FS. The field measurement apparatus is shown in Table 2.

3.2 Building Energy Management System
To obtain reliable measurement data, a very sophisticated building energy management system (BEMS) was employed to conduct comprehensive data acquisition for energy consumption at the campus building. The BEMS data provides the energy consumption of power, lighting, plugs, and HVAC system. The summation of chillers and pumps can obtain the total energy consumption of the HVAC system and air handling systems, specifically through on-site real-time measurement in the room on each floor. The trend of energy consumption can be presented by hours, days, weeks, months, and years, through the comprehensive data acquisition from BEMS. The sophisticated calibration procedures were conducted and modified by comparison with the on-site monitoring data from BEMS to improve the accuracy of simulation results. Furthermore, all the air handling systems for factory areas, fan-coil units for the classrooms, and new air-cooling units for the HVAC system input according to the equipment specification. Validation of the simulation modelling with on-site measurement data from BEMS has been conducted. Consequently, the model was assessed based on electricity bill data. Validation of modelling has been compared to actual data to assess energy consumption variation.
Energy plus (EP) can be used to model and simulate buildings, including energy consumption, thermal comfort, and other building parameters based on different inputs. The EP models were conducted based on the existing building information from field measurements, documentation, and drawings. The simulation model was created from the building parameters and characteristics obtained from the campus building by modelling the building as accurately as possible with the actual building structure. Validation of the simulation model with actual field measurement data has also been conducted. The model can provide accurate results with similarly accurate and specific inputs. As depicted in Fig. 2, the investigated building was created (a) a snapshot of the building, (b) a geometric model, and (c) a geometric model using shading. In addition, the typical input parameter was set in energy modelling of the investigated building to run the simulation and illustrated in Table 3. Thermal zoning strategies for sustainable building design using energy simulation programs can be useful for evaluating building energy performance. In order to achieve optimized energy performance simulation, the geometry model zone of the building is needed and divided into 6 separate zones; each zone has perimeter space.
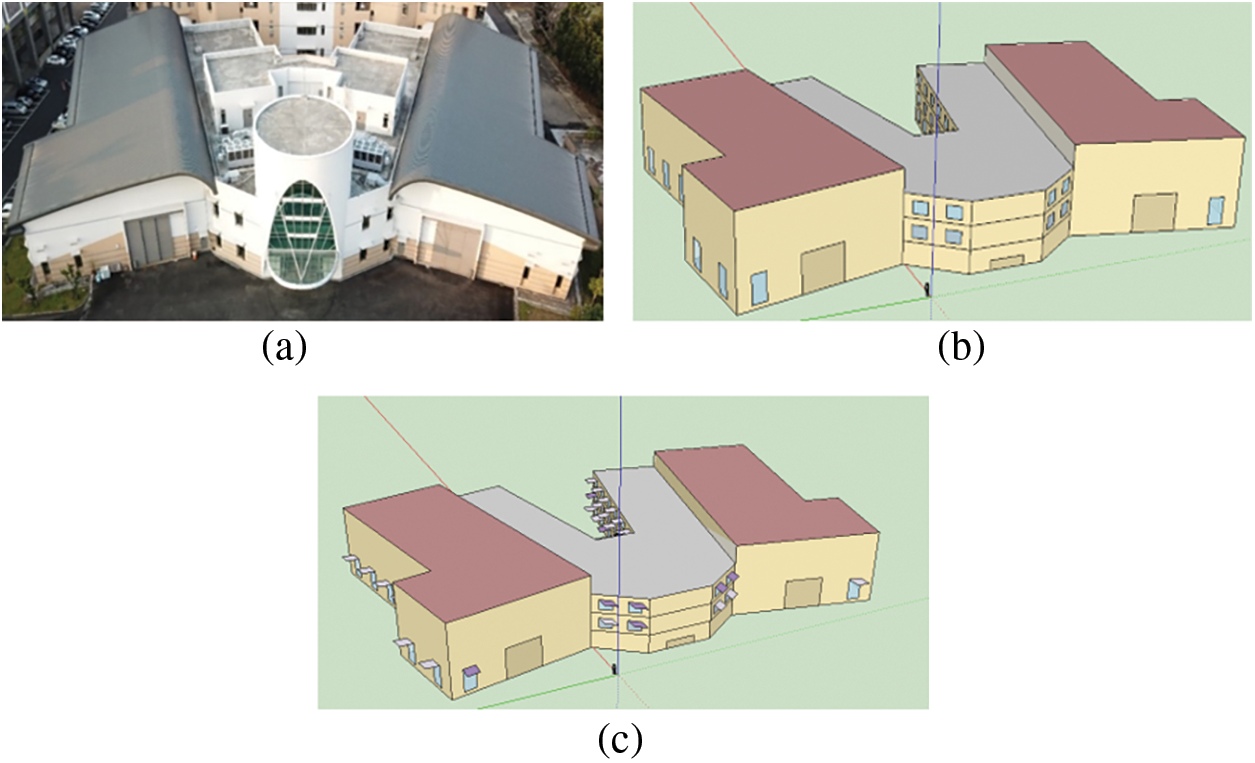
Figure 2: The investigated building: (a) snapshot; (b) basic geometric model; (c) geometry model using shading

3.4 Energy-Efficient Approaches
The primary goal of this study is to examine the annual energy usage of commercial buildings and the BEMS data. The prescriptive technique is based on the outcomes of software simulation, data acquisition from building energy management systems on specific expedience data, and EP launch conduct calibration. Using EP software, a building model with the assumptions and presumptions, such as construction and materials, interior loads, timetable, and air conditioning system, is simulated. This paper suggests a straightforward method to calibrate how energy is utilized in a facility using information from monthly energy statistics in order to facilitate energy management in commercial buildings. The model was created as part of an effort to model campus commercial buildings using a field measurement approach. BEMS data were compared from a field test of a campus building. The wide range of energy-saving options applicable to commercial HVAC has been proposed and developed to attribute the field measurement data for comparing an improvement of HVAC systems.
Additionally, analysis of field measurement data using an EP software model from various locations with various climate temperatures is done to promote energy conservation. Identify the many suggested energy-saving strategies for commercial HVAC systems and create an estimate of the possible energy savings for each option. The following strategies were proposed in this study based on different energy-efficient approaches, including room temperature settings, chilled water supply temperature settings, HVAC system performance, shading and building location.
4.1 Measurement and Validation
A comprehensive field measurement was performed, and the data were used to conduct energy modelling with EnergyPlus. The BEMS was also employed to conduct data acquisition for energy consumption throughout the year. Beside chiller as a cooling system, the AHU system is used to distribute the conditioned air. It is well known that energy demand associated with using HVAC systems equipped with AHU is significant [25]. Fig. 3a is illustrated the power consumption of AHU comparing measurement value and design value. The differential is about 5.7%, and it has a good agreement for conducting the simulation. Fig. 3b is illustrated the airflow rate of AHU comparing field measurement and design value. The differential is about 3.04% lower than the energy consumption of AHU.
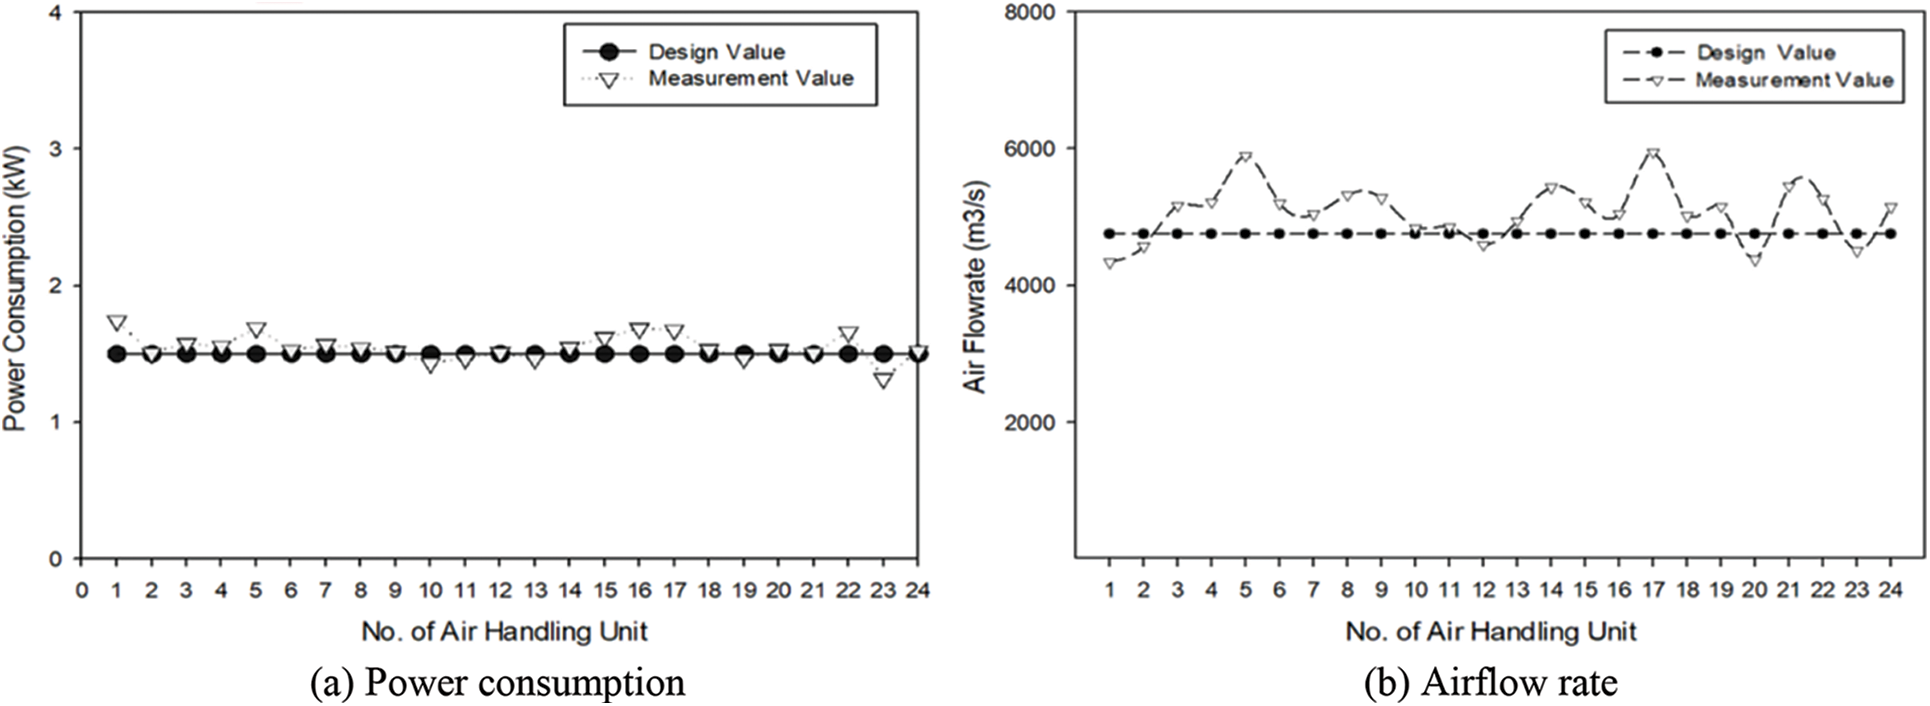
Figure 3: Field measurement of AHU
Validation involves evaluating the contrast between sufficiently accurate modelling results and the measurement data. In order to verify that the data is accurate and of high quality, data validation is the process of checking that the data has passed data cleansing. Validation requires for the estimation of error, and uncertainty on both the modelling and measurement sides is required. The experimental measurements are just asserted to be the most accurate representations of reality for validation in this procedure, not that they are more accurate than the results of the modelling.
This paper indicates an approach to calibrate how energy is consumed in a building using information from monthly energy data to facilitate energy management in commercial buildings. BEMS data was collected from a field test of the building. The simulation results of the energy consumption of this building are compared with the data collected by BEMS based on electricity consumption. Illustrated in Fig. 4, Field measurement and energy modelling were validated, and the error rate was less than 10%. After the validation between field measurement and energy modelling was completed and the error rate was low, indicating that the model was correct, energy modelling could be performed in various settings.
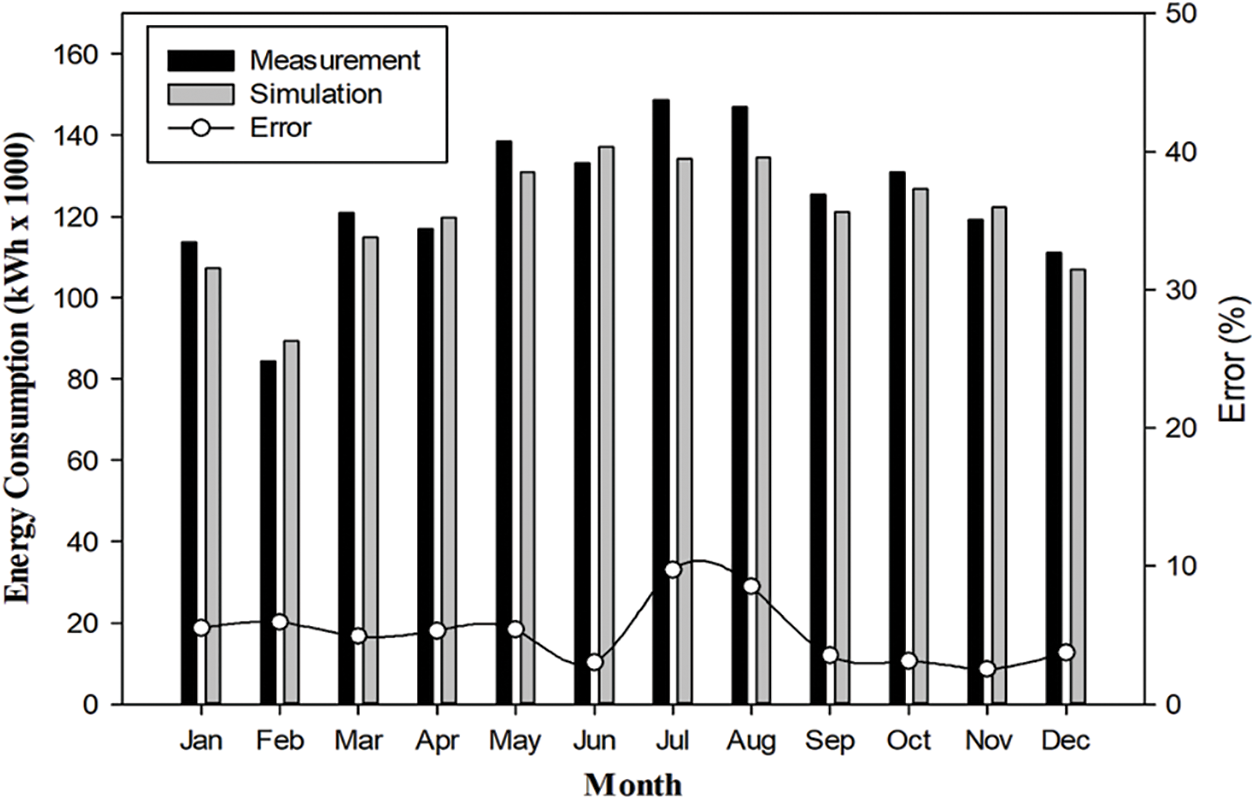
Figure 4: The comparison of energy consumption between measurement and simulation
Due to the significant energy consumption of air conditioning (AC) systems in buildings, numerous techniques and technologies have been developed to help these systems operate more effectively. In an air-conditioned area, one technique is to control the room temperature while taking into account people’s thermal comfort. The energy usage of the A/C system decreases with increasing room temperature. A temperature increment of 1°C was used to adjust the room temperature in this investigation between 24°C and 26°C. Fig. 5 shows to compare of thermostat room temperature set points 24°C, 25°C, and 26°C with a decrease of 1°C will affect energy consumption increasing by 8%, especially during the summer peak seasons. It reveals that the simple temperature reset of the thermostat will contribute to the energy-saving concern. The highest energy consumption occurs in July and the lowest in February due to weather factors, namely during the summer and in both months. The average saving energy consumption is up to 3.8%.
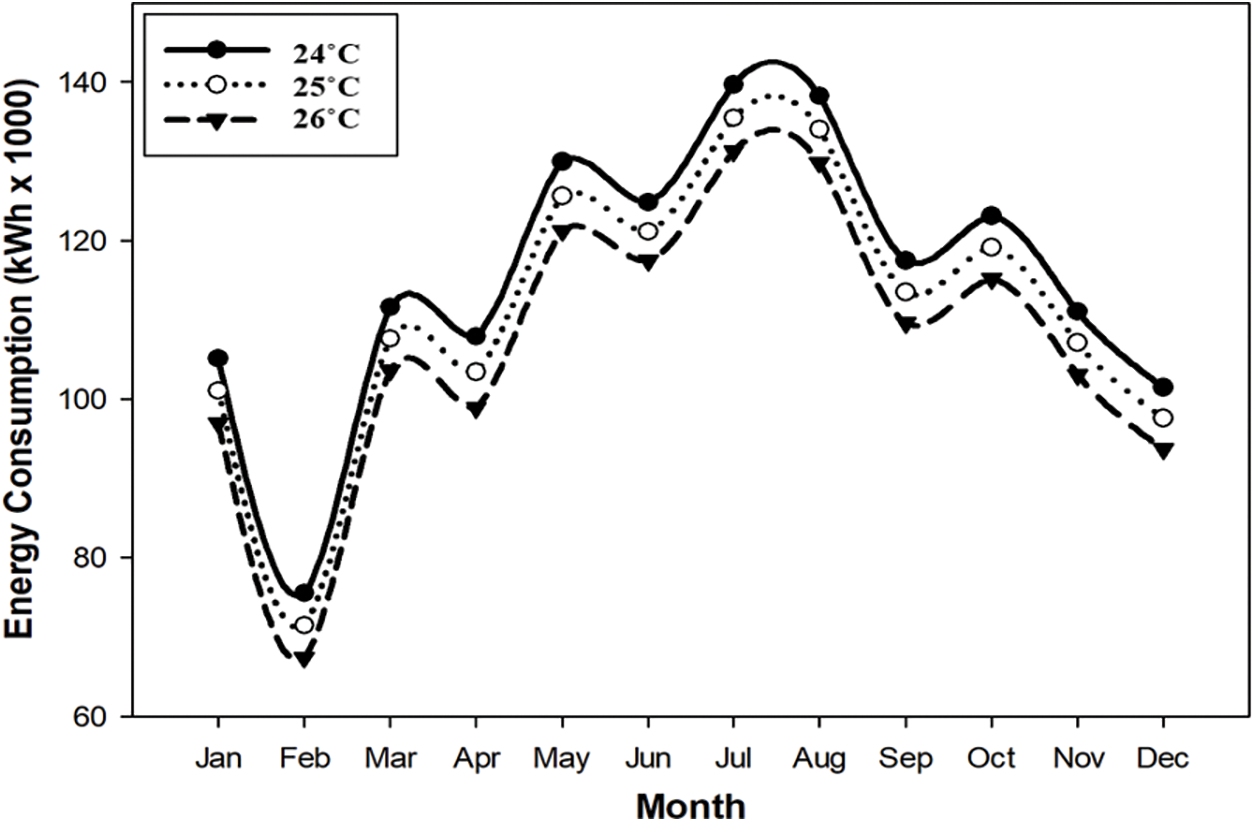
Figure 5: Energy consumption with different room temperature settings
4.3 Chilled Water Temperature Setting
The chilled water temperature difference was designed and operated at a temperature differential of 5°C between the supply temperature of 7°C and the return temperature of 12°C. Increasing the temperature differential between the supply and return temperatures can lower the circulating water flow, use less energy during transmission, and increase the effectiveness of the chiller. As a result, the chilled water system’s overall energy usage can be decreased. Fig. 6 demonstrates the energy consumption of the water supply temperature of the chiller at 6°C, 7°C, and 8°C. The setting of the chiller water supply temperature from 7°C to 6°C or 8°C during partial load conditions can substantially reduce the power consumption to 2.1%. It can be seen from the graph that the highest energy consumption occurs in August due to the summer, while the lowest occurs in February because during the winter season, which is approx. A significant decrease in energy consumption occurred from January to February by 28% at each thermostat setting, whereas the increase occurred from February to March with an increase of 32%.
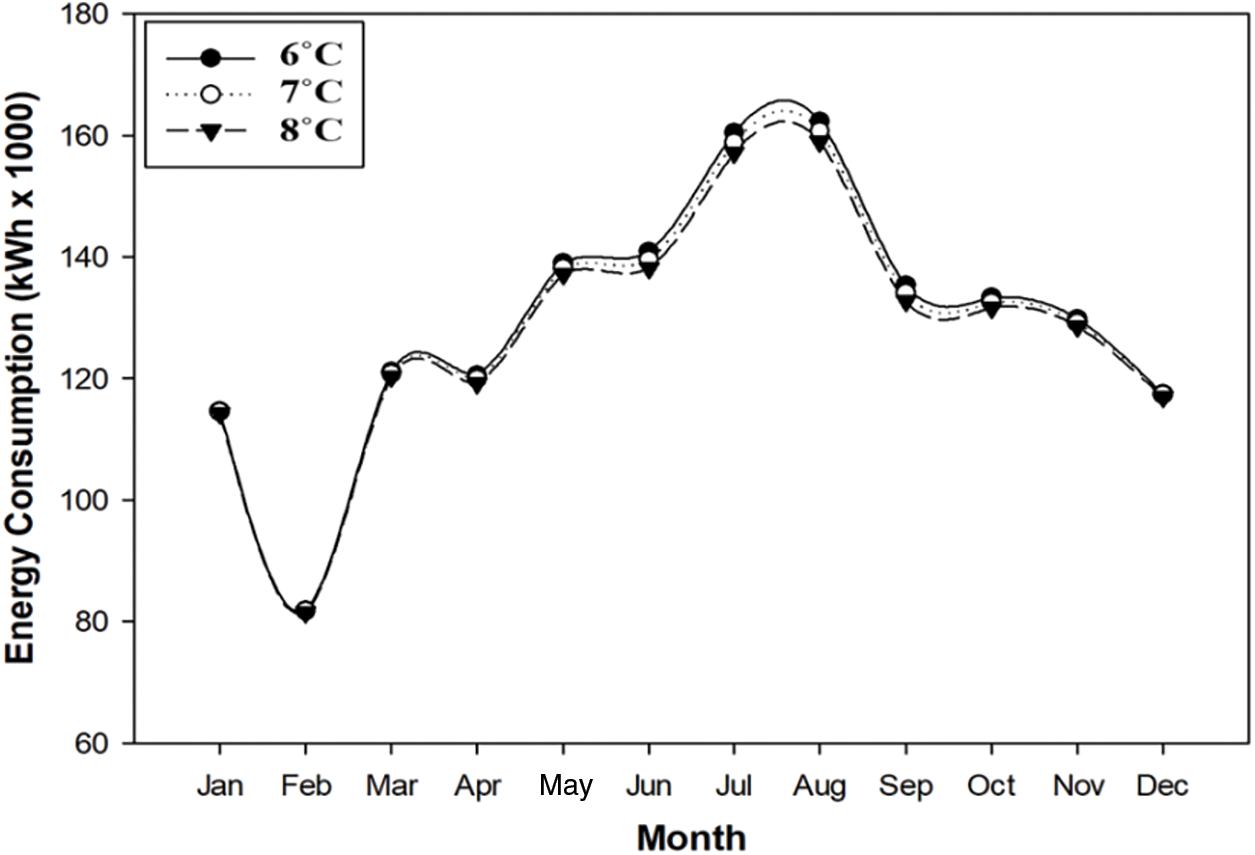
Figure 6: Energy consumption with different chilled water supply temperature settings
The Coefficient of Performance (COP) measures how well a heating or cooling system uses its energy relative to the amount of heating or cooling it provides. The efficiency of the system increases with the COP. Fig. 7 depicts the energy-efficient approach by retrofitting a higher-performance chiller from COP of 3.5 to 4.5. The energy consumption saving in summer of about 8.5% can be obtained even though the energy saving is not so obvious in winter due to partial load operation for chillers. Based on the chiller specifications, it is known that the chiller system in this building has a COP of 4, and after conducting an energy modelling, the highest COP savings are 10%. In comparison, the average savings are around 5.9%. The decrease in energy consumption obtained from January to February was 29%, whereas the increase in energy occurred from February to March, which was around 32%.
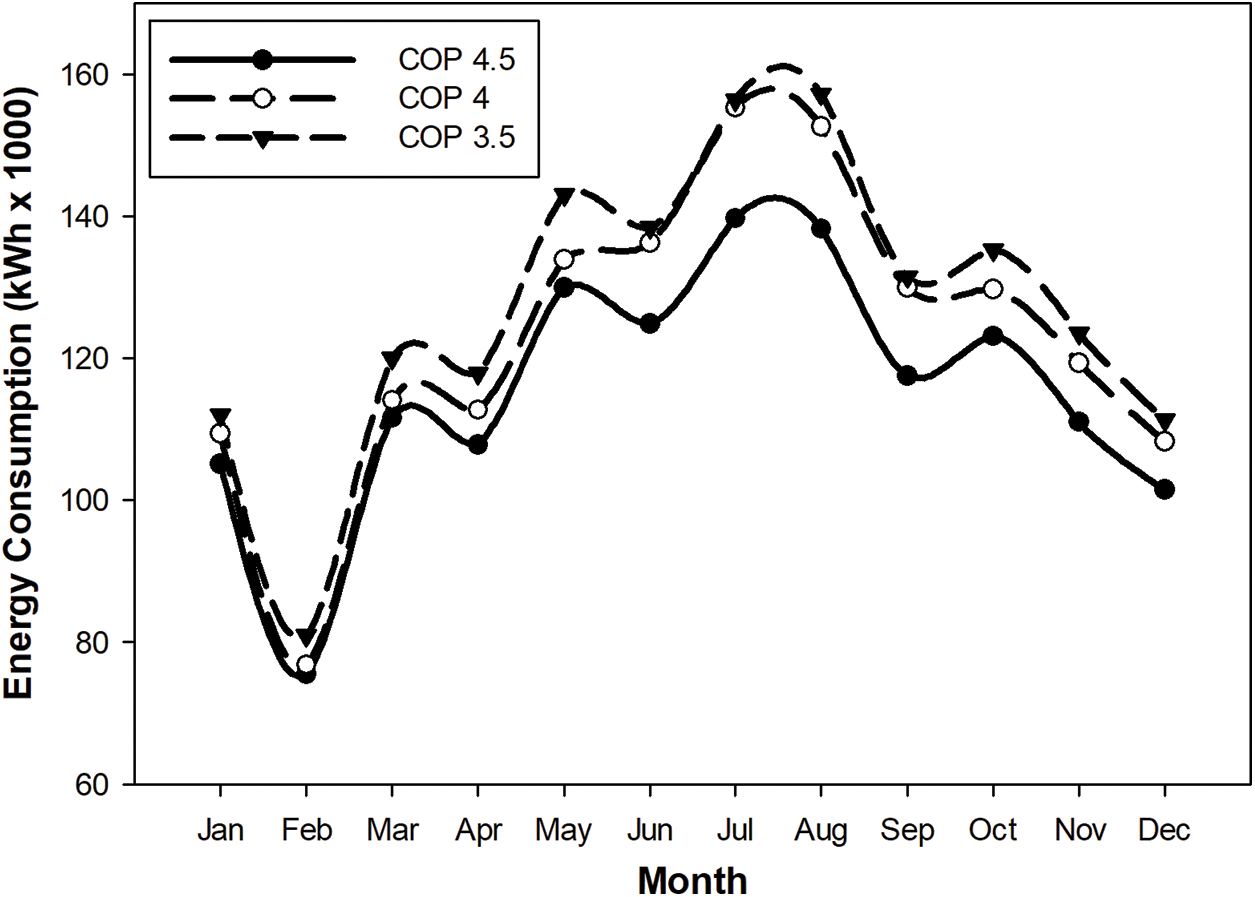
Figure 7: Energy consumption with different HVAC systems performance
In architectural design, shading is still used as a crucial and practical component. The energy efficiency of a structure, especially in locations with hot climates, can be greatly improved even with small adjustments to the design of the shading. Shading can alter the total amount of energy consumed by reducing the heat gain from sunlight and the transmission of visual light. Fig. 8a presents the energy consumption of the building using shading and no shading. The highest energy consumption was found in July and August. A 9.1% less energy consumption using shading compared with no. Using shading has a higher HVAC cooling load than without shading. Furthermore, the simulation result shows that the zone using shading achieved 16.3% less primary HVAC cooling load compared to the without shading shown in Fig. 8b. The simulation result shows that July obtained the highest energy consumption on the other hand in February is the lowest.
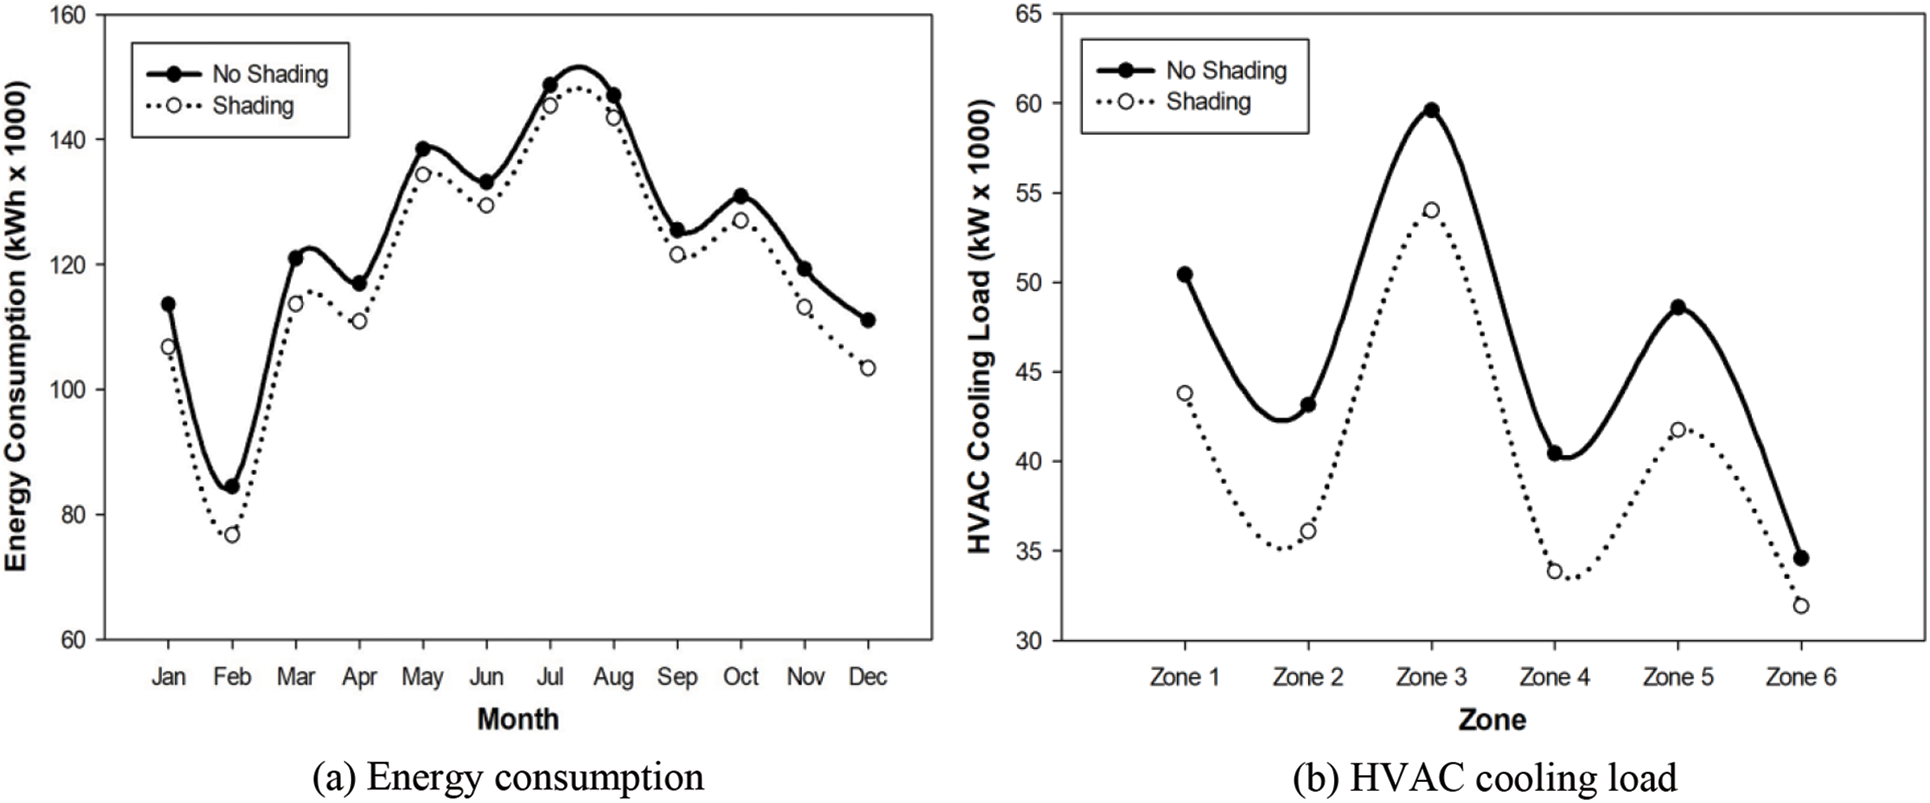
Figure 8: Energy consumption of building using shading
The location of the building also impacts the climate conditions, which play a big part in how energy-efficient the building is. Climate factors including solar radiation, air temperature, air movement, and humidity have a big impact on energy expenses since they are crucial for learning. Taiwan’s climate is subtropical, except for the southern part of the island, which is tropical. Summers are long and hot, lasting from April or May to September or October. This study investigated three different locations from the North to the Central and South. The investigated building is located in the central part of Taiwan. Fig. 9 shows the energy consumption in Taipei, Taichung, and Kaohsiung city, which describes the northern, center, and southern area of Taiwan. Energy consumption in Kaohsiung is highest than the other city on average because of weather data. Based on the energy simulation, there is an obvious trend, and the saving effect can result. Energy savings for energy consumption are around 3.0% on average, and the highest saving energy is up to 8.1% in August. In addition, the EUI between each city varies based on the simulation. As a result, the highest EUI by up to 199.94 kWh/m2 in Kaohsiung compared to Taipei (177.19 kWh/m2) and Taichung (182.94 kWh/m2), respectively.
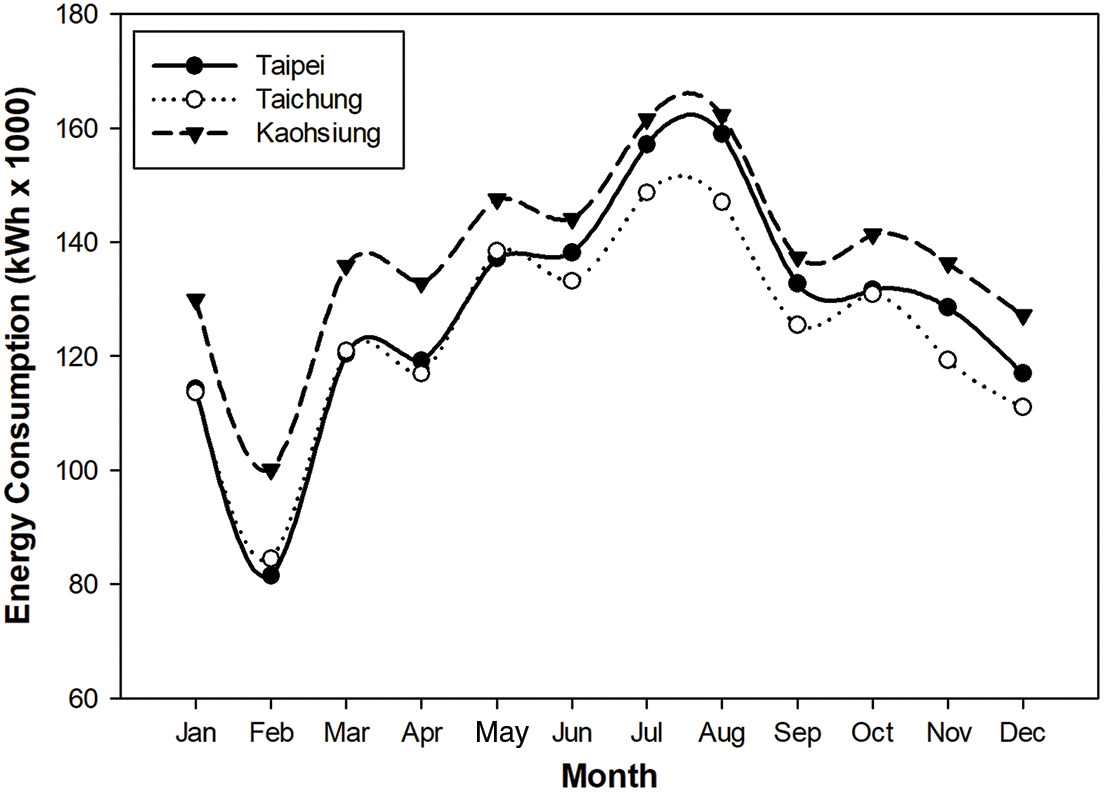
Figure 9: Energy consumption in different locations
The study highlights the potential of the energy modelling becomes a useful tool for reducing energy consumption significantly for this investigated building. It evaluates the energy modelling by EnergyPlus software as well as from field measurements recorded and compared within one year. The energy modelling revealed a good agreement with energy consumption data collected by BEMS with an acceptable error of less than 10% by implementing the actual performance data from field measurement. Implementing energy-efficiency approaches that substantially reduce energy consumption can be achieved satisfactorily. Simulation results performed showed saving energy consumption annually by using different room temperature settings, chilled water temperature setting, COP of the chiller, using shading, and building location is 3.8%, 2.1%, 5.9%, 9.1%, and 3.0%, respectively. Optimizing the HVAC cooling load using shading can achieve even higher and reduce energy consumption. It also reveals a more robust study and evaluation of different energy-efficient approaches that can be developed successfully through energy modelling and field measurement of buildings.
Funding Statement: The authors would like to express their great appreciation for the financial support by the Ministry of Science and Technology under Grant No. MOST 108-2622-E-169-006-CC3.
Conflicts of Interest: The authors declare that they have no conflicts of interest to report regarding the present study.
References
1. Gil, L., Bernardo, J. (2020). An approach to energy and climate issues aiming at carbon neutrality. Renewable Energy Focus, 33, 37–42. https://doi.org/10.1016/j.ref.2020.03.003 [Google Scholar] [CrossRef]
2. Mohelníková, J., Novotny, M., Mocová, P. (2020). Evaluation of school building energy performance and classroom indoor environment. Energies, 13(10), 2489. https://doi.org/10.3390/en13102489 [Google Scholar] [CrossRef]
3. Shin, M., Haberl, J. S. (2019). Thermal zoning for building HVAC design and energy simulation: A literature review. Energy and Buildings, 203(6), 109429. https://doi.org/10.1016/j.enbuild.2019.109429 [Google Scholar] [CrossRef]
4. Khakian, R., Karimimoshaver, M., Aram, F., Benis, S. Z., Mosavi, A. et al. (2020). Modelling nearly zero energy buildings for sustainable development in rural areas. Energies, 13(10), 2593. https://doi.org/10.3390/en13102593 [Google Scholar] [CrossRef]
5. EIA (2022). Annual energy outlook—U.S. energy information administration (EIA). https://www.eia. gov/outlooks/aeo/ [Google Scholar]
6. Pérez-Lombard, L., Ortiz, J., Pout, C. (2008). A review on buildings energy consumption information. Energy and Buildings, 40(3), 394–398. https://doi.org/10.1016/j.enbuild.2007.03.007 [Google Scholar] [CrossRef]
7. Zheng, W., Hu, J., Wang, Z., Li, J., Fu, Z. et al. (2021). COVID-19 impact on operation and energy consumption of heating, ventilation and air-conditioning (HVAC) systems. Advances in Applied Energy, 3, 100040. https://doi.org/10.1016/j.adapen.2021.100040 [Google Scholar] [CrossRef]
8. Pang, Z., Chen, Y., Zhang, J., O’Neill, Z., Cheng, H. et al. (2021). How much HVAC energy could be saved from the occupant-centric smart home thermostat: A nationwide simulation study. Applied Energy, 283(12), 116251. https://doi.org/10.1016/j.apenergy.2020.116251 [Google Scholar] [CrossRef]
9. Jafarpur, P., Berardi, U. (2021). Effects of climate changes on building energy demand and thermal comfort in Canadian office buildings adopting different temperature setpoints. Journal of Building Engineering, 42, 102725. https://doi.org/10.1016/j.jobe.2021.102725 [Google Scholar] [CrossRef]
10. Manjarres, D., Mera, A., Perea, E., Lejarazu, A., Gil-Lopez, S. (2017). An energy-efficient predictive control for HVAC systems applied to tertiary buildings based on regression techniques. Energy and Buildings, 152(1–2), 409–417. https://doi.org/10.1016/j.enbuild.2017.07.056 [Google Scholar] [CrossRef]
11. Wang, W., Zhou, Q., Pan, C., Cao, F. (2022). Energy-efficient operation of a complete Chiller-air handling unit system via model predictive control. Applied Thermal Engineering, 201(5), 117809. https://doi.org/10.1016/j.applthermaleng.2021.117809 [Google Scholar] [CrossRef]
12. Geraldi, M. S., Gnecco, V. M., Barzan Neto, A., Martins Bárbara Ade, M., Ghisi, E. et al. (2021). Evaluating the impact of the shape of school reference buildings on bottom-up energy benchmarking. Journal of Building Engineering, 43, 103142. https://doi.org/10.1016/j.jobe.2021.103142 [Google Scholar] [CrossRef]
13. Pezeshki, Z., Soleimani, A., Darabi, A. (2019). Application of BEM and using BIM database for BEM: A review. Journal of Building Engineering, 23(2), 1–17. https://doi.org/10.1016/j.jobe.2019.01.021 [Google Scholar] [CrossRef]
14. Ascione, F., Bianco, N., de Masi, R. F., Mauro, G. M., Vanoli, G. P. (2017). Energy retrofit of educational buildings: Transient energy simulations, model calibration and multi-objective optimization towards nearly zero-energy performance. Energy and Buildings, 144(1), 303–319. https://doi.org/10.1016/j.enbuild.2017.03.056 [Google Scholar] [CrossRef]
15. Guo, Z., Guo, J., Chu, L., Guo, C., Hu, J. et al. (2022). A hierarchical energy management strategy for 4WD plug-in hybrid electric vehicles. Machines, 10(10), 947. https://doi.org/10.3390/machines10100947 [Google Scholar] [CrossRef]
16. Zhou, D., Park, S. H. (2012). Simulation-assisted management and control over building energy efficiency—A case study. Energy Procedia, 14(2), 592–600. https://doi.org/10.1016/j.egypro.2011.12.980 [Google Scholar] [CrossRef]
17. Queiroz, N., Westphal, F. S., Ruttkay Pereira, F. O. (2020). A performance-based design validation study on EnergyPlus for daylighting analysis. Building and Environment, 183(11), 107088. https://doi.org/10.1016/j.buildenv.2020.107088 [Google Scholar] [CrossRef]
18. Hax, D. R., Leitzke, R. K., da Silva, A. C. S. B., da Cunha, E. G. (2022). Influence of user behavior on energy consumption in a university building versus automation costs. Energy Building, 256(4), 111730. https://doi.org/10.1016/j.enbuild.2021.111730 [Google Scholar] [CrossRef]
19. Mottahedi, M., Mohammadpour, A., Amiri, S. S., Asadi, S., Riley, D. et al. (2015). Parametric analysis of building elements on building energy use. Jurnal Teknologi, 74(4), 79–83. [Google Scholar]
20. Harish, V. S. K. V., Kumar, A. (2016). A review on modelling and simulation of building energy systems. Renewable and Sustainable Energy Reviews, 56(3), 1272–1292. https://doi.org/10.1016/j.rser.2015.12.040 [Google Scholar] [CrossRef]
21. Duarte, C., Raftery, P., Schiavon, S. (2018). Development of whole-building energy models for detailed energy insights of a large office building with green certification rating in Singapore. Energy Technology, 6(1), 84–93. https://doi.org/10.1002/ente.201700564 [Google Scholar] [CrossRef]
22. Zhang, Z., Chong, A., Pan, Y., Zhang, C., Lam, K. P. (2019). Whole building energy model for HVAC optimal control: A practical framework based on deep reinforcement learning. Energy and Buildings, 199(6), 472–490. https://doi.org/10.1016/j.enbuild.2019.07.029 [Google Scholar] [CrossRef]
23. Jones, S. R., Beardmore, J., Gillott, M., Boukhanouf, R., Walker, G. (2018). A control methodology for building energy management systems (BEMS) in heat networks with distributed generation. Energy Procedia, 153, 295–302. https://doi.org/10.1016/j.egypro.2018.10.011 [Google Scholar] [CrossRef]
24. Yelisetti, S., Saini, V. K., Kumar, R., Lamba, R., Saxena, A. (2022). Optimal energy management system for residential buildings considering the time of use price with swarm intelligence algorithms. Journal of Building Engineering, 59(12), 105062. https://doi.org/10.1016/j.jobe.2022.105062 [Google Scholar] [CrossRef]
25. Yun, W. S., Hong, W. H., Seo, H. (2021). A data-driven fault and diagnosis scheme for air handling unit in building HVAC system considering undefined state. Journal of Building Engineering, 35(2), 102111. https://doi.org/10.1016/j.jobe.2020.102111 [Google Scholar] [CrossRef]
Cite This Article
 Copyright © 2023 The Author(s). Published by Tech Science Press.
This work is licensed under a Creative Commons Attribution 4.0 International License , which permits unrestricted use, distribution, and reproduction in any medium, provided the original work is properly cited.
 Downloads
 Citation Tools