
 Submit a Paper
 Propose a Special lssue
 Open Access
ARTICLE

Short-Term Prediction of Photovoltaic Power Generation Based on LMD Permutation Entropy and Singular Spectrum Analysis
School of Locomotive and Vehicle Engineering, Zhengzhou University of Railway Engineering, Zhengzhou, 450000, China
* Corresponding Author: Wenchao Ma. Email:
Energy Engineering 2023, 120(7), 1685-1699. https://doi.org/10.32604/ee.2023.025404
Received 09 July 2022; Accepted 28 November 2022; Issue published 04 May 2023
 View Full Text
 Download PDF
Abstract
The power output state of photovoltaic power generation is affected by the earth's rotation and solar radiation intensity. On the one hand, its output sequence has daily periodicity; on the other hand, it has discrete randomness. With the development of new energy economy, the proportion of photovoltaic energy increased accordingly. In order to solve the problem of improving the energy conversion efficiency in the grid-connected optical network and ensure the stability of photovoltaic power generation, this paper proposes the short-term prediction of photovoltaic power generation based on the improved multi-scale permutation entropy, local mean decomposition and singular spectrum analysis algorithm. Firstly, taking the power output per unit day as the research object, the multi-scale permutation entropy is used to calculate the eigenvectors under different weather conditions, and the cluster analysis is used to reconstruct the historical power generation under typical weather rainy and snowy, sunny, abrupt, cloudy. Then, local mean decomposition (LMD) is used to decompose the output sequence, so as to extract more detail components of the reconstructed output sequence. Finally, combined with the weather forecast of the Meteorological Bureau for the next day, the singular spectrum analysis algorithm is used to predict the photovoltaic classification of the recombination decomposition sequence under typical weather. Through the verification and analysis of examples, the hierarchical prediction experiments of reconstructed and non-reconstructed output sequences are compared. The results show that the algorithm proposed in this paper is effective in realizing the short-term prediction of photovoltaic generator, and has the advantages of simple structure and high prediction accuracy.Keywords
With the development of photovoltaic power generation, the proportion of solar energy in renewable energy is increasing, and the installed capacity of photovoltaic power stations is also increasing [1]. As a kind of clean energy, the power output state of solar energy is unstable under the influence of weather conditions [2]; Due to the influence of the earth's rotation, the power output takes the unit day as the cycle [3]. If photovoltaic power generation can be predicted, it will not only improve the efficiency of photovoltaic grid connection but also help to ensure the quality of power supply.
At this stage, the power prediction of photovoltaic power generation mainly includes direct prediction and indirect prediction [4–6]. Direct prediction is conducive to the historical output sequence to train intermediate parameters. Its main characteristics are low prediction accuracy, long training cycles, and poor adaptability [7,8]. Indirect prediction is to predict photovoltaic output power by analyzing factors that affect photovoltaic power generation, such as solar radiation angle, and temperature, and by forecasting meteorological conditions [9,10].
In direct prediction, literature [11] established a BP neural network short-term prediction model based on historical power output data, which has high requirements on the number of sample sets and poor universality due to different environmental conditions in different places. Literature [12] established a Mathematical model of the Markov chain according to the characteristics of photovoltaic power generation, and directly predicted the power sequence through the state transition matrix. Although the structural model of the prediction algorithm is simple, it is not sensitive enough in the face of mutation, and the prediction stability is poor.
In indirect prediction, literature [13,14] analyzed the meteorological conditions of similar days, takes similar days as the training set, and uses the improved support vector machine algorithm to achieve the short-term prediction of photovoltaic power generation. Although different meteorological conditions are considered, the analysis of the characteristic factors affecting the output power is too little. In literature [15–17], feature factor analysis was used for preprocessing, such as kernel principal component analysis and information fusion technology analysis. When the comprehensive index of the principal component is used for linear regression prediction, the difference between different meteorological conditions is not considered, and the output power under different seasons is not treated differently, so the adaptability of short-term prediction is poor.
Based on the above analysis, to eliminate the influence of weather conditions, in addition to the indirect prediction method, this paper also improves the direct prediction method and proposes the short-term prediction of photovoltaic power generation based on LMD permutation entropy and singular spectrum analysis. Firstly, multi-scale permutation entropy was used to measure the characteristics of PV power series under different weather types, and the historical power series were reconstructed in daily units. Secondly, the hierarchical prediction method is used for the recombination sequence, and the LMD algorithm is used to decompose it to extract more frequency components. Finally, the singular spectrum analysis algorithm is used to predict the decomposed components, and the prediction results of each component are reconstructed. The validity of the proposed algorithm is verified by an example under different prediction algorithms, and the prediction accuracy is improved.
The main innovation points of this paper are as follows: 1) To eliminate the influence of weather factors, the multi-scale permutation entropy is used to classify and process the photovoltaic power generation sequence under different meteorological conditions. 2) After reassembling the reconstructed sequence, the LMD algorithm is used to extract the detailed components. 3) Use the singular spectrum analysis algorithm to achieve the hierarchical prediction of photovoltaic power generation.
2 Analysis of Photovoltaic Power Generation State Elements
The calculation of output current and output power of photovoltaic power generation on the unit array is shown in Eqs. (1) and (2) [18].
In Eqs. (1) and (2), I is the output current of photovoltaic power generation, IL is the photocurrent determined by the solar radiation intensity; T is the temperature of the day; ID is the diode current determined by the number of photovoltaic cells and T; IS is determined by the resistance on the PV panel, V, RS and RSH are the PV voltage, series, and parallel resistance, respectively; S is the illuminated area of photovoltaic power generation;
According to the above analysis, photovoltaic power generation status is mainly determined by meteorological conditions: temperature, sunshine amount, solar radiation angle, and weather conditions. In this paper, the PV output power between sunrise 6:00 and sunset 21:00 is firstly counted. According to the historical data of a power plant, taking the meteorological data of the China Meteorological Bureau on rainy and snowy days, sunny days, abrupt days, and cloudy days as examples, its output power curve is shown in Fig. 1.
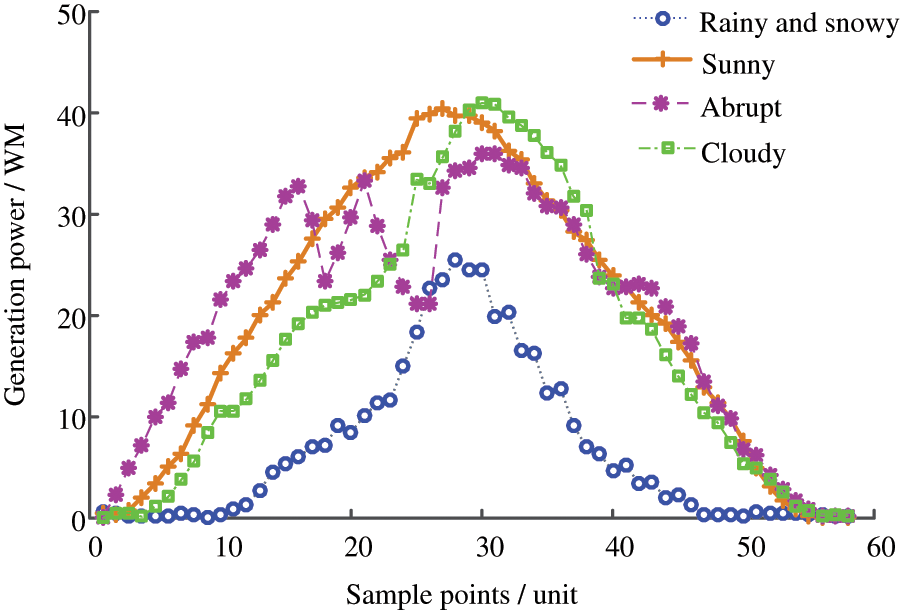
Figure 1: PV power output curve under different weather
According to the output power curves under different weather conditions, the output power is affected by the coverage of rain and snow on snowy days, and the PV output power is the lowest. In lightning weather, influenced by meteorological mutation, photovoltaic power output randomness is strong; under the influence of solar radiation intensity, the PV output power is lower on cloudy days and sunny days.
Thus, on the other hand, the state of photovoltaic output power is determined by meteorological conditions, and on the other hand, its mechanical structure. To realize the short-term prediction of its output power, the first thing to be solved is to quantitatively analyze the output power under different meteorological conditions, to make a more accurate short-term prediction of photovoltaic power generation.
3.1 Local Mean Decomposition (LMD)
As a signal processing method, local mean decomposition has the advantage of processing nonlinear and non-stationary signal sequences [19]. Compared with the small wave decomposition, empirical mode decomposition, and variational mode decomposition, it does not need the adaptive advantage of the basis function, and solves the frequency aliasing of the decomposed components, avoiding the local effect of the endpoints of the signal sequence.
The local mean decomposition algorithm uses the extreme points of time series to process the moving average value and decomposes the original signal sequence x(t) into a Eq. (3).
where PFi(t) is the corresponding decomposition component, u(t) is the residual component
Assume that the local extreme point of the original time series x(t) is nj, where j is the number of extreme points. In the decomposition process, the average mi of two adjacent extreme points is taken as the window, and the local mean component mik is formed after sliding and smoothing processing. The corresponding ai is the estimated value of the envelope, and the envelope decomposition component aik is formed after sliding smoothing.
In the decomposition process, hik(t) and sik(t) are intermediate parameters in the decomposition process, and finally, the original time series is decomposed into decomposition components with different frequency characteristics.
3.2 Improve Multi-Scale Permutation Entropy
Multi-scale permutation entropy is a measure of time sequence complexity index [20], with signal sequence
Step1: Coarse granulation treatment
Taking the scale factor s as the parameter, the coarsening process of time signal series X is shown in Eq. (4).
When the number of sampling points is insufficient, such as n = 200 and s = 4, and the length of the sequence y after coarsening is 50, the following problems may be caused:
1) In the coarse granulation process of the one-dimensional signal sequence, the number of samples decreases, and the feature representation is not sufficient;
2) Calculating the mean value under the scale factor may lead to decreased sensitivity to signal sequence.
Therefore, in this paper, the coarse granulation process is improved progressively. Assuming s = 4, the calculation method is as follows:
Firstly, the mean values of
Then, the above four coarse-graining values are taken as the first value of the improved coarse-graining sequence, then the sequence of the second value of the first group of sequences after corresponding improvement is
Finally, the operations of Step2, Step3, and Step4 are carried out on the four groups of coarse granulation respectively, and then the mean values of the four groups are taken to complete the improvement of the multi-scale permutation entropy.
Step2: Phase space reconstruction
Assuming that the time delay parameter is τ and the embedding dimension is m, spatial reconstruction is carried out for the coarse-grained one-dimensional signal sequence, and the reconstructed matrix is shown in Eq. (5).
where, l = 1, 2,…,K, K = [n/s] − (m − 1)τ.
Step3: Calculation of permutation entropy
Each row of the reconstructed matrix is arranged in descending order, and the index column number of the column where the vector element value resides can be expressed as:
where, l = 1, 2,…, K, K
The probability value of S(l) in the line of the entire reconstruction matrix is Pl. After statistics, the calculation result of multi-scale permutation entropy is shown in Eq. (7).
Step4: Standardized treatment
To realize the normalization and standardization of the entropy results, the entropy results of Step3 are calculated as shown in Eq. (8).
The above entropy calculation process is mainly used to calculate the characteristic parameters of time series. As a kind of characteristic quantity, multi-scale permutation entropy is conducive to the establishment of signal sequence measurement standards on the one hand and improves the accuracy of subsequent signal sequence processing when used as a correction parameter on the other hand.
3.3 Singular Spectrum Analysis (SSA)
SSA is a regression prediction algorithm for discrete signal sequences, which is suitable for processing time series of nonlinear and potential structures [18]. On the one hand, photovoltaic power is affected by the amount of sunshine and has a 24-h periodicity. On the other hand, it is affected by uncertain factors, such as meteorological factors, geographical latitude factors, direct sun Angle, wind speed, etc., resulting in strong randomness of time signal sequence. Therefore, the SSA algorithm first meets its characteristics in terms of applicability. Secondly, the basic process of the SSA algorithm is as follows:
Assumption: non-zero original signal sequence X* is shown in Eq. (9), where N is the length of the signal sequence.
Step1: Establish the trajectory matrix
Take the integer i as the variable, embed the original signal sequence X, and take the growth L(1 < L < N) as the vector:
where, the value range of i is [1, K] and K = N – L + 1. The corresponding trajectory matrix X is shown in Eq. (11).
Step2: Singular value decomposition
Firstly, S matrix is established according to the trajectory matrix
Then,
Finally,
where,
Step3: Grouping of singular decomposition matrices
The set {1,2,…,d} is reconstructed into m disjoint subsets, then subset I and corresponding grouping matrix XI are shown in Eqs. (14) and (15).
where, p is the length of the subset, and it can be obtained:
Step4: Recombination of the one-dimensional signal sequence
Signal sequence recombination mainly adopts the diagonal averaging method to recombine each grouping matrix
where, 1 < i < L, 1 < j < K; L* = min(L, K), K* = max(L, K). Thus, the two-dimensional matrix can be expressed as the one-dimensional matrix as shown in Eq. (18).
Step5: Prediction of one-dimensional signal
Two algorithms, recursion, and matrix are mainly used for prediction using singular value decomposition results. The recursive algorithm with a simpler algorithm is adopted in this paper, and its main ways are as follows:
where,
Pi is an orthonormal vector in singular value decomposition, and
The singular spectrum decomposition algorithm uses a singular value matrix to decompose the original signal sequence into different components from three directions of trend, vibration component, and an unstable factor. SSA algorithm is not only suitable for nonlinear and discrete time series but also has the advantage of not requiring specific parameter models and stability conditions.
4 Short-Term Forecasting Process of PV Power Generation
In the process of photovoltaic power generation, its output power is unstable due to the influence of uncertain factors. To better realize photovoltaic grid connection and improve power supply quality, this paper proposes a short-term prediction algorithm for photovoltaic power generation based on LMD permutation entropy and singular spectrum analysis. The specific process is shown in Fig. 2.
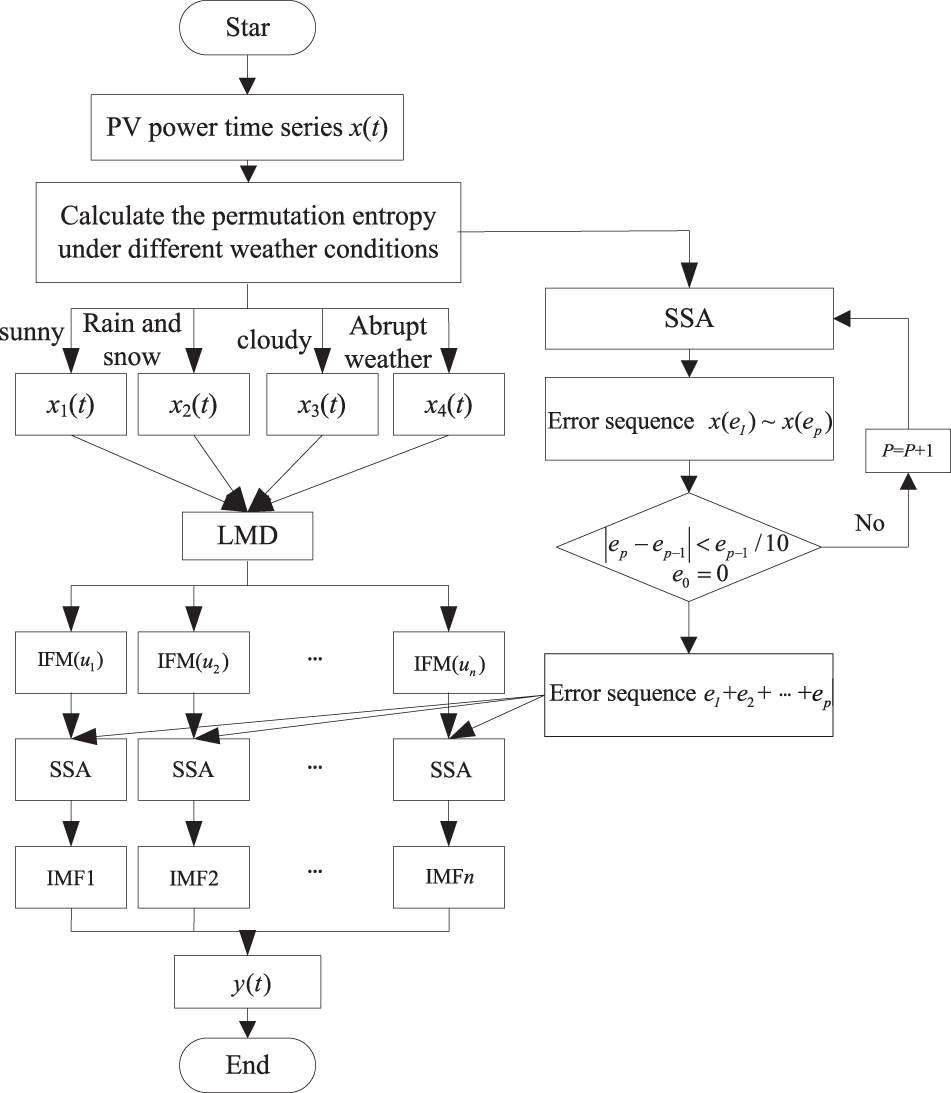
Figure 2: Short-term forecasting process of PV power generations
1) Photovoltaic power generation is affected by the rotation of the earth, and its output power has a 24-h periodicity. To eliminate the influence of weather factors on the output power of photovoltaic power generation, the meteorological conditions can be roughly divided into sunny weather (sufficient sunshine), rainy and snowy weather (less sunshine), cloudy day (insufficient sunshine), and abrupt weather (strong randomness of sunshine) according to the monitoring data of the Meteorological Bureau and the permutation entropy characteristic analysis.
According to the above analysis, to better realize the short-term prediction of photovoltaic power generation, firstly, the historical power curve of photovoltaic power generation is classified according to four meteorological types. Then the output power curves of x1, x2, x3, and x4 under four meteorological conditions are formed. Finally, the accuracy of the short-term forecast can be improved according to different meteorological conditions.
2) x1, x2, x3, and x4 are selected as historical output power curves under different meteorological types according to meteorological prediction and clustering results under the next one-day cycle. To realize the classification prediction of photovoltaic power generation, the LMD algorithm is used to process it, and
3) Each decomposed component is analyzed and predicted by a singular spectrum, and the hierarchical prediction results of IFM(u1), IFM(u2), …, IFM(un) are obtained. Then, The multi-scale permutation entropy is used to construct photovoltaic series under different weather types, and SSA prediction is carried out for them, and the error sequence e1 is obtained by comparing with the initial sequence; The prediction sequence is predicted again, and the error sequence e2 is obtained by comparing with the prediction sequence; By analogy, a complete error sequence is obtained to correct the prediction results of different components, thus reducing the error. Finally, through the reconstruction under the LMD algorithm, the photovoltaic power generation in the corresponding next-day cycle is obtained, to realize the short-term prediction of power generation.
5.1 Reorganization of Output Power Curve of Photovoltaic Power Generation
According to the analysis in Section 2, meteorological conditions are the main factors affecting the output state of photovoltaic power generation. To eliminate their influence, this paper adopts a multi-scale permutation entropy algorithm to realize the reorganization of the output power curve of photovoltaic power generation. This paper selects the historical output power data of a power plant, whose rated power generation is 50 MW. Taking the typical output power curves in Fig. 1 under different weather conditions as an example, the scale permutation entropy of photovoltaic power generation output power in four different states iss calculated.
Photovoltaic power generation cycle within 24 h, taking 15 min as the sampling point, the number of sampling points from 6:00 to 21:00 is n = 60, n
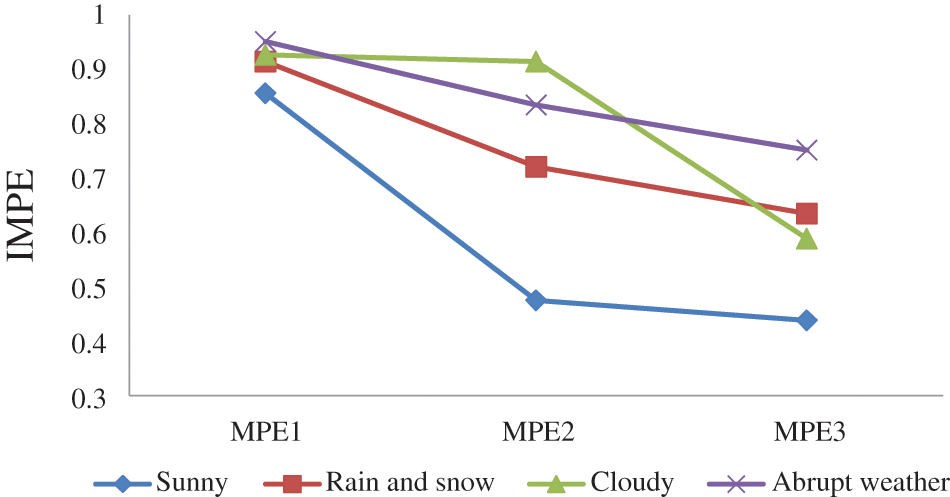
Figure 3: Permutation entropy distribution under typical weather conditions
As shown in Fig. 3, in the permutation entropy distribution of photovoltaic power output under rainy and snowy, sunny, abrupt, and cloudy weather, the permutation entropy distribution is different under different weather conditions, so it can be used as a recombination condition under the same condition.
Firstly, the action power curve is divided into a sample set and a test set. The sample set includes Group 1, Group 2, …, Group N, and N sample objects that have n different states (N
Taking a sunny day as an example, the reconstituted output sequence is shown in Fig. 4.
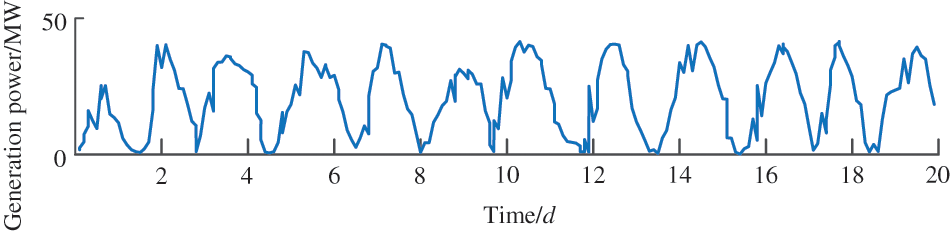
Figure 4: Reorganization of photovoltaic output power sequence under sunny weather conditions
It can be seen from the generation power diagram in Fig. 4 that the output power presents nonlinear and unsteady characteristics. To fully characterize the characteristics of the curve, the multi-scale permutation entropy of the output power series under the daily cycle is calculated, and the PV output series is reconstructed by combining four typical weather conditions: a sunny day, rain and snow day, abrupt weather, and cloudy day. Then, the original curve is decomposed into modal function components with different frequency characteristics by LMD. Finally, it lays a foundation for improving prediction accuracy.
5.2 LMD Processing of Power Sequence after Reconstruction
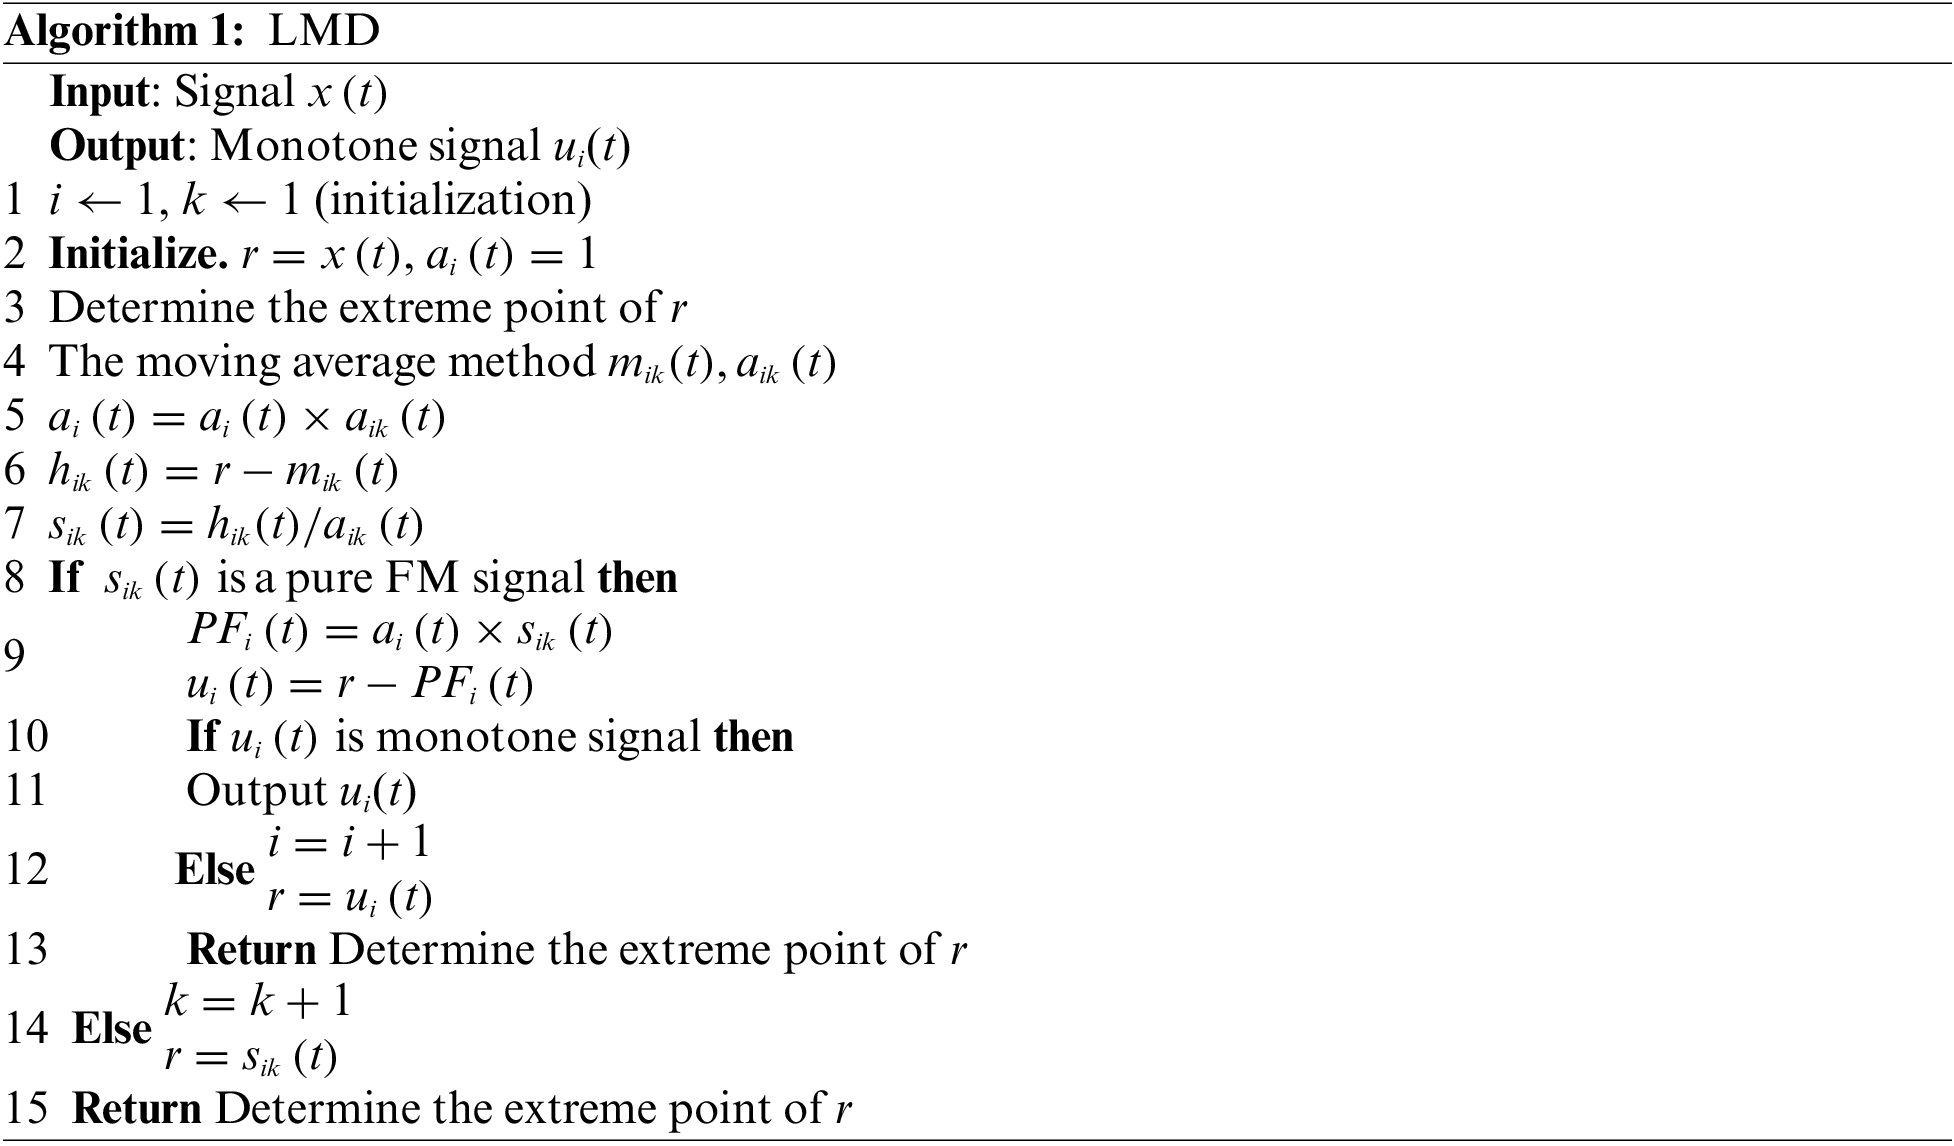
Given the power sequence reconstruction in the above section, the LMD algorithm has the advantage of self-adaptation and decomposition, which is conducive to the realization of hierarchical prediction. The decomposition process of LMD is shown in Algorithm 1. Taking the reconstructed power series under sunny days as an example, the results after LMD processing are shown in Fig. 5. Where
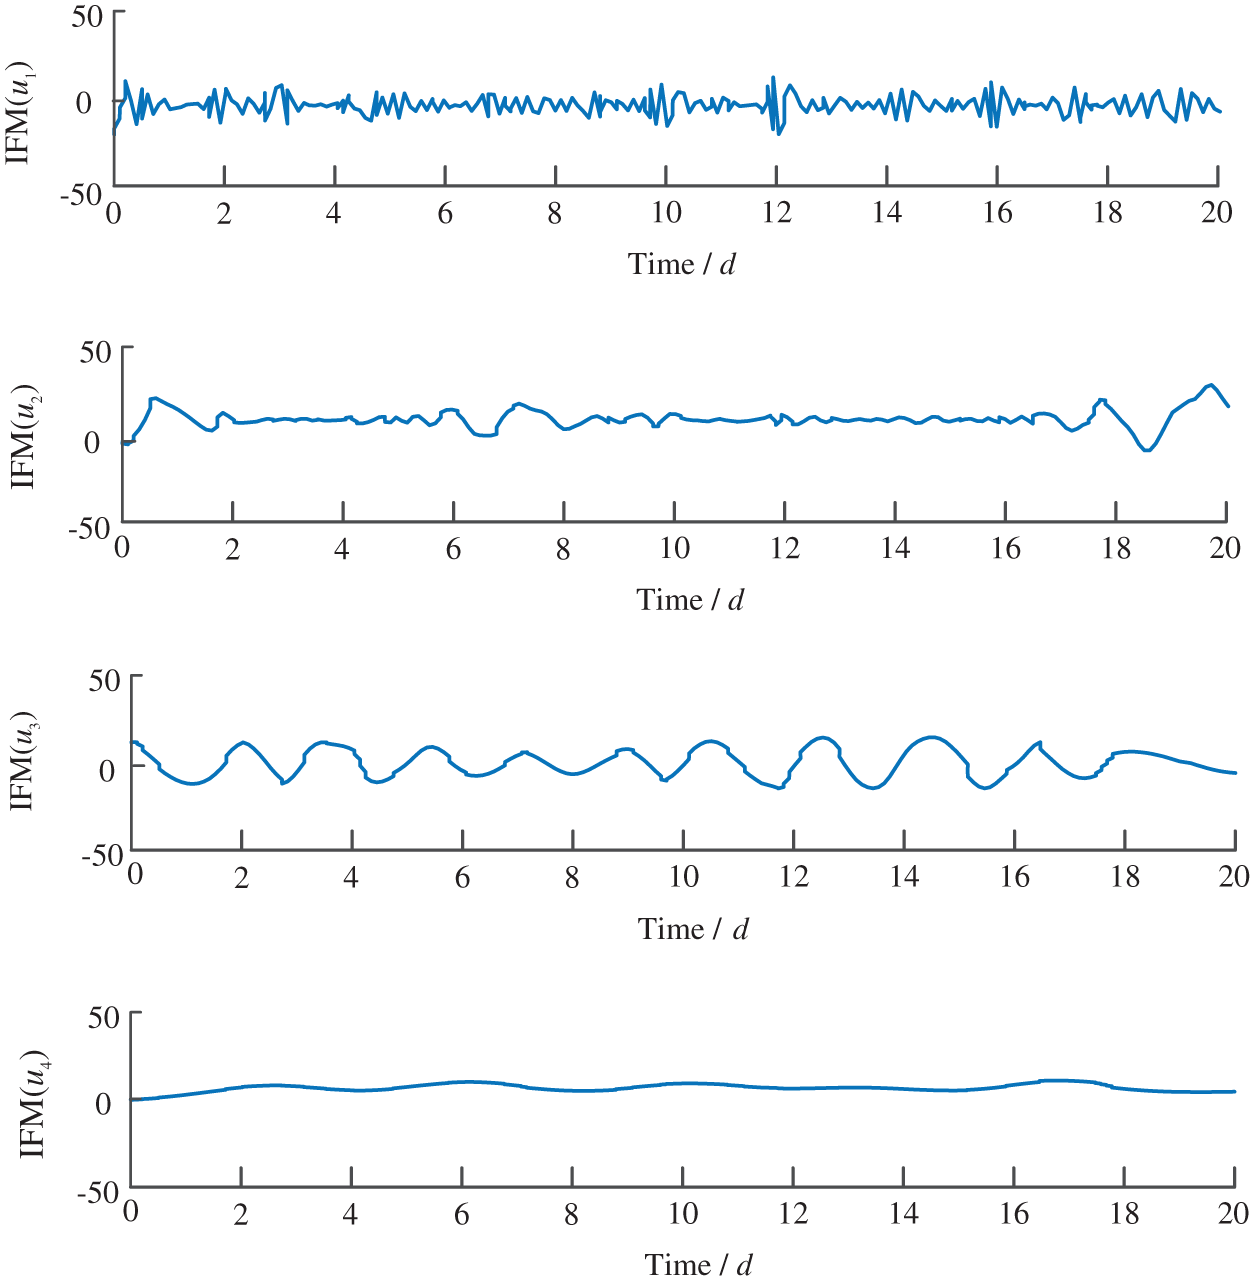
Figure 5: LMD processing of photovoltaic output power series under sunny weather conditions
As shown in Fig. 5, when decomposed to IMF(u4), the distribution of extreme points is insufficient and meets the conditions for termination of decomposition. Under the same weather type, the center frequencies of different decomposition components are different. In different weather types, the center frequency of the same decomposition component is also different. After the original signal is processed by LMD, it is beneficial to achieve hierarchical prediction and improve the prediction accuracy under the condition that the properties of the original signal sequence remain unchanged.
5.3 Singular Spectrum Analysis of Power Sequence
5.3.1 Graded Prediction Results
If the original output power is simply used as the prediction input sequence, the influence of weather factors is not considered for hierarchical prediction. Taking the historical power generation series of a power plant as an example, this paper reorganizes the photovoltaic power generation series under sunny weather in spring and uses the reconstructed 16-day historical power data as the training set. According to the weather forecast of the Meteorological Bureau, the singular spectrum analysis algorithm is used to make short-term forecasts for the next day, and the prediction result is shown in Figs. 6 and 7.
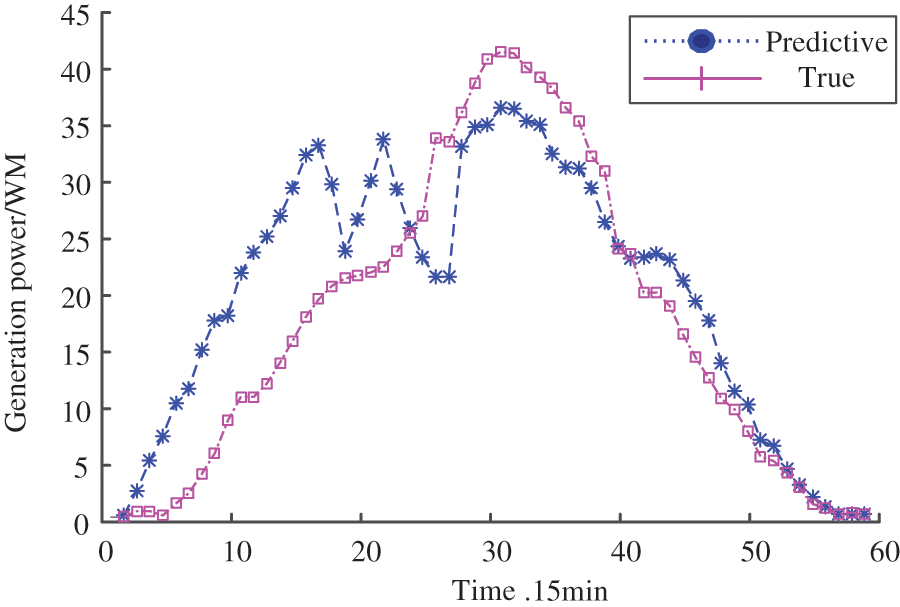
Figure 6: Short-term prediction results of photovoltaic sequence based on SSA
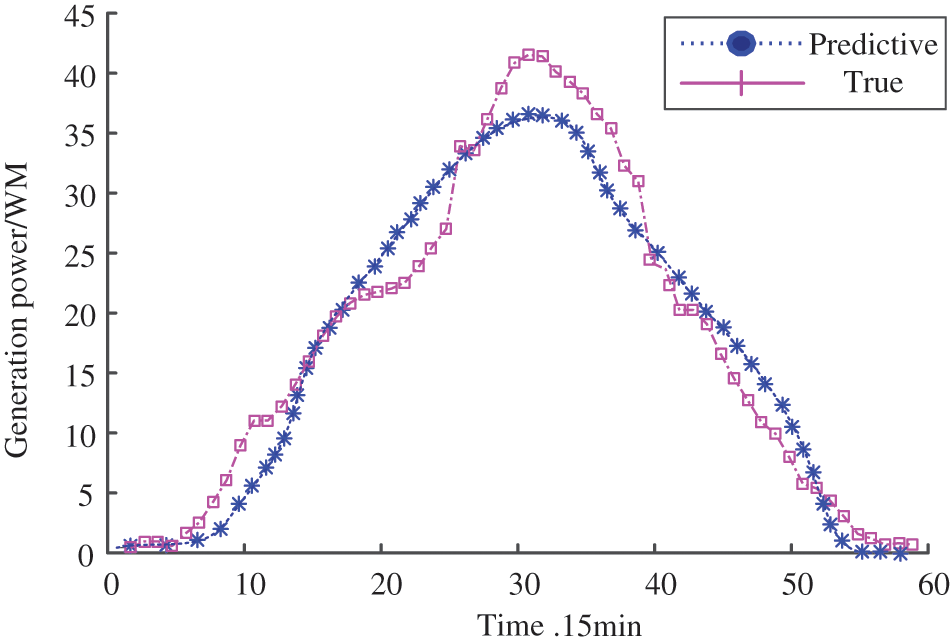
Figure 7: Photovoltaic sequence short-term prediction results of SSA under multi-scale permutation entropy
According to the graded prediction results in Fig. 6, the root means square error (RMES) and mean relative error (MRE) is calculated to be 25.67% and 15.21%, respectively. In Fig. 7, the root means square error (RMES) and mean relative error (MRE) is calculated to be 21.89% and 11.56%, respectively. Without considering the state of weather factors, abrupt weather or other weather is likely to become uncertain factors, so the forecast results will inevitably be unstable.
5.3.2 Refactoring-Grading Short-Term Forecast Results
Reconstruction-Classification short-term prediction is to reconstruct the original sequence according to the weather type, then use LMD classification prediction, and finally recombine the different decomposition components to achieve short-term prediction of photovoltaic power generation. When the weather of the day is predicted to be sunny by the Meteorological Bureau, the recombination sequence under sunny weather conditions is used as the historical power. When the weather of the predicted day is rain and snow, the recombination sequence under typical rain and snow weather conditions is used as the historical power. And the same goes for four typical weather conditions.
Taking the reconstructed sequence in typical sunny weather in Fig. 4 as an example, combined with the meteorological prediction conditions of the same day, the reconstructed historical data of the 16th day is taken as the training set, and the singular spectrum analysis algorithm is used to reconstruct it. The short-term prediction results of the classification are shown in Fig. 8.
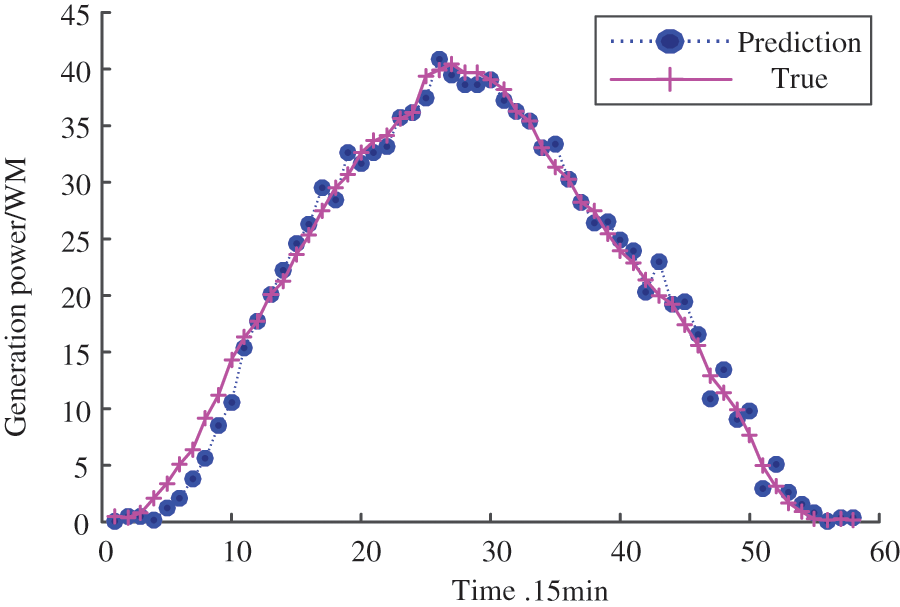
Figure 8: Refactoring-grading short-term forecast results
Compared with the predicted results in Fig. 7, the predicted results in Fig. 8 show RMSE = 3.17% and MES = 1.51%.
To further prove the advantages of singular spectrum analysis algorithm in photovoltaic power generation sequence prediction, this paper selects multivariable support vector (SSVM) [19], extreme learning machine (ELM) [20], BP neural network [21], and other algorithms for comparative analysis [22–24]. The output power of photovoltaic power generation is affected by many uncertain factors. In this paper, four different weather types in spring, summer, autumn, and winter are selected to predict a total of 16 kinds of power generation. Taking a sunny day in spring as an example, and taking the historical data of the first 20 days of the generation system as the training set, the corresponding generation power curve is drawn, as shown in Fig. 5. For different prediction algorithms, the resulting errors are shown in Table 1:
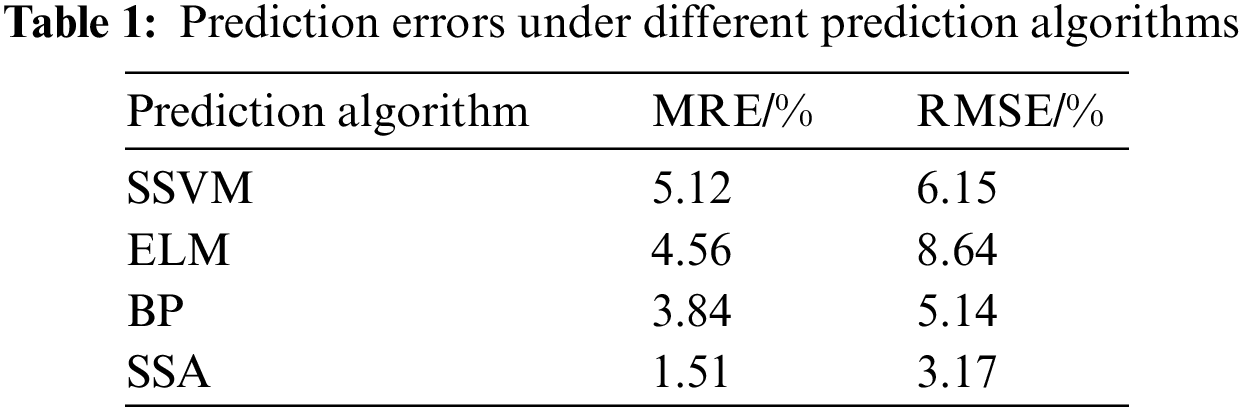
Through the above analysis, the effectiveness of using multi-scale permutation entropy to reconstruct the output sequence is proved, the influence of weather and other uncertain factors is eliminated, the advantage of using the SSA algorithm to deal with the one-dimensional discrete sequence is improved, and the prediction accuracy of photovoltaic power generation is improved.
Given the unstable phenomenon of PV power output state, this paper proposes the short-term prediction of PV power based on LMD permutation entropy and singular spectrum analysis, and the following conclusions are drawn through case demonstration:
1) Using multi-scale permutation entropy as the state characteristic value of output power under different meteorological conditions, the historical output sequence is reconstructed to eliminate the influence of meteorological conditions on the forecast sequence.
2) LMD algorithm has the advantage of self-adaptation in signal processing and achieves hierarchical prediction for the reconstructed sequence.
3) Using the advantage of singular spectrum analysis in processing discrete signal sequences, the short-term power prediction is realized by the reconstructed sequence after the hierarchical prediction of decomposed components.
Finally, an example is used to verify the short-term prediction of pure signal sequences considering weather conditions. Then, the short-term prediction of photovoltaic sequences reconstructed under the multi-scale permutation entropy algorithm under different meteorological conditions is compared. The experimental results prove the improvement of RMSE and MES of the proposed algorithm in photovoltaic prediction. Compared with the experimental results under different prediction algorithms, it is proved that singular spectrum decomposition is more beneficial to realizing photovoltaic grid connection.
Acknowledgement: The author is very grateful for the experimental platform provided by Zhengzhou University of Railway Engineering.
Funding Statement: The author received no specific funding for this study.
Conflicts of Interest: The author declares that they have no conflicts of interest to report regarding the present study.
References
1. Long, H., Zhang, Z., Su, Y. (2014). Analysis of daily solar power prediction with data-driven approaches. Applied Energy, 126, 29–37. https://doi.org/10.1016/j.apenergy.2014.03.084 [Google Scholar] [CrossRef]
2. Du, Z. Y., Chen, X. Y., Wang, H., Wang, X. H. (2022). Short-term prediction of photovoltaic power based on fusion device feature-transfer. Energy Engineering: Journal of the Association of Energy Engineering, 119(4), 1419–1438. https://doi.org/10.32604/ee.2022.020283 [Google Scholar] [CrossRef]
3. Lu, X. J., Zhang, Q. B. (2021). FCS-MPC strategy for pv grid-connected inverter based on mld model. Energy Engineering: Journal of the Association of Energy Engineering, 118(6), 1729–1740. https://doi.org/10.32604/EE.2021.014938 [Google Scholar] [CrossRef]
4. Jayawardene, I., Venayagmoorthy, G. K. (2015). Comparison of adaptive neuro-fuzzy inference systems and echo state networks for PV power prediction. Procedia Computer Science, 53, 92–102. https://doi.org/10.1016/j.procs.2015.07.283 [Google Scholar] [CrossRef]
5. Li, H., Gong, S., Lai, L., Han, Z., Qiu, R. Q. et al. (2012). Efficient and secure wireless communications for advanced metering infrastructure in smart grids. IEEE Transaction on Smart Grid, 3(3), 1540–1551. https://doi.org/10.1109/TSG.2012.2203156 [Google Scholar] [CrossRef]
6. Li, Y., Ye, F., Liu, Z., Wang, Z. J., Mao, Y. P. (2021). A short-term photovoltaic power generation forecast method based on LSTM. Mathematical Problems in Engineering, 2021(11), 1–11. https://doi.org/10.1155/2021/6613123 [Google Scholar] [CrossRef]
7. Yu, L., Ma, X., Wu, W., Xiang, X. W., Wang, Y. et al. (2021). Application of a novel time-delayed power-driven grey model to forecast photovoltaic power generation in the Asia-Pacific region. Sustainable Energy Technologies and Assessments, 44(1), 100968. https://doi.org/10.1016/j.seta.2020.100968 [Google Scholar] [CrossRef]
8. Rodríguez, F., Galarza, A., Vasquez, J. C., Guerrero, J. M. (2022). Using deep learning and meteorological parameters to forecast the photovoltaic generators intra-hour output power interval for smart grid control. Energy, 239, 122116. [Google Scholar]
9. Trop, J. A., Gilbert, A. C. (2008). Signal recovery from random measurements via orthogonal matching pursuit. IEEE Signal Processing Magazine, 25(6), 131–146. [Google Scholar]
10. Kabilan R., Chandran, V., Yogapriya, J., Karthick, A., Gandhi, P. P. et al. (2021). Short term power prediction of building integrated photovoltaic (BIPV) system based on machine learning algorithms. International Journal of Photoenergy, 2021, 1–11. https://doi.org/10.1155/2021/5582418 [Google Scholar] [CrossRef]
11. Ji, L., Niu, D., Wang, P. (2015). Photovoltaic load forecasting based on the similar day and Bayesian neural network. Chinese Journal of Management science, 23(3), 118–122. [Google Scholar]
12. Zhang, X. Y., Deng, C. H., Chen, T. T. (2011). Ultra-short-term ahead generating power forecasting for PV system based on markov chain for error series. Advanced Materials Research, 347–353, 1498–1505. https://doi.org/10.4028/www.scientific.net/AMR.347-353.1498 [Google Scholar] [CrossRef]
13. Wang, S., Zhang, N. (2012). Short-term output power forecast of photovoltaic based on a grey and neural network hybrid model. Dianli Xitong Zidonghua/Automation of Electric Power Systems, 36(19), 37–41. [Google Scholar]
14. Sn, A., Fvl, B., Po, A., Schaumann, P., Schmidt, V. et al. (2021). Probabilistic forecasting of photovoltaic power supply—A hybrid approach using D-vine copulas to model spatial dependencies. Applied Energy, 304, 117599. [Google Scholar]
15. Dou, C., Qi, H., Wei, L., Zhang, Y. M. (2018). Elman neural network based short-term photovoltaic power forecasting using association rules and kernel principal component analysis. Journal of Renewable & Sustainable Energy, 10(4), 55–64. https://doi.org/10.1063/1.5022393 [Google Scholar] [CrossRef]
16. Lauria, D., Mottola, F., Proto, D. (2022). Caputo derivative applied to very short time photovoltaic power forecasting. Applied Energy, 309, 118452. https://doi.org/10.1016/j.apenergy.2021.118452 [Google Scholar] [CrossRef]
17. Almeida, M. P., Perpinan, O., Narvarte, L. (2015). PV power forecast using a nonparametric PV model. Solar Energy, 115(10), 354–368. https://doi.org/10.1016/j.solener.2015.03.006 [Google Scholar] [CrossRef]
18. Wei, M., Zhang, T., Gao, X., Wang, S. M. (2020). Photovoltaic power prediction method based on DA-RKELM algorithm. Journal of System Simulation, 32(10), 11–20. [Google Scholar]
19. Cheng, J., Yi, Y., Yu, Y. (2012). A rotating machinery fault diagnosis method based on local mean decomposition. Digital Signal Processing, 22(2), 356–366. https://doi.org/10.1016/j.dsp.2011.09.008 [Google Scholar] [CrossRef]
20. Ouyang, G., Li, J., Liu, X., Li, X. L. (2013). Dynamic characteristics of absence EEG recordings with multiscale permutation entropy analysis. Epilepsy Research, 104(3), 246–252. https://doi.org/10.1016/j.eplepsyres.2012.11.003 2013. [Google Scholar] [PubMed] [CrossRef]
21. Jin, X., Guo, J., Shen, Y., Liu, X., Zhao, C. M. (2021). Application of singular spectrum analysis and multilayer perceptron in the mid-long-term polar motion prediction. Advances in Space Research, 68(9), 3562–3573. https://doi.org/10.1016/j.asr.2021.06.039 [Google Scholar] [CrossRef]
22. Liu, L., Lu, Y., Li, S. (2020). Photovoltaic power forecasting based on SVM optimized by improved ABC. IOP Conference Series Earth and Environmental Science, 474(5), 052036. https://doi.org/10.1088/1755-1315/474/5/052036 [Google Scholar] [CrossRef]
23. Ramkumar, G., Sahoo, S., Amirthalakshmi, T. M., Ramesh, S., Prabu, R. T. et al. (2021). A short-term solar photovoltaic power optimized prediction interval model based on FOS-ELM algorithm. International Journal of Photoenergy, 24(6), 367–389. https://doi.org/10.1155/2021/3981456 [Google Scholar] [CrossRef]
24. Zhou, B., Yan, D., Xiong, L., Li, Y. M., Zhang, Y. F. (2021). Distributed photovoltaic short-term power prediction based on genetic algorithm optimized BP neural network. IOP Conference Series Earth and Environmental Science, 692(2), 022104. https://doi.org/10.1088/1755-1315/692/2/022104 [Google Scholar] [CrossRef]
Cite This Article
 Copyright © 2023 The Author(s). Published by Tech Science Press.
This work is licensed under a Creative Commons Attribution 4.0 International License , which permits unrestricted use, distribution, and reproduction in any medium, provided the original work is properly cited.
 Downloads
 Citation Tools