
 Submit a Paper
 Propose a Special lssue
 Open Access
ARTICLE
Flow Structure and Short-Term Riverbed Evolution in Curved Flumes
1 Tianjin Research Institute for Water Transport Engineering, Ministry of Transport, Tianjin, China
2 South China Sea Marine Survey and Technology Center, State Oceanic Administration, Guangzhou, China
3 State Key Laboratory of Hydraulic Engineering Simulation and Safety, Tianjin University, Tianjin, China
* Corresponding Author: Yonggang Cao. Email:
Fluid Dynamics & Materials Processing 2023, 19(2), 487-500. https://doi.org/10.32604/fdmp.2022.021149
Received 30 December 2021; Accepted 02 April 2022; Issue published 29 August 2022
 View Full Text
 Download PDF
Abstract
River bending is the major effect responsible for bed topography and bank changes. In this study, fluid velocity (measured by a three-dimensional Doppler advanced point current meter) and bed topographical data have been collected in 40 sections of an experimental model. The whole flume was composed of an organic glass bend, upstream and downstream water tanks, two transition straight sections, a circulation pump, and a connection pipeline. Each section has been found to be characterized by a primary circulation and a small reverse circulation, with some sections even presenting three more or more circulation structures. The minimum circulation intensity has been detected in proximity to the top of the curved channel, while a region with small longitudinal velocity has been observed near the concave bank of each bend, corresponding to the flat bed formed after a short period of scouring. The maximum sediment deposition and scour depth in the presence of a uniform distribution of living flexible vegetation within 10 cm of the flume wall have been found to be smaller than those observed in the tests conducted without vegetation.Keywords
Most natural river bends comprise continuous, curved channels with rushing streams and intricate surroundings. Therefore, it is challenging to observe these rivers’ flow structure and morphology. Vriend et al. [1] conducted important field measurements in two successive sharply curved short bends in the river Dommel, the Netherlands. Priego-Hernández et al. [2] performed field experiments in a natural river using a RiverCat ADCP from SonTek. Despite the importance of fieldwork, significant advances have also been made in the design of generalized models to investigate the flow structure and bed evolution characteristics in naturally curved rivers. For example, Hooke [3] built and used a curved flume based on a sine-generated curve to investigate the bottom shear stress and bed scouring characteristics. The researcher set the groundwork for further investigation into the flow structure and bed morphology based on the sine derivative curve–generalized flume.
Later, Termini et al. [4–6] generalized sine-generated curve–based flumes at a deflection angle of 110 degrees and a width-to-depth ratio of either
There are relatively fewer studies on the flow structure under movable bed conditions for curved flumes than under fixed bed conditions. The frequent interactions between the flow and bed sediments have restricted the use of velocity measurement equipment with single points or small profiles. Moreover, the data obtained are not synchronous. Therefore, it is difficult to characterize the local bed flow structure and the bed surface stress distribution in the whole bend. It is also impossible to reliably predict the changes in the bed surface morphology.
Early studies exclusively discussed flow field and bed scouring scenarios in continuous curved flumes. However, they rarely explored the effects of aquatic plants on the morphological changes in a river bend [11]. Aquatic plants are widely distributed in shores and bed regions of the natural rivers. These plants are an essential component of a river’s ecology. Some scholars view plants as bulges in the bed that are oriented against the water flow. Aquatic plants are also believed to inhabit a particular section of the river, which might hinder and decrease the water flow in that region. Hence, there is some serious discussion regarding the effects of vegetation on the river flow. However, different plants have significant effects on the water flow due to their different relative heights. Consequently, there may be a difference in the bed topography. Therefore, it is necessary to conduct more research on the effects of plants on the evolutionary characteristics of bed topography.
The relationship between aquatic plants and river bed evolution has recently piqued researchers’ interest because of its implications on sound river development and the notion of ecological watercourses [12–14]. Aquatic plants affect the river’s hourly average flow field distribution and turbulence. They can also affect the transportation of sediments, nutrients, and pollutants. Complex hydrodynamic forces and aquatic environmental conditions also impact the bed topography of a curved channel. Notably, the relationship between dominant factors and the bed response has sparked much interest globally.
Qu et al. [15,16] investigated the effects of different plants (simulated) made from flexible plastics on the flow characteristics in an open channel. The researchers also discussed similar bed problems in an open channel flow with different plants. Termini [17] considered the effects of vegetation on the cross-sectional flow and bed shear distribution along a high-curvature bend. Furthermore, the researcher used the data collected in a large-amplitude meandering flume during a reference experiment without vegetation and an experiment with vegetation on the bed. Later, Termini et al. [18,19] thoroughly measured and analyzed velocity in vegetation-covered channels of flexible submerged vegetation and rigid emergent vegetation. In addition, the researcher analyzed the effects of living vegetation on the transverse circulation in a high-curvature flume. Amirhossein et al. [14] used a validated k−ε numerical model to investigate the effects of discontinuous layered vegetation patches on the flow turbulence under varying vegetation density and patch length conditions. Tu [20] performed a series of water-sediment movable bed tests in a glass curved (180°) flume (length: 90 m, height: 1 m, and width: 1 m). In this system, organic glass rods were used to simulate rigid emergent vegetation in natural watercourses to investigate their effects on the surface velocity distribution, 3D velocity distribution, 3D turbulence intensity distribution, bed-load discharge per unit, and bed topographical changes. Termini [21] planted living flexible plants along a straight riverbed in a laboratory and examined the turbulence and diffusion processes in flexible dense vegetation on the bed. The above literature mainly focused on flow hydrodynamics with rigid or flexible vegetation in vegetated regions of the straight channels and high-amplitude meanders. However, these studies assumed that the channel bed does not change with changes in the water flow and the movement of vegetation, which seldom occurs in the evolutionary process of natural rivers.
The stream can shape the riverbed. In addition, there are complicated flow patterns and ecological environmental conditions in continuous curved flumes accompanied by fast-changing bed topographies. Bed topography exerts a significant counteractive effect on the flow. Moreover, turbulence fluctuation in curved flumes will be more intense if the bedform is covered with living flexible plants. However, no instrument can simultaneously measure 3D velocity in the whole flow field at high speed and efficiency. The evolution of meandering rivers is evident over different spatial and time scales. Short time scales are associated with hydrodynamics, intermediate time scales are associated with bed evolution, and long time scales are associated with bank retreat and, consequently, meander migration. This paper primarily explored the short-term bed evolution characteristics in continuous bends. More attention should be directed toward the hydrodynamic characteristics of river channels. The flow structure under fixed bed conditions is assumed to guide the research on the short-term evolution of the riverbed under movable bed conditions.
This study’s researchers designed a test with the same flow discharge and the water depth in the curved flume (as abovementioned experiments), using the fixed flatbed instead of a movable bed. The fixed bed test was conducted to analyze the flow characteristics and the near-bed stress distribution. The plane flow structure and near-bed stress distribution of different layers were determined by measuring the flow structure with more than 40 cross-sections in the whole bend. This experiment is noteworthy because the 3D flow velocity measurements at more than 12,000 points in 40 sections were never published previously in the literature. These data can guide bed evolution under movable beds or living flexible plants. The data will also benefit the short-term evolution of natural riverbeds within a specific range.
The experiments were conducted in a continuous curved laboratory flume. The flume comprised an organic glass bend, upstream and downstream water tanks, two straight transition sections, a circulation pump, and a connection pipeline. Fig. 1 depicts the 3D structure of the continuous curved flume. The central axis of each bend was expressed as
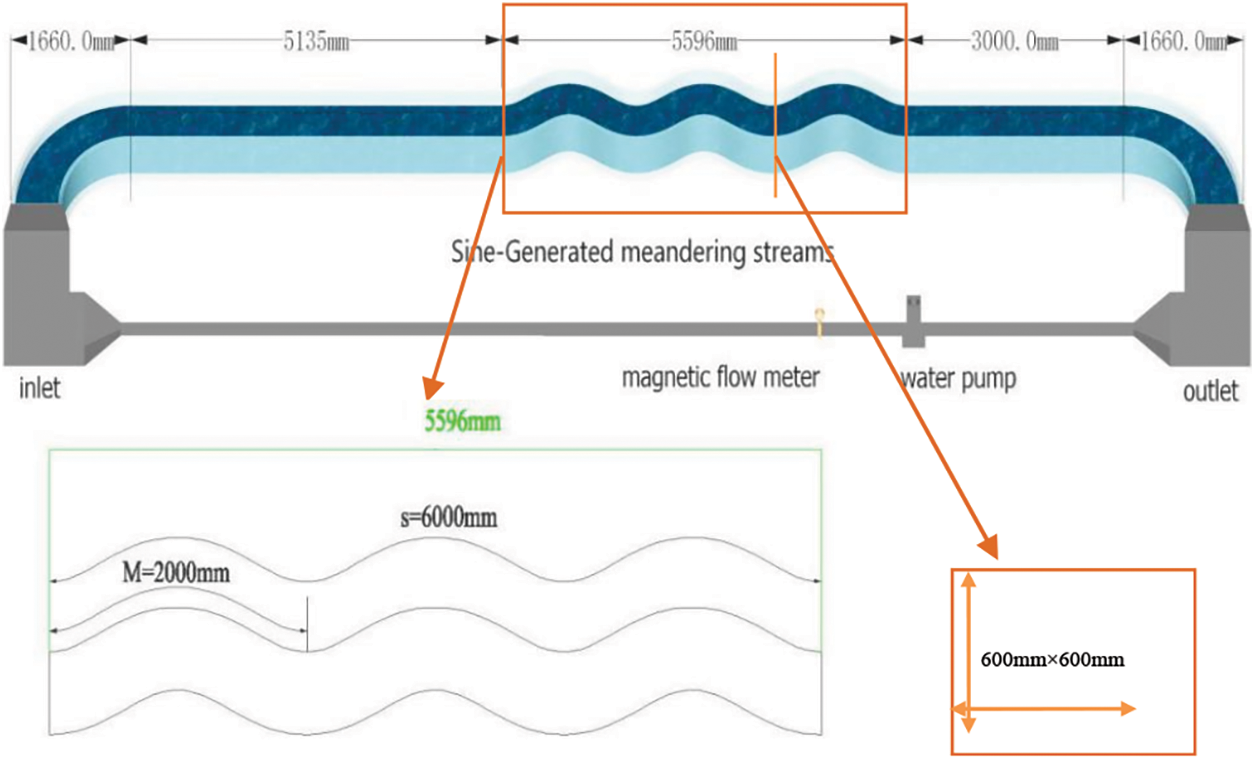
Figure 1: Three-dimensional diagram of the testing apparatus
A 3D Doppler advanced point current meter (ADV) with a relative error of measurement of 5% was used to measure the velocity in the above experiments. The ADV had a sampling frequency of 100 Hz, a sampling time of 120 s, and the measurement data of each point of about 12,000. The 3D Doppler ADV was fixed in a stainless-steel 3D positioning device, which was prepared in-house while measuring velocity. The ADV collected 3D velocity data across 40 sections of the model. Fig. 2 shows the schematic diagram of the measurement section. In Fig. 2, the content before “−” represents the phase position of measurement sections in a bend, whereas the content after “−” represents the number of sine derivative bends. The phase position was
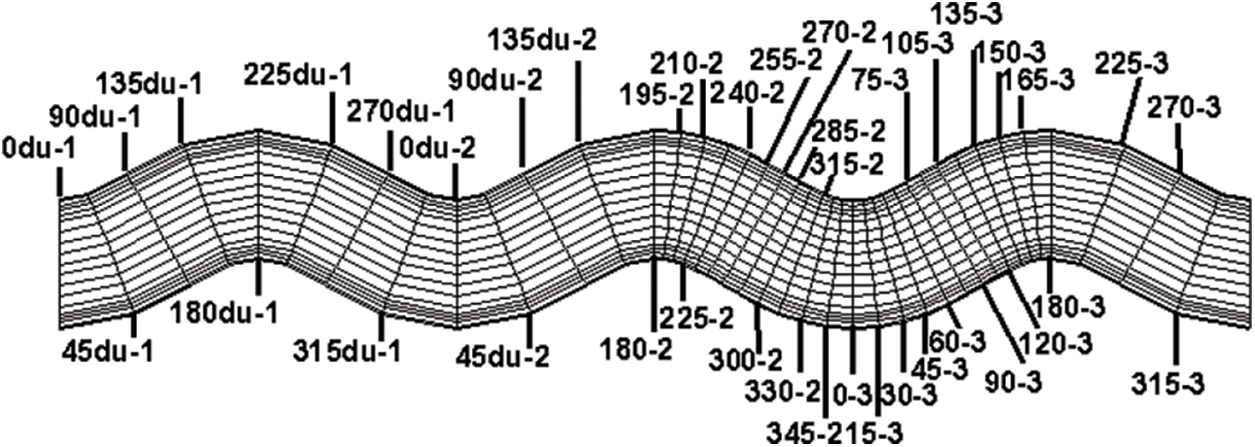
Figure 2: The schematic representation of the measuring section
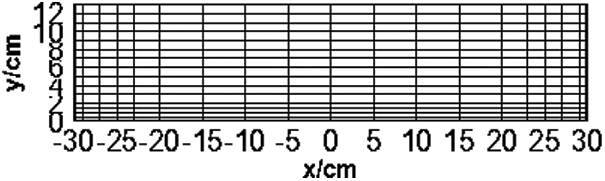
Figure 3: The sectional arrangement of monitoring points
The flow structure in bends frequently interacts with bed topography on bedforms covered with living flexible grasses. However, existing single-point and small profile velocity methods have low efficiencies. They do not accurately depict the flow field in the whole bend. Hence, five test conditions were designed in the whole experiment. Table 1 presents the geometric features and experimental parameters of the curved flume. The parameters are defined as follows: Q is the rate of flow under different test conditions and is recorded by an electromagnetic flowmeter, h is the water depth at the entrance of bends, b is the width of the curved flume, V is the average velocity of the cross-section at the inlet of a curved channel, D50 is the median size of bed materials, η is the thickness of the sediment pavement on the bed, and t is the scouring time of a river bed.
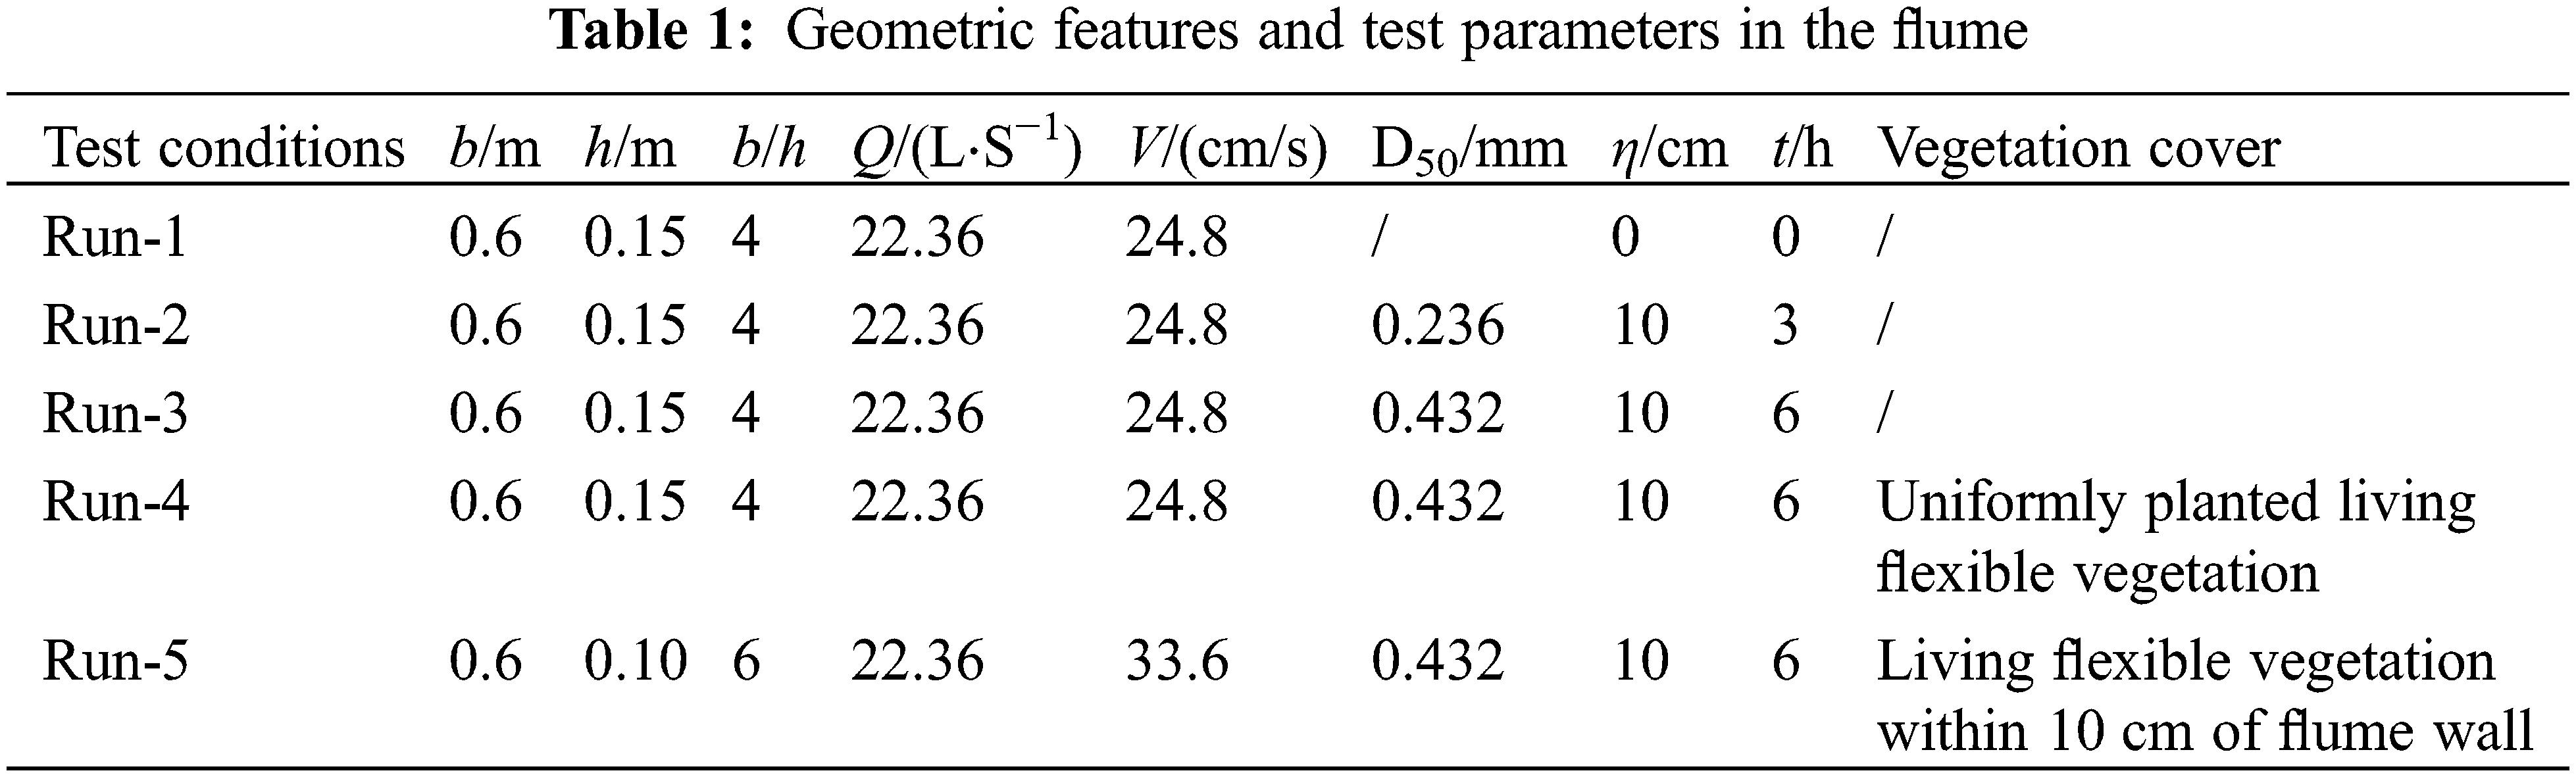
The test condition Run-1 had no sediment pavement on the bed and was used for clean water scouring testing of the continuous curved flume. Flow stability could be well protected by controlling the flow rate and water depth, thus enabling the measurement of a 3D flow field in the whole curved flume. The test condition Run-2 was a movable bed test with sediment pavement thickness of 10 cm and sediments with a median size of 0.236 mm. The test condition Run-3 was a movable bed test with sediment pavement thickness of 10 cm and sediments with a median size of 0.432 mm. The test conditions Run-4 and Run-5 included movable bed tests with living flexible grasses planted on the beds with different densities based on the settings of Run-3. The tests for Run-4 and Run-5 achieved the preliminary exploration of the effects of living flexible plants on bed topography. The planting duration of living flexible grass was 15 days, the plant height was about 10 cm, and the estimated plant densities for Run-4 and Run-5 were 6–10 plants/cm2 and 3–5 plants/cm2 (Fig. 4), respectively.
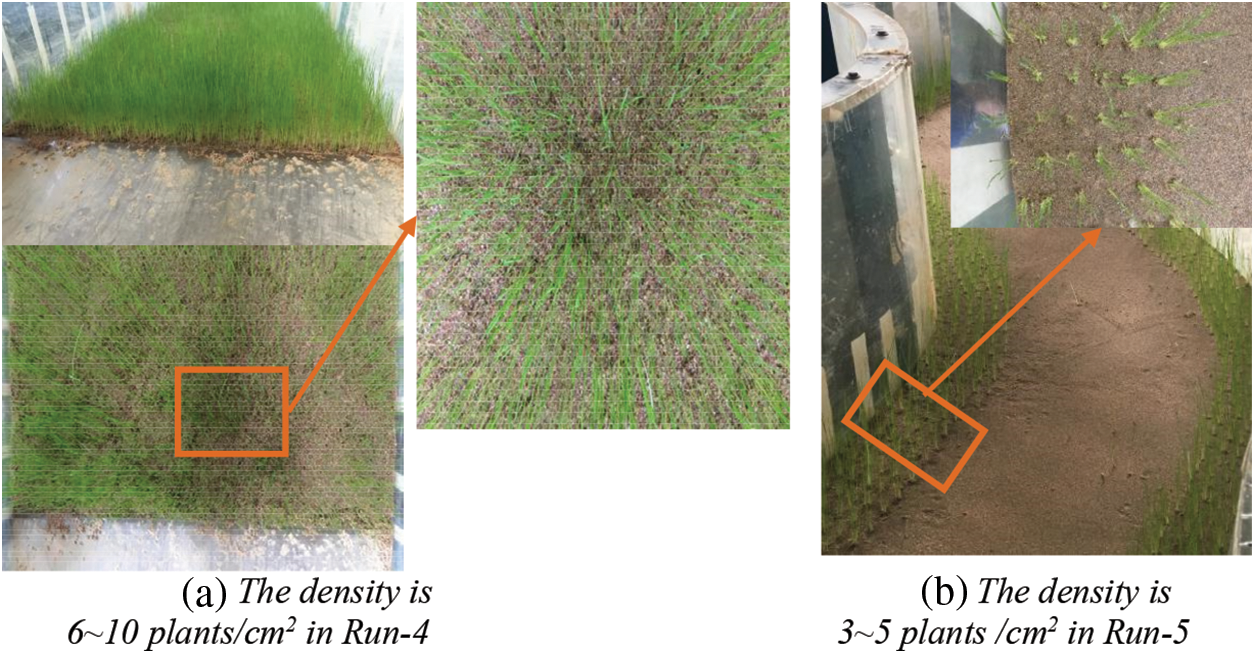
Figure 4: Plant densities
Water flow occurs in a curvilinear motion in a large continuous curved flume. In addition, the surface pattern and flow structure are adjusted and changed. Thus, typical flow characteristics arise in bends and are mainly manifested by the redistribution of longitudinal velocity, transverse secondary circulation, and turbulence.
The statistical theory of turbulence states that constant turbulence is a stationary stochastic process of each state traversal; hence, the statistical theory can analyze turbulence. The mean of the measured instantaneous longitudinal velocity (ui) was calculated as follows:
Similarly, the mean of the measured instantaneous transverse and vertical velocity (vi and wi) were determined as follows:
where N is the number of samples. For simplicity, the mean flow velocities along three directions are expressed as u, v, and w, respectively.
Fig. 5 presents the contours of the water surface curve in Run-1. The figure demonstrates the distortion of the water surface in bends. After entering the bends, the water surface line declined first and then increased based on the longitudinal profile. Transversely, the water levels at the convex and concave banks were low and high, respectively, showing significant transverse gradients. Moreover, transverse gradients of each bends were different. The maximum transverse gradient was observed on the top of each bend with partially declining downstream.
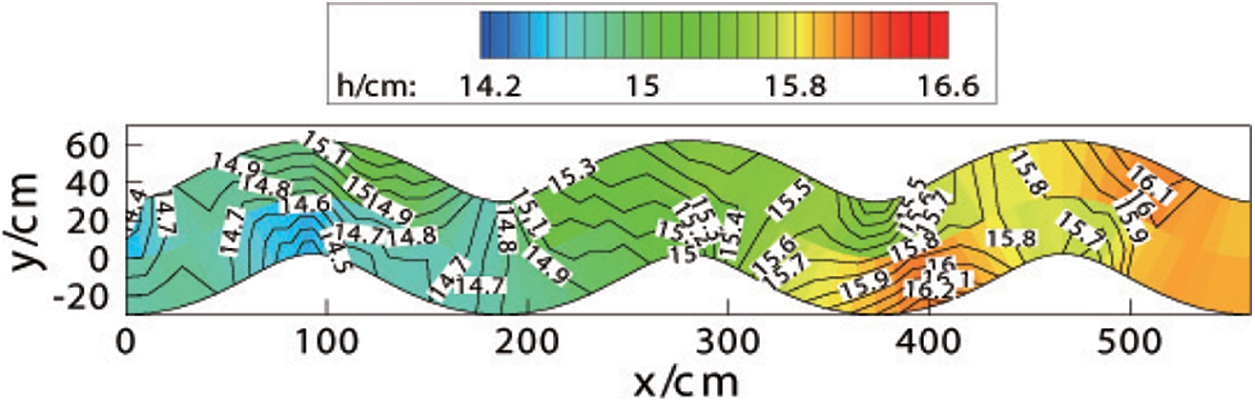
Figure 5: Contours of the water surface curve
3.2 Longitudinal Velocity and Flow Hydrodynamic Axis Distribution with Different Water Depth Planes
Figs. 6a–6d depict the cloud charts of the longitudinal velocity (ui) distribution at water surfaces with different water depths in the bend for Run-1. The results demonstrate that
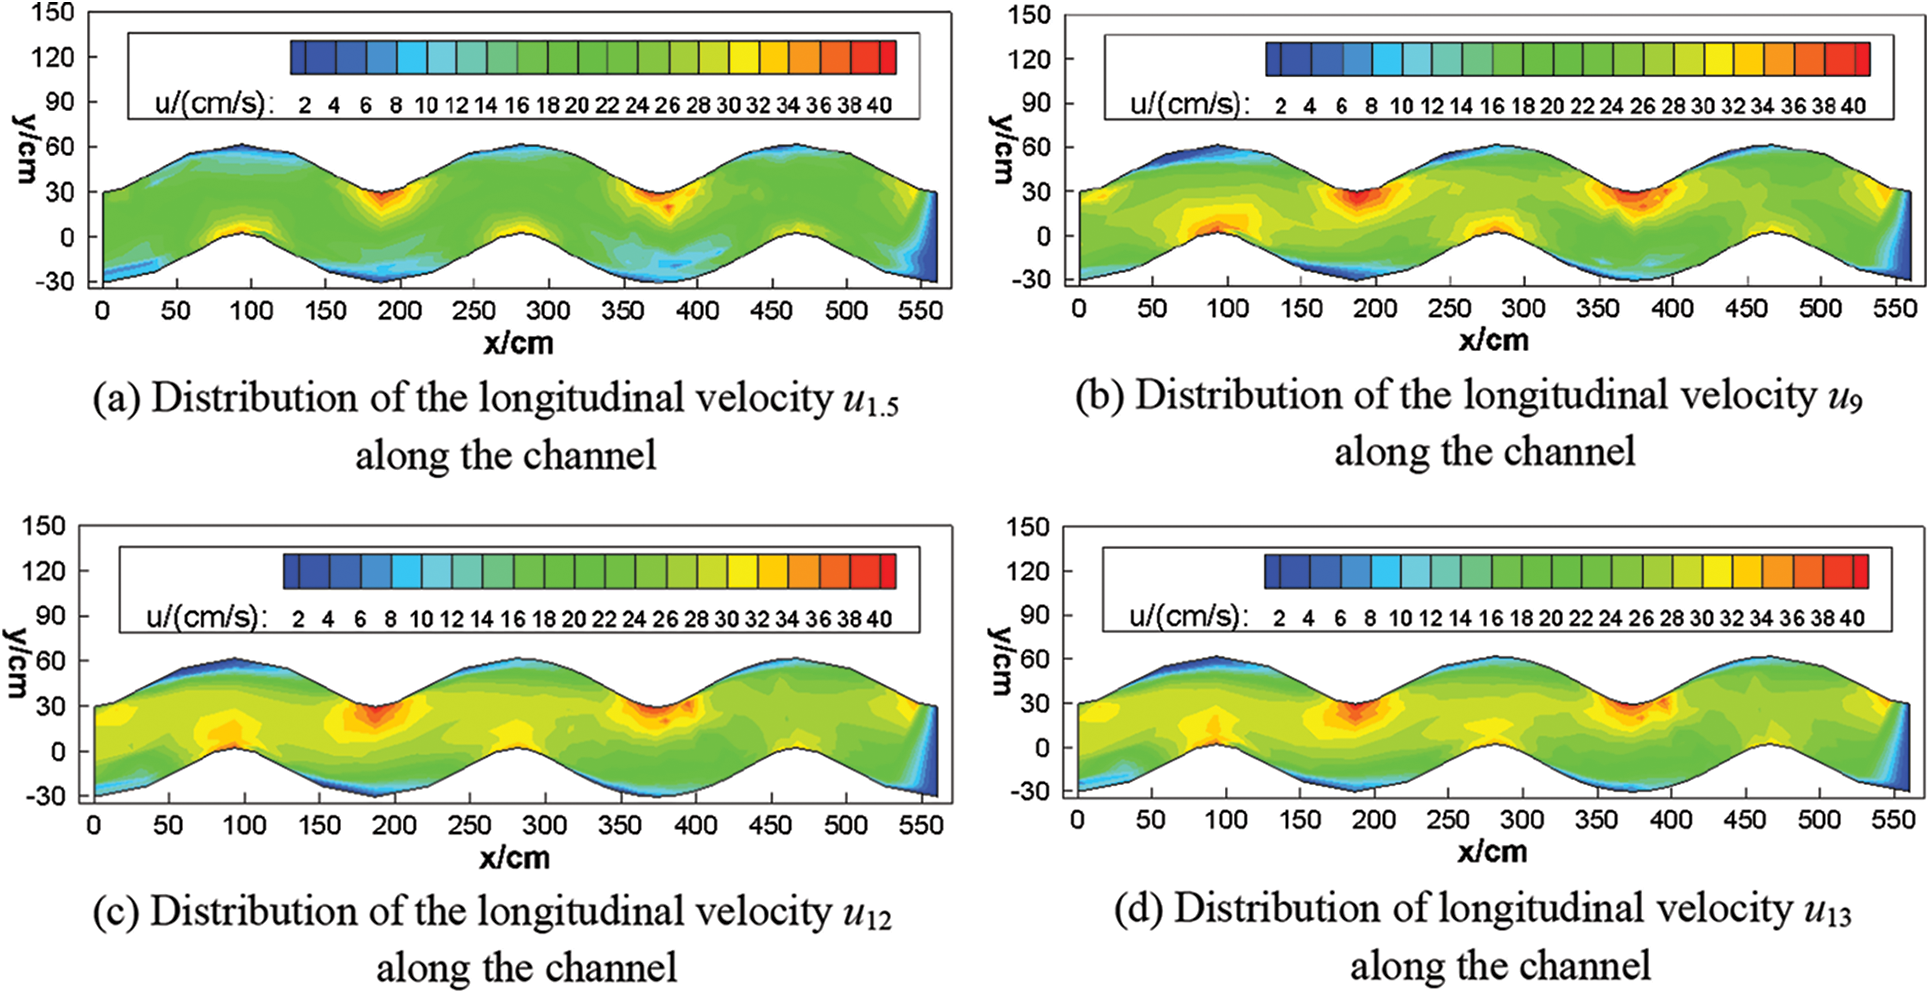
Figure 6: Longitudinal velocity distribution with different water depth planes
Fig. 7 depicts maximum velocity distributions for Run-1 along different water depths. The maximum velocity values in Figs. 6a–6d were combined to create Fig. 7. The figures show that the hydrodynamic flow axis was kept close to the convex bank. In addition, a very short transition region for the swing conversion of the flow hydrodynamic axis was present near the section with zero curvature. The maximum velocities at three water depths showed delays with an increased distance to the bedform. Such velocity delay was evident in the first bend, which can be explained in two ways. Bed resistance against the longitudinal flow velocity declines with an increase in the water depth. In contrast, a straight channel is present upstream of the first bend and a bending channel is present downstream, exerting different effects on different velocities. Therefore, the velocity delay in the first bend was more evident than that in the second bend.
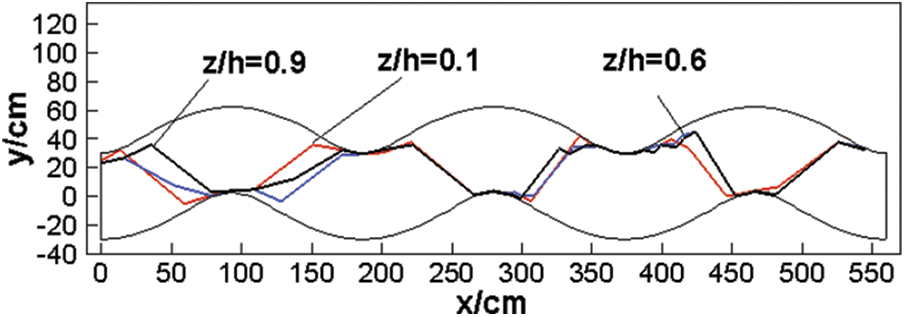
Figure 7: Maximum velocity paths at various water depths along continuous curved bends
3.3 Distribution of Longitudinal Velocity and Streamline Patterns
Longitudinal velocity and streamline distributions in the second and third bends were analyzed in Run-1. Figs. 8a–8b present those results. This figure illustrated the cloud charts of different measurement sections and revealed that the flow hydrodynamic axis of longitudinal velocity (u) near the section with zero curvature (90° and 270° bends) swung from the left convex bank to the right convex bank of the bend (Fig. 7). Furthermore, the maximum velocities on all sections were observed below the free water surface. In continuous curved bends, the streamline is inclined from the convex bank of the top of one bend to the convex bank of the top of the next bend. The longitudinal velocity at the convex bank was higher than that at the concave bank near the top of the negative bend (sections of 135°, 180°, and 225°) of the continuous curved bends. In addition, the same trend was observed for the velocities on the two banks near the upstream and downstream regions at the top of the positive bends, respectively. Finally, the transition zones were characterized by intermediate phase bends near the sections of 90° and 270°.
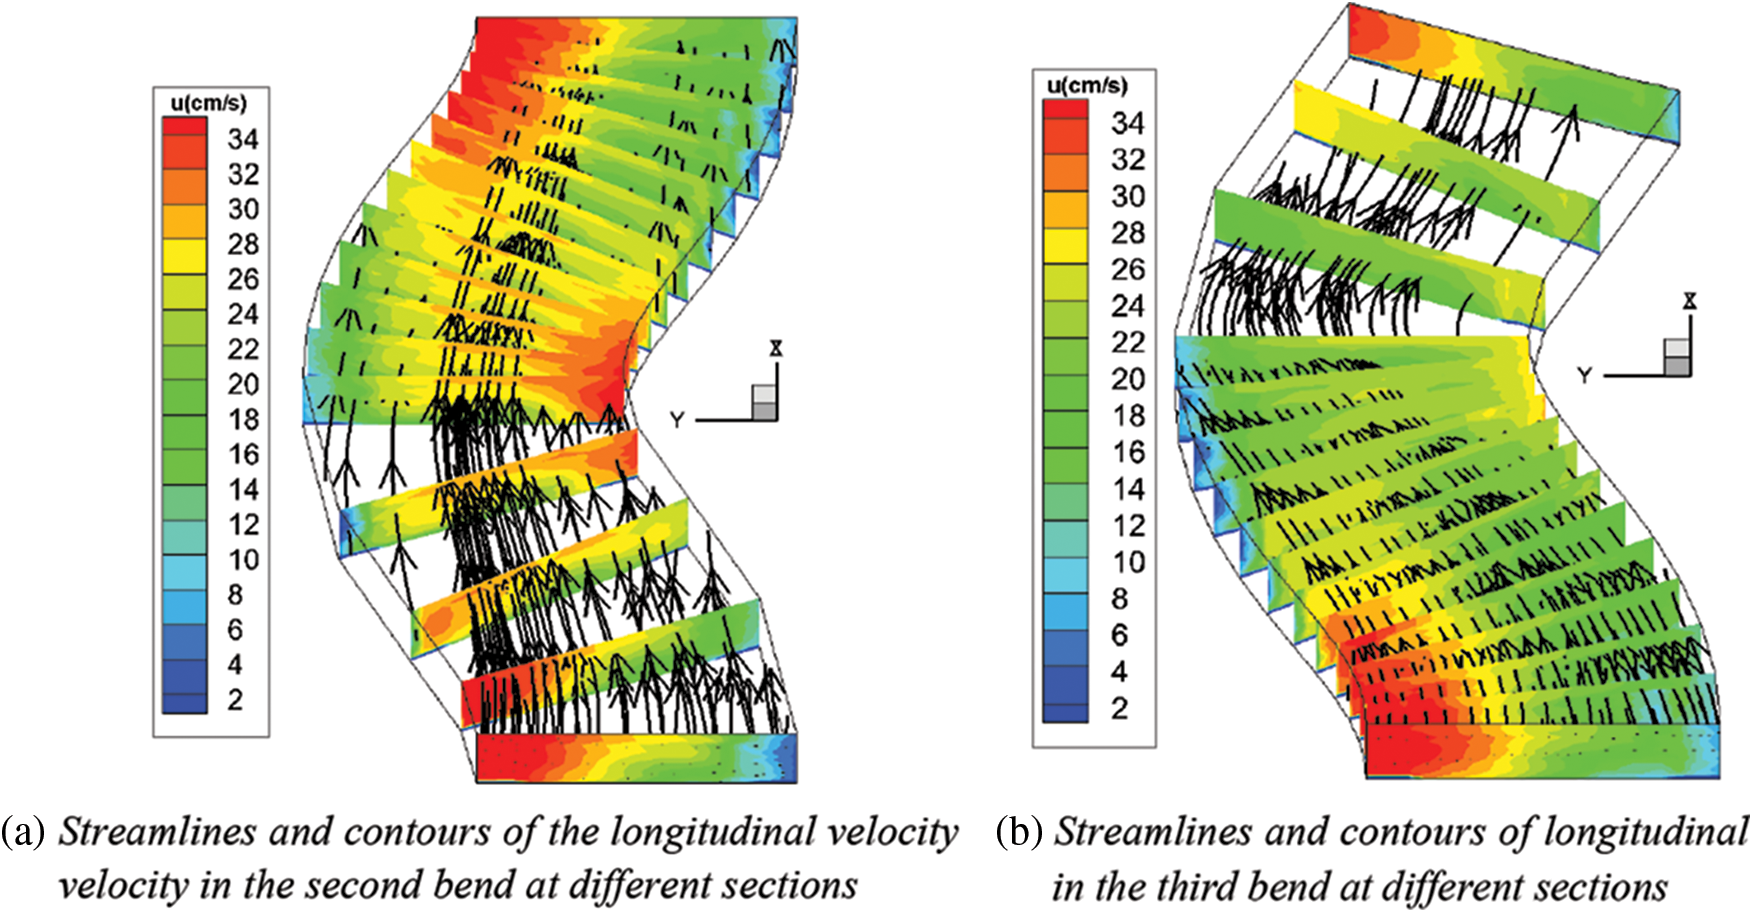
Figure 8: Streamlines and contours of longitudinal velocity in different sections
Figs. 9a–9b show the cloud charts of the flow field (v, w) and lateral velocity (v) on representative sections in the second and third bends in Run-1. Generally, most sections had one primary circulation and small reverse circulation. However, some sections had three circulation structures: one near-bed primary circulation, one small reverse circulation, and one small synclastic circulation. In the vertical direction, the longitudinal velocity (v) sign changed at the position where circulation occurred. Also, sections near the phase positions of 180° and 0° had unstable flow directions. These effects indicate the instability of flows near the top of bends, which is attributed to the higher longitudinal velocity. However, these regions have low transverse and vertical velocities and low secondary flow intensity (Fig. 10).
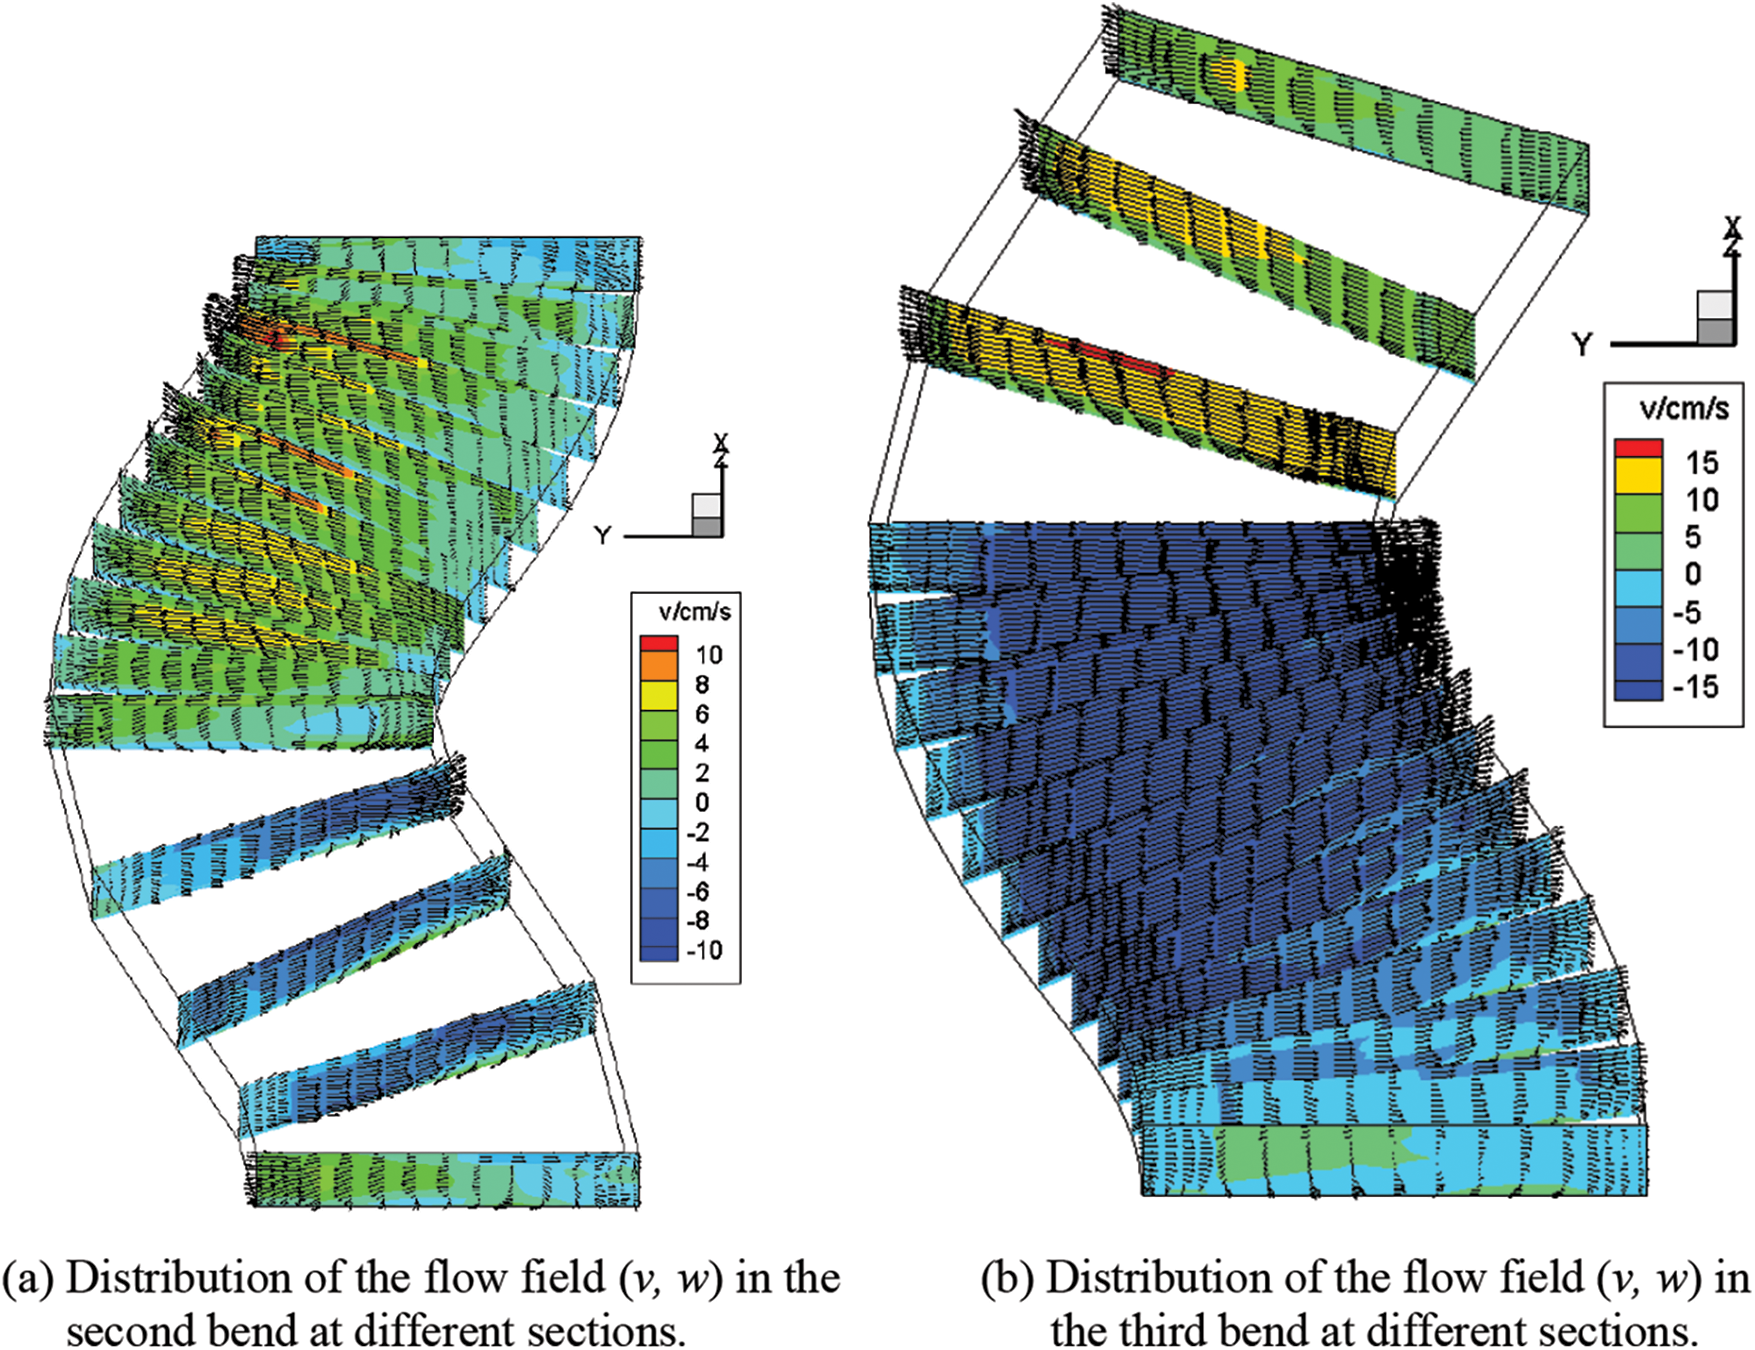
Figure 9: Distribution of the flow field (v, w)
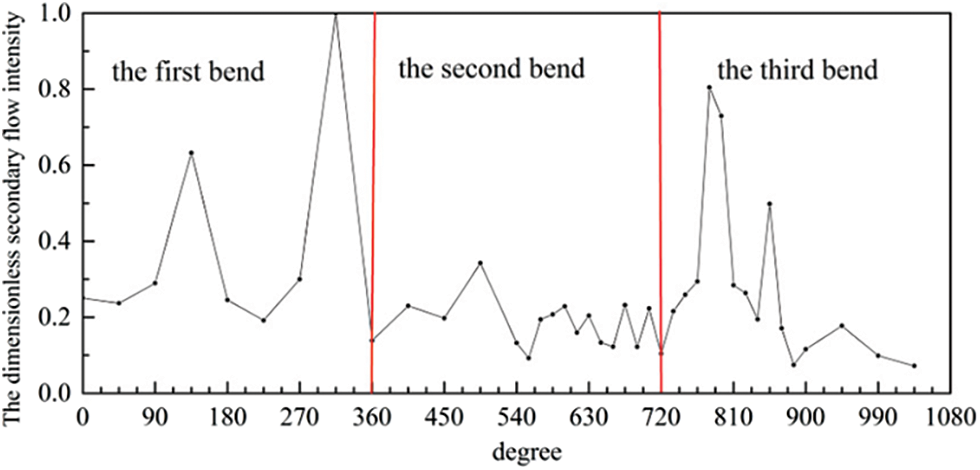
Figure 10: Dimensionless secondary flow strength along the continuous curved bend
The Shukry [22] discriminant standard described the secondary flow mechanism. The secondary flow intensity is defined as
4 Short-Term Evolution of Bedform
Fig. 11 shows the bedform in the continuous curved bends after 3 h of continuous scouring in Run-2. The swinging bank walls of the bends affect the current distribution in bends, which is notably different from straight channels. This distribution was characterized by an uneven section distribution and significantly higher velocity on convex banks than on concave banks (Fig. 11). Sand ripples start from the convex bank and affect the near-bed flow conditions. Because of the strong interactions with the current, sand ripples begin to extend upstream and downstream simultaneously. Fig. 11 shows that the sphere of influence of sand ripples on the left bank was significantly larger than that on the right bank in the straight entrance channel. This impact was closely related to the boundary conditions and velocity distribution at the entrance of the downstream bend. Fig. 11b intuitively depicts a flatbed zone near the sidewall of the left bank in the first bend that mostly avoided suffering scouring damages. This is consistent with the results from the low-velocity zone on the concave bank in the cloud chart of the planar and sectional velocity distribution in Figs. 6a and 11 for Run-1. Fig. 11c shows that a small sedimentation peak was observed near the section of 270° at partial downstream positions of the top of the bend. A flat-concave bank was observed near the shore wall downstream of this small sedimentation peak. Fig. 11d shows alternate distributions of shoals and deep flumes. The deep flumes were present upstream at the top of the bend, whereas shoals were located downstream. The maximum scouring depths and deposition heights were deep flumes and shoals. Fig. 11e shows the bedform in the third bend, which had a small-sized flat zone near the concave bank.
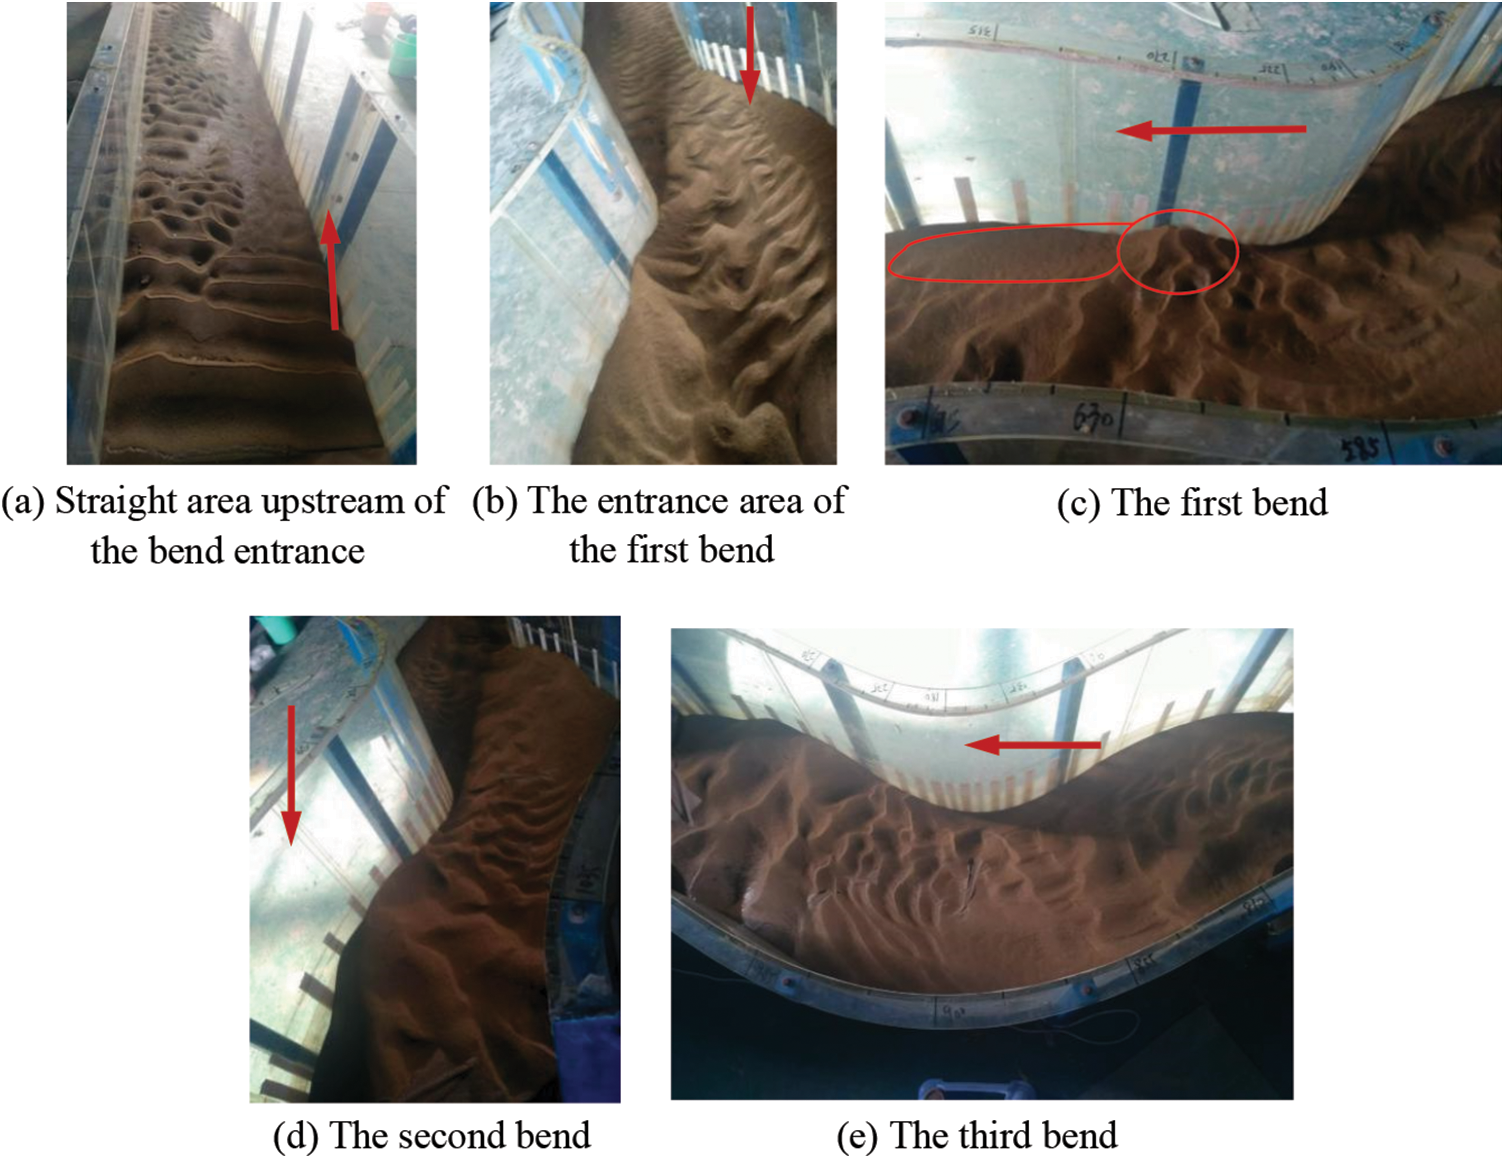
Figure 11: Images of the bedform for Run-2 (scouring for 3 h using circulating water)
Figs. 12–14 show the bedform distributions after 6 h of continuous scouring under the test conditions of Run-3, Run-4, and Run-5, respectively. Furthermore, the scouring times for Run-3, Run-4, and Run-5 were the same. Moreover, patterns of silting and scouring depth in bends were highly regular and manifested by alternate distributions between shallow and deep grooves. The maximum silting and scouring depth for Run-3 were more profound than those for Run-4 and Run-5. Living flexible grass increases the resistance of the bed surface. In contrast, the root system of flexible grass that grows into the bed restricts the movement of sediment particles. As a result, the wash resistance of bed sedimentation increases, and a higher initial velocity is required for the bed-load movement. The concave bank had a flat zone for Run-3, Run-4, and Run-5. This bank conformed well to the low-velocity regions in Figs. 6a and 13 for Run-1. This result indicates that studying the flow structure under Run-1 conditions can provide good guidance to predict changes in bedforms under the more complex conditions of movable beds and living flexible vegetation.
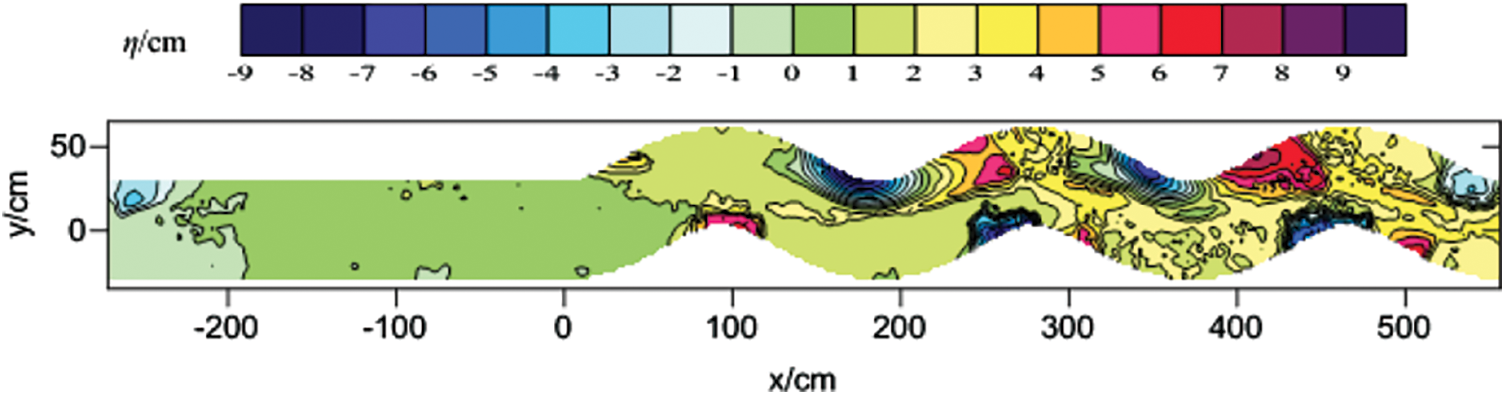
Figure 12: Contour map of the bedform in Run-3 (scouring for 6 h using circulating water)
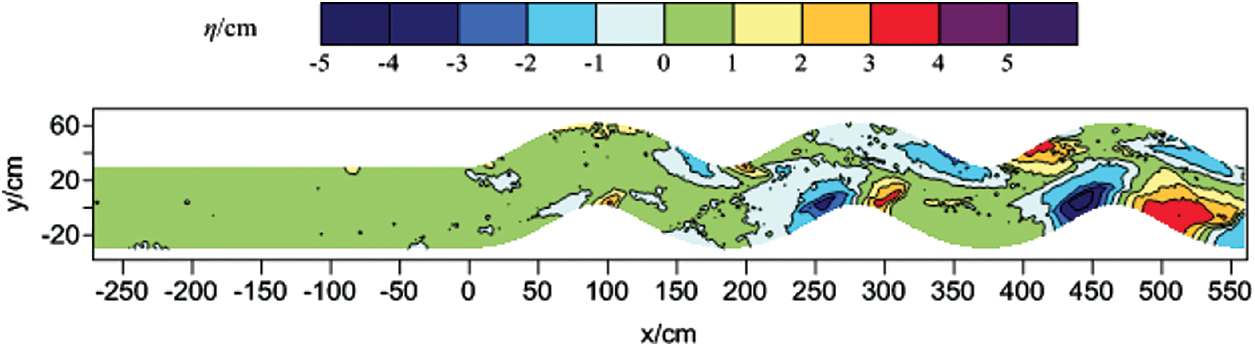
Figure 13: Contour map of the bedform in Run-4 (scouring for 6 h using circulating water)
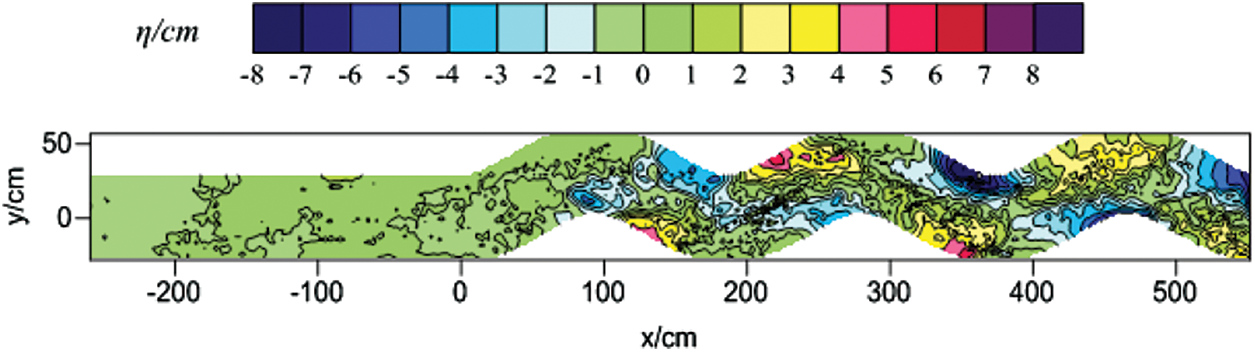
Figure 14: Contour map of the bedform in Run-5 (scouring for 6 h using circulating water)
Fig. 15 shows the thalwegs of the river channel in Run-3, Run-4, and Run-5. As evident from Fig. 15, the thalweg of the river channel in Run-3 showed the most violent sway and was closest to both banks of the curved channel. In contrast, the thalweg in Run-4 had the least sway and was closest to the channel’s centerline. The presence of living flexible plants in channel bends resulted in subsequent changes in the roughness of the bed surface, the flow of the curved channel, and the morphology of the bed surface. By analyzing the bed scouring tests in Run-3, Run-4, and Run-5, the channel section’s flow rate was found to have the most excellent effect on the thalweg of the river channel, compared with the median grain size of bed sand, width depth ratio, or scouring time.
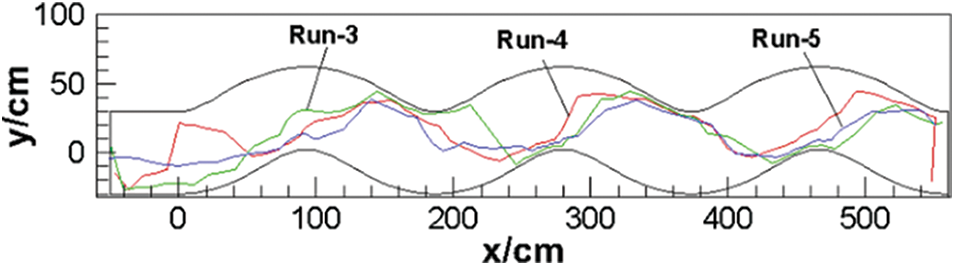
Figure 15: A comparison diagram of the thalweg of the river channel in Run-3, Run-4, and Run-5
Fig. 16 presents the bed elevation distribution on different sections of the left and right banks in Run-3, Run-4, and Run-5. In all bends, bed scouring occurred upstream of convex banks and sediment deposits downstream of the bed surface. The sand wavelength at the left bank was significantly higher than that on the right bank. The left bank elevation was higher than the right bank elevation at the section of 90° for all bends. However, the opposite phenomenon was observed at the section of 270°, which is consistent with Fig. 11. Furthermore, the primary circulation of the secondary circulation structure in the center of the section of 90° was negative and the water flowed to the right bank, whereas the circulation was positive in the center of the section of 270° and the water flowed to the left bank. These results further demonstrate that the secondary circulation induced by bends is the main driving force of the bed topography and indicate that planting living flexible vegetation on the bed surface only increases the bed resistance.
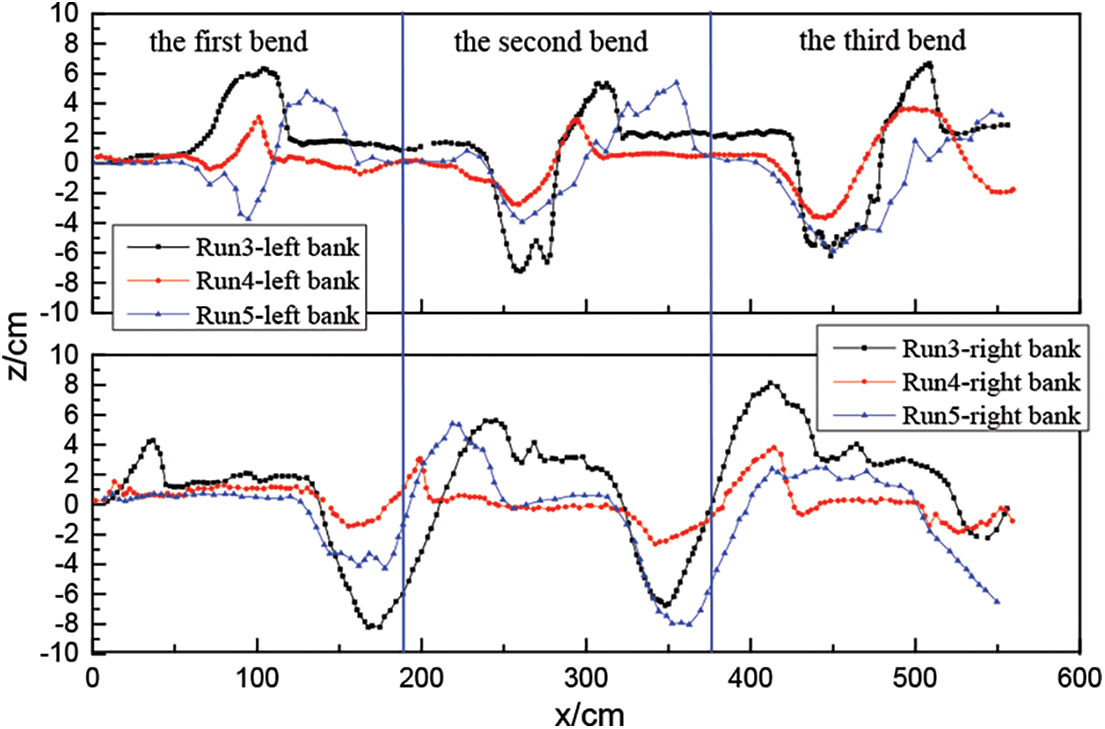
Figure 16: Bed elevation of the left and right banks of the flume in Run-3, Run-4, and Run-5
This study used flow structure and bedform tests to analyze and investigate the flow structure and evolution of bed topography in a continuous curved flume under the coverage of living flexible vegetation. The conclusions are presented as follows.
In Run-1, the longitudinal velocity first increased and then decreased vertically. There was a primary circulation and nearshore and near-surface small reverse circulation on each measuring section of different bends. Some sections even showed three or more circulation structures. Furthermore, the vertical direction of the positional lateral velocity for circulation occurrence was changed. The minimum secondary flow intensities in different bends were near the tops of the bends.
There were regions with low longitudinal velocity along concave banks in bends with movable beds. In addition, flatbeds were also present regardless of living flexible plant covers. Furthermore, the maximum scouring depths and silting heights for Run-4 and Run-5 were smaller than those for Run-3, indicating that the secondary circulation caused by bending boundaries was the main driving force behind bed topography.
Under the same test conditions, the near-bed flow structure in strongly curved channels with fixed bed morphology can provide good research guidance for the short-term evolution of movable bed morphology. The secondary circulation induced by the channel’s curvature is the main driving force of changes in the bed topography. In contrast, short-term bed evolution is most affected by the flow of the channel bend.
In conclusion, various characteristics, such as riverbed resistance, bed sand size distribution, and scouring time, significantly affect short-term bed evolution. However, further research is needed to determine the relative weight (importance) of each factor on short-term bed evolution.
Funding Statement: This work was supported in part by the Special Fund for Basic Scientific Research Business Expenses of Central Public Welfare Scientific Research Institutes under Grant TKS20210103, and the Open Fund of Key Laboratory of Ocean Observation Technology, Ministry of Natural Resources of China (2021klootA06).
Conflicts of Interest: The authors declare that they have no conflicts of interest to report regarding the present study.
References
1. Vriend de, H. J., Geldof, H. J. (1983). Main flow velocity in short river bends. Journal of Hydraulic Engineering, 109(7), 991–1011. DOI 10.1061/(ASCE)0733-9429(1983)109:7(991). [Google Scholar] [CrossRef]
2. Priego-Hernández, G. A., Rivera-Trejo, F. (2016). Secondary currents: Measurement and analysis. Atmosfera, 29(1), 23–34. [Google Scholar]
3. Hooke, R. L. (1975). Distribution of sediment transport and shear stress in a meander bend. The Journal of Geology, 83(5), 543–565. DOI 10.1086/628140. [Google Scholar] [CrossRef]
4. Termini, D., Piraino, M. (2008). Acoustic Doppler velocity profiler for velocity and turbulence measurements in a large amplitude meandering flume. 6th International Symposium on Ultrasonic Doppler Methods for Fluid Mechanics and Fluid Engineering. https://www.isud-conference.org/proc/split/ISUD-06_163_Termini.pdf. [Google Scholar]
5. Termini, D. (2009). Experimental observations of flow and bed processes in large-amplitude meandering flume. Journal of Hydraulic Engineering, 135(7), 575–587. DOI 10.1061/(ASCE)HY.1943-7900.0000046. [Google Scholar] [CrossRef]
6. Termini, D., Piraino, M. (2011). Experimental analysis of cross-sectional flow motion in a large amplitude meandering bend. Earth Surface Processes & Landforms, 36(2), 244–256. DOI 10.1002/esp.2095. [Google Scholar] [CrossRef]
7. Abad, J. D., Garcia, M. H.(2009). Experiments in a high-amplitude kinoshita meandering channel: 2. Implications of bend orientation on bed morphodynamics. Water Resources Research, 45(2), 142–143. DOI 10.1029/2008WR007017. [Google Scholar] [CrossRef]
8. Wang, B. (2008). Experiments of water flow and bed deformation in a flume with consecutive curves (Ph.D. Thesis). Tsinghua University, China. [Google Scholar]
9. Xu, D., Bai, Y. C., Tan, Y. (2010). Experiment on characteristics of flow and sediment movement in sine-generated meandering channels with movable bed. Journal of Tianjin University, 43(9), 762–770. [Google Scholar]
10. Xu, D., Bai, Y. C. (2013). Experimental study on the bed topography evolution in alluvial meandering rivers with various sinuousnesses. Journal of Hydro-Environment Research, 7(2), 92–102. DOI 10.1016/j.jher.2012.06.003. [Google Scholar] [CrossRef]
11. Wang, H., Wang, L. J., Shao, X. J., He, J. B., Wang, X. (2013). Turbulence characteristic in consecutive bends. Chinese Journal of Theoretical and Applied Mechanics, 45(4), 525–533. [Google Scholar]
12. Morri, M., Soualmia, A. (2019). Modeling the impact of riparian vegetation on flow structure and bed sediment distribution in rivers. Archives of Hydro-Engineering and Environmental Mechanics, 66(3–4), 59–75. DOI 10.1515/heem-2019-0005. [Google Scholar] [CrossRef]
13. Mahsa, J., Hossein, A., Paweł, M. R. (2019). Flow structure within a vegetation patch in a gravel-bed river. Journal of Hydrology and Hydromechanics, 67(2), 154–162. DOI 10.2478/johh-2019-0001. [Google Scholar] [CrossRef]
14. Amirhossein, A., Alireza, K., Hossein, H., Mahmoud, J. (2020). Effect of rigid vegetation on velocity distribution and bed topography in a meandering river with a loping bank. Arabian Journal for Science and Engineering, 45, 8633–8653. DOI 10.1007/s13369-020-04818-7. [Google Scholar] [CrossRef]
15. Qu, G., Zhang, X. F., Chen, D. (2015). Experimental study on flow resistance characteristics of open channel with flexible plants. Journal of Hydraulic Engineering, 46(11), 1344–1351. [Google Scholar]
16. Qu, G., Chen, D., Zhao, Z. C. (2019). Experimental study on the characteristics of flow movement in open channel with vegetation. Chinese Journal of Hydrodynamics, 34(4), 539–547. [Google Scholar]
17. Termini, D. (2016). Experimental analysis of the effect of vegetation on flow and bed shear stress distribution in high-curvature bends. Geomorphology, 274, 1–10. DOI 10.1016/j.geomorph.2016.08.031. [Google Scholar] [CrossRef]
18. Termini, D. (2017). Vegetation effects on cross-sectional flow in a large amplitude meandering bend. Journal of Hydraulic Research, 55(3), 423–429. DOI 10.1080/00221686.2016.1274918. [Google Scholar] [CrossRef]
19. Serio, F. D., Meftah, M. B., Mossa, M., Termini, D. (2018). Experimental investigation on dispersion mechanisms in rigid and flexible vegetated beds. Advances in Water Resources, 120, 98–113. DOI 10.1016/j.advwatres.2017.08.005. [Google Scholar] [CrossRef]
20. Tu, Y. (2017). Experimental study of effects of emergent rigid vegetation on flow and sediment movement in the curved flume (Ph.D. Thesis). China Institute of Water Resources and Hydropower Research, China. [Google Scholar]
21. Termini, D. (2019). Turbulent mixing and dispersion mechanisms over flexible and dense vegetation. Acta Geophysica, 67(7), 961–970. DOI 10.1007/s11600-019-00272-8. [Google Scholar] [CrossRef]
22. Shukry, A. (1950). Flow around bends in an open flume. Transactions of the American Society of Civil Engineers, 115(11), 751–779. DOI 10.1061/TACEAT.0006426. [Google Scholar] [CrossRef]
Cite This Article
 Copyright © 2023 The Author(s). Published by Tech Science Press.
This work is licensed under a Creative Commons Attribution 4.0 International License , which permits unrestricted use, distribution, and reproduction in any medium, provided the original work is properly cited.
 Downloads
 Citation Tools