
 Submit a Paper
 Propose a Special lssue
 Open Access
ARTICLE

Numerical Simulation of Droplets Interacting with a Microcolumnar Solid Structure
College of Mechanical Engineering, Dalian Jiaotong University, Dalian, 116028, China
* Corresponding Author: Liang Yang. Email:
Fluid Dynamics & Materials Processing 2023, 19(6), 1585-1608. https://doi.org/10.32604/fdmp.2023.024987
Received 06 June 2022; Accepted 11 October 2022; Issue published 30 January 2023
 View Full Text
 Download PDF
Abstract
The VOF method is used to simulate the dynamics of a droplet interacting with a structure consisting of an array of microcolumns mounted on a flat surface. Such a specific configuration is intended to mimic the typical properties of lotus leaves, which typically display regularly arranged micron-scale papillary structures. After setting the initial velocity of the simulated droplet on the basis of practical considerations, an analysis is conducted about the effect of the characteristic size of the microstructure on the apparent contact angle. The pressure variation in the microstructure caves is also examined. The simulation results show that the change of the contact angle of the droplet in the quasi-static state is consistent with theoretical calculations and the contact angle in the dynamic state is smaller than that in the quasi-static state. Moreover, under dynamic conditions, the pressure fluctuation in the microstructure cave depends essentially on the characteristic size of the microstructure.Keywords
Wettability [1] is an important property of a solid material’s surface. The ability to control the dynamic behavior of droplets on solid surfaces can greatly facilitate the ease of people’s lives. For example, solid surfaces with superhydrophobic characteristics can achieve self-cleaning, drag reduction, anti-corrosion, anti-icing, and other properties. The wettability of solid materials mainly depends on their chemical composition and surface microstructure. Therefore, the preparation of materials with special wettability is generally achieved by changing the chemical energy of the material’s surface or constructing different microstructure shapes on the surface [2]. To describe the wettability, the apparent contact angle is usually used to characterize it. Generally, a solid surface with an apparent contact angle greater than 90° is defined as a hydrophobic surface, and a solid surface with an apparent contact angle greater than 150° is super-hydrophobic [3].
The research on wettability mainly focuses on the oscillation characteristics of droplets on the material surface [4], the change of diffusion coefficient [5], and the dynamic contact angle [6]. There are three main research methods: theoretical research, experimental research, and simulation research. The dynamic process of a droplet is so complicated that it is always very difficult to study accurately with theoretical methods, and the possible change of droplets can only be analyzed using an idealized process, which is quite different from the actual dynamic process. In the process of experimental research, there are too many uncertain and difficult-to-control factors, and the experimental cost is also high. Now, more and more researchers are beginning to use simulation research methods to study dynamic behavior. The biggest advantage of using numerical simulation is that it is convenient to monitor the changes that are not easy to be monitored in the experimental process, such as changes in cavitation pressure, droplet internal velocity, pressure changes, and so on.
In the existing literature, there are relatively few studies on the parameters that influence the dynamic process (such as microstructure parameters), especially under dynamic conditions, the influence of microstructure parameters on the stabilization process, and the steady-state contact angle of droplets. In practice, the droplet has a certain falling speed, and the stable apparent contact angle is the best reflection of microstructure wettability. In this paper, the effect of hydrophobic microstructure on droplet dynamic behavior is studied by simulation and the underlying mechanism is explored.
In the aspect of simulating dynamic behavior, scholars have carried out some research by using different simulation methods. A computational fluid dynamics (CFD) model built by Gunjal et al. [7], based on the volume of fluid (VOF) approach, was used to simulate drop dynamics on flat surfaces. The simulation showed that the VOF-based calculation model could capture the key characteristics of the interaction between droplets and a solid surface. The numerical simulations capture the liquid–air interface movement by considering the VOF method [8]. Compared with a hydrophobic substrate, the super-hydrophobic substrate will lead to shorter retraction time and longer droplet rebound time. Quan et al. [9] used the same method to model the dynamics of droplets colliding with super-hydrophobic surfaces with different shapes of micropillars. The correctness of the model is verified by the experimental data and analysis model (AM). The effect of geometric shapes (square column, spherical column, and cruciform cylinder) on the rebound behavior of the impacting droplet was studied. It was found that the surface of the cruciform pillar has the best rebound ability. Li [10] used the VOF model to study the variation of droplet spreading law on dry and wet surfaces with geometric ridge arrays. Zhang [11] used the coupled level-set and volume of fluid (CLSVOF) model to simulate the dynamic behavior of droplets on different wettability spheres. It was found that the spreading rate and maximum spreading coefficient of the droplet decreases and the height of the droplet central bulge increases, and the amplitude of oscillation increases when the wettability of the sphere changes from hydrophilic to hydrophobic to super-hydrophobic. Cai et al. [12] used the VOF method to study the dynamic behavior of water droplets impacting surfaces with different structures at low and high Weber numbers. The simulation results show that high and stable pressure in cave is very important for forming super-hydrophobicity. Russo et al. [13] compared numerical and experimental results to investigate the application potential of a VOF method utilized in OpenFOAM. The approach implements the Kistler model for the dynamic contact angle of impacting droplets.
The Lattice Boltzmann Method (LBM) is a computational fluid dynamics method based on the mesoscopic simulation scale. Compared with other traditional CFD calculation methods, this method has the characteristics of a mesoscopic model between the microscopic molecular dynamics model and the macroscopic continuous model. Xu [14] used the LBM to establish two-dimensional and three-dimensional models of a droplet impacting solid surfaces. By adding a convex structure to the solid plane, it was found that the convex structure can reduce the rebound time of the droplet after contact with the surface. Raman [15] used an LBM framework to simulate the interaction dynamics of two droplets simultaneously hitting a dry surface in three dimensions. Fang et al. [16] used the LBM to simulate the droplet spreading and evaporation process on a high-temperature solid surface, focusing on the influence of droplet gravity, the wettability of the solid surface, and the ambient temperature on the evolution of droplet evaporation form. Nursultan Zhumatay’s work presents the numerical modeling of a sliding droplet on a vertical smooth wall under hydrophobic and hydrophilic conditions using the multiphase Shan–Chen Lattice Boltzmann Model (SC-LBM) [17].
Molecular dynamics is an important computer simulation method for solving many-body problems at the atomic and molecular levels. Qiang [18] studied the wetting behavior of nano-sized water droplets on smooth and rough surfaces using molecular dynamics (MD) simulations. It was found that a change of temperature can affect the contact angle of a droplet on smooth surfaces with different wettability. Molecular dynamics simulation was performed to simulate the wetting behavior of nano water droplets on flat and pillar surfaces. The contact angle of the water droplet on the flat surface becomes smaller with an increase of the surface characteristic energy parameter [19]. The wetting of nanodroplets on solid surfaces was studied by MD simulations. By studying the contact angles of different-sized nano-droplets, a relatively stable and accurate contact angle was obtained for droplets with radius greater than 43 Å [20]. There are other scholars, such as Yin et al. [21], Jiang et al. [22], Guo et al. [23], who have used the MD method, to respectively study the wettability of nanofluids during rapid boiling, wetting behavior of molten iron on the graphite substrate, the influence of ultrasonic vibration on the wetting of Pb droplet on Al (100) surface and so on.
It can be seen from the above analysis that, among several simulation methods currently used, the VOF method is the first to be applied to the simulation of the surface dynamic process, and its theoretical basis is relatively perfect. From the scale of the problem studied, the VOF method is aimed at the macroscopic continuum, the LBM is at the mesoscopic scale, and the MD is mainly studied at the microscopic level of the molecule. Although some scholars use a combination of several methods [24], it is not difficult to conclude that VOF is more suitable for this paper when dealing with contact angle and cavitation pressure. At the same time, most studies on droplet dynamic behavior using numerical simulation focus on the dynamic evolution of a droplet on the flat surface, and few people have used numerical simulation to focus on the dynamic behavior of droplets on microstructure surfaces and the change of air pressure trapped by droplet in the structural gap. In this paper, based on biological structures in nature, a surface microstructure is proposed, the theoretical formula for hydrophilic contact angle of microstructure surface is given, and the dynamic behavior of droplets on the surface of the structure is analyzed by the VOF method.
Over a long period of evolution, many biological surfaces with ideal structure and superior performance have evolved in nature. Under normal circumstances, the microstructure of the organism’s surface and the special chemical composition of the surface are the key factors for the special properties exhibited by organisms. The most common plant that exhibits excellent hydrophobicity, the lotus leaf, can hang water droplets on its surface in the early morning or on rainy days, and at the same time, while it lives in sludge, it is not contaminated by the sludge. It was not until the end of the 20th century that scientists uncovered the lotus leaf’s super-hydrophobic ability. Botanists Barthlott et al. [25] found that the surface of lotus leaves (Fig. 1a) is regularly arranged with micron-scale papillary structures (Figs. 1b, 1c) and waxy cuticle with low surface energy, as shown in Fig. 1. The common effect is the fundamental reason for the water droplets on the surface of the lotus leaf to take away the dirt and keep it clean, and this self-cleaning feature is called the “lotus leaf effect” [26].
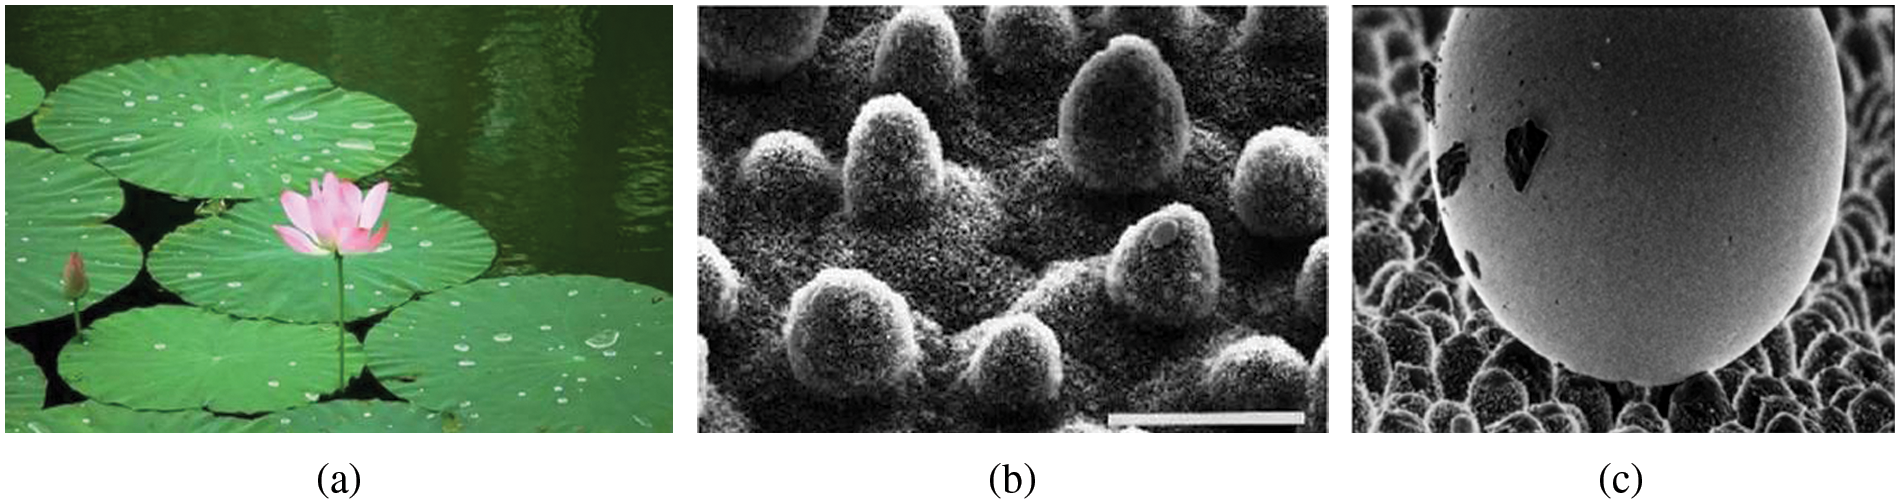
Figure 1: Surface schematic of lotus leaf (a) Lotus leaves in nature (b) Lotus leaf under scanning electron microscope [25] (c) Mercury droplet on the adaxial leaf surface of Colocasia esculenta [25]
2.1 Design of Mastoid Structures
Inspired by the mastoid microstructure on the surface of the lotus leaf, a structural surface with a mastoid microcolumn has been designed in this paper, as shown in Fig. 2. In this figure, H is the height of the mastoid, R is the radius of the mastoid head, and P is the distance between the two mastoids.
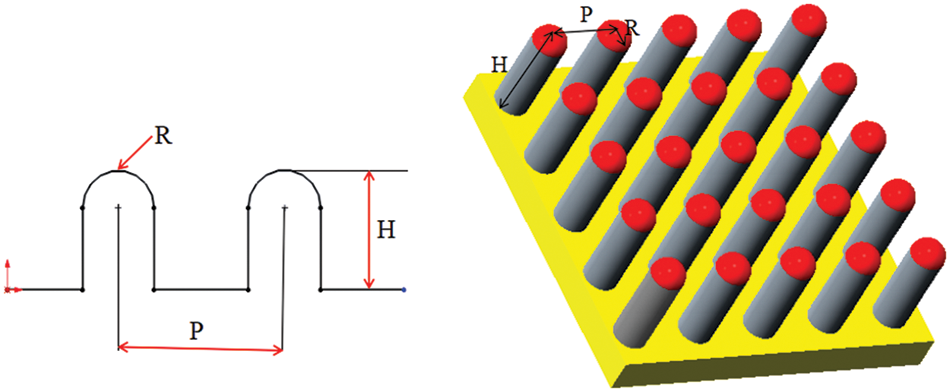
Figure 2: Three-dimensional design of mastoid microstructure
2.2 Determination of Geometric Model of Mastoid Microcolumns in Cassie-Baxter State
Wenzel believed that the micro-structure of a material surface could increase the effective contact area of the solid-liquid interface, thereby increasing the contact angle. It was assumed that the liquid could be filled with grooves between the micro-structures on the solid surface. The model assumed that the micro-structure could increase the actual contact area, thereby increasing the free energy of the whole system through the surface tension of the solid-liquid and solid-gas, thus affecting the contact angle in the equilibrium state. Cassie and Baxter found that some liquids on hydrophobic surfaces were not as described in Wenzel’s theoretical model-the liquid-filled pits on the surface microgrooves, but were suspended at the top of the microgrooves, thus squeezing some air into the pits.
Based on the Wenzel model, Cassie and Baxter proposed the relationship between the apparent contact angle and Young’s contact angle of a droplet on a solid surface with different chemical compositions in 1944 [27]. They assumed that the rough solid surface was composed of different substances with different chemical compositions, and the concept of composite contact was proposed to describe the wetting state of liquid droplets on the solid surface with different chemical compositions. Usually, in the Cassie state, droplets trap some gas in grooves on rough surfaces. One part of the droplet is in contact with the solid surface, and the other part is in contact with the gas in the groove, as shown in Fig. 3.
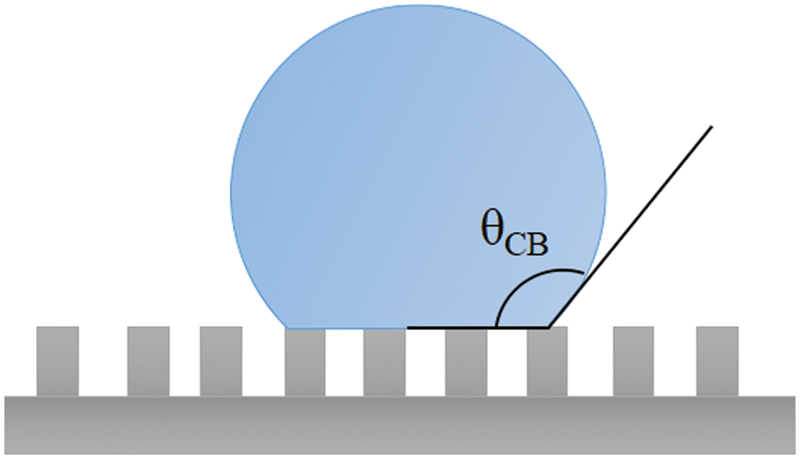
Figure 3: Cassie-baxter status
For this composite phase contact, the concept of phase area fraction f is introduced, and fi is defined as the ratio of the ith phase contact area of the droplet to the total contact area.
The relation between the apparent contact angle θn and the intrinsic contact angle θoi of a droplet on the surface of several chemical components can be obtained in the general form of the Cassie equation.
Generally, there are only two phases on the composite surface, so the above equation can be simplified as:
θCB is the apparent contact angle of the droplet at equilibrium in Cassie state, f1and f2 is the area fraction of the droplet infiltrating two different substances, respectively, and θ1 and θ2 are the intrinsic contact angles of the two substances. For the two phases in contact with the droplet, which is a solid and air, the equation above can become:
fS and fG are the area fractions of droplets in contact with solid and gas respectively. θS and θG are the intrinsic contact angles of a droplet on smooth solid surface and gas surface respectively. The intrinsic contact angle of a droplet in gas is 180°, that is, θG = 180°. The intrinsic contact angle between droplet and solid is equal to the young’s contact angle. The sum of the two phases’ area fraction is equal to 1, that is, fS + fG = 1, and Eq. (3) can be simplified as:
The wetting state of the droplets on the mastoid microcolumn structure is the Cassie state, as shown in Fig. 4. According to geometric relations, the area fraction of contact between the droplet and mastoid microcolumn can be obtained as follows:
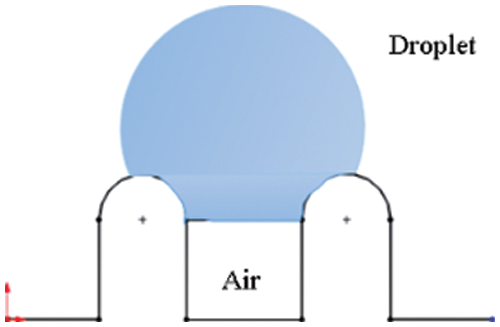
Figure 4: Cassie state model of droplets on the mastoid microcolumn surface
Determination of static equilibrium apparent contact angle θCA.
The Cassie equation for the equilibrium of droplets on the mastoid micro column surface can be obtained by substituting the area fraction of droplets in contact with the mastoid microcolumn into Eq. (4). That is the equation as below:
The apparent contact angle θCA of the droplet on the mastoid microcolumn is:
From Eq. (7), it can be seen that the apparent contact angle is independent of the height of the microstructure but decreases monotonically with the increase of the radius value, and increases monotonically with the increase of the pitch value.
For interface tracking, the VOF method, which is appropriate for the simulation of fluid flow between two immiscible fluids, is used. VOF was first proposed by Hirt et al. [28].
In the VOF method, the volume fraction α is defined as:
The value of density and viscosity are calculated as a function of α, using linear interpolation between the values of the two phases:
where the α-function is equal to:
The momentum equations expressing both phases are written in the form:
where
For two fluids with indices 1, 2, and an interface, the gradient of α always points away from fluid 2 towards fluid 1:
The curvature of the interface may be expressed, as follows:
And
Following Hirt and Nichols, the location of the interface is calculated on the assumption that the material derivative of the VOF indicator a is zero:
The continuity equation for both phases in the whole flow field is expressed as:
The continuity equation, using the conservation of the VOF indicator a, can be written as [29]:
Using the above equation, the conservative form of the transport equation for α is therefore:
Eqs. (12), (18), and (19) mathematically express the two-phase flow field under consideration.
3.2 The Elaboration of the Simulation Model
3.2.1 The Elaboration of Physical Models
The dynamic process of a droplet on the surface of the mastoid microcolumn is studied in this paper. The physical model can be simplified as follows: a droplet is placed directly above a solid surface in the atmosphere, and the diameter of the droplet is 1 mm. The process of wetting the droplet in contact with the solid surface is observed under quasi-static or dynamic conditions. The physical model is shown in Fig. 5.
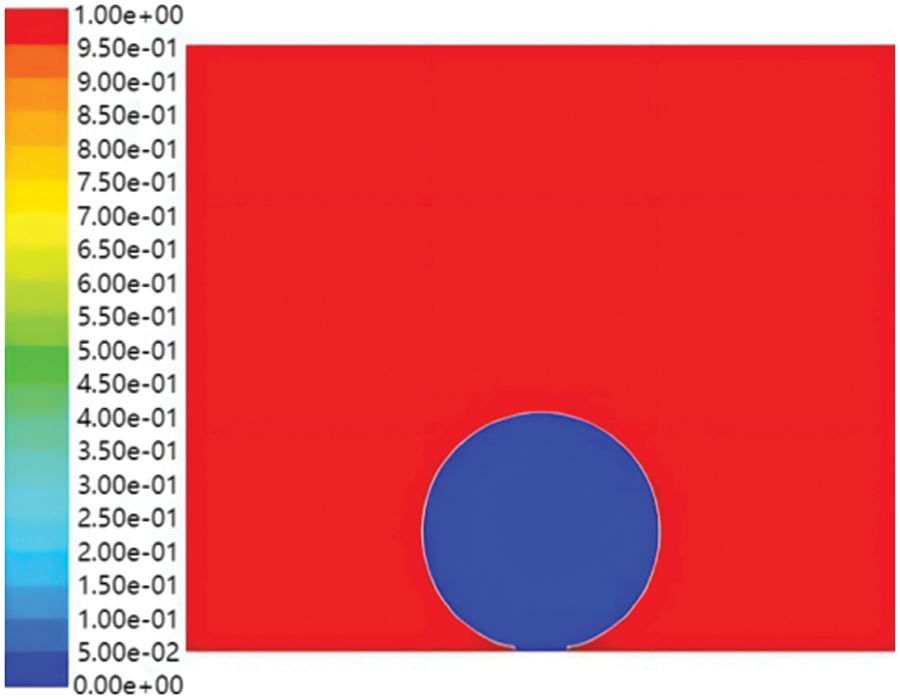
Figure 5: Physical model
Considering that the theoretical model is not completely consistent with the actual, we made the following realistic assumptions in the study, for convenience:
(1) The droplet size is much larger than the size of the microstructure, and its shape is the ideal spherical shape.
(2) The main purpose of the study is to understand the relationship between wettability and surface microstructure parameters, without involving changes in external environmental factors (such as microstructure surface temperature, heat transfer between gas and liquid phases).
(3) In the process of droplet changing, the gas-liquid interfacial tension has only a small change and can be approximated as a constant.
(4) The whole dynamic process is a laminar flow.
3.2.2 Meshing and Boundary Condition Setting
The simulation uses the fluid analysis software Fluent. When Fluent converts the actual physical phenomena into mathematical equations, the performance requirements of the computer are not high, and the calculation is fast and accurate. Considering various factors, it is appropriate to choose the VOF model of Fluent software for numerical simulations of droplet wettability.
The calculation area size of the two-dimensional structural grid is 1.8 × 3.2 mm. The method of tetrahedral meshing is adopted. For the air phase in the upper part of the computational domain, the grid can be sparse. The surface of the mastoid microcolumn and droplet is the focus of the calculation. The mesh density is increased by using the method of segmenting the mesh. The lower boundary of the computational domain is the wall boundary condition, and the other three boundaries are set as pressure-out, where the wall is set to a non-slip wall condition, the non-slip angle is set to 86.8°. The calculation requires that a volume force has been applied to the droplet. The droplet reaches the set velocity value at the moment of contact with the solid surface. The grid and set boundary conditions are shown in Fig. 6.
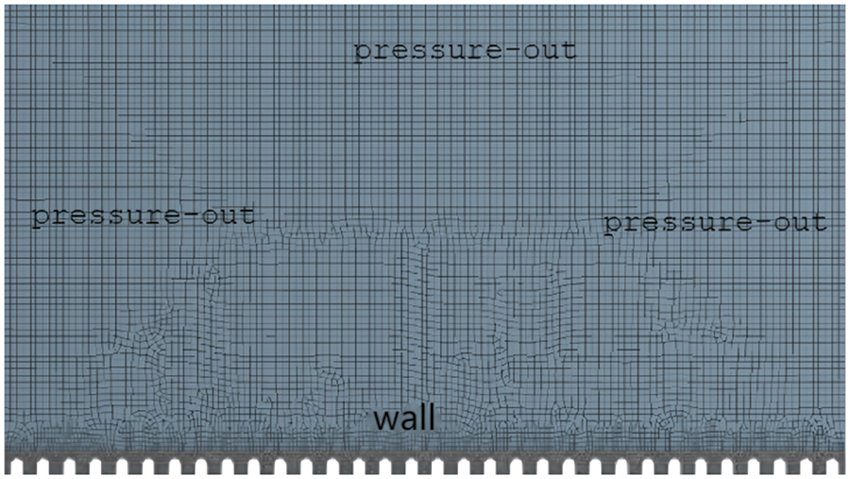
Figure 6: Calculation area grids
3.2.3 Verification of Grid Independence
In general, we know that with the increase of grid accuracy, the calculation results after iteration are more accurate. In fact, when the grid accuracy reaches a certain degree, the calculation results of continuing to increase the grid accuracy are almost unchanged, indicating that the grid accuracy is no longer related to the calculation results. Therefore, it is necessary to verify the independence of the grid after determining the grid division scheme. In the simulation study of droplet impact on micro-column structure, the apparent contact angle after droplet stabilization is an important parameter, which can verify the independence of the grid. Taking H5 as an example, that is, H = 70, R = 25, P = 100 m, the total number of grids in a, b, c are 5781, 11899, and 22879, respectively, as shown in Fig. 7.
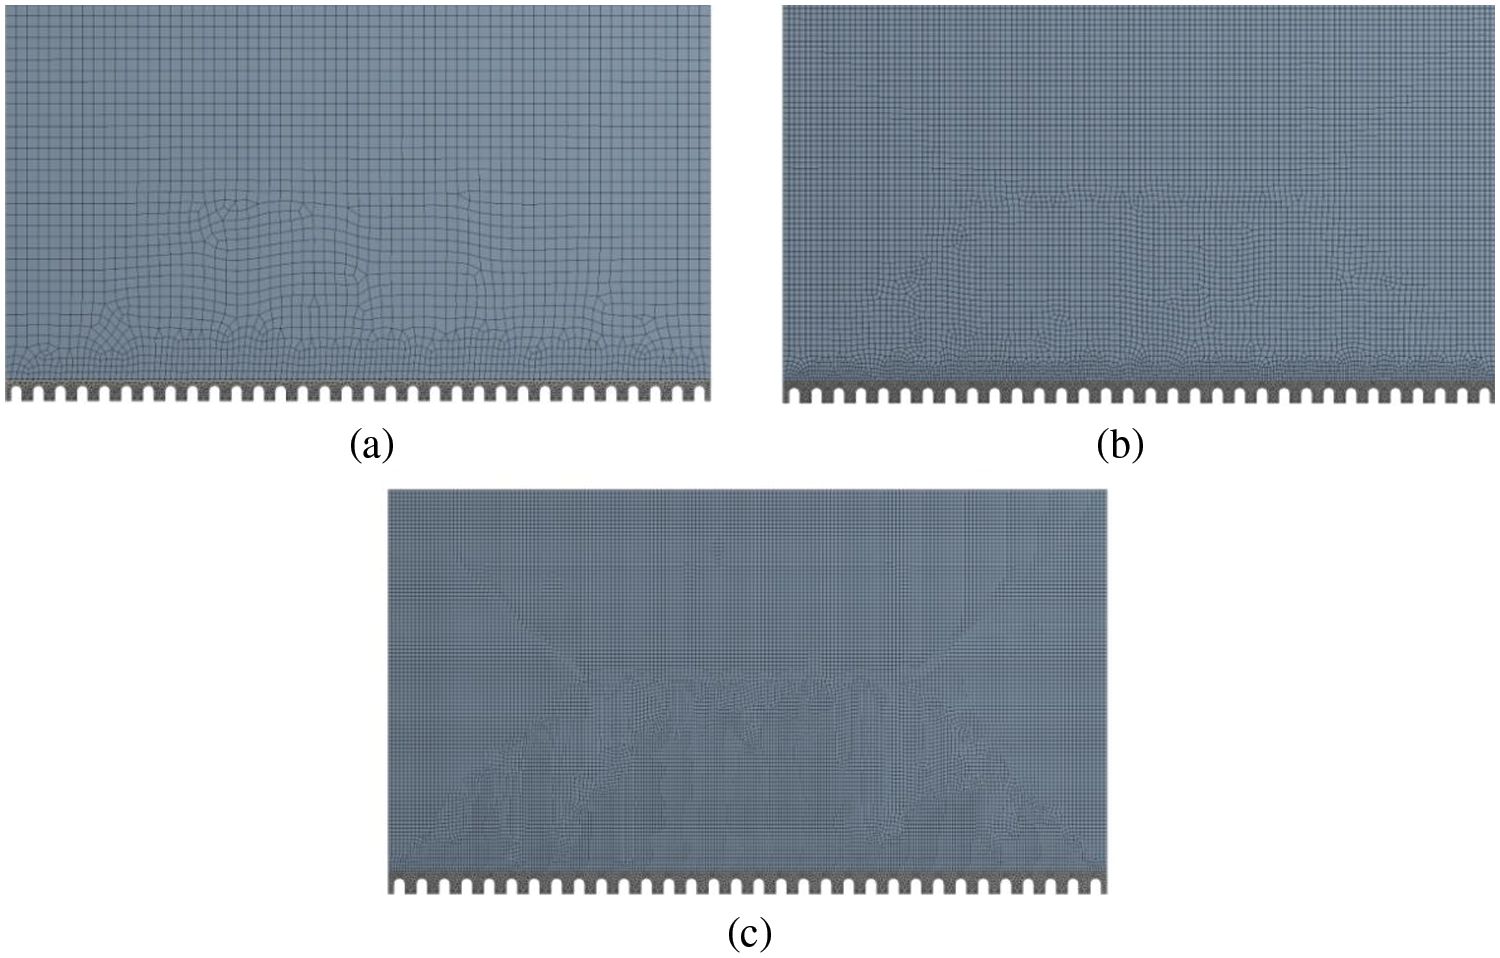
Figure 7: Different precision grids
Table 1 shows the contact angle of the droplets on the H5 microstructure surface under quasi-static conditions to reach a stable state, as shown in the following table.
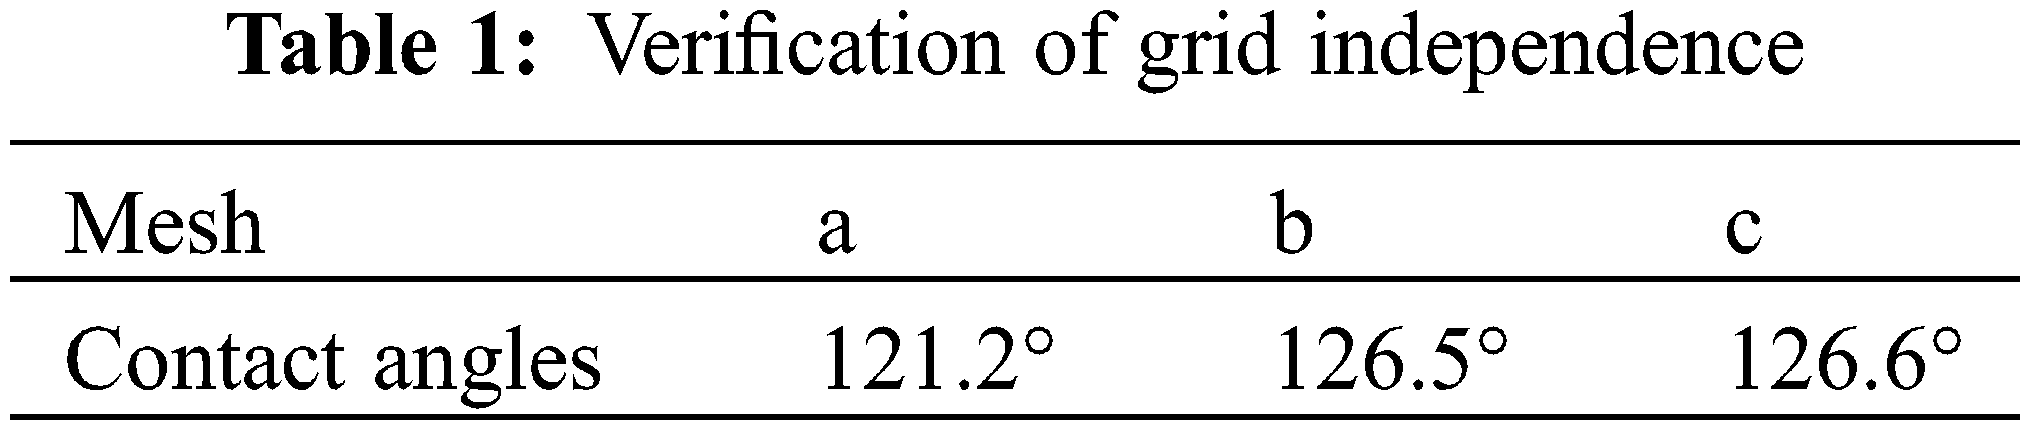
When the number of grids is about 11899, the contact angle of re-encrypted grids is almost unchanged, so the optimal number of grids that meet the calculation accuracy is 11899.
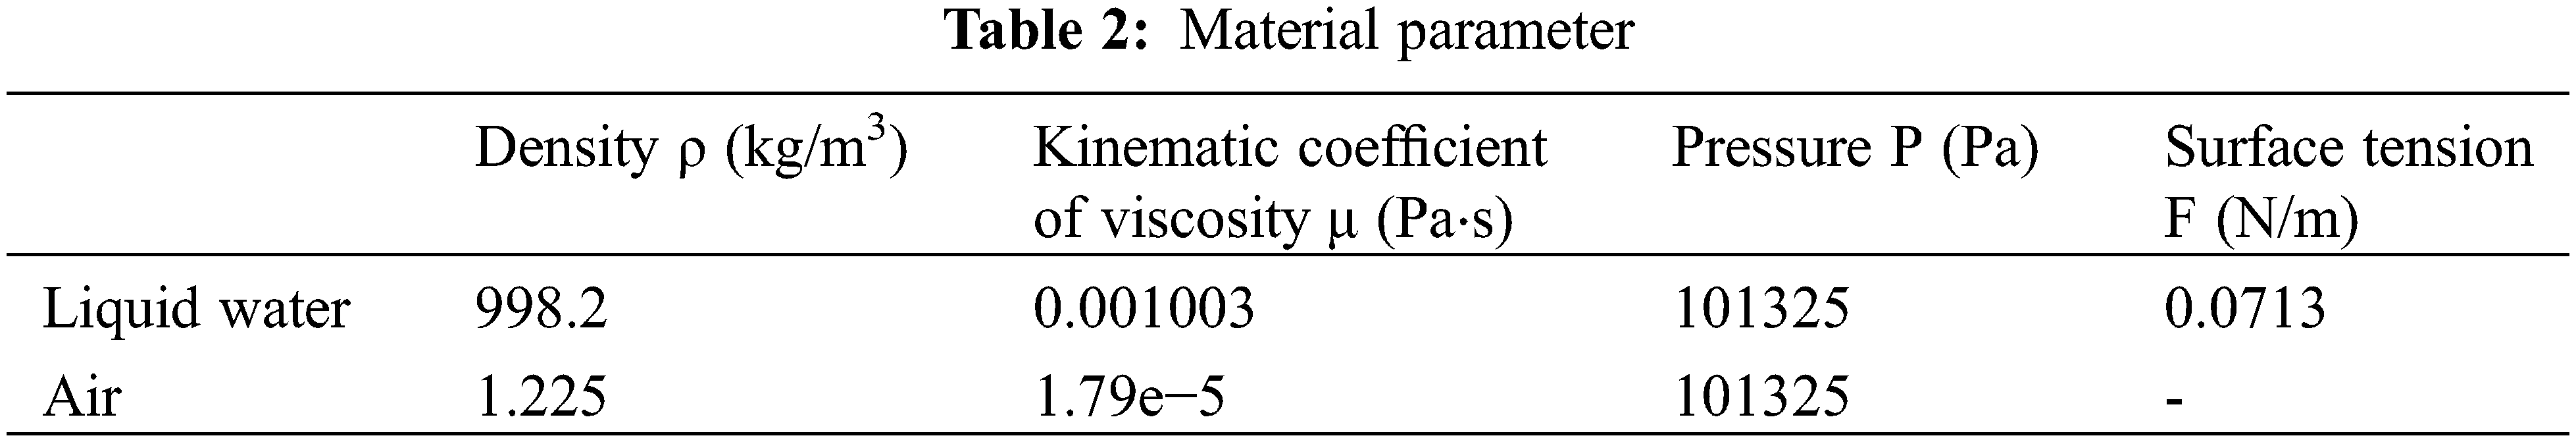
The working media used in the simulated process are water and air, and the surface tension between the gas-liquid interface is 0.073 N/m at room temperature. In the momentum equation, the coupling of droplet pressure and velocity is a transient problem, and the pressure-implicit with splitting of operators (PISO) algorithm is adopted. PISO algorithm can allow a large under-relaxation factor, which can speed up the calculation without affecting the accuracy of the calculation. To ensure the accuracy of calculation and convergence, the time step is set as 7e–6s and the residual set as 1 × 10⁻⁵. Additional material parameter settings are shown in Table 2.
To verify the feasibility of the computational model, it is necessary to compare the results after the simulation with the experimental data. In this paper, the experimental data of Ruan [30] has been selected for the above operations. In the experiment, 4 mL water drops fall on the surface of a smooth aluminum plate in a quasi-static manner, and the contact angle of a droplet resting on the sheet is measured. The contact angle of the droplets is 86.8°, calculated by taking the average value of five measurements.
Fig. 8 is the droplet evolution diagram. In these pictures, red represents air and blue represents water droplets. The droplet touches the surface of the substrate in a spherical shape and then rapidly expands radially, reaching its maximum at about 7.9 ms (Fig. 8c). At this time, the height of the droplet reaches the minimum, and the vertical velocity is zero, then the droplet enters a contraction phase, which lasts until 16 ms (Fig. 8d). After repeated oscillations (Figs. 8e–8g), the droplet reaches a stable state at 210 ms (Fig. 8h). The measured apparent contact angle of the droplet is 88.1°, which is very close to the experimental value (with an error of about 2%), as shown in Fig. 9. Therefore, the model is valid and can be used for further research.
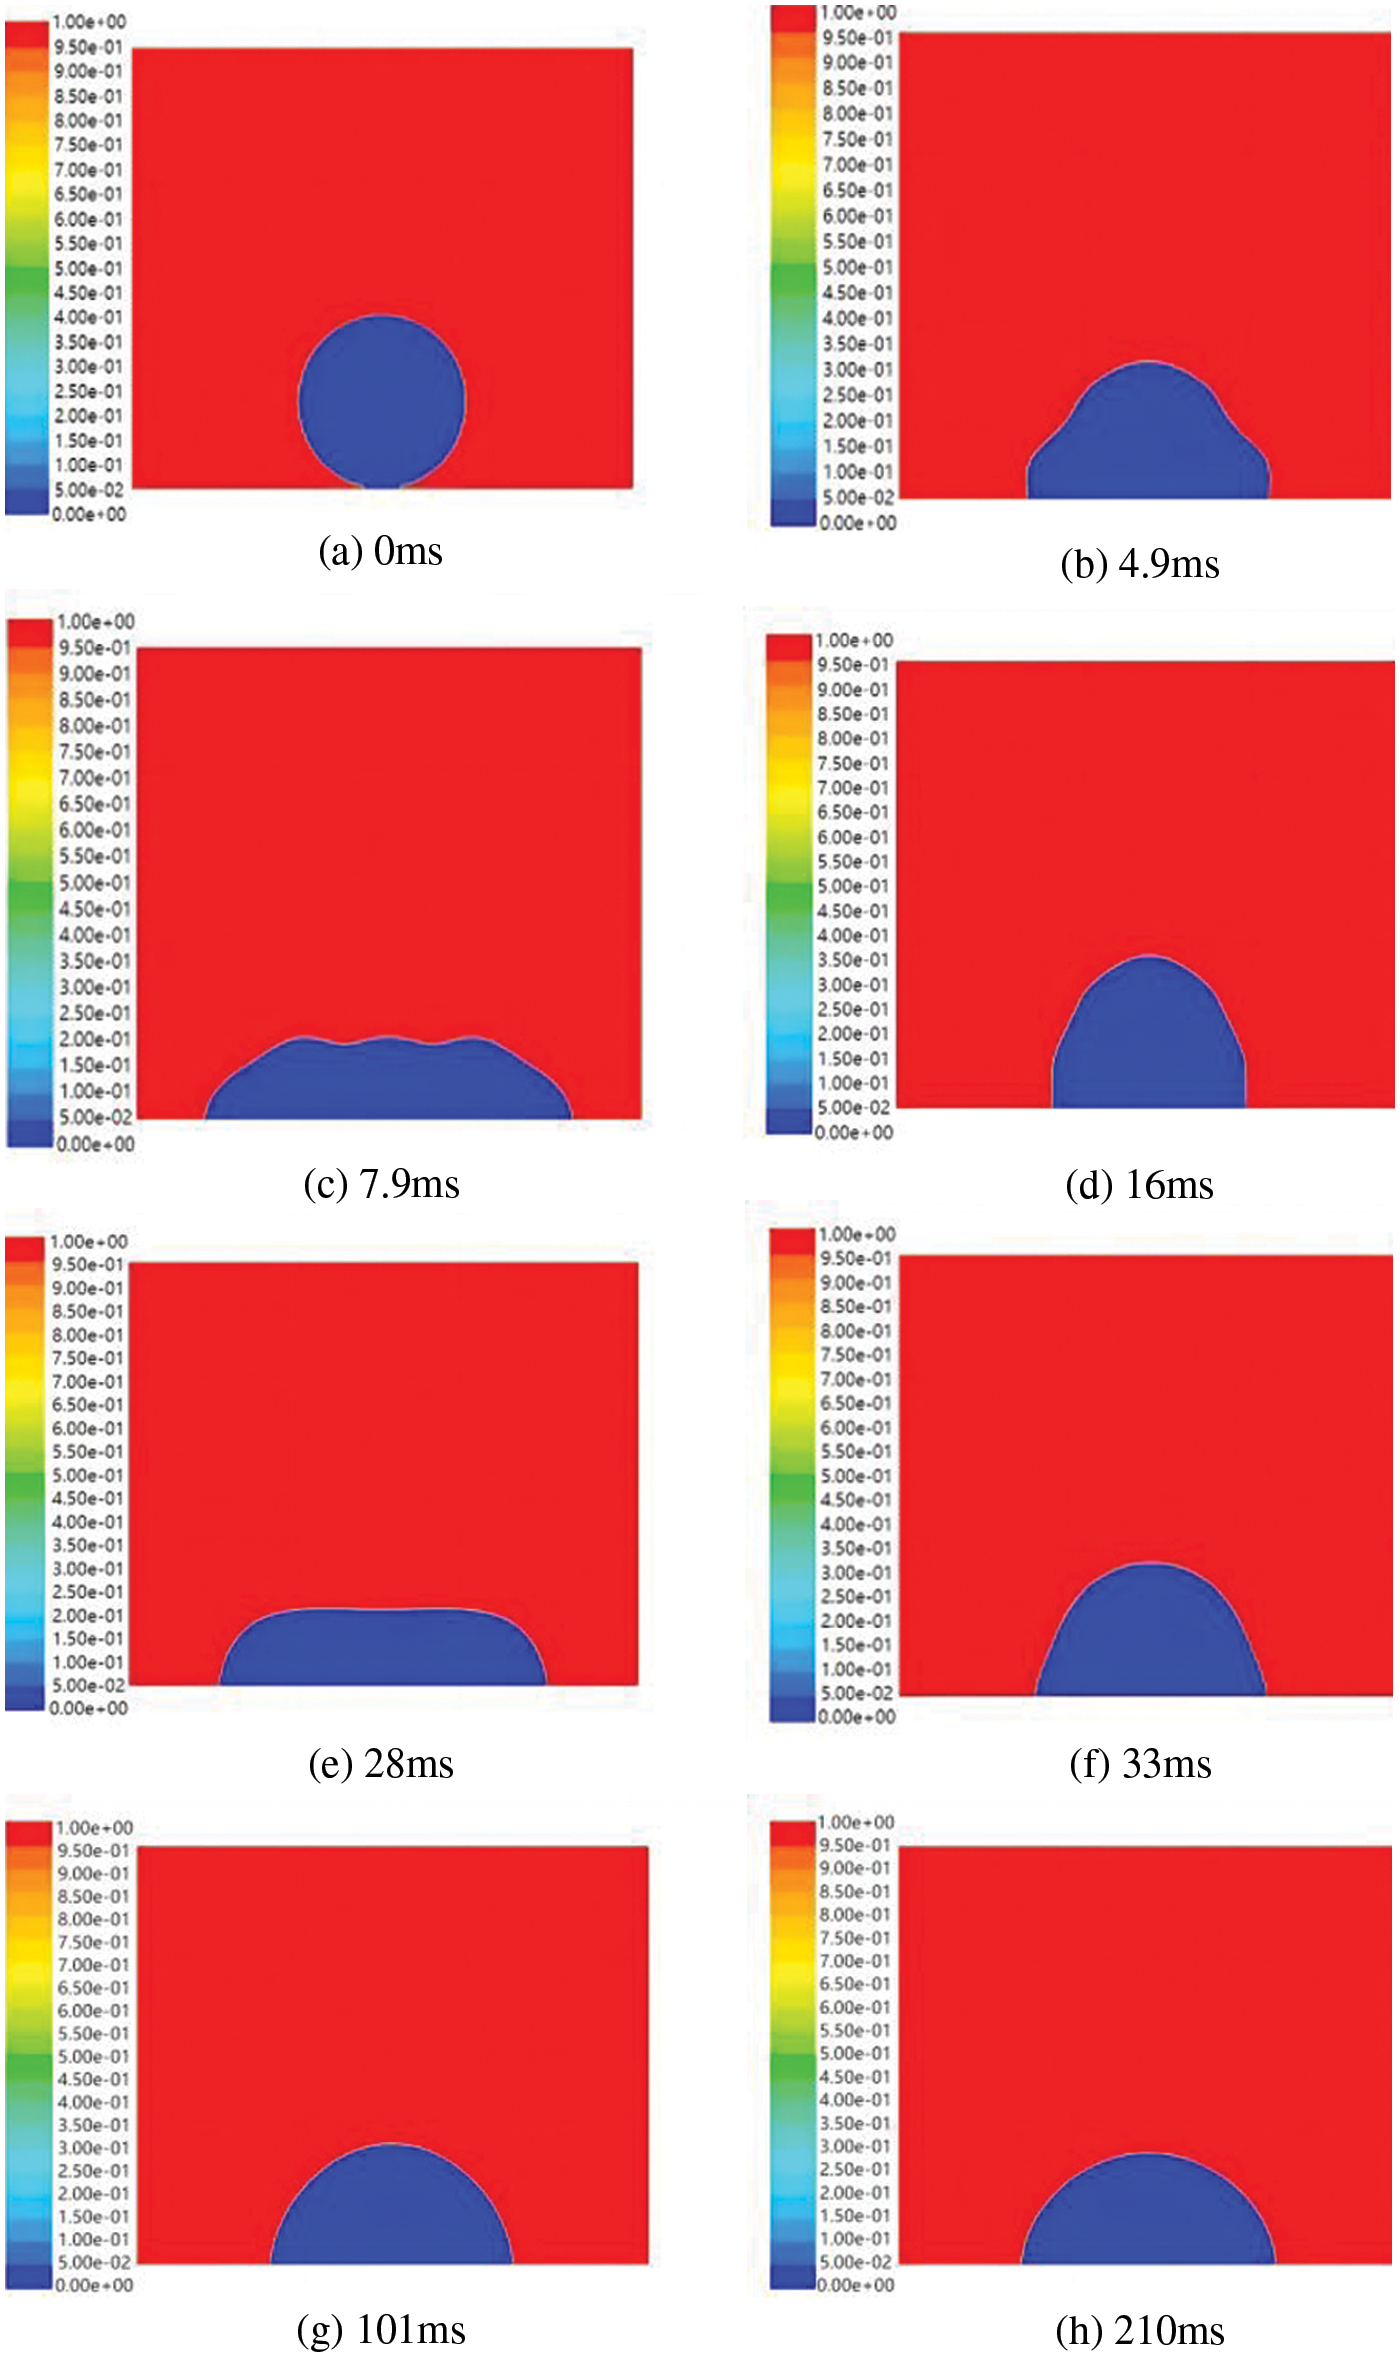
Figure 8: Dynamic evolution of droplets on smooth aluminum plate surface
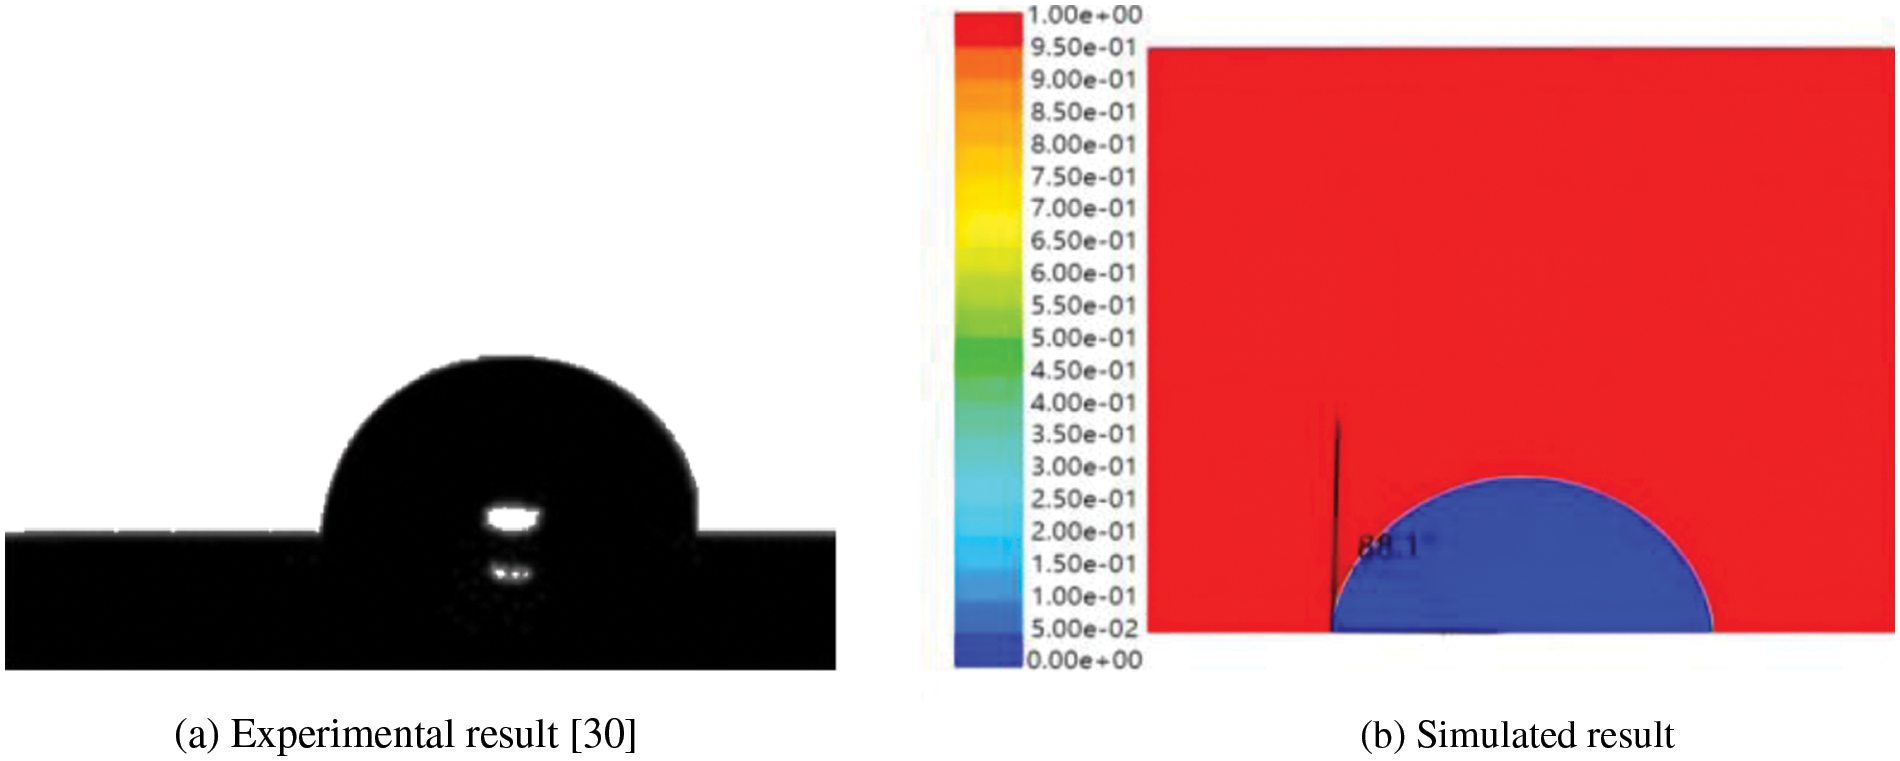
Figure 9: Comparison of experimental and simulated results
4 Effect of Mastoid Microcolumn Structure on Dynamic Wettability of Droplet
In practical life, the droplet has a certain falling speed, and the stabilized apparent contact angle is the best indicator of the microstructure wettability. Therefore, it is very necessary to study the process of the dynamic change of the droplet and the contact angle after stabilization.
The choice of the initial velocity in the numerical simulation of droplet dynamics should be fully considered. Too high velocity may cause the droplet to break or even splash on the surface of the structure, which is not conducive to our study of the effect of microstructure on the steady-state contact angle of the droplet. It should also be considered that too low droplet velocity will not reflect the dynamic influence of the microcolumn structure on the contact angle. For this reason, we first choose the velocity of 0.35 m/s to simulate the dynamic process, as shown in Fig. 10.
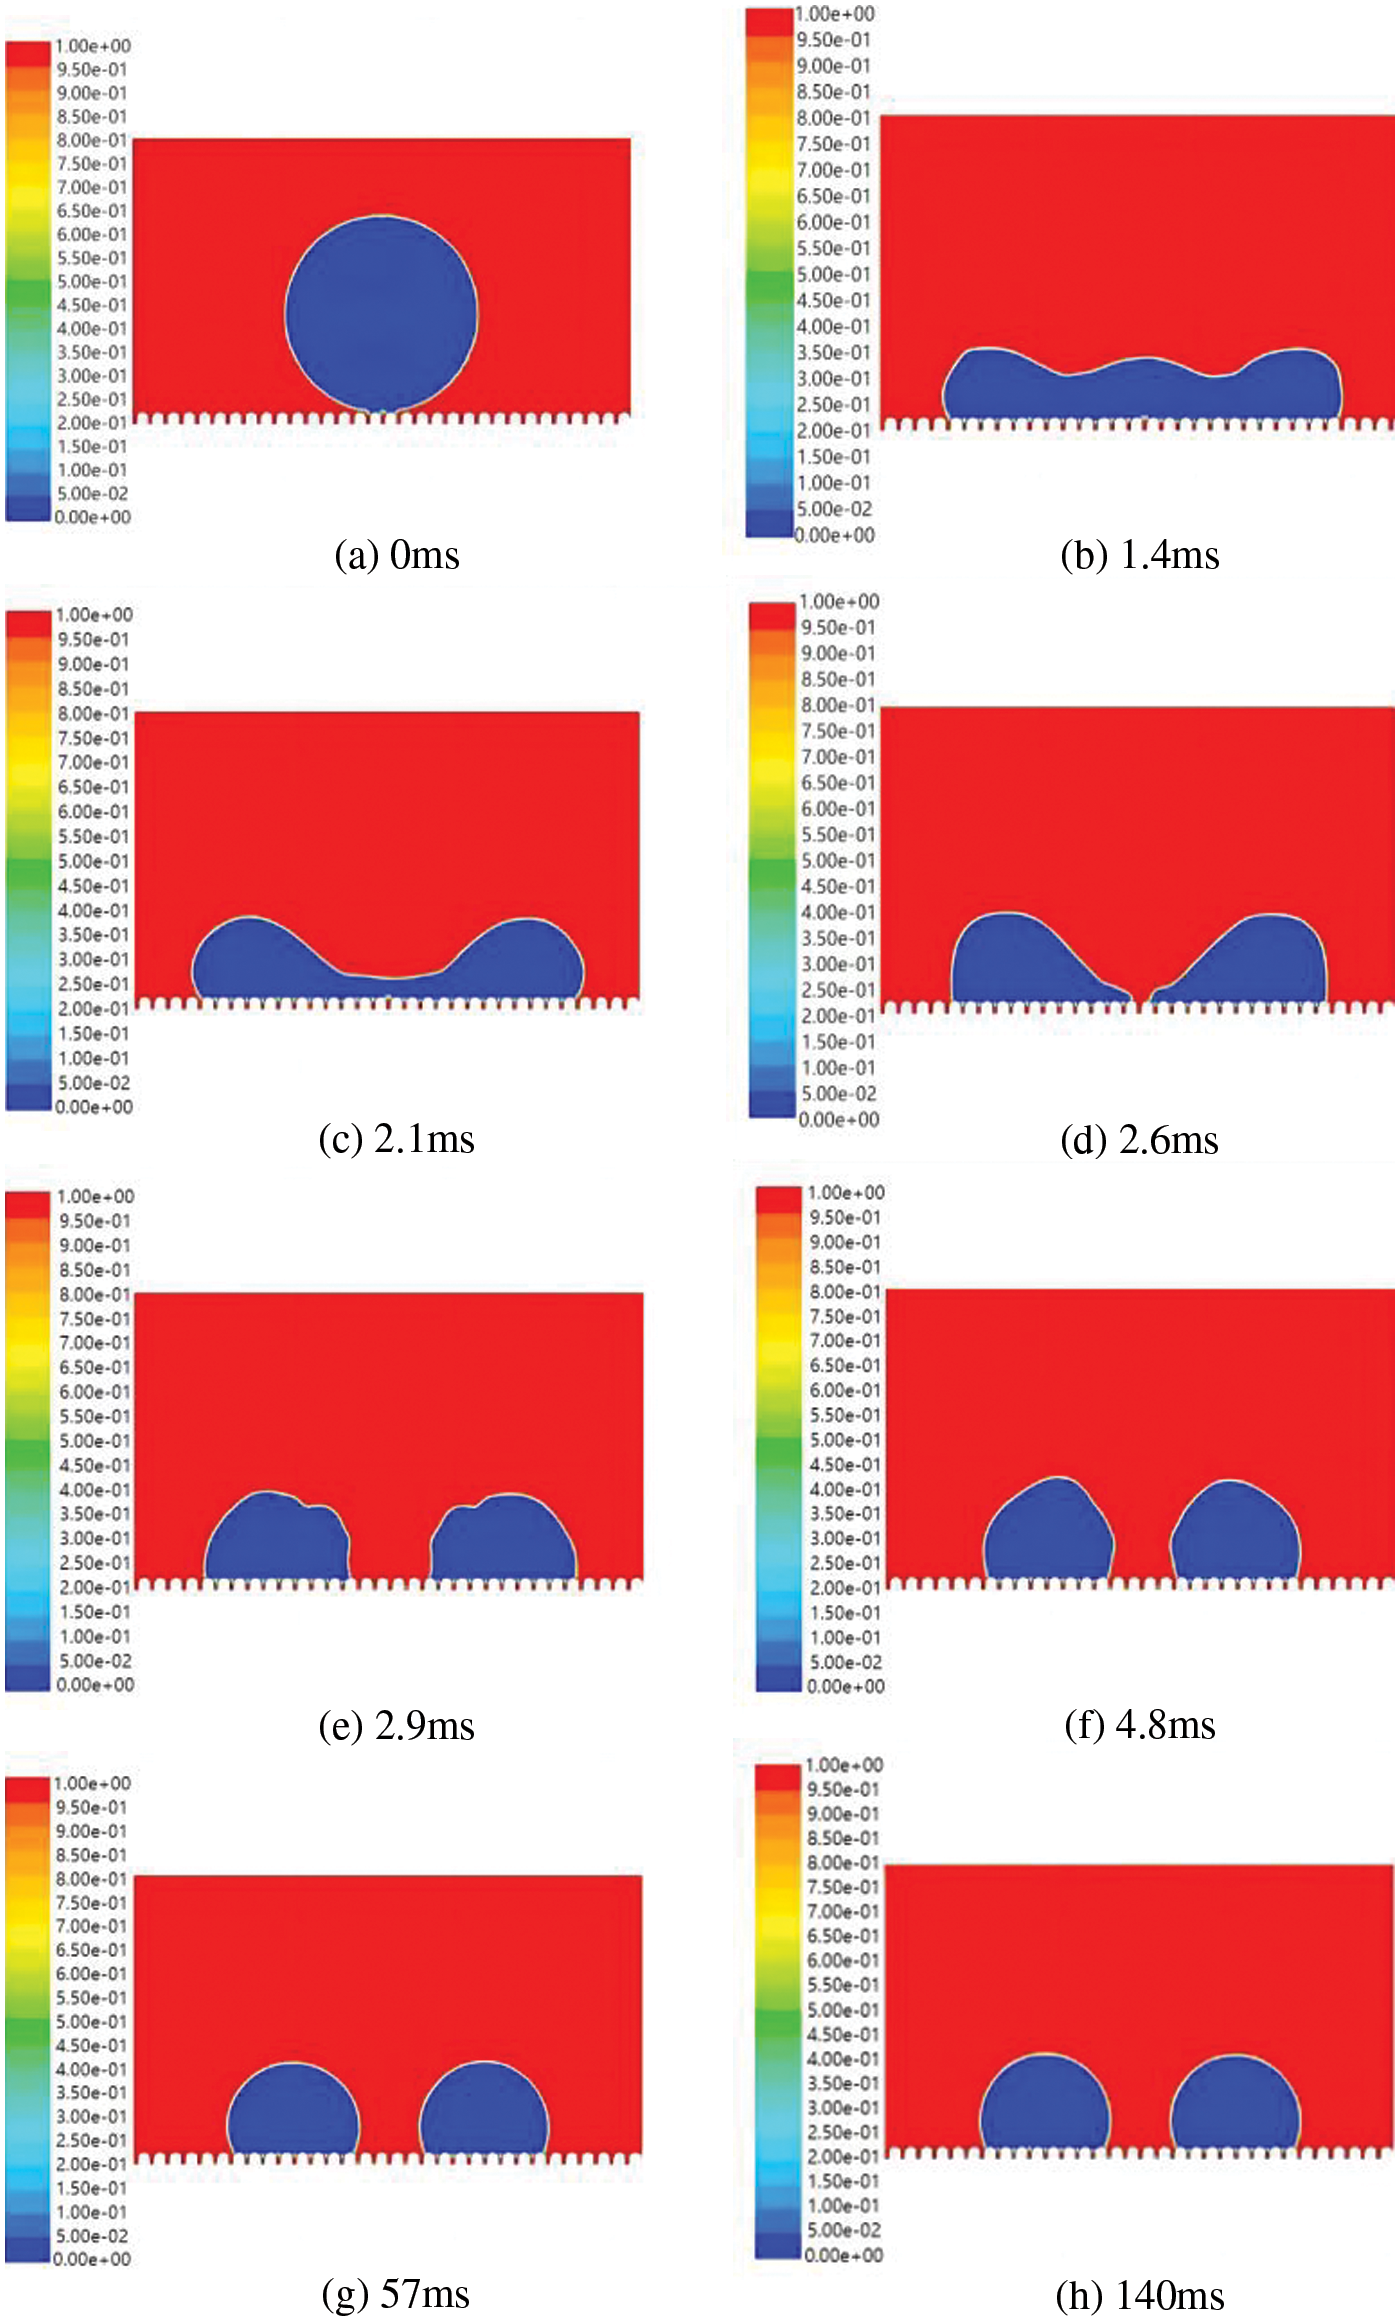
Figure 10: The dynamic evolution of droplets when the velocity is V = 0.35 m/s
The droplet contacts the microstructure surface at a speed of 0.35 m/s, starts to break at about 2.6 ms, and completely breaks into two small droplets after 0.3 ms. Continue to calculate until the droplet is completely stable for 140 ms, the broken droplet has no possibility of re-merging into a whole droplet. Further research showed that as the velocity increased, the droplets were more likely to break into smaller droplets. Therefore, it is more reasonable to choose the initial velocity of the droplet to be about 0.3 m/s (<0.35 m/s).
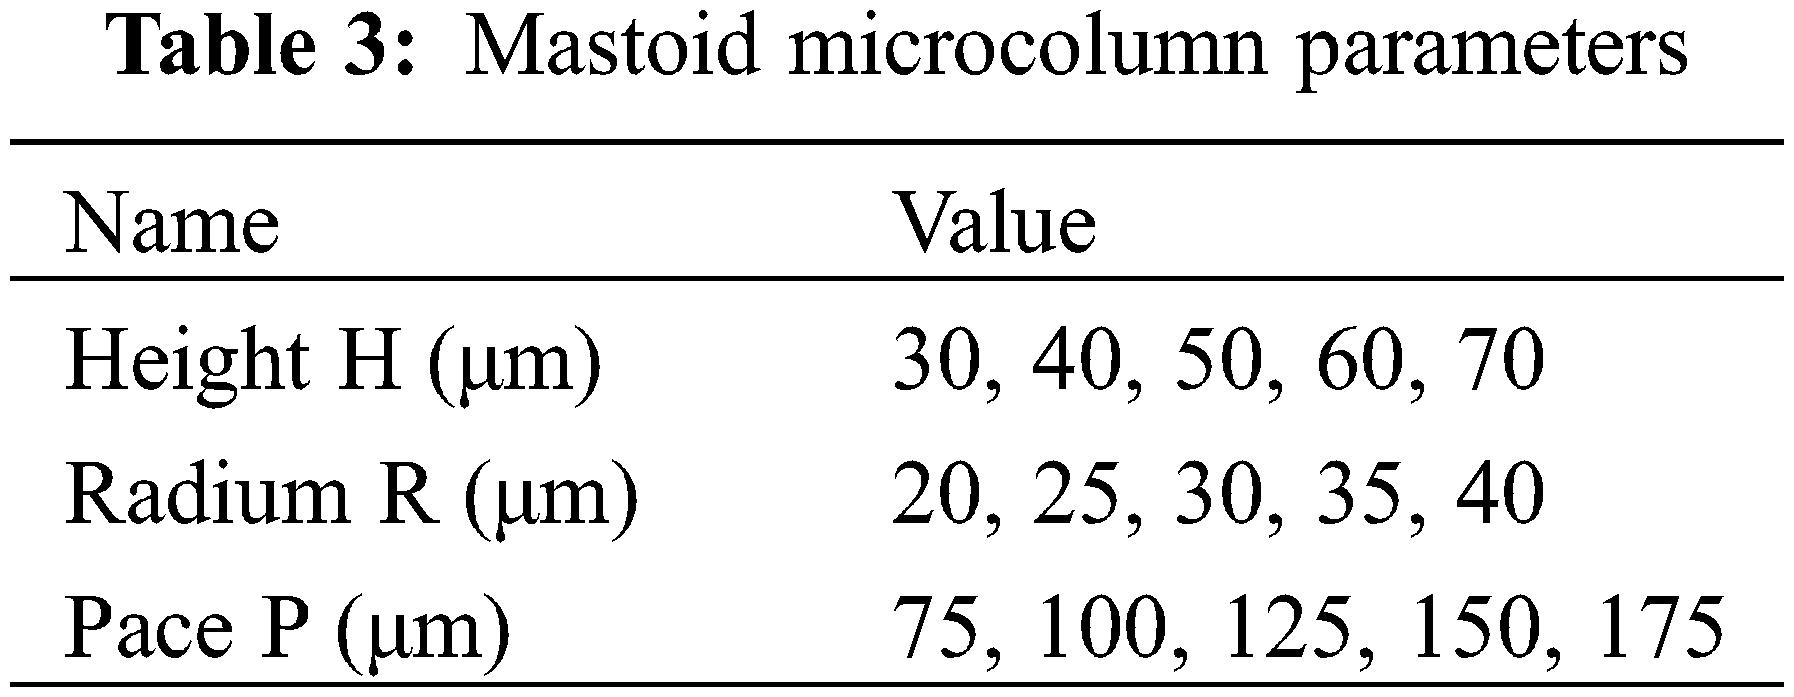
In the following research, the contact angle and the pressure of the cave during the dynamic process will be analyzed respectively, and the size parameters of the microstructures used are shown in Table 3. The meanings of the parameters in the table are shown in Fig. 2.
4.1 Influence of Mastoid Microcolumn Structure on Contact Angle
4.1.1 Effect of Mastoid Microcolumn Height
In this section, the influence of the height of the mastoid micro column on the dynamic dynamic behavior of droplets is mainly studied. Fig. 11 shows the apparent contact angle measured after the droplet touched the mastoid microcolumn at different heights at an initial velocity of 0.3 m/s. Wang [31] and Meng [32] used PS software to measure the contact angle after droplet stabilization. The contact angle after droplet stabilization was also measured by the PS software. When the height of the mastoid microcolumn in Figs. 11a, 11b is less than 40 μm, the droplet rapidly fills the structure (in Wenzel state) during the impact of the droplet, indicating that the existence of air pockets is critical to hydrophobicity. It can also be seen from the simulation results that the apparent contact angle of the microstructure without cave is relatively small. The height of the mastoid microcolumn on the surface of microstructures (Figs. 11c–11e) is more than 50 μm, and there is air cave on the microstructures after the droplet reaches the stable state, which is the standard Cassie state. With the existence of cave, the apparent contact angle of a droplet in steady-state is above 120°, showing excellent hydrophobic performance. We believe that the increase in the height of the mastoid microcolumn leads to an increase in the volume of the cave. The pressure of the gas contained in the cave is sufficient to make the bottom of the droplet suspend on the cave layer, which provides the basis for the hydrophobicity of the microstructure surface and makes it easier to show the hydrophobicity.
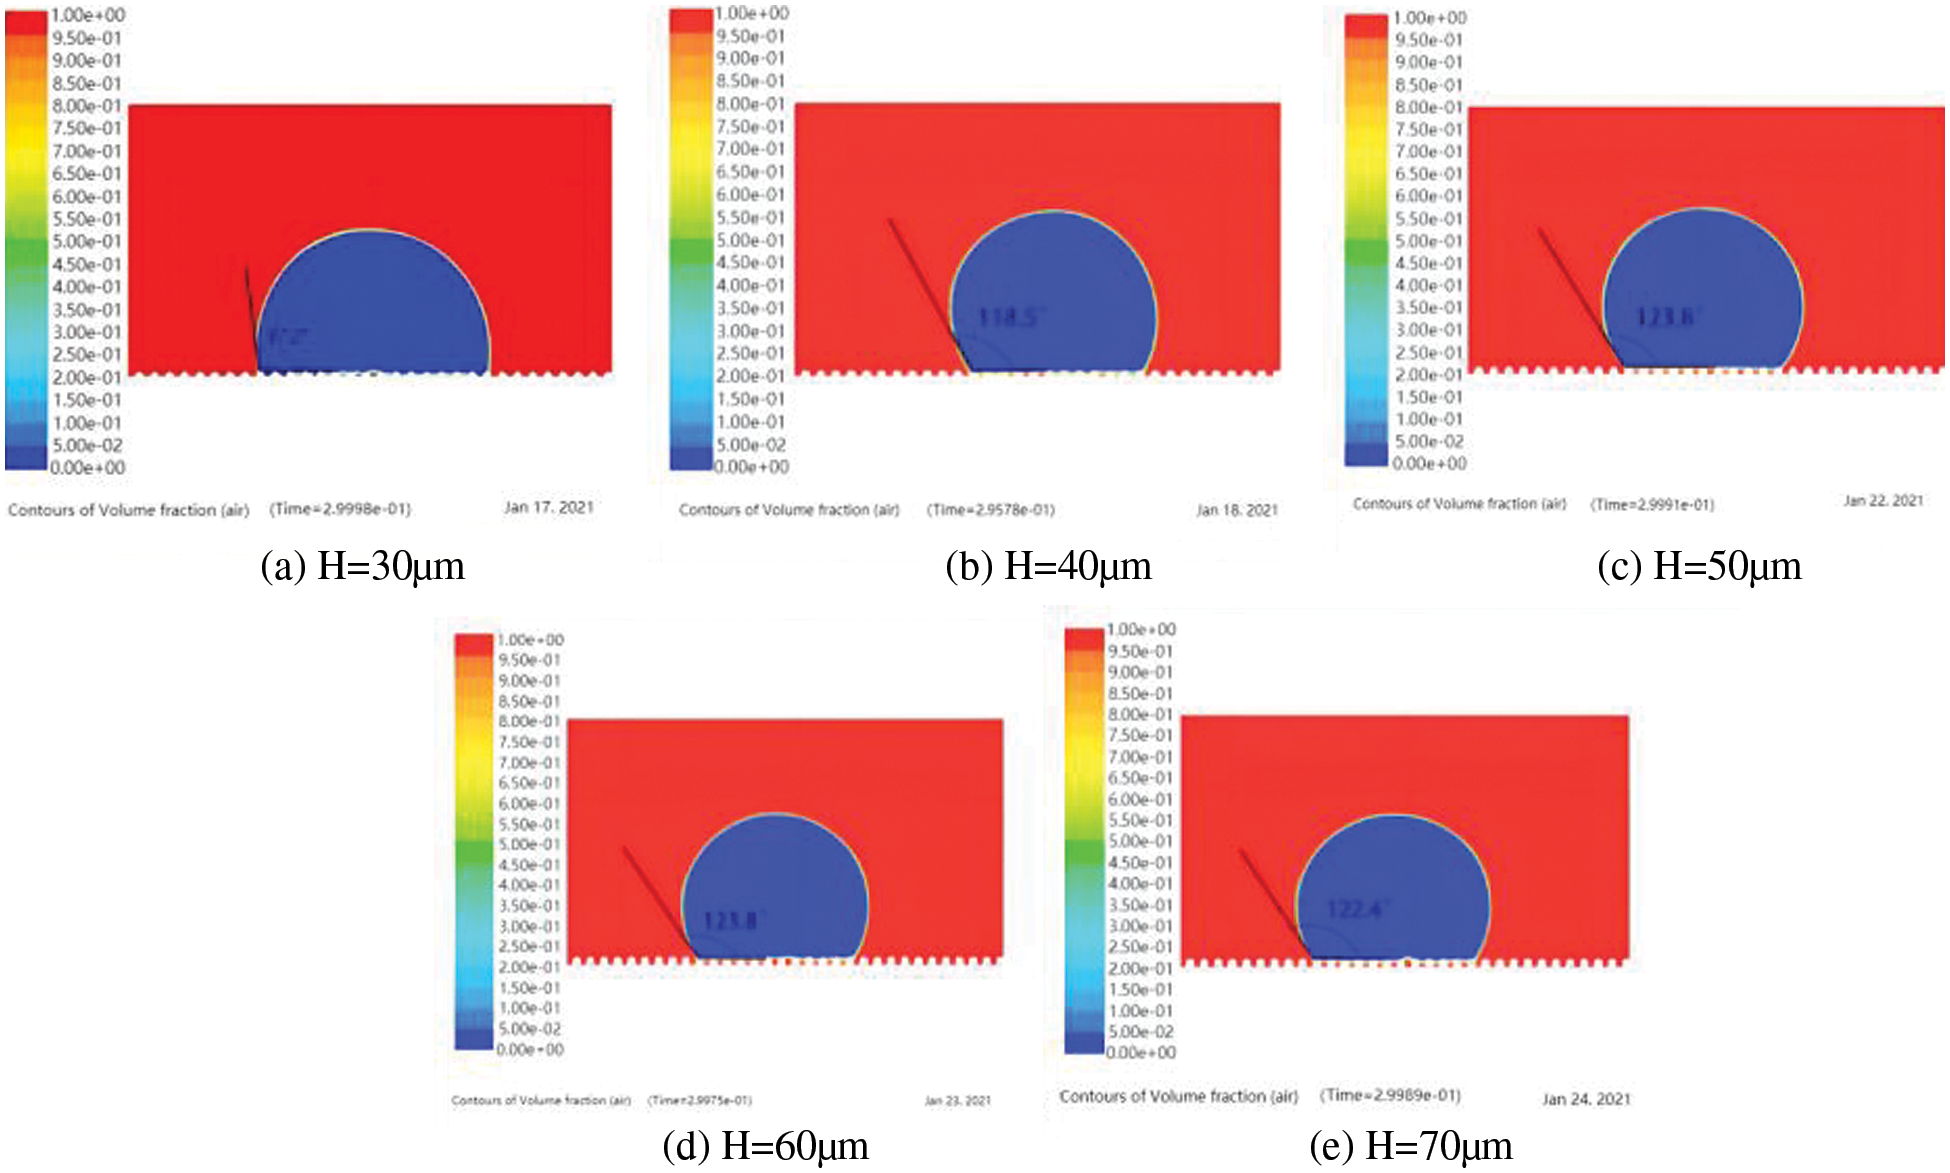
Figure 11: Apparent contact angles of droplets on mastoid microcolumn with different heights
To show the influence of the height of the mastoid microcolumn more intuitively on the apparent contact angle under dynamic conditions, we compared the statistics of the apparent contact angle under quasi-static and dynamic conditions in Fig. 12.
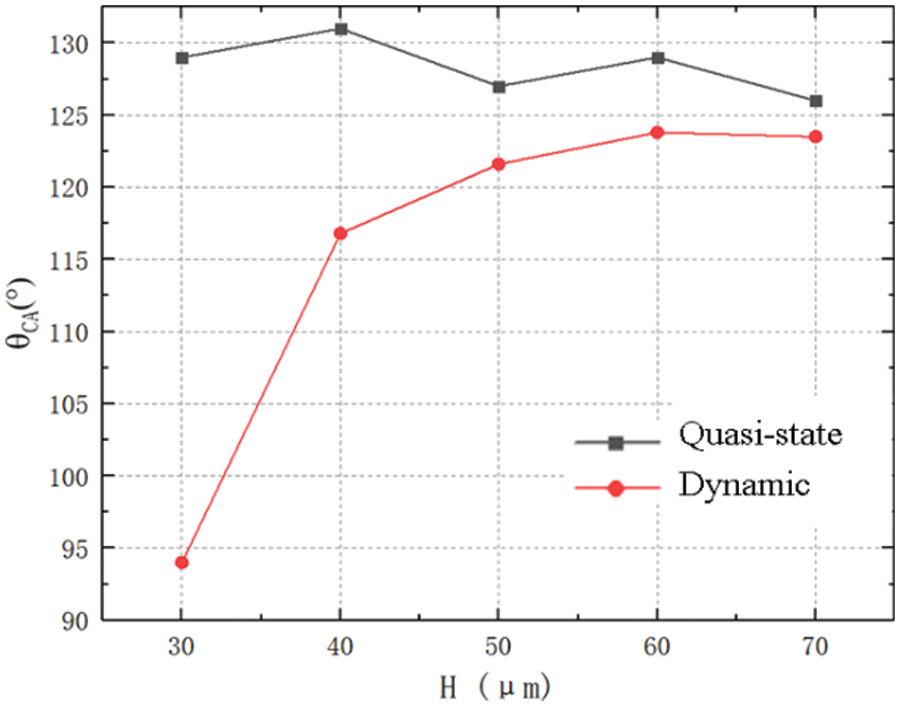
Figure 12: Comparison of droplet contact angles at different heights under two conditions
It is obvious from the figure that the droplet’s apparent contact angle under dynamic conditions is smaller than that under the quasi-static conditions when the droplet is stable on the microstructure of different heights. We believe this is due to the increased velocity of the droplets touching the surface of the solid microstructure, which destroys the presence of the cave to a certain extent, resulting in a loss of pressure, reducing the ability of the cave to provide suspension to the bottom of the droplet, eventually leading to a decrease in the contact angle.
4.1.2 Effect of Mastoid Microcolumn Pitch
This section mainly studies the effect of the spacing between mastoid microcolumns on the contact angle of droplets. Fig. 13 shows the apparent contact angle after the droplet stabilized on the mastoid microcolumn with different spacing at an initial velocity of 0.3 m/s. It can be observed that there is stable air cave, which ensures that the droplets are all in Cassie state.
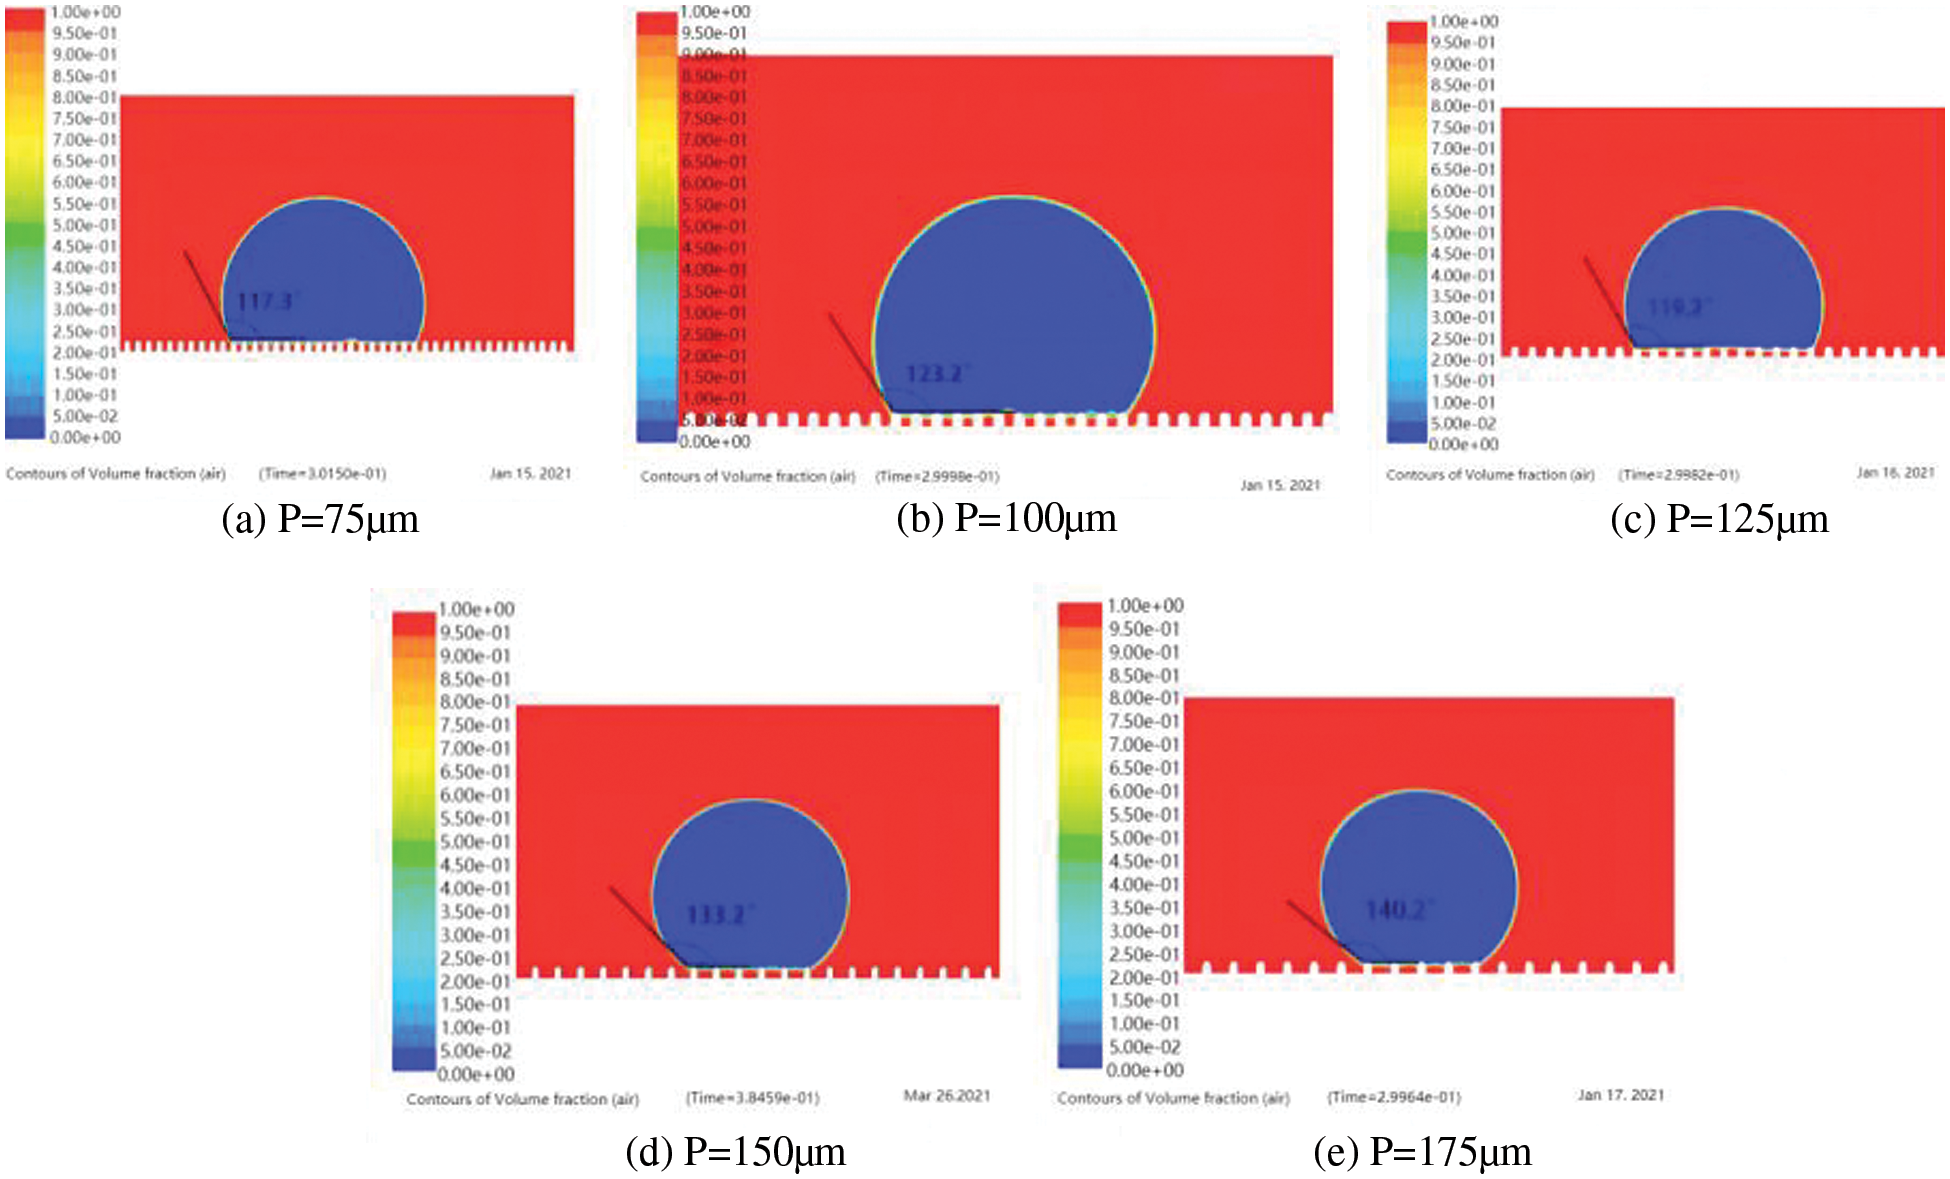
Figure 13: Apparent contact angles of droplets on mastoid microcolumn with different pitch
To more intuitively study the change of contact angle caused by spaces, we have provided statistics on the apparent contact angle of a droplet under quasi-static and dynamic conditions, as shown in Fig. 14. Firstly, when the droplet has been stable, the apparent contact angle increases with the increase of the spacing. Therefore, it can be concluded that an appropriate increase in the distance between micro columns is conducive to increasing hydrophobicity under quasi-static or dynamic conditions. Secondly, by comparison, It is found that the apparent contact angle of the droplet under dynamic condition is less than that under quasi-static condition.
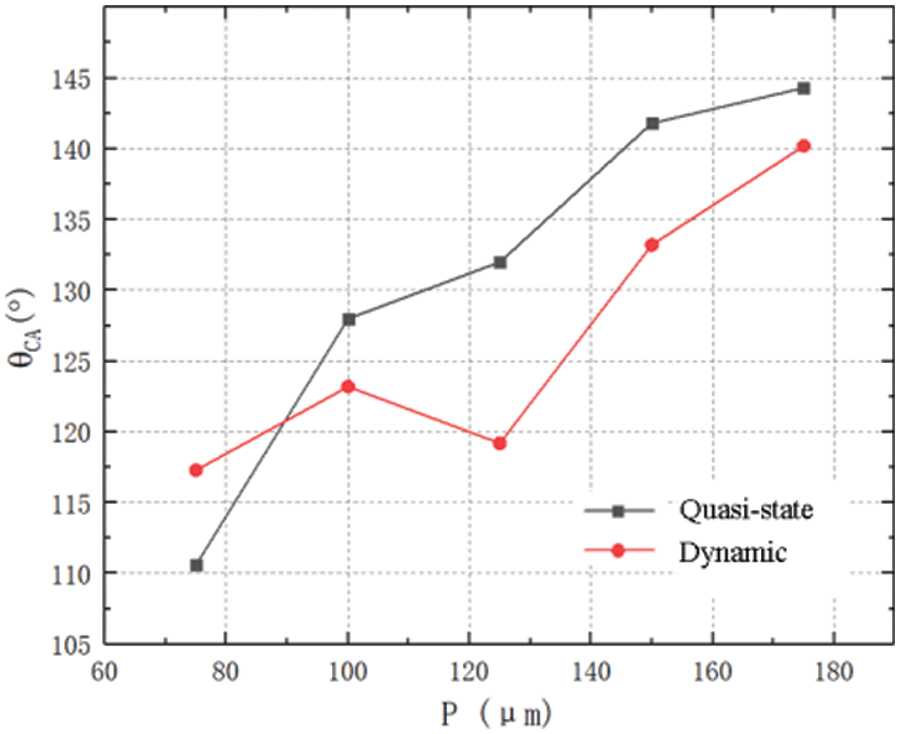
Figure 14: Comparison of contact angles of droplets with different spaces under two conditions
The attribute of initial velocity increases the spread diameter of droplet relative to the quasi-static condition, that is, the spread diameter of a droplet under dynamic condition is larger than under quasi-static condition. However, the droplet does not shrink significantly when retracting, so the solid-liquid contact area when the droplet reaches stability is larger than the contact area under quasi-static conditions, which makes the apparent contact angle larger than the apparent contact angle under quasi-static conditions.
The detailed magnification of droplet stabilization on the mastoid microcolumn is shown in Fig. 15. Where, from a to b and from a′ to b′ represent the contact areas on the mastoid microcolumn (P = 125 μm) under quasi-static and dynamic conditions, respectively. It is observed that the solid-liquid contact area of droplets under quasi-static conditions is smaller than under dynamic conditions. Boundary layer friction is also less, so the droplet retracts more easily into a spherical shape (i.e., has a larger contact angle).
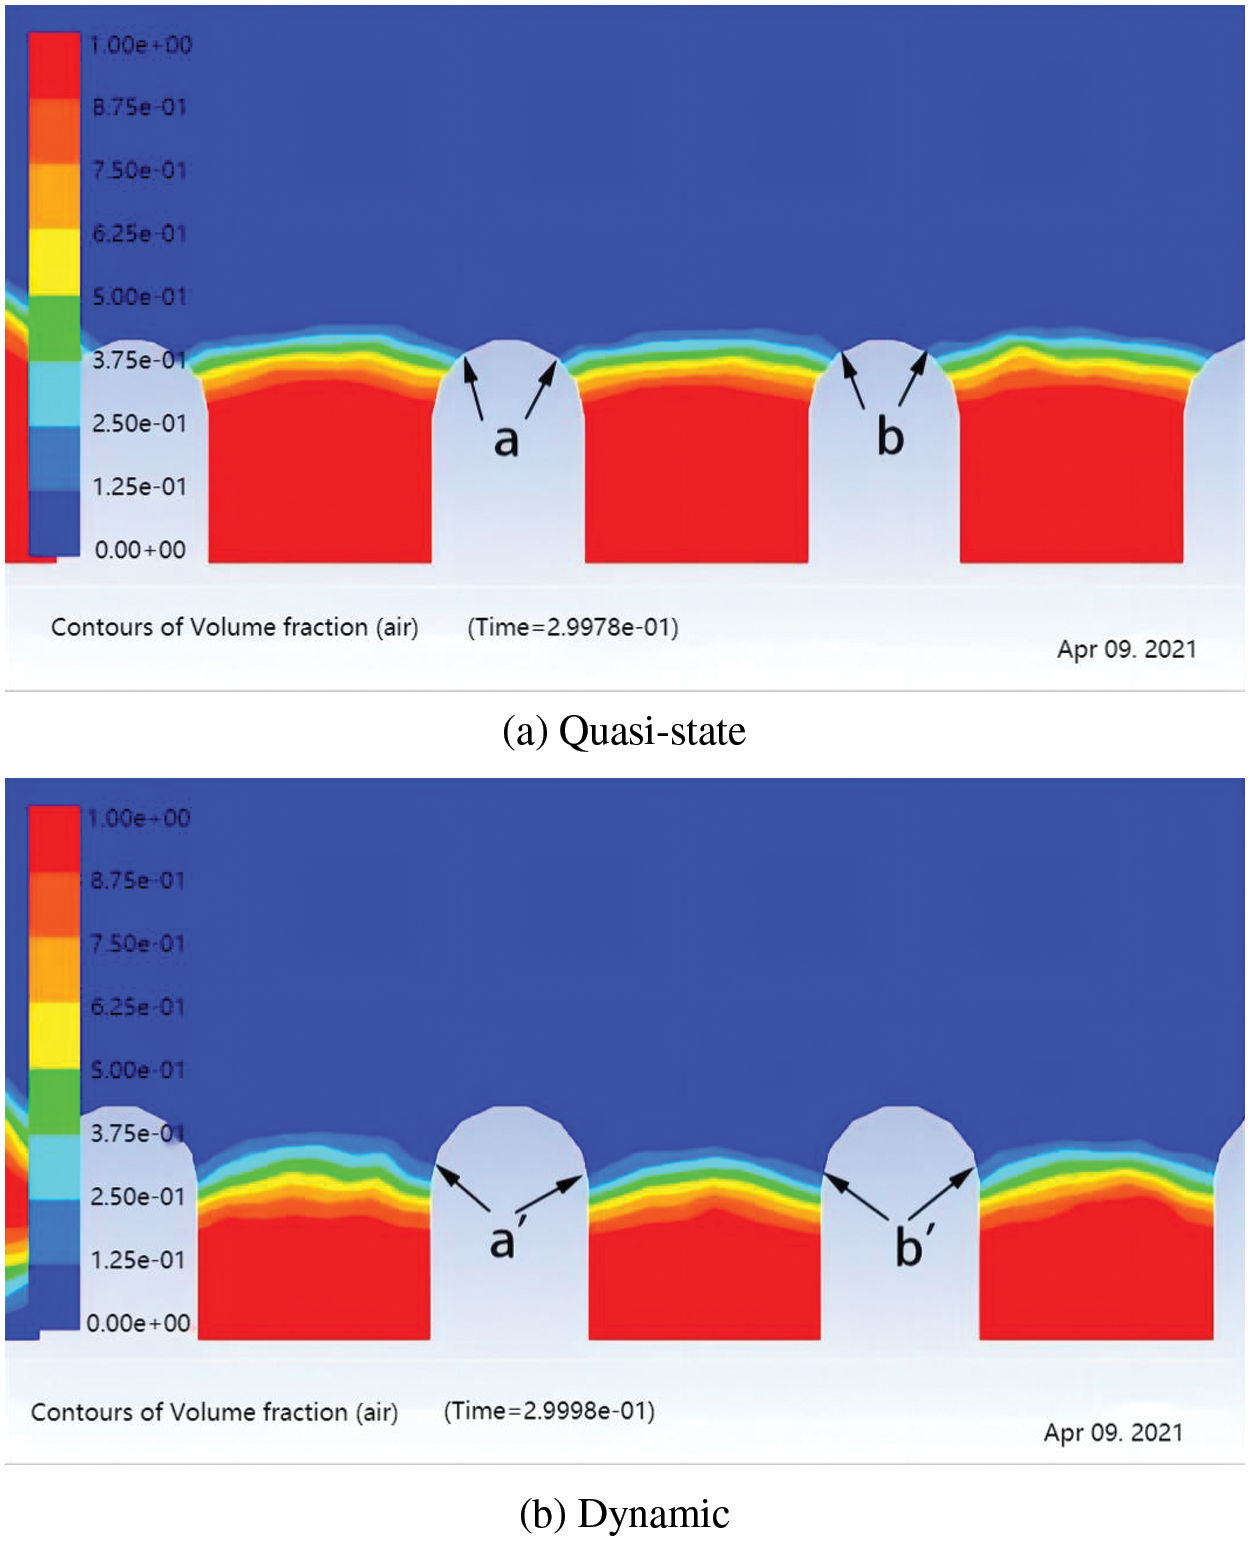
Figure 15: The contact area of droplets on the mastoid microcolumn with a pitch of P125 μm
4.1.3 Effect of Mastoid Microcolumn Radius
In this section, the dynamic behavior of droplets on the mastoid microcolumn with different radius specifications is mainly studied. Fig. 16 shows the apparent contact angle after the droplet is stabilized on the mastoid microcolumn structure with different radius at an initial velocity of 0.3 m/s. There is air cave on each microstructure, but the contact angle decreases with the increase of radius.
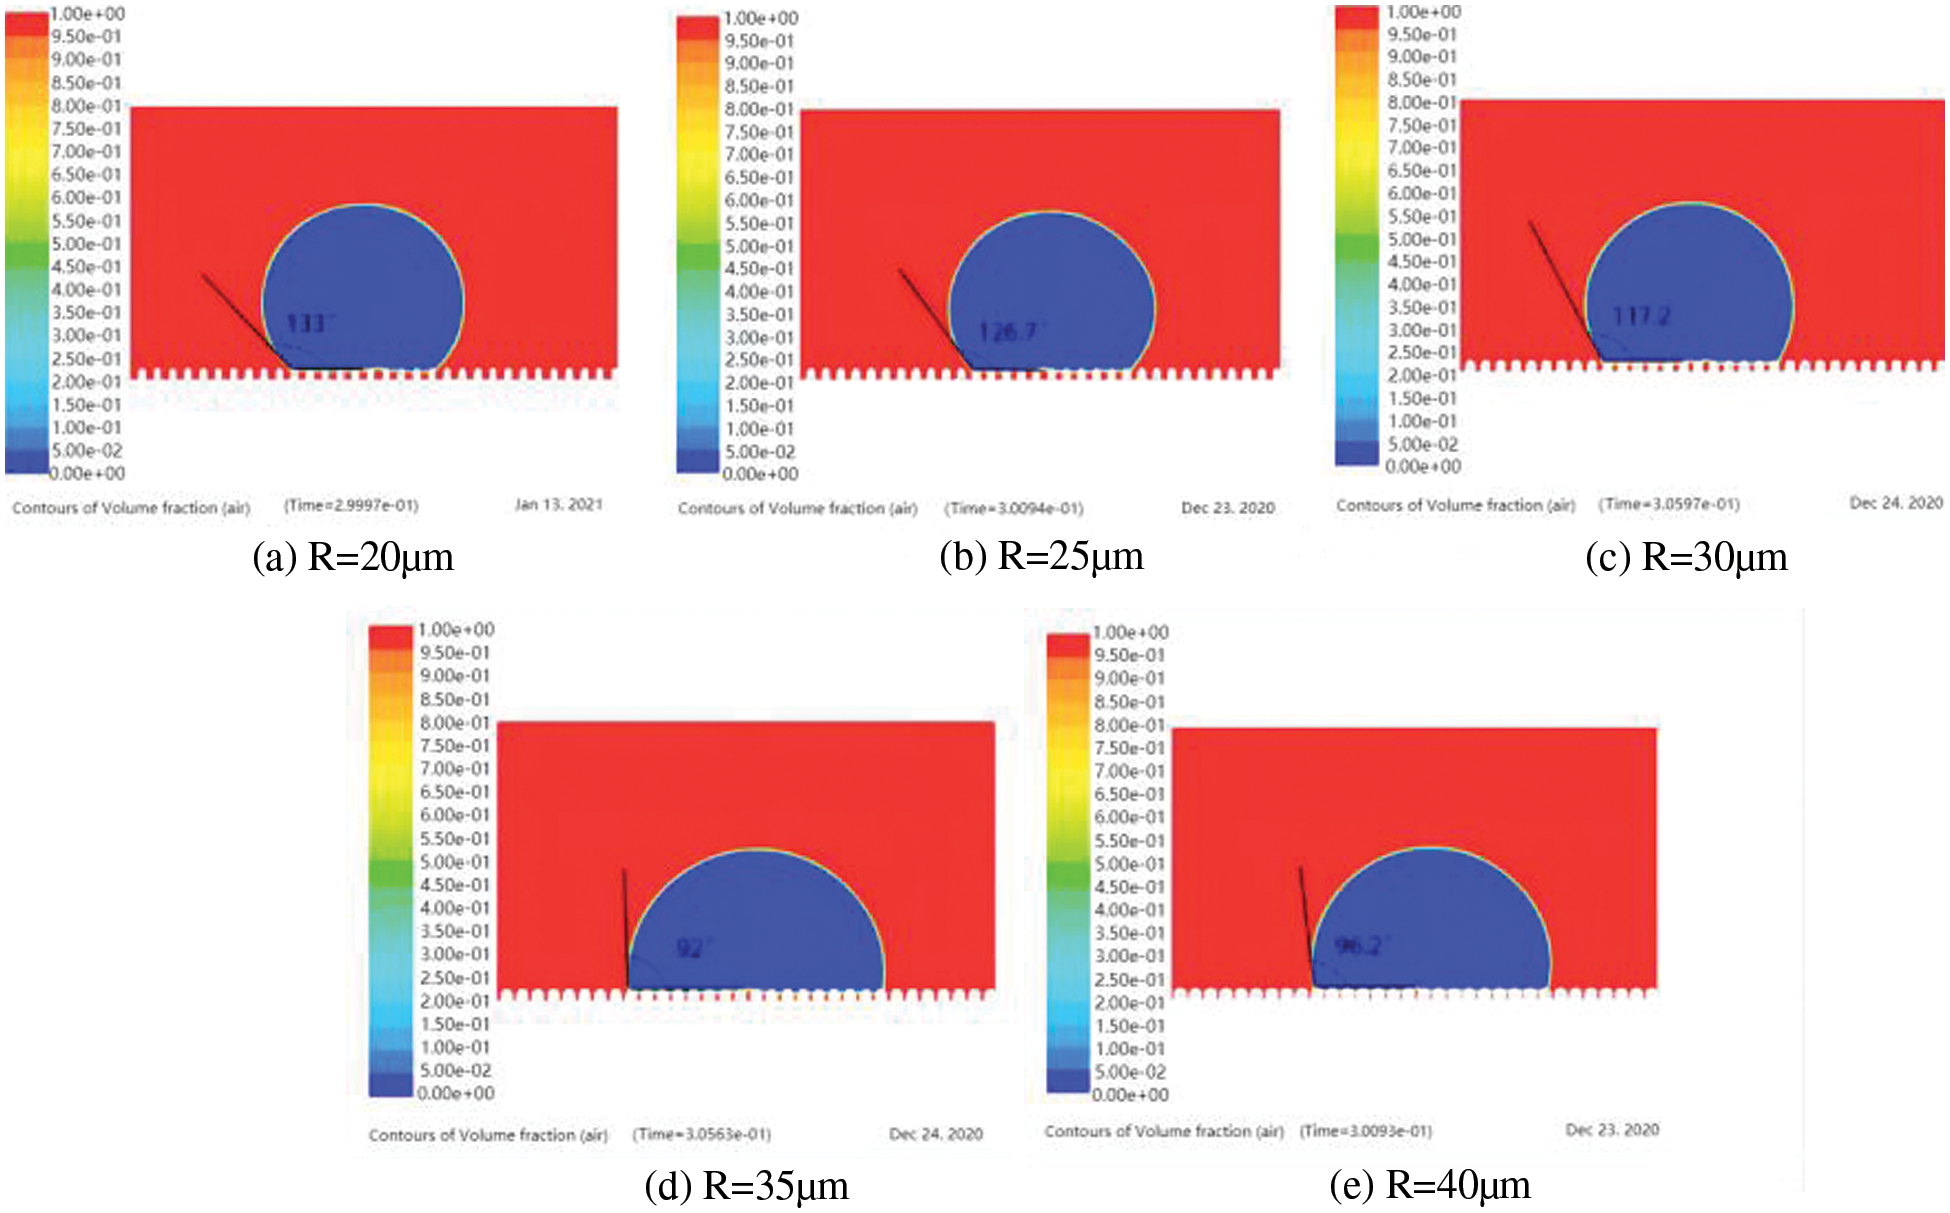
Figure 16: Apparent contact angles of droplets on mastoid microcolumn with different radius
The apparent contact angles of droplets stabilized on the mastoid microcolumn with different radius have been statistically compared under dynamic and quasi-static conditions, as shown in Fig. 17. It is obvious from the figure that when the droplet is stabilized, the apparent contact angle decreases with the increase of radius in both conditions. The increase of the radius causes a decrease in the cave volume of the microstructure grooves, thus reducing the hydrophobicity.
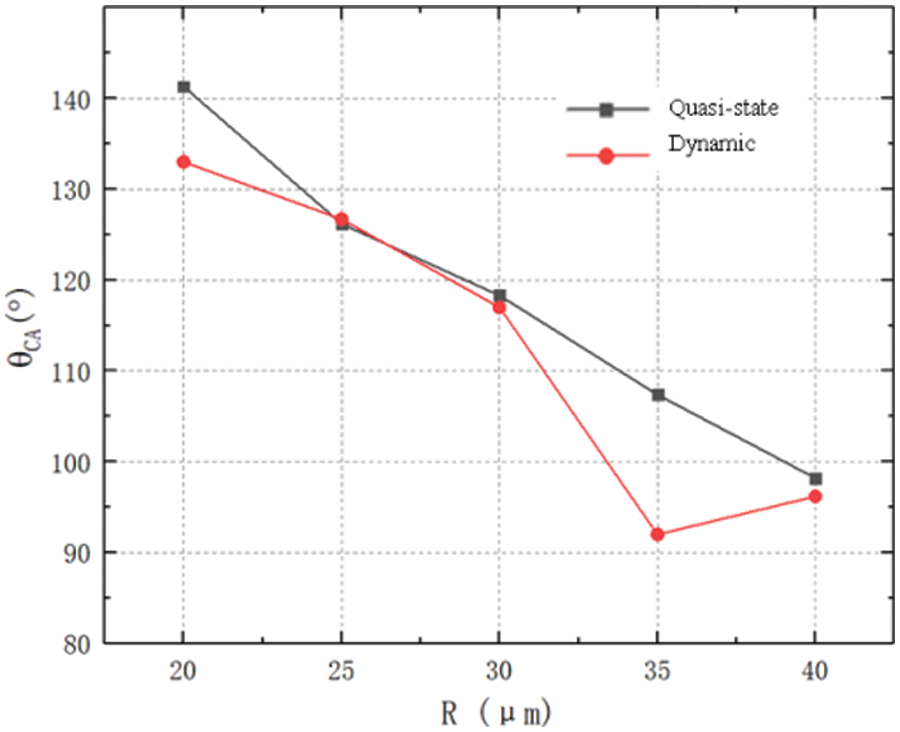
Figure 17: Comparison of contact angles of droplets with different radius under two conditions
To sum up, through the quasi-static change curves in Figs. 12, 14, and 17, we observe that the law of microstructural size effect on contact angle is consistent with the theoretical Eq. (7).
4.2 Effect of Mastoid Microcolumn Structure on the Cavitation Pressure Field
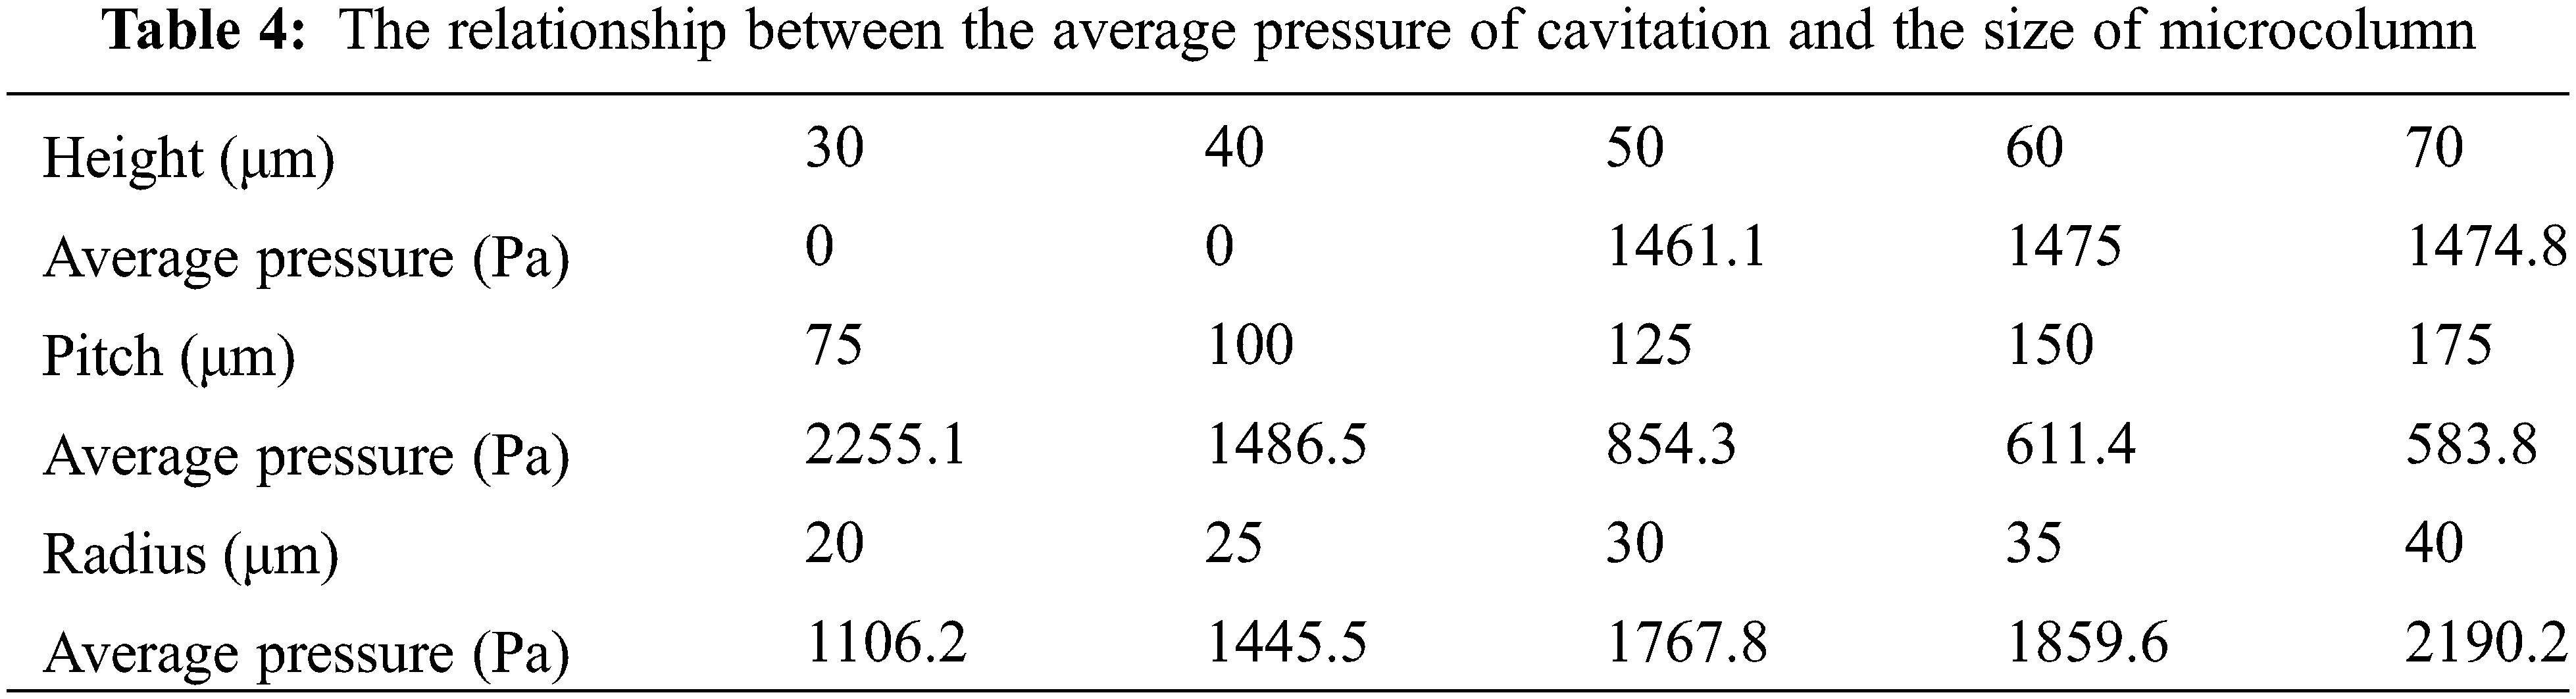
In this section, a simulation is used to monitor the cavitation pressure, explore the relationship between the pressure value in the cave and the microstructural parameters under dynamic conditions, and interpret the internal mechanism of the dynamic wettability of droplets. From the results of the simulation, the relationship between the average pressure of cavitation and the size of the micro-column is as presented in Table 4. It is observed that while the cavitation pressure is not affected by the height of the micro-column, it monotonically decreases with an increase of the micro-column distance, while monotonically increases with an increase of the radius.
To ensure that the monitored cavitation pressure can not only reflect the distribution of pressure but also reflect the influence of structure parameters on cavitation pressure, three caves are selected on one side of the microcolumn surface, as shown in Fig. 18. No. 1 represents the cave at the outermost edge of the droplet, No. 3 represents the cave at the center of the droplet, and No. 2 represents the cave between No. 1 and No. 3.
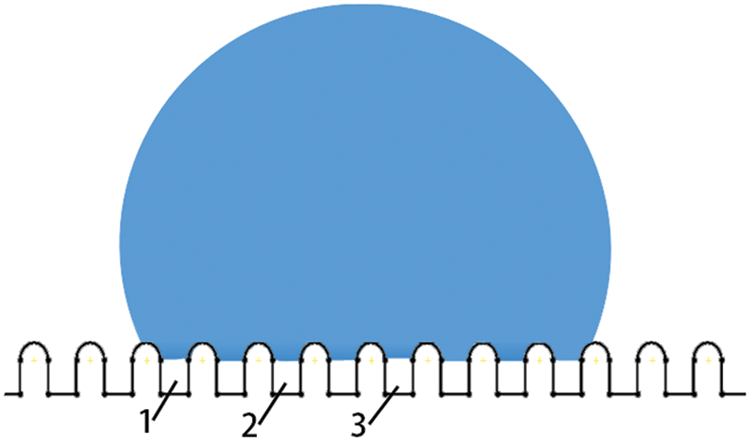
Figure 18: Schematic diagram of cavitation pressure monitoring points
4.2.1 Effect of Mastoid Microcolumn Height
As can be seen from the simulation results in the previous section, the column are so short in height (30, 40 μm) that no air cave can form. Pressure simulation monitoring has been conducted on the micro-structures (at heights of 50, 60 and 70 μm), as shown in Fig. 19. As can be seen from Fig. 19a, the pressure value at the center of the droplet is always greater than at the edge. This is consistent with our common-sense understanding. However, No. 2 and No. 1 at the edge do not completely conform to the law of the minimum cavitation pressure at the edge, which indicates that the pressure at the edge fluctuates. This is due to the larger kinetic energy and inertial force of droplets under dynamic conditions.
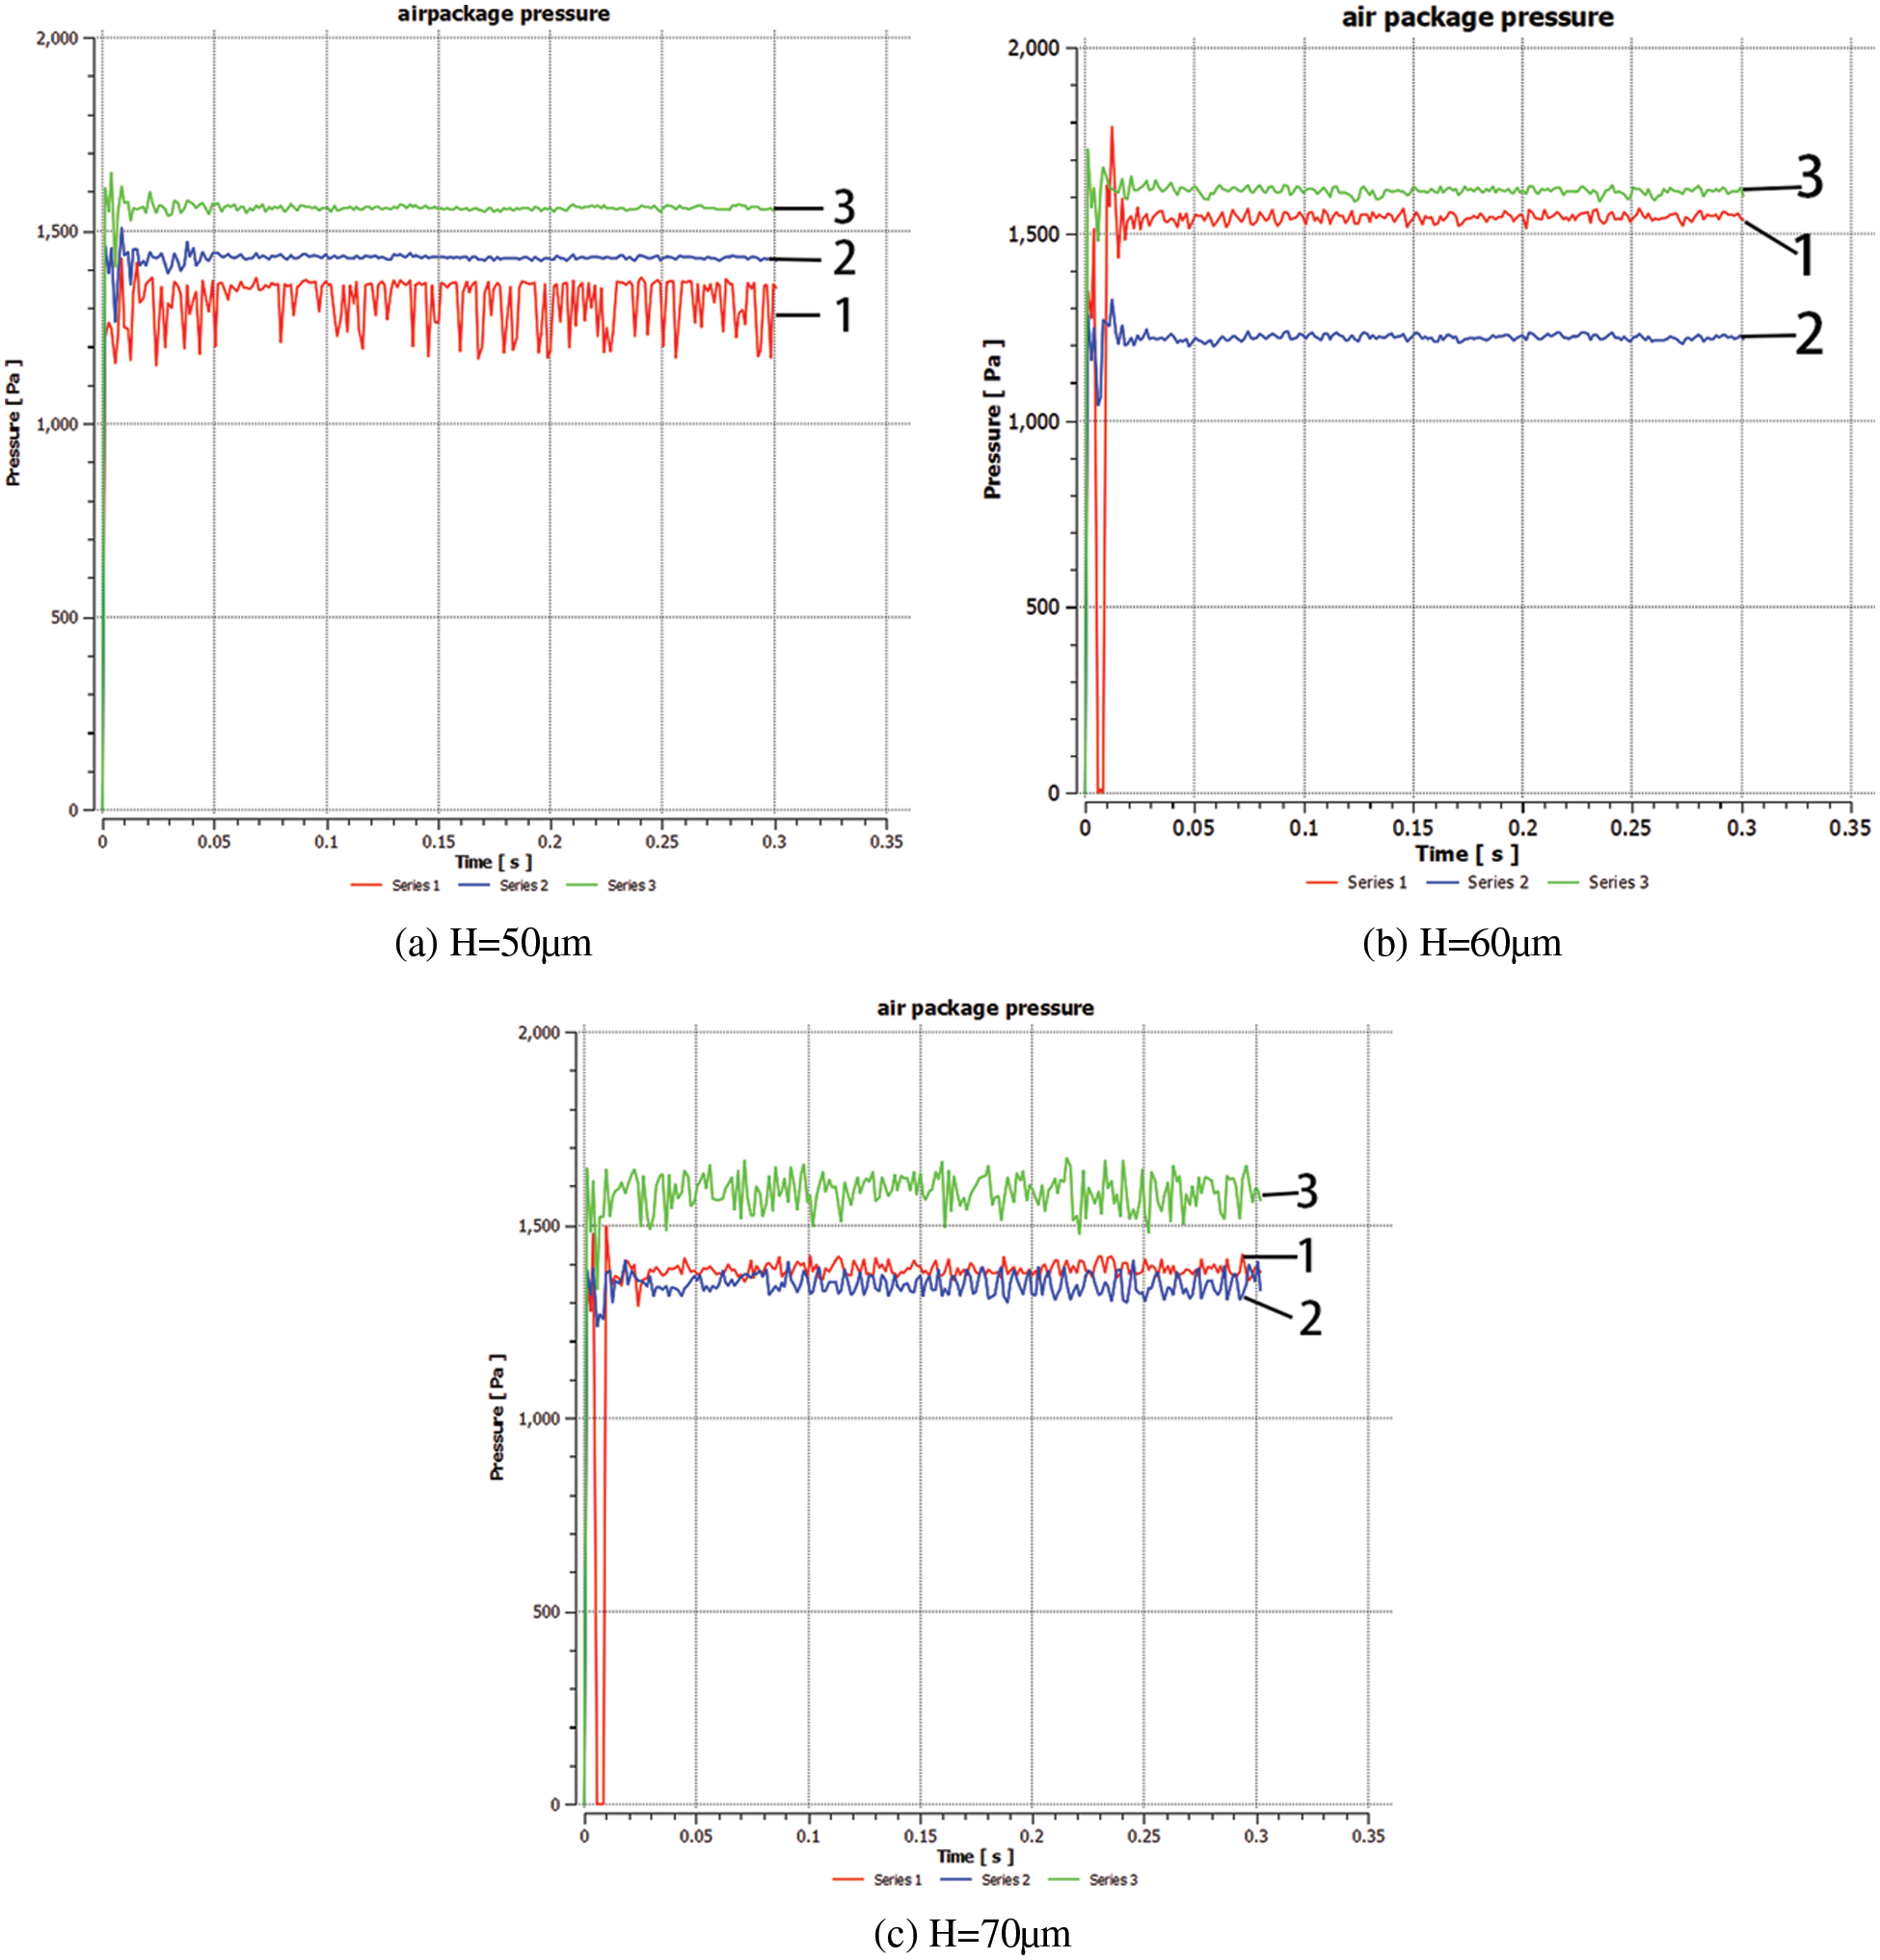
Figure 19: Cavitation pressure monitoring diagram with different heights under dynamic conditions
We believe that for the formation of cavitation pressure, the height of the mastoid micro column has a certain threshold. When the height is greater than this value, a cave is formed, and the height continues to increase, which has little effect on the cavitation pressure value. However, as the height further increases (Figs. 19b, 19c), the pressure value at the edge fluctuates.
4.2.2 Effect of Mastoid Micro Column Pitch
The effect of the mastoid microcolumn on the pressure field in the cave is studied under dynamic conditions, and the pressure changes of three caves are also simulated and monitored, as shown in Fig. 20.
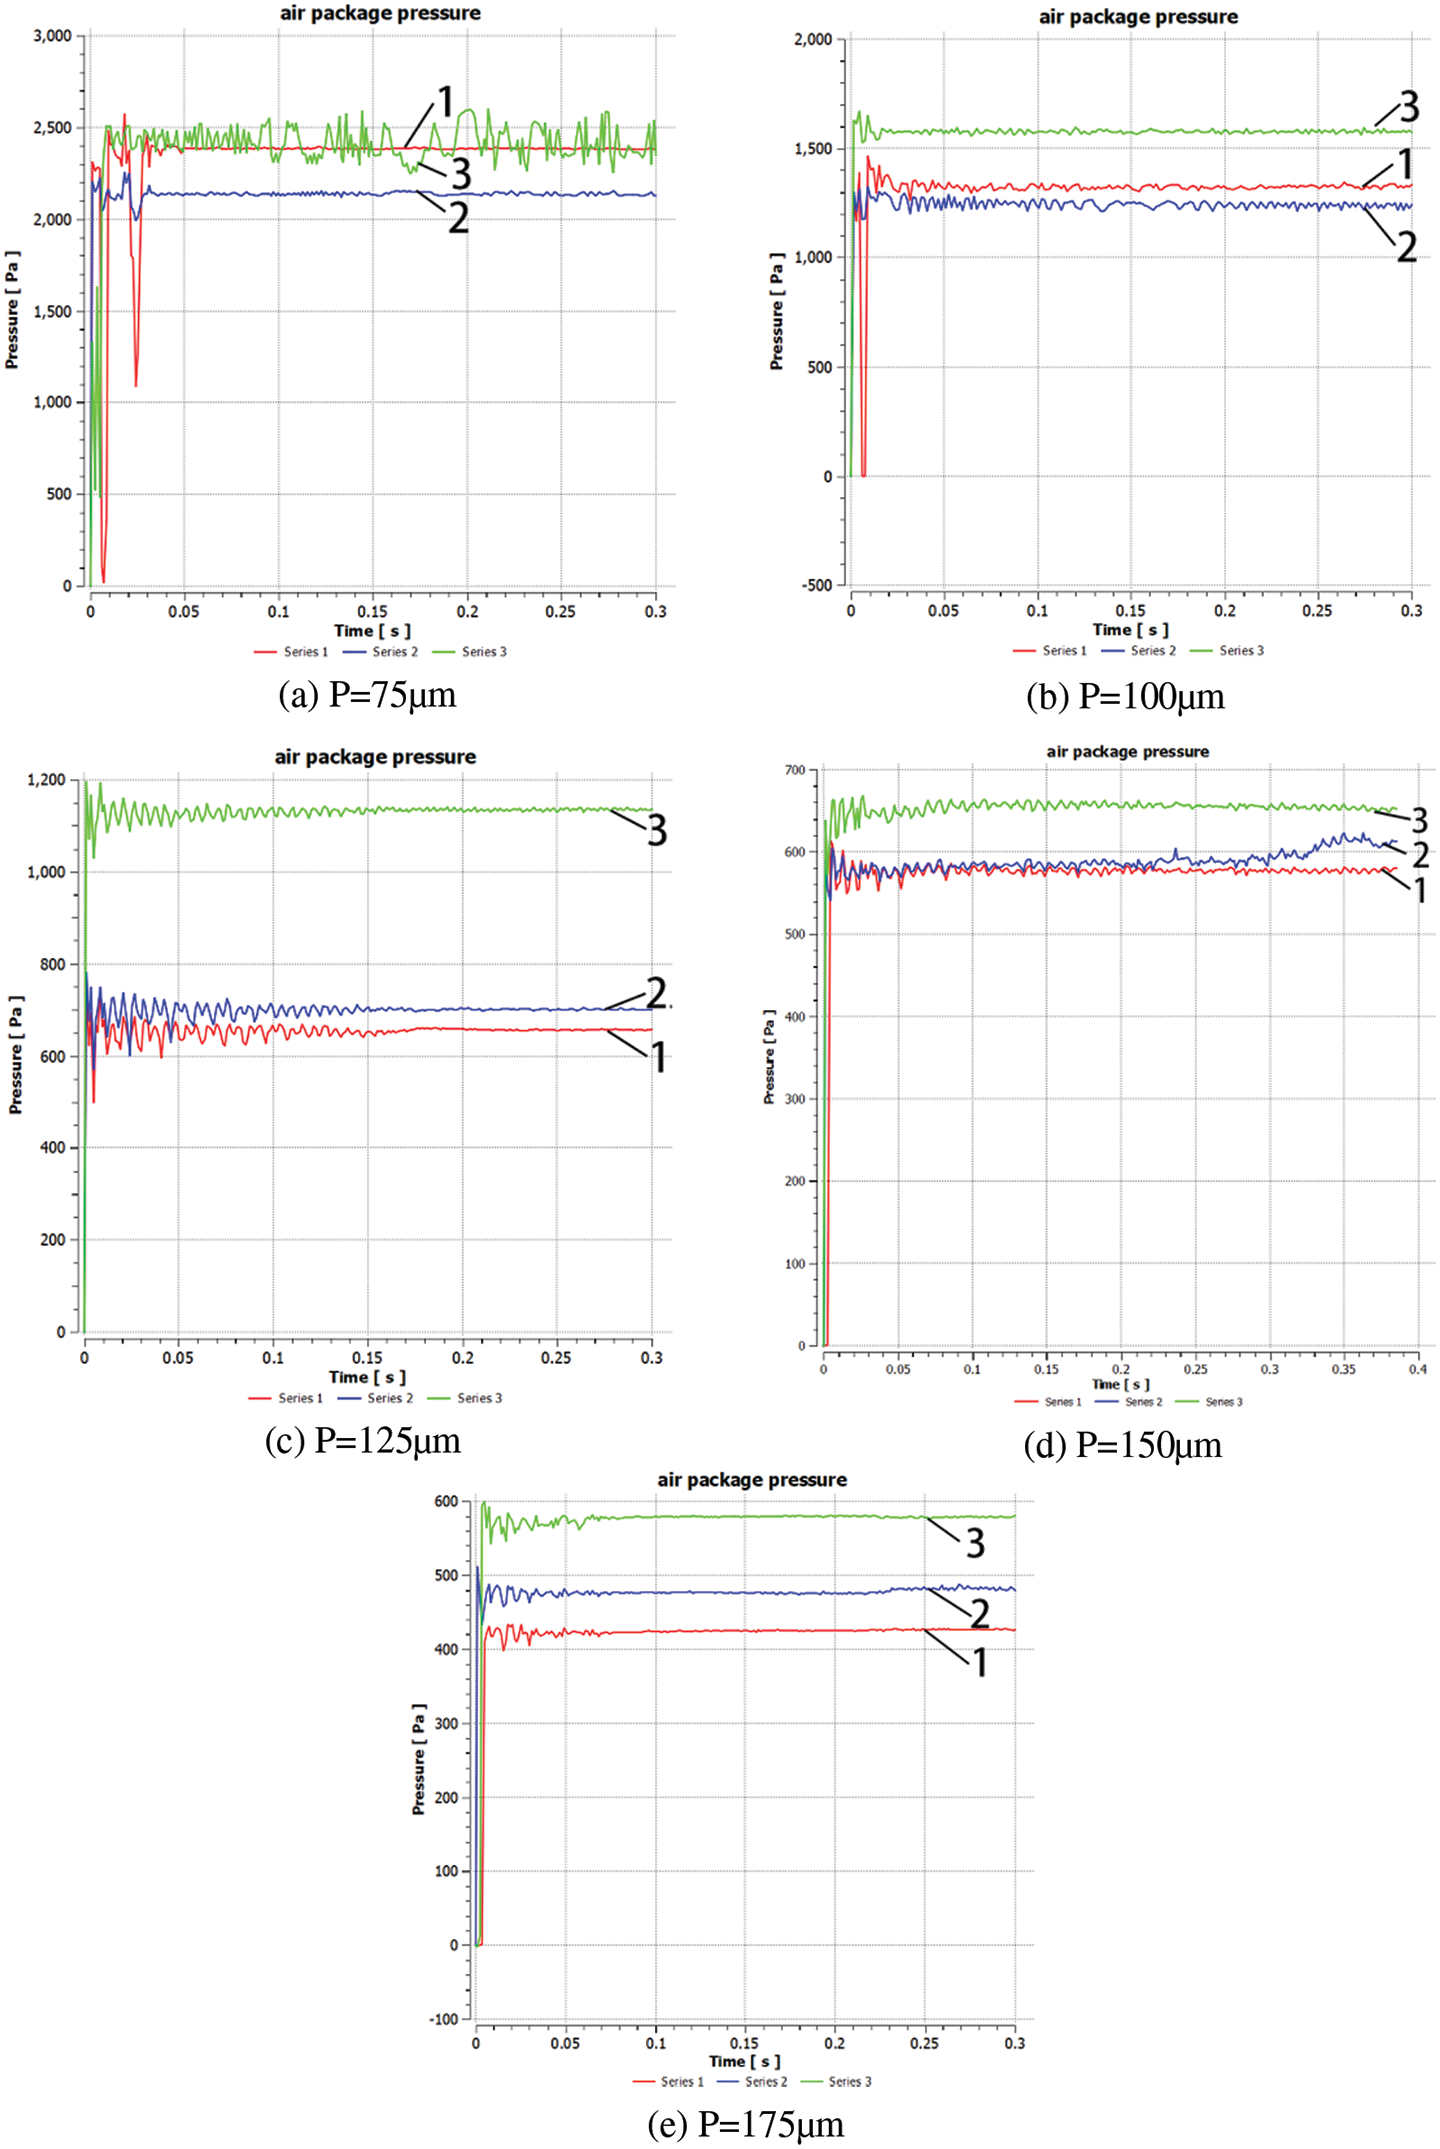
Figure 20: Cavitation pressure monitoring diagram with different pitch under dynamic conditions
It can be seen from the curve that in the initial stage (from 0 to 0.05 s) of the droplet contacting the surface of the microstructure, the cavitation pressure fluctuates greatly. From the pressure values of the three selected points, when the pitch is small (Figs. 20a, 20b), from point No. 1 to point No. 3, that is, from the edge position to the center position, the law of the pressure gradually increasing is broken again, indicating that the fluctuation at the edge is very violent. The cavitation pressure fluctuation gradually decreases with the increase of the distance between the mastoid microcolumn. This is mainly because the reduction of the spacing between the mastoid microcolumns will lead to an increase in the number of air caves formed per unit area, and more interference boundaries will be generated during the pressure balance process in the droplet, so the pressure fluctuation will be larger. It also takes longer for the pressure to reach equilibrium.
4.2.3 Effect of Mastoid Microcolumn Radius
The effect of radius of the mastoid microcolumn on cavitation pressure value under dynamic conditions is shown in Fig. 21. It can be concluded that the cavitation pressure value is highest at the center of the droplet on the mastoid microcolumn with different radii under dynamic conditions, but when the radius value is larger, the pressure at the edge (Figs. 21c–21e) fluctuates because the pressure from No. 3 to No. 1 is not gradually decreasing.
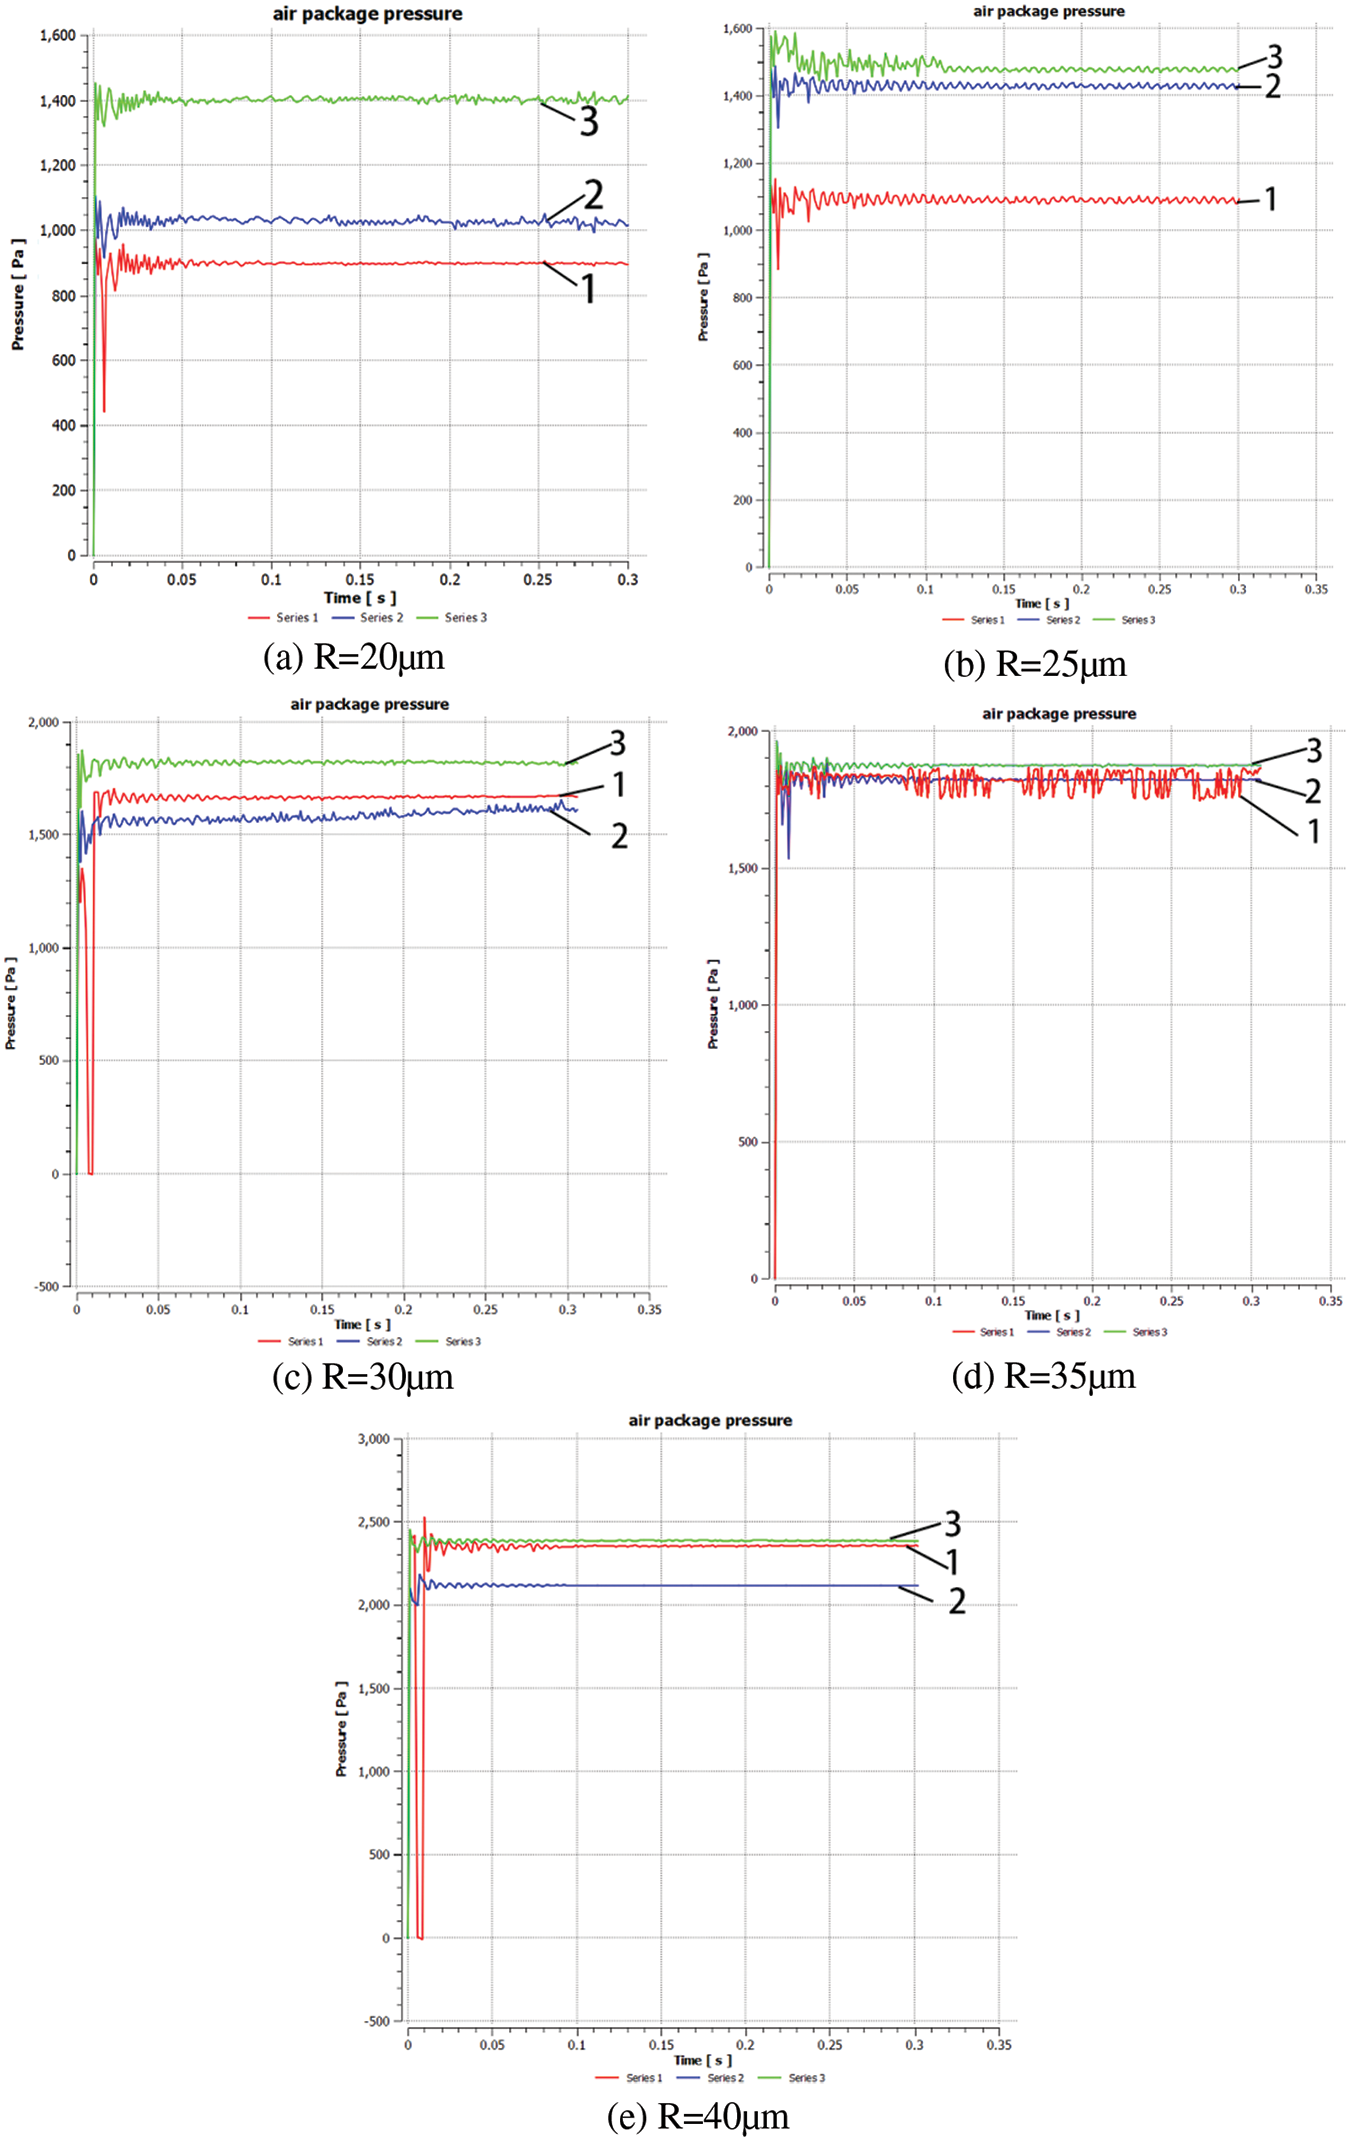
Figure 21: Cavitation pressure monitoring diagram with different radius under dynamic conditions
In this paper, the dynamic process of droplets on the mastoid microcolumn is simulated by using the method of numerical simulation. The dynamic process of droplets is analyzed, and the effect of the structural parameters of the mastoid microcolumn on the apparent contact angle and cavitation pressure value under dynamic conditions is studied in detail. The following conclusions are drawn:
(1) A biomimetic surface microstructure is proposed, and the theoretical formula for the hydrophilic contact angle of the microstructured surface is given.
(2) Consistent conclusions are drawn from both theoretical and numerical simulations, namely, that the static contact angle is independent of the height of the mastoid microcolumn, increases monotonically with the increase of the radius, and decreases monotonically with the increase of the pitch.
(3) The apparent contact angle under dynamic conditions is generally smaller than that under quasi-static conditions. Meanwhile, the contact angle increases with the increase of microcolumn height and pitch but decreases with the increase of microcolumn radius.
(4) For the formation of cavitation pressure, there is a certain threshold value for the height of the mastoid microcolumn. When the height value is greater than this value, the cave is formed and the height value continues to increase, but the influence on the cavitation pressure value is unchanged.
(5) The mean cavitation pressure of microcolumn structure decreases with the increase of microcolumn pitch but increases with the increase of microcolumn radius. Larger height values, smaller pitch values, and larger radius values will make it easier for the edge cavitation pressure to fluctuate.
Acknowledgement: The authors acknowledge funding from the China Scholarship Council (CSC) and Basic Scientific Research Projects of Liaoning Provincial Department of Education: ‘Design and manufacture of bionic antifogging surface of optical glass lens based on nanosecond laser’.
Funding Statement: The authors acknowledge funding from the China Scholarship Council (CSC) and Basic Scientific Research Projects of Liaoning Provincial Department of Education: ‘Design and manufacture of bionic antifogging surface of optical glass lens based on nanosecond laser’ (LJKMZ20220827). Y received the grant.
Availability of Data and Materials: The data that support the findings of this study are available upon reasonable request from the authors.
Conflicts of Interest: The authors declare that they have no conflicts of interest to report regarding the present study.
References
1. Mishinov, S. V., Stepanov, B. S., Velmuzhov, A. P., Shiryaev, V. S., Lashmanov, E. V. et al. (2022). Wettability of stainless steel with a Ge28Sb12Se60 glass melt and its contact adhesion strength. Journal of Non-Crystalline Solids, 578, 121351. DOI 10.1016/j.jnoncrysol.2021.121351. [Google Scholar] [CrossRef]
2. Huang, X., Kocaefe, D., Boluk, Y., Kocaefe, Y., Pichette, A. (2012). Effect of surface preparation on the wettability of heat-treated jack pine wood surface by different liquids. European Journal of Wood and Wood Products, 70(5), 711–717. DOI 10.1007/s00107-012-0605-z. [Google Scholar] [CrossRef]
3. Anjum, A. S., Sun, K. C., Ali, M., Riaz, R., Jeong, S. H. (2020). Fabrication of coral-reef structured nano silica for self-cleaning and super-hydrophobic textile applications. Chemical Engineering Journal, 401, 125859. DOI 10.1016/j.cej.2020.125859. [Google Scholar] [CrossRef]
4. Gao, S., Liu, H. (2010). Capillary mechanics. Beijing, China: Science Press. [Google Scholar]
5. Rudyak, V. Y., Tretiakov, D. S. (2020). Measuring the diffusion coefficient of single-wall carbon nanotubes in liquids. Journal of Physics: Conference Series, 1677(1), 012174. DOI 10.1088/1742-6596/1677/1/012174. [Google Scholar] [CrossRef]
6. Moghtadernejad, S. (2014). Dynamics of droplet shedding and coalescence under the effect of shear flow (Ph.D. Thesis). Concordia University, Canada. [Google Scholar]
7. Gunjal, P. R., Ranade, V. V., Chaudhari, R. V. (2005). Dynamics of drop impact on solid surface: Experiments and VOF simulations. AIChE Journal, 51(1), 59–78. DOI 10.1002/(ISSN)1547-5905. [Google Scholar] [CrossRef]
8. Malgarinos, I., Nikolopoulos, N., Marengo, M., Antonini, C., Gavaises, M. et al. (2014). VOF simulations of the contact angle dynamics during the drop spreading: Standard models and a new wetting force model. Advances in Colloid and Interface Science, 212, 1–20. DOI 10.1016/j.cis.2014.07.004. [Google Scholar] [CrossRef]
9. Quan, Y., Zhang, L. (2014). Numerical and analytical study of the impinging and bouncing phenomena of droplets on superhydrophobic surfaces with microtextured structures. Langmuir, 30(39), 11640–11649. DOI 10.1021/la502836p. [Google Scholar] [CrossRef]
10. Li, D. (2015). Research on droplet’s spreading and oscillating on surface (Master Thesis). Dalian University of Technology, China. [Google Scholar]
11. Zhang, C. (2017). The research on dynamic characteristics of droplet impacting a spherical surface with different wettability (Master Thesis). Dalian University of Technology, China. [Google Scholar]
12. Cai, Y., Luo, X., Tian, Y., Md, R., Hasan, M. et al. (2019). Dynamic behaviours of water droplets impacting on laser ablated surfaces. Colloids and Surfaces A: Physicochemical and Engineering Aspects, 580. DOI 10.1016/j.colsurfa.2019.123743. [Google Scholar] [CrossRef]
13. Russo, A., Icardi, M., Elsharkawy, M., Ceglia, D., Asinari, P. et al. (2020). Numerical simulation of droplet impact on wettability-patterned surfaces. Physical Review Fluids, 5(7), 074002. DOI 10.1103/PhysRevFluids.5.074002. [Google Scholar] [CrossRef]
14. Xu, X. (2017). Lattice Boltzmann simulation of droplet impact on non-ideal surfaces (Master Thesis). North China Electric Power University, China. [Google Scholar]
15. Raman, K. A. (2018). Dynamics of simultaneously impinging drops on a dry surface: Role of inhomogeneous wettability and impact shape. Journal of Colloid and Interface Science, 516, 232–247. DOI 10.1016/j.jcis.2018.01.063. [Google Scholar] [CrossRef]
16. Fang, K., Shan, Y., Yuan, J. (2019). LBM numerical simulation of droplet spreading and evaporation on surfaces with different wettability. Advances in New and Renewable Energy, 7(4), 346–353. [Google Scholar]
17. Nursultan, Z., Bagdagul, K., Ernesto, M., Rojas-Solórzano, L. R. (2021). Lattice Boltzmann modeling of a gravity-driven sliding droplet under a dynamic wetting regime. European Journal of Mechanics-B/Fluids, 86, 198–209. DOI 10.1016/j.euromechflu.2020.12.008. [Google Scholar] [CrossRef]
18. Qiang, W. (2018). Molecular dynamics simulation on wetting characteristics of nanodroplets (Master Thesis). Dalian University of Technology, China. [Google Scholar]
19. Chen, L., Wang, S., Xiang, X., Tao, W. (2020). Mechanism of surface nanostructure changing wettability: A molecular dynamics simulation. Computational Materials Science, 71, 109223. DOI 10.1016/j.commatsci.2019.109223. [Google Scholar] [CrossRef]
20. Yu, Y., Xu, X., Liu, J., Liu, Y., Cai, W. et al. (2021). The study of water wettability on solid surfaces by molecular dynamics simulation. Surface Science, 714, 121916. DOI 10.1016/j.susc.2021.121916. [Google Scholar] [CrossRef]
21. Yin, X., Hu, C., Bai, M., Lv, J. (2019). Molecular dynamic simulation of rapid boiling of nanofluids on different wetting surfaces with depositional nanoparticles. International Journal of Multiphase Flow, 115, 9–18. DOI 10.1016/j.ijmultiphaseflow.2019.03.022. [Google Scholar] [CrossRef]
22. Jiang, C., Xiong, Z., Li, K., Zhang, J., Liu, Z. et al. (2020). Molecular dynamics simulation study on the wetting behavior of liquid iron and graphite. Journal of Molecular Liquids, 311, 113350. DOI 10.1016/j.molliq.2020.113350. [Google Scholar] [CrossRef]
23. Guo, W., Ma, K., Wang, Q., Xue, H. (2019). The wetting of Pb droplet on the solid Al surface can be promoted by ultrasonic vibration-molecular dynamics simulation. Materials Letters, 264, 127118. DOI 10.1016/j.matlet.2019.127118. [Google Scholar] [CrossRef]
24. Zhang, J., Borg, M. K., Reese, J. M. (2017). Multiscale simulation of dynamic wetting. International Journal of Heat and Mass Transfer, 115, 886–896. DOI 10.1016/j.ijheatmasstransfer.2017.07.034. [Google Scholar] [CrossRef]
25. Barthlott, W., Neinhuis, C. (1997). Purity of the sacred lotus, or escape from contamination in biological surfaces. Planta, 202(1), 1–8. DOI 10.1007/s004250050096. [Google Scholar] [CrossRef]
26. Dawood, M. K., Zheng, H., Liew, T. H., Leong, K. C., Foo, Y. L. et al. (2011). Mimicking both petal and lotus effects on a single silicon substrate by tuning the wettability of nanostructured surfaces. Langmuir, 27(7), 4126–4133. DOI 10.1021/la1050783. [Google Scholar] [CrossRef]
27. Cassie, A. B. D., Baxter, S. (1944). Wettability of porous surfaces. Transactions of the Faraday Society, 40, 546–551. DOI 10.1039/tf9444000546. [Google Scholar] [CrossRef]
28. Hirt, C. W., Nichols, B. D. (1981). Volume of fluid (VOF) method for the dynamics of free boundaries. Journal of Computational Physics, 39(1), 201–225. DOI 10.1016/0021-9991(81)90145-5. [Google Scholar] [CrossRef]
29. Maxwell, T. T. (1977). Numerical modelling of free surface flows (Ph.D. Thesis). University of London, UK. [Google Scholar]
30. Ruan, M. (2013). Experimental and theoretical investigations on the Al-based superhydrophobic materials and their anti-icing activity (Ph.D. Thesis). Wuhan University, China. [Google Scholar]
31. Wang, Z. (2020). Numerical study on drag reduction law of microstructure hydrophobic surface (Master Thesis). Harbin Engineering University, China. [Google Scholar]
32. Meng, P. (2013). Simulation analysis and experimental study of hydrodynamic drag reduction in hydrophobic microgrooves (Master Thesis). Harbin University of Technology, China. [Google Scholar]
Cite This Article
 Copyright © 2023 The Author(s). Published by Tech Science Press.
This work is licensed under a Creative Commons Attribution 4.0 International License , which permits unrestricted use, distribution, and reproduction in any medium, provided the original work is properly cited.
 Downloads
 Citation Tools