
 Submit a Paper
 Propose a Special lssue
 Open Access
ARTICLE

Numerical Analysis of the Thermal Properties of Ecological Materials Based on Plaster and Clay
1 Mechanics, Engineering and Innovation Laboratory (LM2I), Higher School of Electricity and Mechanics (ENSEM), Hassan II University, Casablanca, Morocco
2 Civil Engineering and Environment Laboratory (LGCE), Higher School of Technology of Sale (EST-Sale), Mohamed V University, Rabat, Morocco
3 Energy, Materials and Sustainable Development (EMDD), Water, Natural Resources, Environment and Sustainable Development Center (CERNE2D), Higher School of Technology of Sale (EST-Sale), Mohamed V University, Rabat, Morocco
* Corresponding Author: A. Lkouen. Email:
Fluid Dynamics & Materials Processing 2023, 19(8), 2013-2026. https://doi.org/10.32604/fdmp.2023.026929
Received 03 October 2022; Accepted 10 January 2023; Issue published 04 April 2023
 View Full Text
 Download PDF
Abstract
Most of the energy savings in the building sector come from the choice of the materials used and their microphysical properties. In the present study, through numerical simulations a link is established between the thermal performance of composite materials and their microstructures. First, a two-phase 3D composite structure is modeled, then the RSA (Random Sequential Addition) algorithm and a finite element method (FE) are applied to evaluate the effective thermal conductivity of these composites in the steady-state. In particular, building composites based on gypsum and clay, consolidated with peanut shell additives and/or cork are considered. The numerically determined thermal conductivities are compared with values experimentally calculated using the typical tools of modern metrology, and with available analytical models. The calculated thermal conductivities of the clay-based materials are 0.453 and 0.301 W.m−1.K−1 with peanut shells and cork, respectively. Those of the gypsum-based materials are 0.245 and 0.165 W.m−1.K−1 with peanut shells and cork, respectively. It is shown that, in addition to its dependence on the volume fraction of inclusions, the effective thermal conductivity is also influenced by other parameters such as the shape of inclusions and their distribution. The relative deviations, on average, do not exceed 6.8%, which provides evidence for the reliability of the used approach for random heterogeneous materials.Graphic Abstract
Keywords
During the last decades, a considerable increase in energy consumption has been noticed, particularly in the field of building due to rapid economic development and population growth. A large number of scientists have conducted research on methods and techniques that can reduce the energy consumption of buildings. In this context, the improvement of thermal comfort is ensured especially for the inhabitants of dry climate regions by increasing the quality of thermal insulation of building materials historically used in these regions. Research [1–9] has been carried out to improve the thermal behavior of clay or plaster by combining them with additives of animal or vegetable origin. These additives are generally dispersed and randomly oriented in the matrix. Other studies have shown that heat transfer processes in metal foam heat exchangers are controlled by microstructural properties, such as pore size, density and porosity [10]. In our study of heterogeneous materials, we adopt homogenization techniques that consider information on the microstructures of composite materials and simulate their effective properties based on the behavior law at the scale of the representative elementary volume [11,12]. In the context of this technique, the representative elementary volume (RVE) essentially refers to a volume of material of sufficiently large size to predict macroscopic effective properties of the material from the local properties of each of the constituents with a desired precision, but this size remains sufficiently small in terms of computational cost [13].
The steps of this technique are shown in Fig. 1.
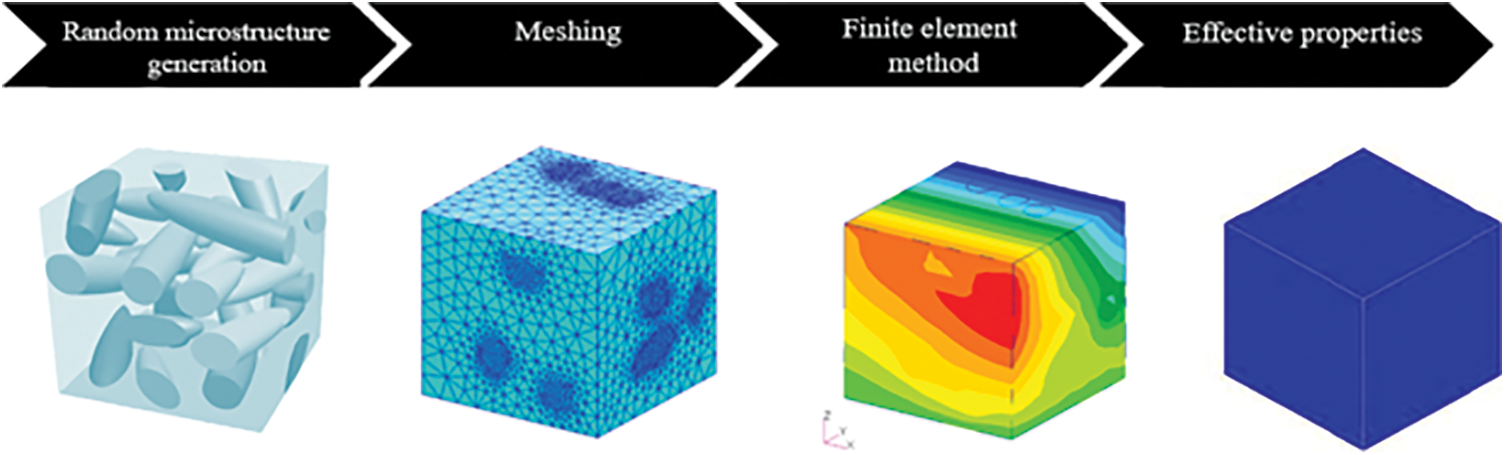
Figure 1: Numerical homogenization process [12]
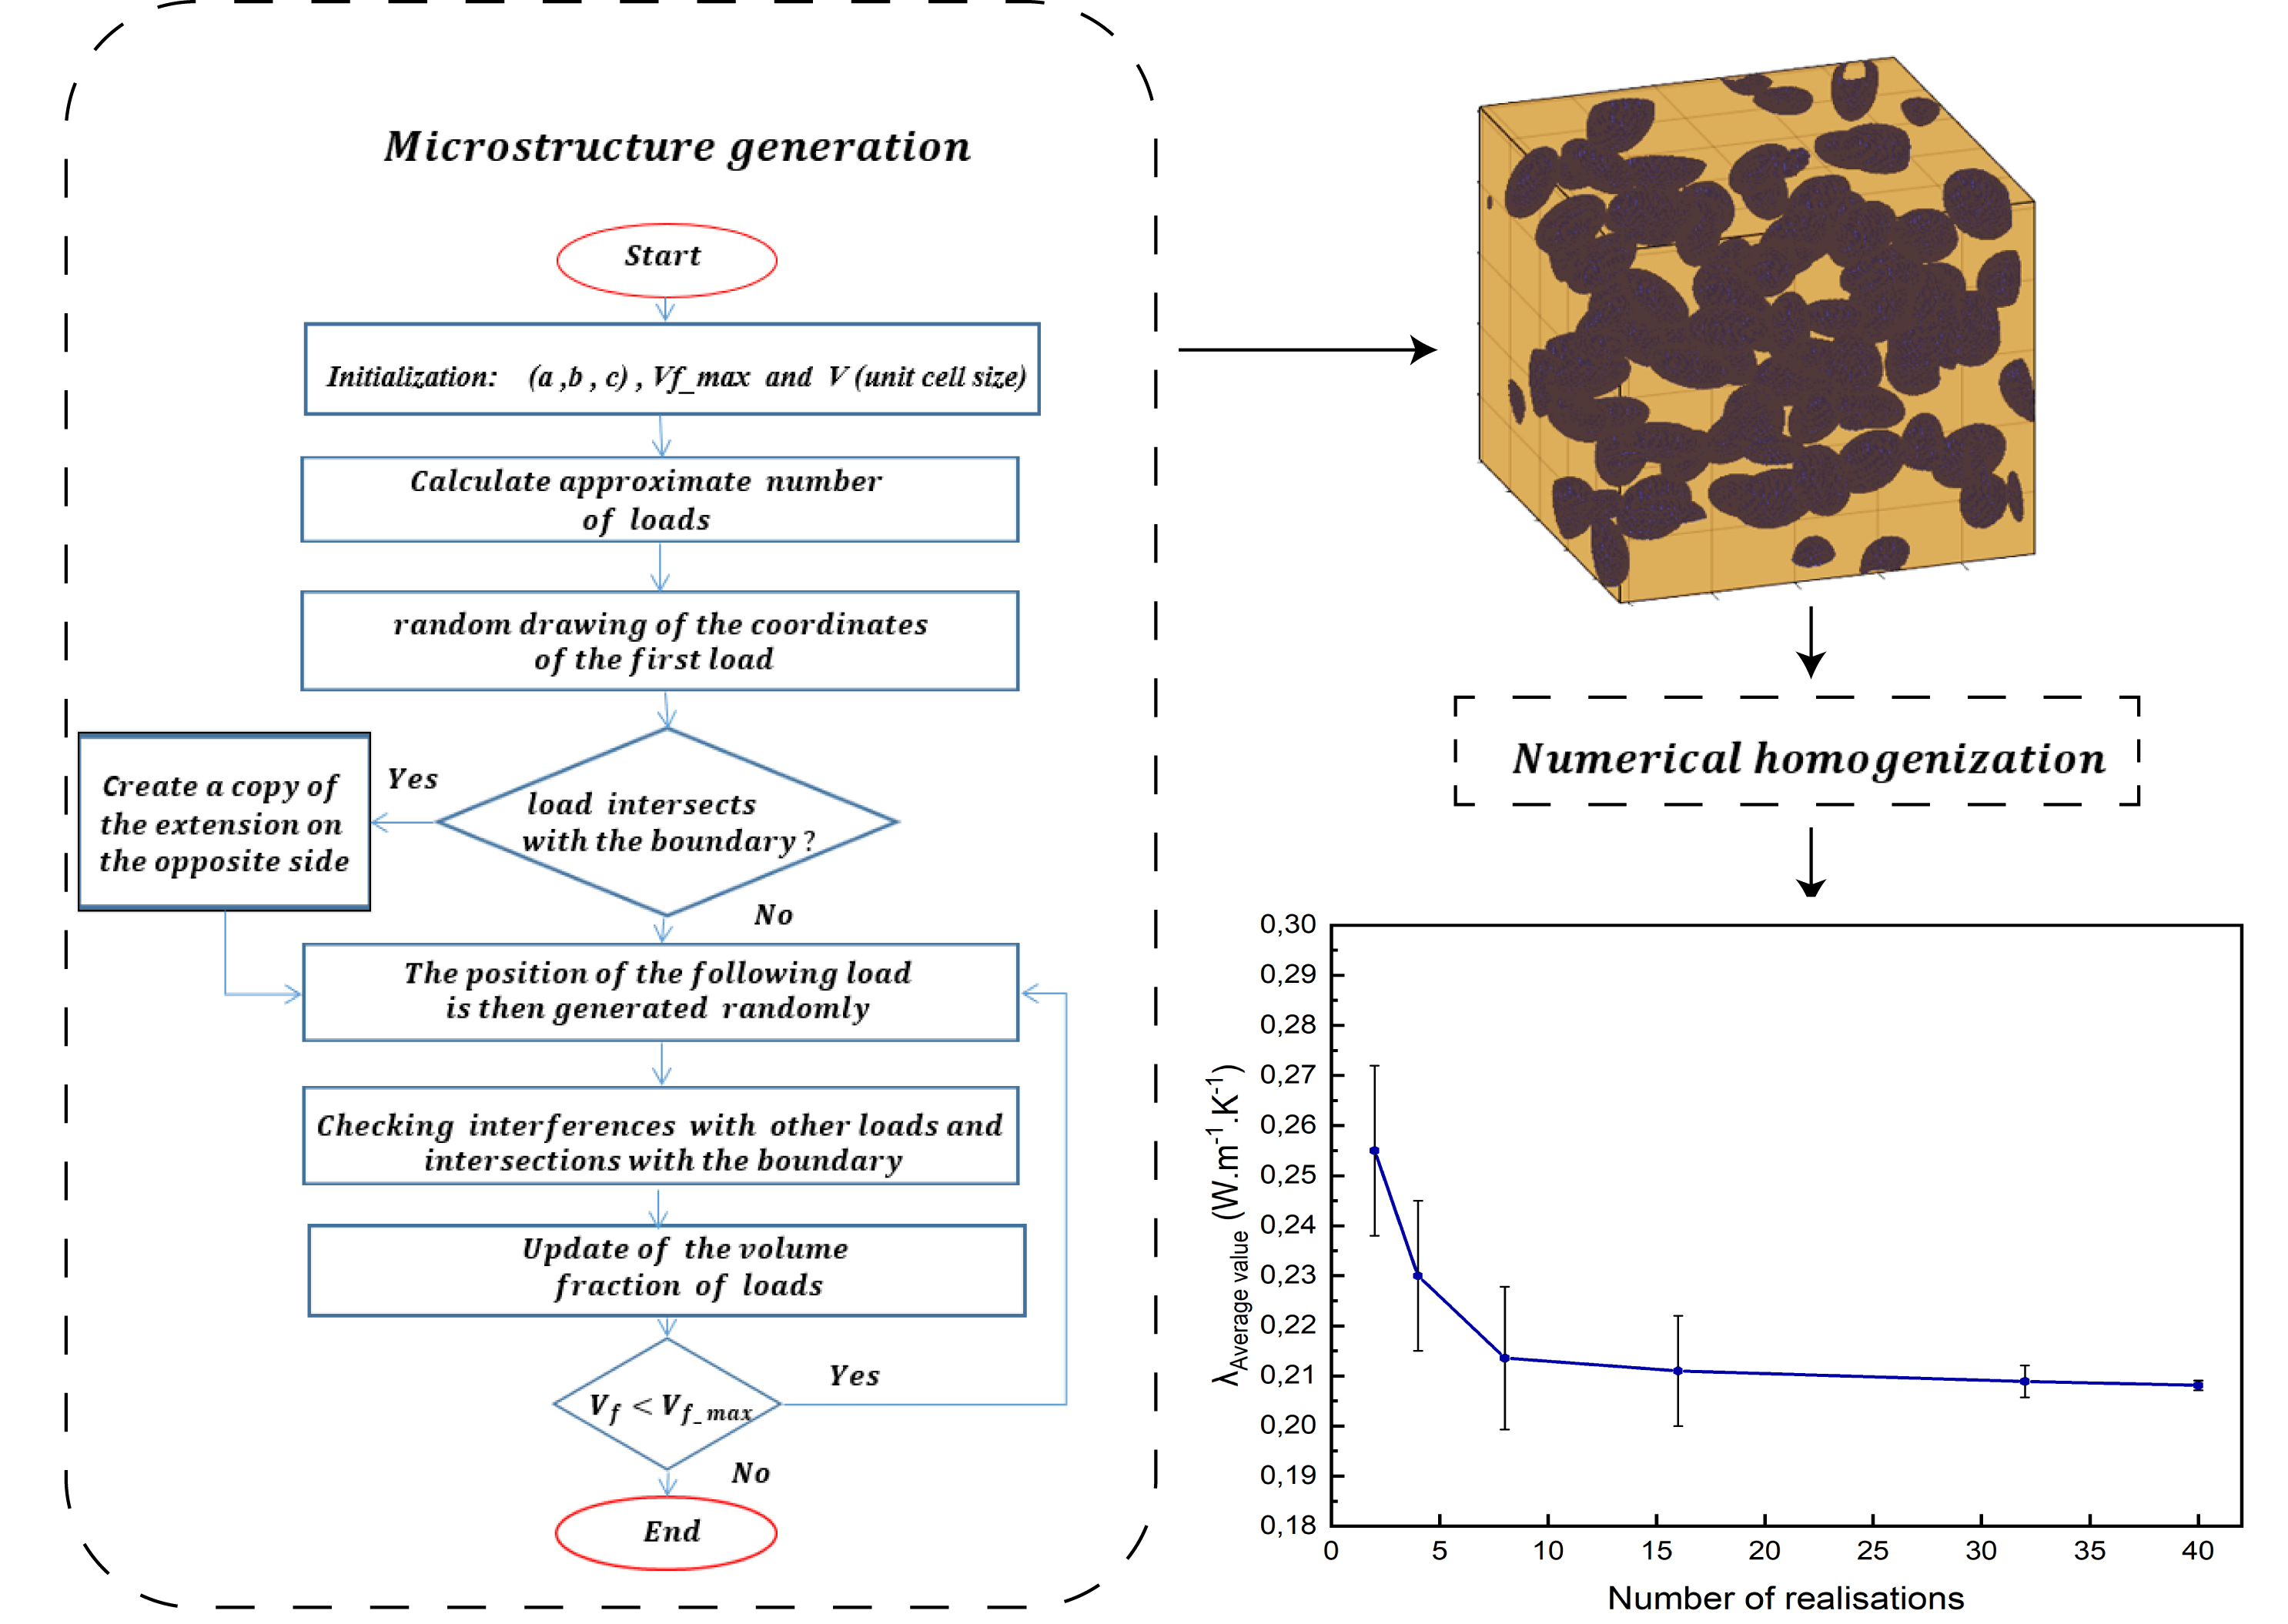
The first step is to generate a 3D microstructure with randomly dispersed and oriented additives in the matrix, then boundary conditions are applied and the volume response is calculated using numerical techniques such as finite elements (FE) [14–16] .Wang et al. [16] developed a random generation-growth method and used the Lattice Boltzmann method to model and predict the effective thermal conductivity of random open-cell porous foams. Lahrichi et al. [17] used the Digimat and Ansys software to generate and simulate the thermal conductivity of wool fiber stabilized clay (L). The composite building materials of interest in this study are gypsum or clay-based often used in some constructions such as a wall or interior ceiling plaster. We propose a random generation of the structures of these materials using a Random Sequential Adsorption algorithm (RSA) developed under MATLAB, for which the inclusions are assimilated to ellipsoids with different aspect ratios. The statistical average of the results obtained by the finite element method allows for evaluation of the thermal conductivity of the studied building materials.
2 Random Microstructure Generation Method
The composite material studied is represented by a geometry of granular structure in which the distribution requires a probabilistic approach. Ellipsoidal particles are created with a free choice of the orthogonal distances of the ellipsoid (a, b, c), then the coordinates of their center and the Euler angles (Ψ, θ, φ), which define the rotation of the ellipse, are generated randomly in a cubic matrix of volume V = L3, using RSA developed under MATLAB. To ensure non-overlapping of inclusions, the distance d between the centers of the ellipsoids must be greater than the largest of the orthogonal distances (a, b, c), while the maximum of this distance is related to the predefined volume fraction (Fig. 2a).
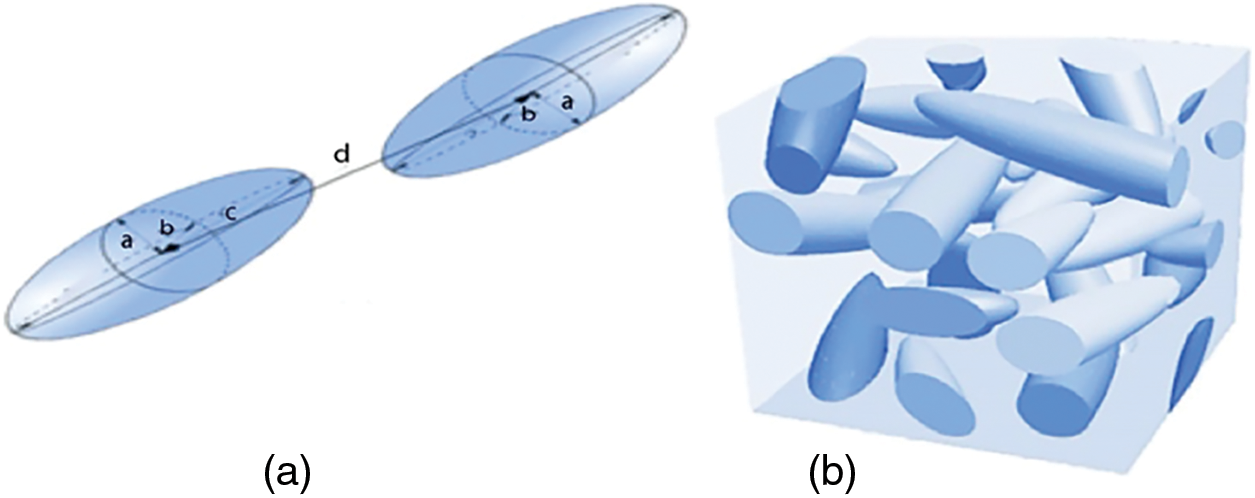
Figure 2: (a) Shape parameters of ellipsoidal particle and no overlap condition, (b) Periodicity of the 3D microstructure
The particles are randomly introduced one after the other until the desired volume fraction is obtained, while checking the following conditions:
– If a new particle overlaps previously placed particle(s), then this attempt is rejected. Otherwise, the placement is accepted. To ensure non-overlapping of inclusions, the distance d between the centers of the ellipsoids must be greater than the largest of the orthogonal distances (a, b, c), while the maximum of this distance is related to the predefined volume fraction (Fig. 2a).
– If the particle intersects a face of the matrix it will be extended by the opposite face to ensure the periodicity of the macroscopic material (Fig. 2b).
– If, after a certain number of attempts, a new particle is not accepted, the algorithm stops the program.
This RSA method is widely used to numerically study physical, chemical and biological phenomena, and was it is introduced by Feder [18]. However, during the generation of a structure, the more the number of inserted inclusions increases, the more it becomes difficult to find free space to introduce new particles. According to Feder the volume fraction limit is about 38% for spherical inclusions. Currently there are attempts and proposals for variants of this method to increase the volume fraction limit. Fig. 3 shows two examples of cubic unit cells with randomly dispersed inclusions at different volume fractions: Structure (S1) (Fig. 3a) and structure (S2) (Fig. 3b) respectively have 5% and 20% volume fraction additives. Many geometric objects can be obtained from an ellipsoid by simple change of its aspect ratio. In this study, the aspect ratio 4:2:3 is suitable for modeling our inclusions.
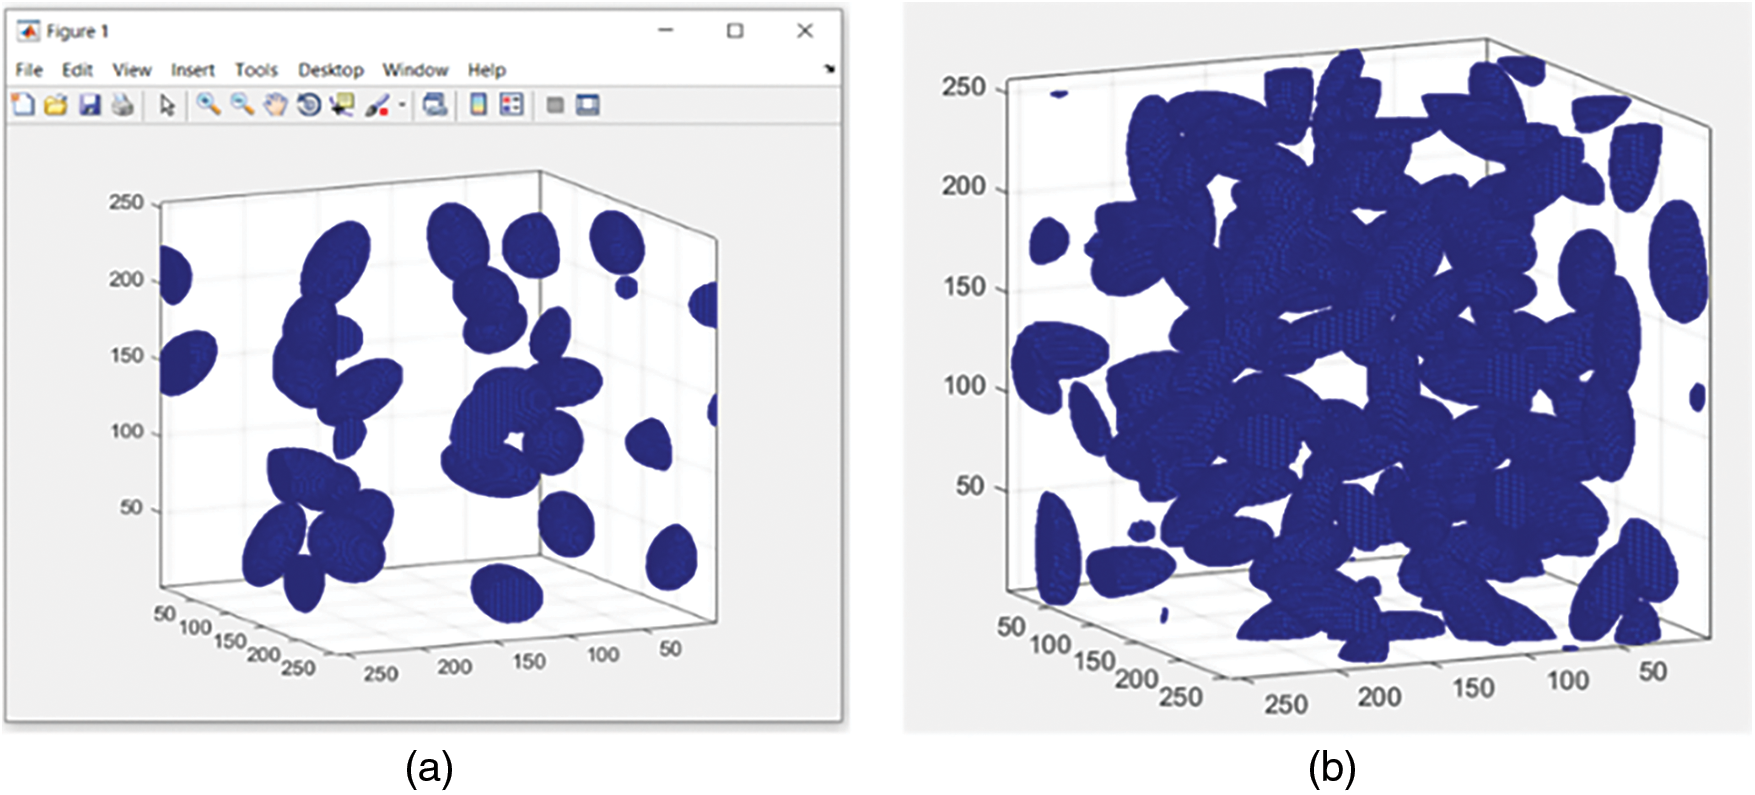
Figure 3: Structures models generated by RSA algorithm: (a) Structure (S1) with a volume fraction of 5%, Number of particles: 23. (b) Structure (S2) with a volume fraction of 20%, Number of particles: 90
3 Generation of the Microstructure of a Plaster-Based Composite
3.1 Components of the Studied Composite Material Studied
The studied composite material is a plaster matrix reinforced with peanut shells. Plaster or gypsum hemihydrate is considered a building material generally used in ceilings or can be used as an internal layer for walls [19]. It is composed of calcium sulfate that hardens and solidifies when mixed with water [20]. The inclusions in the composite material are peanut shells, which constitute an abundant, ecological and unexploited waste. These additives are modeled by ellipsoids with an aspect ratio of 4:2:3, randomly oriented and dispersed in a plaster matrix. Fig. 4 shows an example of a structure generated by the RSA algorithm in accordance with the conditions earlier detailed in the “Random microstructure generation method” section. Thermal contact between the plaster and peanut shells is assumed to be perfect.
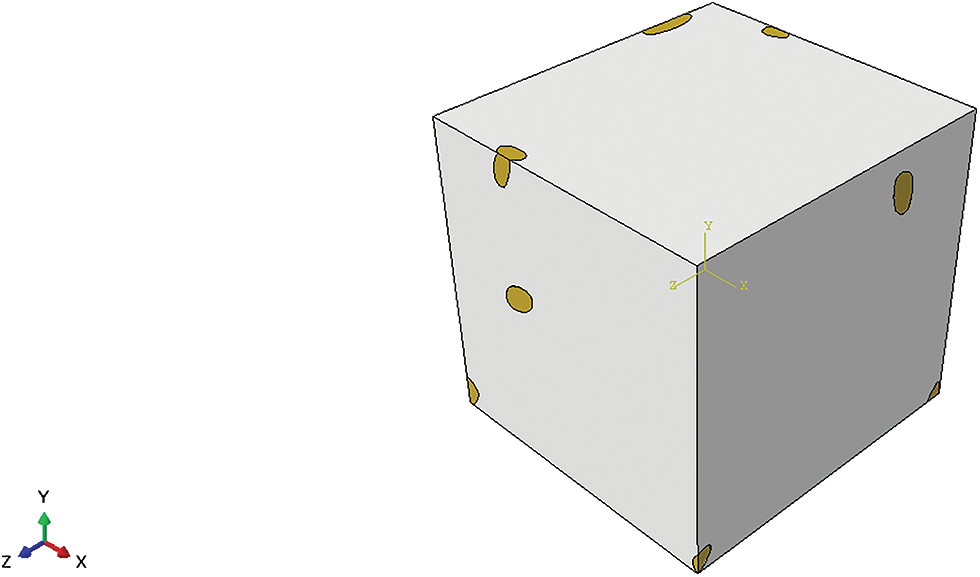
Figure 4: Example of a structure generated by the RSA algorithm
After generating the structure, it is then transferred to the Abaqus software to perform a finite element calculation of the effective thermal conductivity of the studied composite.
3.2 Numerical Model of Heat Transfer
The study of the thermal properties of materials begins by applying an external temperature gradient and then solving the heat equation.
– Laplace’s equation: The effective thermal conductivity, in steady state, can be obtained from the thermal conductivities of the matrix and the inclusions by solving the following Laplace equation:
– Heat flux conservation: Partial differential equations lead to the physical notion of conservative flow given by a gradient:
Applying the divergence-flux formula (Ostrogradsky’s theorem), it comes:
We deduce from this that:
To simplify the resolution of Eq. (1), a unidirectional heat flux is imposed. But since the particles are randomly distributed and oriented, the material is isotropic at full scale, while the individual realizations are not necessarily isotropic, which requires calculating an average value over the different directions with an acceptable percentage of error in isotropy.
The effective thermal conductivity in the x-direction, for example, can be obtained by the relationship:
A statistical approach on a representative number of realizations, based on the methodology of Kanit et al. [11], is used to estimate the effective thermal conductivity with a given precision.
After transferring the generated structure to a finite element software, a numerical simulation methodology was followed to model the thermal properties of the clay-based material:
– A temperature gradient is imposed between two opposite sides, in a stationary state, which generates a heat flux directed towards low temperatures. The choice, in the calculation software, of a heat flow vector circulating unidirectionally between two opposite faces of the representative elementary volume requires that the other faces be adiabatic. The imposed boundary conditions are given by the following equations:
– The RVE geometries created in the previous section have been meshed. A free meshing with tetrahedral elements leads generally to a fairly high density of elements at the matrix/inclusion interface and it can be easily automated. It is used to obtain a high-quality periodic discretization of matrix-inclusion microstructures with as few elements as possible (Fig. 5). About 173544 elements have been generated using 10-node tetrahedron elements. The optimal meshing parameters have been chosen on the basis of the conservation of the topology of the interfaces of the microstructure.
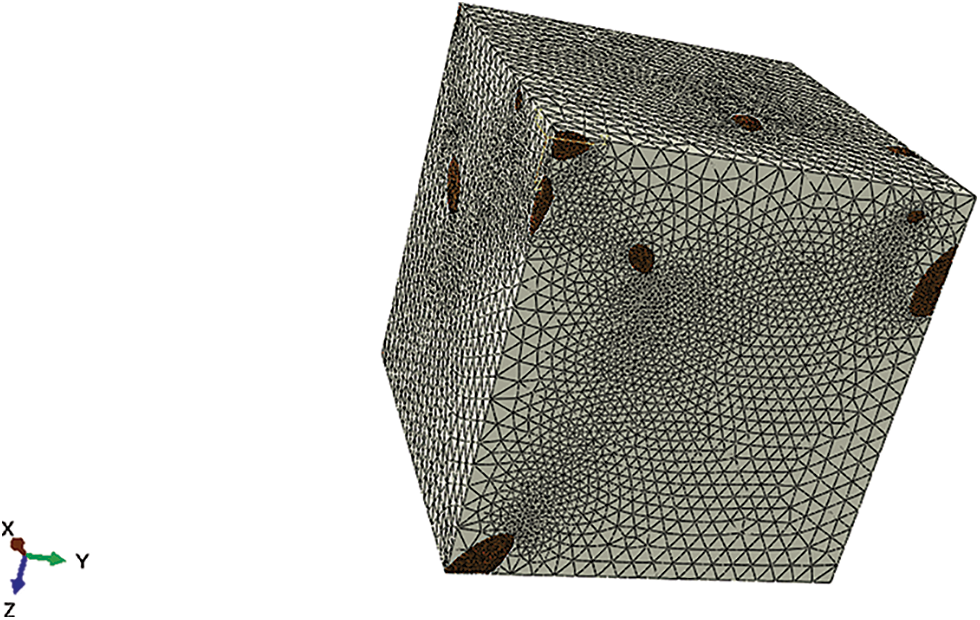
Figure 5: Volume mesh of an RVE with a volume fraction of 10%
The effect of the mesh density on the thermal conductivity values was studied to justify the choice of the mesh. Fig. 6 shows the variations of the thermal conductivity as a function of the number of finite elements used to mesh the 3D microstructure, it clearly appears a convergence towards an apparent thermal conductivity of the considered material. This density of mesh will be retained for the continuation of our study and then checked that it is sufficient to obtain a computational precision less than 2% on the statistical fluctuations of the results after a number of realizations.
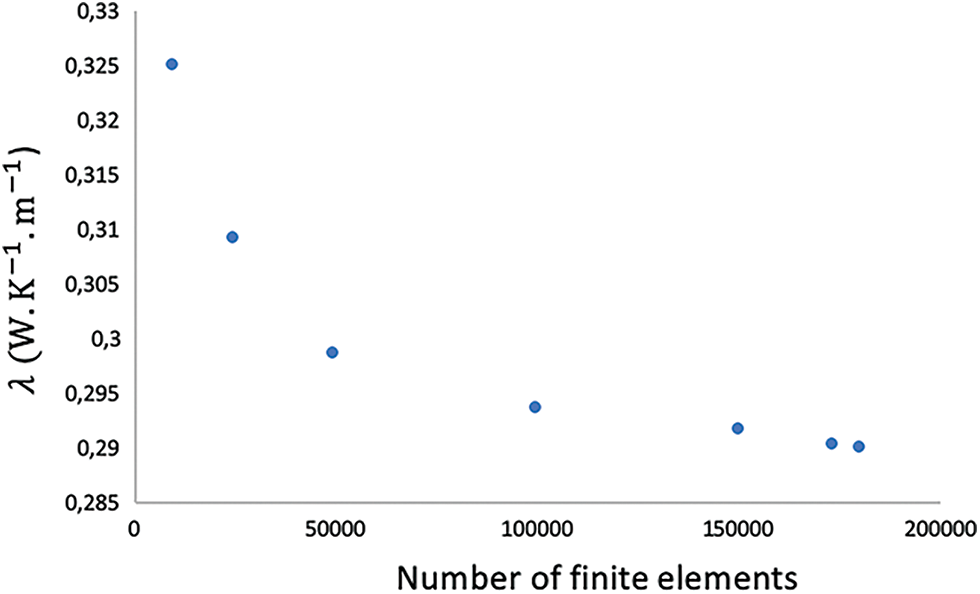
Figure 6: Mesh sensitivity analysis
The thermal conduction inside the material is governed by Fourier’s law. The heat flux obtained within the elementary volume is almost uniform as shown in Fig. 7, which is in accordance with the stationary regime established, except in the surroundings of the inclusions where variations in heat flow are observed. This is clearly shown on the curve of heat flow variations presented in Fig. 8. These fluctuations in heat flow at the matrix/inclusion interfaces can be explained by the difference in thermal conductivities of the two constituents of the composite material. As the state is permanent, the average of these simulated values of surface heat flow is in the order of 0.01210594 W.cm−2 which allows for the calculation of the equivalent thermal conductivity using Eq. (5).
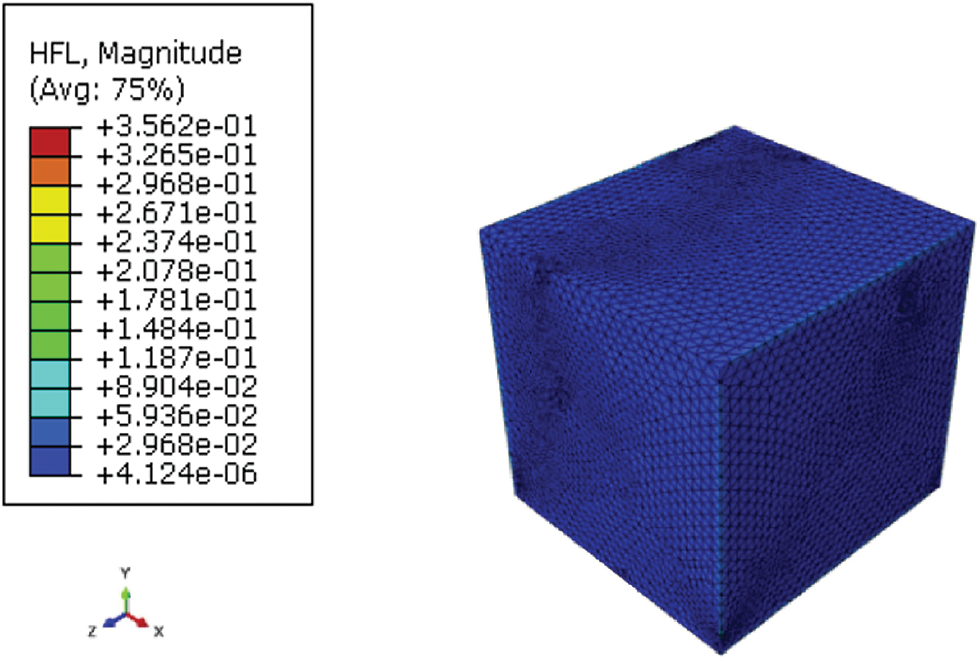
Figure 7: Heat flux along the temperature gradient

Figure 8: Heat flow variations within the material along the temperature gradient
As an illustrative example, a temperature distribution within the elementary volume (Fig. 9) shows a unidirectional decrease along the x-axis. It also appears that the planar aspect of the isothermal surfaces is modified in the proximity of the additives. In effect the temperature field is not uniform over a section perpendicular to the direction of the heat flow. This reflects the opposition of grains to heat transfer due to their low thermal conductivity making the material more insulating.
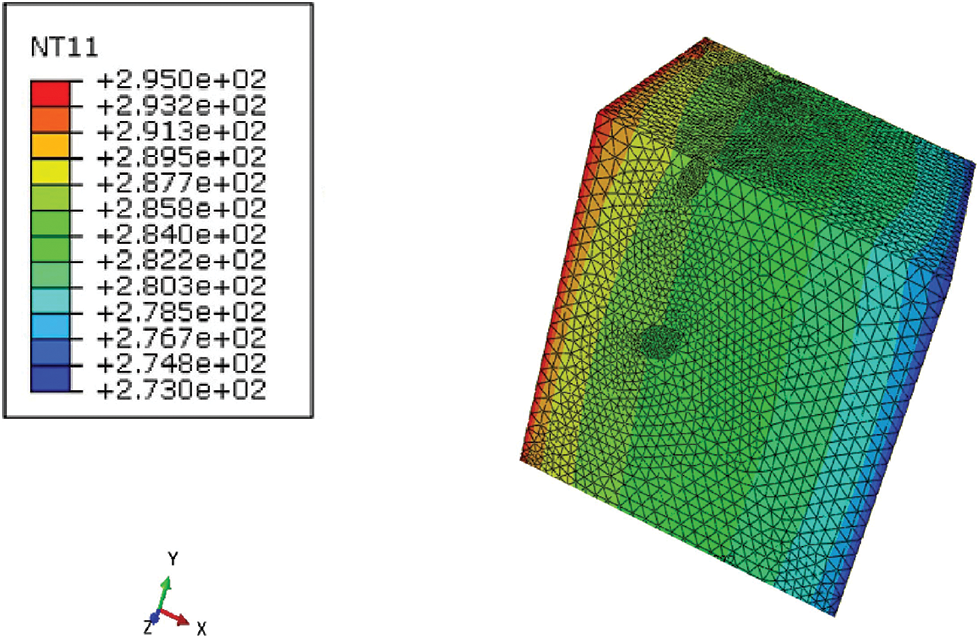
Figure 9: Temperature distribution within elementary volume
An example of the result of temperature variations in the direction of thermal diffusion is shown in Fig. 10. The equation of the linear regression makes it possible to go back to the value of the thermal conductivity.
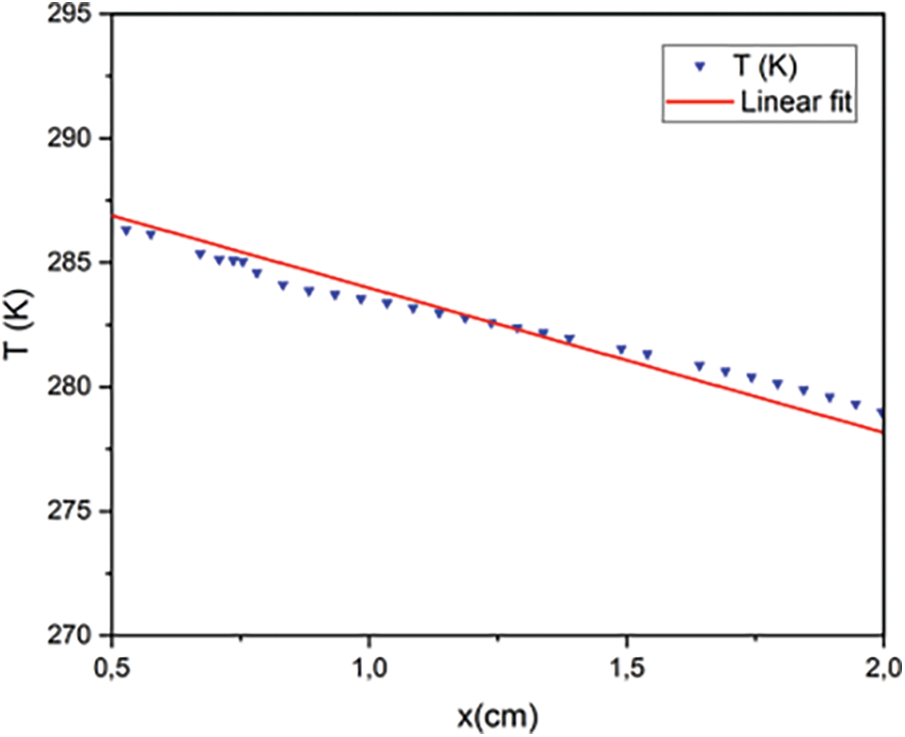
Figure 10: Temperature variation along the direction of thermal diffusion
4.3 Effective Thermal Conductivity
Many geometric realizations (several random draws of positions and orientations) for the same 3D microstructure (same volume fraction and same aspect ratio) were simulated. Then the statistical average and the relative deviation were calculated for each number of implementations. The increase in the number of realizations was stopped when there was the convergence of the thermal conductivity. The average thermal conductivity and its calculated dispersion are presented in Fig. 11. The variance of computed apparent properties for each number of realizations is used to define the precision of the estimation, which corresponds to an uncertainty of less than 0.5% in our case.
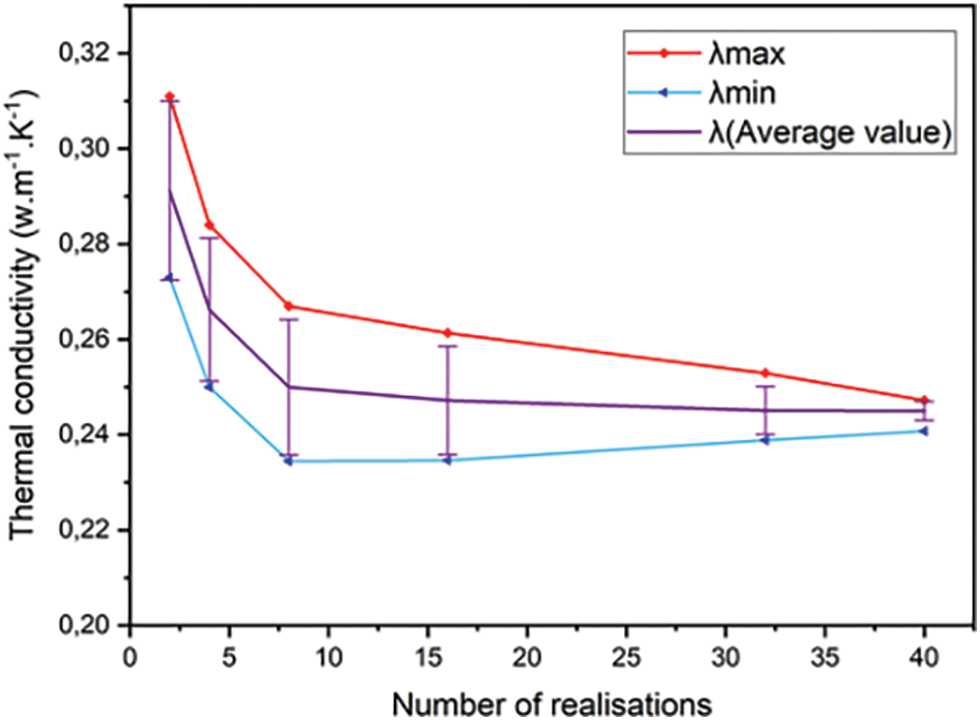
Figure 11: Average values and confidence intervals on average of thermal conductivity as a function of the number of realizations
4.4 Comparative Study of Numerical, Experimental and Analytical Thermal Conductivity Values
The composite material chosen in this study as well as others have already been studied experimentally and their thermophysical properties have been characterized using modern metrology methods [4,21]. The preparation of samples of these materials was carried out in the LEME laboratory. Figs. 12 and 13 are pictures of the different materials used in the preparation of the samples.
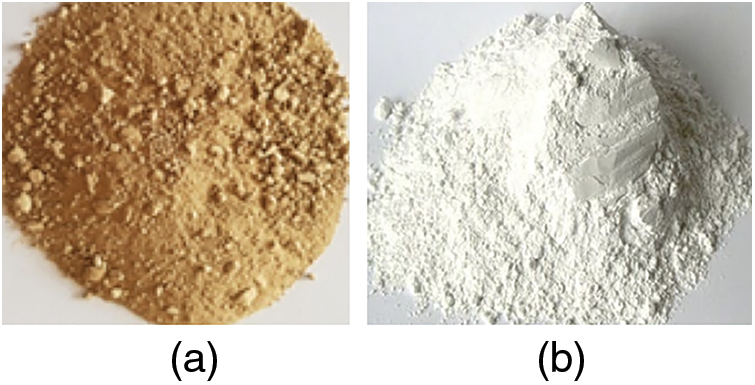
Figure 12: View of the different matrix: (a) clay, (b) plaster
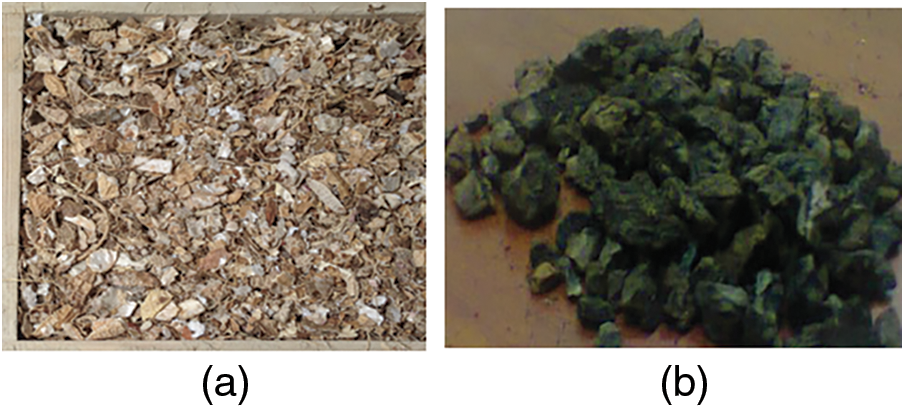
Figure 13: View of the inclusions used: (a) peanut shells, (b) granular cork
The samples of the studied composites were experimentally prepared by a process of mixing the matrix (clay or plaster) and inclusions (cork or peanut shells). Water is added to the matrix paste until a normal consistency is obtained, then inclusions are introduced into the matrix. The mixing process is carried out and then the pastes are placed in parallelepipedic molds. After demolding and drying the samples are kept in plastic bags, from which samples were taken for experimental characterizations. Figs. 14 and 15 show some samples of composite materials arranged two by two in the same inclusions in different matrices: granular cork to volume fraction 26% in plaster (Fig. 14a) [6,22,23], granular cork to 32% in clay (Fig. 14b) [6], peanut shells to 14.3% in plaster (Fig. 15a) [20] and peanut shells to 16.4% in clay (Fig. 15b) [5]. The characterization of the thermal conductivity of the samples were carried out by the method of the asymmetric hot plate in steady state, its description is given in Fig. 16, where a heating element is sandwiched between the studied sample and an insulating foam. To maximize the heat flow through the sample, thermocouples are positioned to measure the temperatures T1 and T0 at the center of the upper and lower faces of the sample and the temperature T2 at the lower face of the insulating foam. The role of the two aluminum blocks, which have a fairly high thermal conductivity, is to reach the steady state after a reasonable time.
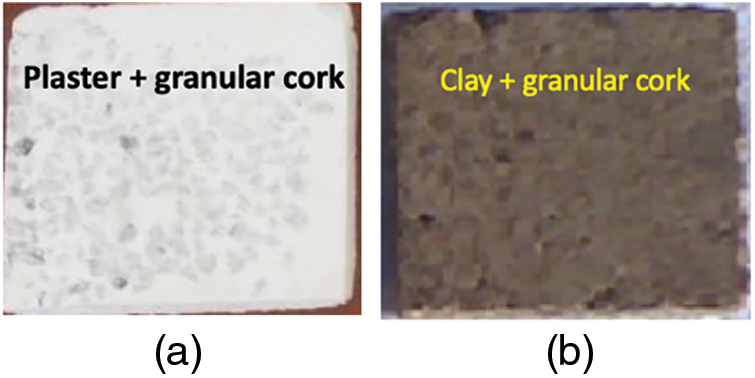
Figure 14: Samples of prepared composites: (a) granular cork additives at 32% in matrix, (b) granular cork additives at 26% in matrix
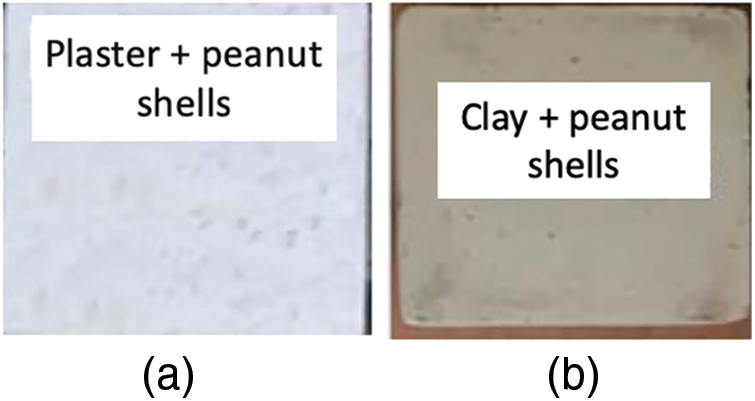
Figure 15: Samples of prepared composites: (a) peanut shells additives at 14%, 3% in matrix, (b) peanut shells additives at 16%, 4% in matrix
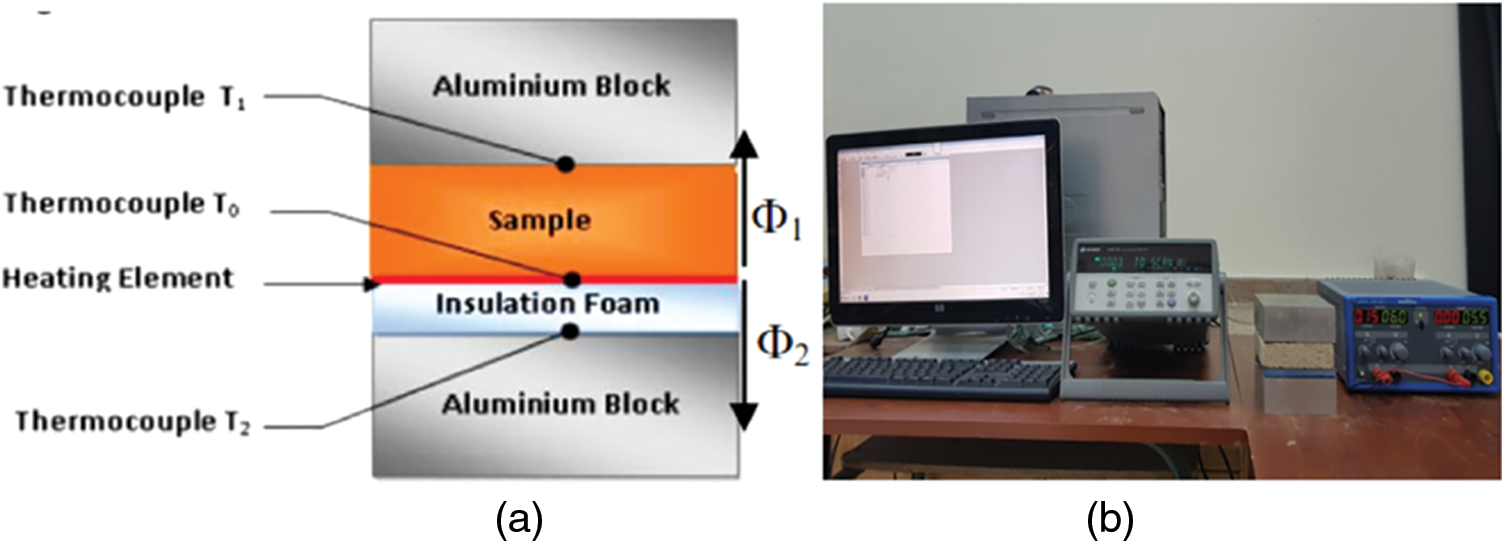
Figure 16: Asymmetric hot plate method in steady state: Schematic representation of (a) principle of the method, (b) experimental device
Where
The combination of these equations leads to the expression of the thermal conductivity of our sample:
The calculated values of the equivalent thermal conductivity are also compared to those obtained by the different analytical models reported in the literature.
The expressions for the equivalent thermal conductivity for each of the analytical models are given by the following relations [4,24–26] (case of plaster/peanut shells composite):
– Series model
– Parallel model
– Beck model
– Maxwell model
– Woodside model
with:
For all components of the composite materials studied, the thermal conductivities are:
Table 1 presents the numerical and experimental results, the values of the analytical models of the thermal conductivity of the three materials, and the relative deviations from the experimental value.
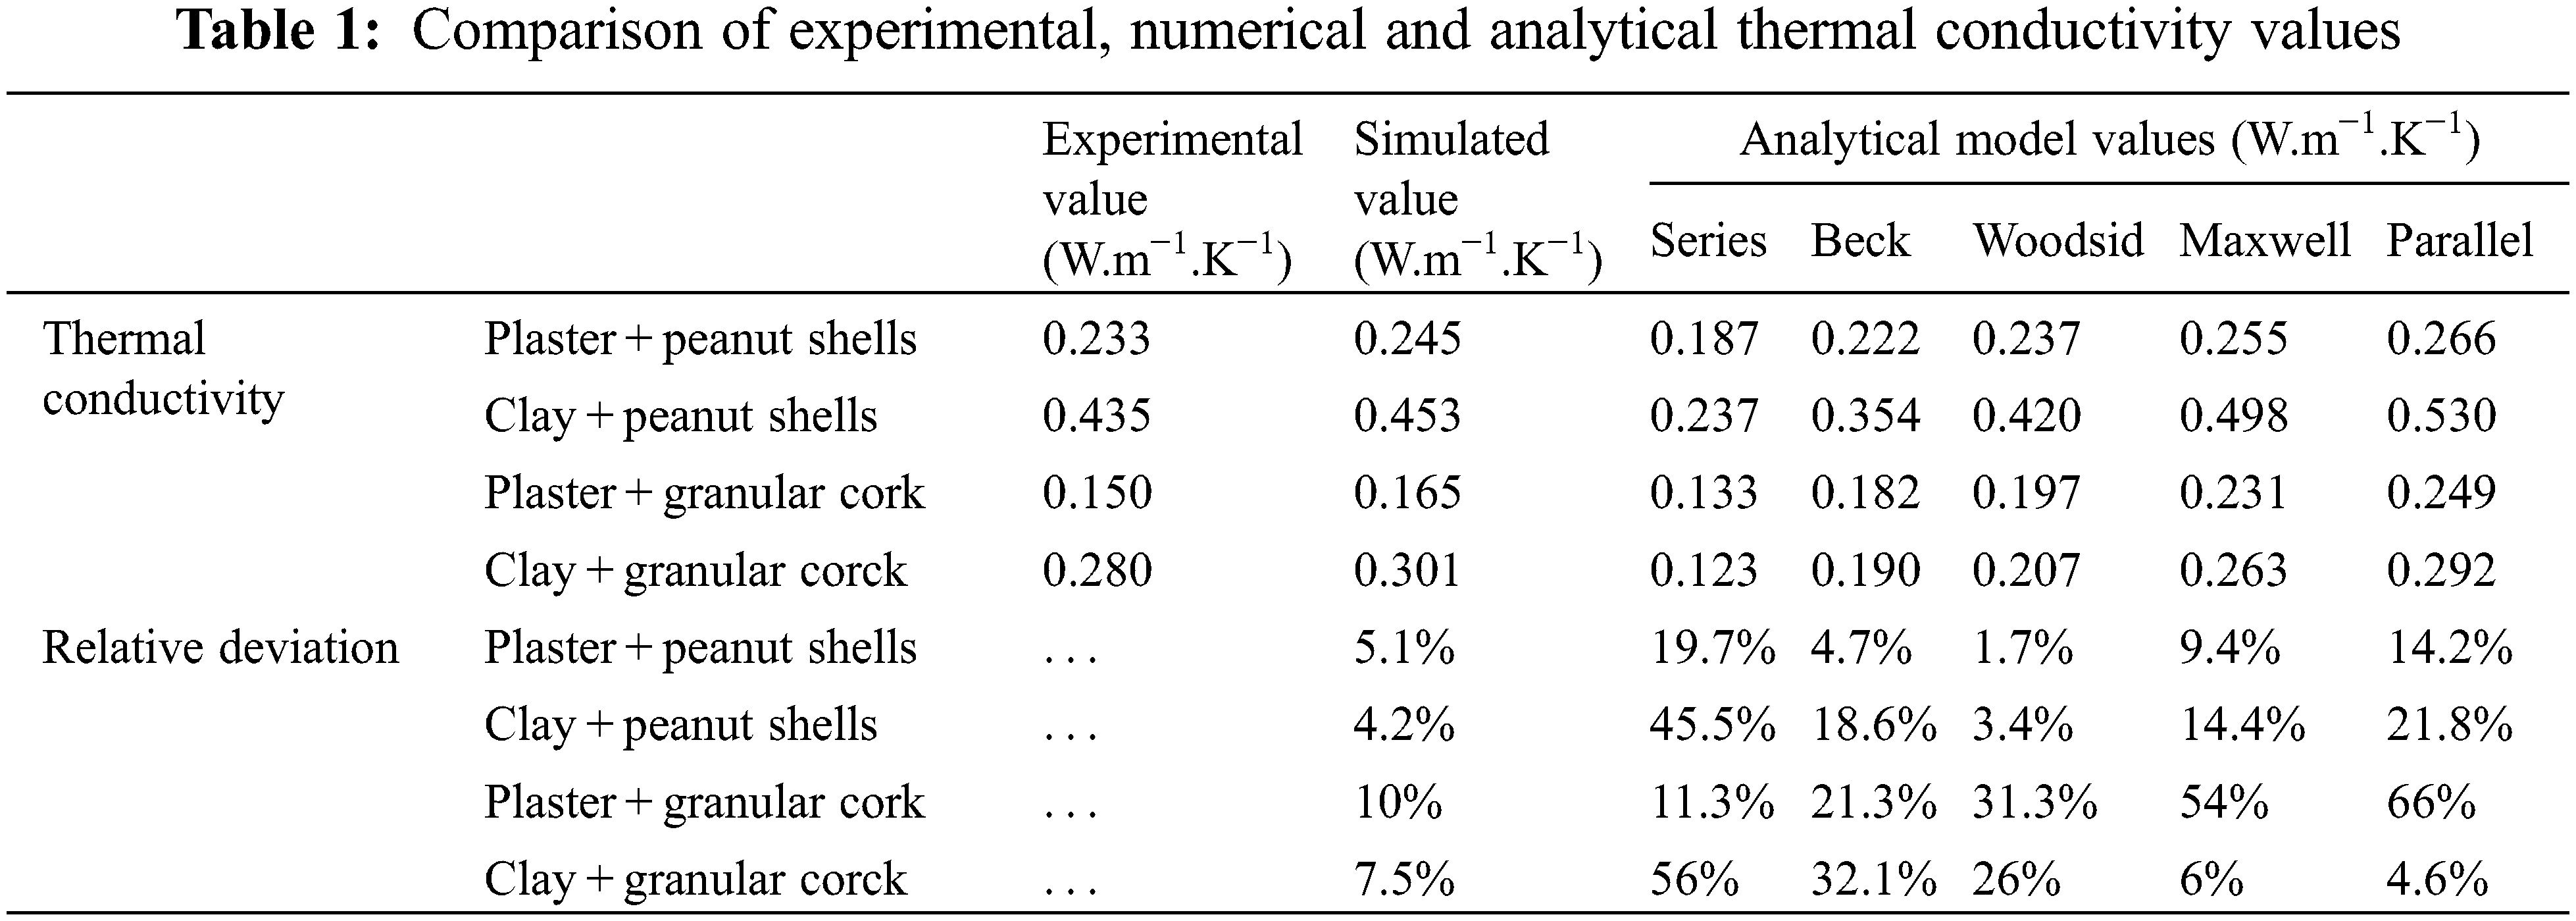
From data in Table 1, we note that:
– The noticed discrepancy between numerical and experimental results shows the performance of the computational code used and its validation for random heterogeneous materials.
– The four simulated values of the thermal conductivity are higher than those obtained experimentally. This is because the adopted numerical method does not consider the microporosity of the inclusions of these materials.
– The reduction rate of the thermal conductivity of the clay/granular cork and clay/peanut shells composites compared to pure clay are respectively: 34.56% and 1.52%.
– The reduction rate of the thermal conductivity of the plaster/granular cork and plaster/peanut shells composites compared to the pure plaster are respectively: 45%, 18% and 18%, 6%.
– It appears that the geometric Woodside model is closest to representing the samples containing the peanut shells, while the cork-stabilized composites tend to be represented by the serial model (case of the gypsum/cork composite) or by the parallel model (case of the clay/cork composite) depending on the geometric mean of the random distributions of the additives in each of the clay and plaster matrices. The histogram shown in Fig. 17 compares the calculated thermal conductivities of the composite materials constituted of the binders plaster and clay consolidated with peanut shells on the one hand and granular cork on the other, at close volume fractions, as well as the deviation from the values found experimentally. The comparison is also made in relation to the raw matrix. The quality of thermal performance is much better for materials containing plaster. Also, in terms of thermal insulation, the effect of cork remains better than peanut shells which can be explained by the microporosity of cork, in addition to its compressibility and its resistance to gases and liquids.

Figure 17: Histogram of composite materials based on clay and plaster with peanut shell and granular cork inclusions
We have presented a finite element based numerical methodology for predicting the effective thermal conductivity of random heterogeneous materials. We are particularly interested in ecological building materials based on gypsum and clay consolidated with peanut shell additives on the one hand and cork on the other hand. The calculated thermal conductivities are compared with experimental results from the literature and with existing analytical models. The method is shown to be very promising as a tool for predicting the effective properties of building materials, and also for the design of new materials used to increase the energy efficiency of buildings. The observed deviations from the experimental values can be explained by the fact that the inclusions do not have the same shapes and that the numerical study does not consider the microporous structure of the inclusions. In retrospect, we propose the generation of 3D structures with random distributions and orientations of inclusions of non-identical sizes. We also propose, in furtherance of this work, a study of the effect of thermal stress that can be involved in these materials especially in regions characterized by a dry climate with rapid daily variations in temperature variations. We will also be conducting a study on the optimization of different physical parameters such as acoustic properties and especially mechanical properties that are the basis of the stability of buildings.
Funding Statement: The authors received no specific funding for this study.
Conflicts of Interest: The authors declare that they have no conflicts of interest to report regarding the present study.
References
1. Elhamdouni, Y., Khabbazi, A., Benayad, C., Mounir, S., Dadi, A. (2017). Thermophysical and mechanical characterization of clay bricks reinforced by alfa or straw fibers. IOP Conference Series: Materials Science and Engineering, vol. 186, no. 1, 012035. Fez, Morocco: IOP Publishing. [Google Scholar]
2. Tiskatine, R., Bougdour, N., Oaddi, R., Gourdo, L., Rahib, Y. et al. (2018). Thermo-physical analysis of low-cost ecological composites for building construction. Journal of Building Engineering, 20, 762–775. https://doi.org/10.1016/j.jobe.2018.09.015 [Google Scholar] [CrossRef]
3. Mounir, S., Khabbazi, A., Khaldoun, A., Maaloufa, Y., El Hamdouni, Y. (2015). Thermal inertia and thermal properties of the composite material clay-wool. Sustainable Cities and Society, 19, 191–199. https://doi.org/10.1016/j.scs.2015.07.018 [Google Scholar] [CrossRef]
4. Bal, H., Jannot, Y., Gaye, S., Demeurie, F. (2013). Measurement and modelisation of the thermal conductivity of a wet composite porous medium: Laterite based bricks with millet waste additive. Construction and Building Materials, 41, 586–593. https://doi.org/10.1016/j.conbuildmat.2012.12.032 [Google Scholar] [CrossRef]
5. Lkouen, A., Meskini, A., Lamrani, M., Khabbazi, A. (2020). Thermophysical characterization of a new clay-based construction material from the atlas region. IOP Conference Series: Materials Science and Engineering, vol. 783, no. 1. Meknes, Morocco, IOP Publishing. https://doi.org/10.1088/1757-899x/783/1/012007 [Google Scholar] [CrossRef]
6. Mounir, S., Maaloufa, Y., Cherki, A., Khabbazi, A. (2014). Thermal properties of the composite material clay/granular cork. Construction and Building Materials, 70, 183–190. https://doi.org/10.1016/j.conbuildmat.2014.07.108 [Google Scholar] [CrossRef]
7. Lamrani, M., Mansour, M., Laaroussi, N., Khalfaoui, M. (2019). Thermal study of clay bricks reinforced by three ecological materials in south of Morocco. 5th International Conference on Power and Energy Systems Engineering (Cpese 2018), vol. 156, pp. 273–277. Nagoya, Japan. https://doi.org/10.1016/j.egypro.2018.11.141 [Google Scholar] [CrossRef]
8. El Azhary, K., Ouakarrouch, M., Laaroussi, N., Garoum, M. (2021). Energy efficiency of a vernacular building design and materials in hot arid climate: Experimental and numerical approach. International Journal of Renewable Energy Development, 10(3), 481–494. https://doi.org/10.14710/ijred.2021.35310 [Google Scholar] [CrossRef]
9. Bousshine, S., Ouakarrouch, M., Bybi, A., Laaroussi, N., Garoum, M. et al. (2022). Acoustical and thermal characterization of sustainable materials derived from vegetable, agricultural, and animal fibers. Applied Acoustics, 187, 108520. https://doi.org/10.1016/j.apacoust.2021.108520 [Google Scholar] [CrossRef]
10. Mahjoub, S., Vafai, K. (2008). A synthesis of fluid and thermal transport models for metals foams heat exchangers. effect of HVAC system size on theoptimum insulation thickness of the buildings in different climate zones. International Journal of Heat and Mass Tranfer, 51(15–16), 3701–3711. https://doi.org/10.1016/ijheatmasstransfer.2007.12.012 [Google Scholar] [CrossRef]
11. Kanit, T., Forest, S., Galliet, I., Mounoury, V., Jeulin, D. (2003). Determination of the size of the representative volume element for random composites: Statistical and numerical approach. International Journal of Solids and Structures, 40(13–14), 3647–3679. https://doi.org/10.1016/s0020-7683(03)00143-4 [Google Scholar] [CrossRef]
12. Moussaddy, H., Therriault, D., Levesque, M. (2013). Assessment of existing and introduction of a new and robust efficient definition of the representative volume element. International Journal of Solids and Structures, 50(24), 3817–3828. https://doi.org/10.1016/j.ijsolstr.2013.07.016 [Google Scholar] [CrossRef]
13. Kanit, T., V’Guen, F., Forest, S., Jeulin, D., Reed, M. (2006). Apparent and effective physical properties of heterogeneous materials: Representativity of samples of two materials from food industry. Computer Methods in Applied Mechanics and Engineering, 195(33–36), 3960–3982. https://doi.org/10.1016/j.cma.2005.07.022 [Google Scholar] [CrossRef]
14. Floury, J., Carson, J., Pham, Q. T. (2008). Modelling thermal conductivity in heterogeneous media with the finite element method. Food and Bioprocess Technology, 1(2), 161–170. https://doi.org/10.1007/s11947-007-0001-6 [Google Scholar] [CrossRef]
15. Faye, M., Lartigue, B., Kane, S. (2019). Influence of structural and thermophysical parameters of insulating aggregates on the effective thermal conductivity of lightweight concrete. Journal of Building Engineering, 21, 74–81. https://doi.org/10.1016/j.jobe.2018.10.011 [Google Scholar] [CrossRef]
16. Wang, M., Pan, N. (2008). Modeling and prediction of the effective thermal conductivity of random open-cell porous foams. International Journal of Heat and Mass Transfer, 51(5–6), 1325–1331. https://doi.org/10.1016/j.ijheatmasstransfer.2007.11.031 [Google Scholar] [CrossRef]
17. Lahrichi, A., Ennaceri, H., Bentamy, A., Khaldoune, A. (2016). Microstructure based simulation of clay composites thermal properties. 4th International Renewable and Sustainable Energy Conference (IRSEC), pp. 1149–1152. Marrakech, Morocco. [Google Scholar]
18. Feder, J. (1980). Random sequential adsorption. Journal of Theoretical Biology, 87(2), 237–254. https://doi.org/10.1016/0022-5193(80)90358-6 [Google Scholar] [CrossRef]
19. Karami, M., Anbarzadeh, E., Delfani, S. (2021). Effect of HVAC system size on the optimum insulation thickness of the buildings in different climate zones. Journal of Thermal Engineering, 8(2), 249–267. https://doi.org/10.18186/thermal.1086236 [Google Scholar] [CrossRef]
20. Colak, A. (2006). Physical and mechanical properties of polymer-plaster composites. Materials Letters, 60(16), 1977–1982. https://doi.org/10.1016/j.matlet.2005.12.062 [Google Scholar] [CrossRef]
21. Jannot, Y., Felix, V., Degiovanni, A. (2010). A centered hot plate method for measurement of thermal properties of thin insulating materials. Measurement Science and Technology, 21(3), 035106. https://doi.org/10.1088/0957-0233/21/3/035106 [Google Scholar] [CrossRef]
22. Maaloufa, Y., Mounir, S., Khabbazi, A., Kettar, J., Khaldoun, A. (2015). Thermal characterization of materials based on clay and granular: Cork or expanded perlite. Energy Procedia, 74, 1150–1161. https://doi.org/10.1016/j.egypro.2015.07.757 [Google Scholar] [CrossRef]
23. Lamrani, M., Laaroussi, N., Khabbazi, A., Khalfaoui, M., Garoum, M. et al. (2017). Experimental study of thermal properties of a new ecological building material based on peanut shells and plaster. Case Studies in Construction Materials, 7, 294–304. https://doi.org/10.1016/j.cscm.2017.09.006 [Google Scholar] [CrossRef]
24. Berryman, J. G. (2005). Thermal conductivity of porous media. Applied Physics Letters, 86(3), 032905. https://doi.org/10.1063/1.1852718 [Google Scholar] [CrossRef]
25. Maxwell, D. C. (1954). Atreatise on electricité and magnetism, 3rd edition, vols. I and II. New York: Dover. [Google Scholar]
26. Woodside, W., Messmer, J. H. (1961). Thermal conductivity of porous media. I. Unconsolidated sands. Journal of Applied Physics, 32(9), 1688–1699. https://doi.org/10.1063/1.1728419 [Google Scholar] [CrossRef]
Cite This Article
 Copyright © 2023 The Author(s). Published by Tech Science Press.
This work is licensed under a Creative Commons Attribution 4.0 International License , which permits unrestricted use, distribution, and reproduction in any medium, provided the original work is properly cited.
 Downloads
 Citation Tools