
 Submit a Paper
 Propose a Special lssue
 Open Access
ARTICLE

A Three-Dimensional Model for the Formation Pressure in Wellbores under Uncertainty
Strategic Planning and Technical Support Institute, CNPC Engineering Technology R&D Co., Ltd., Beijing, 102206, China
* Corresponding Author: Jiawei Zhang. Email:
Fluid Dynamics & Materials Processing 2023, 19(9), 2305-2314. https://doi.org/10.32604/fdmp.2023.026304
Received 29 August 2022; Accepted 08 November 2022; Issue published 16 May 2023
 View Full Text
 Download PDF
Abstract
Formation pressure is the key parameter for the analysis of wellbore safety. With increasing drilling depth, however, the behavior of this variable becomes increasingly complex. In this work, a 3D model of the formation pressure under uncertainty is presented. Moreover a relevant algorithm is elaborated. First, the logging data of regional key drilling wells are collected and a one-dimensional formation pressure profile along the well depth is determined. Then, a 3D model of regional formation pressure of the hierarchical group layer is defined by using the Kriging interpolation algorithm relying on a support vector machine (SVM) and the formation pressure of the drilled wells. To validate the method, the formation pressure of one pre-drilled well is compared with the well logging results. The comparison reveals that the maximum relative error is less than 4.5%. The software based on this model is complemented by a computer visualization technology, which provides a relevant tool for understanding and analyzing the 3D formation pressure. The outcomes of this study are intended to support the characterization of areas with missing or poor 3D seismic data and provide more accurate information for the analysis of wellbore integrity.Keywords
Formation pressure is the basic data for wellbore safety analysis. With the development of oil and gas exploration and development, the geological environment encountered is becoming more and more complex, such as strong fold fault zone, interlaced soft and hard strata, large dip angle of strata and strong anisotropy of strata. Due to the complexity of structural conditions, it is difficult to understand the spatial distribution of formation pressure in the block, which brings challenges to wellbore integrity [1]. In order to meet the engineering requirements, it is necessary to establish a three-dimensional model for the formation pressure with uncertainty in wellbores [2–4]. However, the traditional methods are all based on seismic data to obtain 3D formation pressure [5–8]. If there is no seismic data or the quality of seismic data is poor, only the logging data can be used. How to use logging data to analyze three-dimensional formation pressure is lack of practical methods. In order to solve this problem, this paper proposes an algorithm to build a three-dimensional model of formation pressure with uncertainty by using logging data. The purpose of this paper is to establish the three-dimensional formation pressure in the complex geological structure area, to understand more clearly the spatial distribution of formation pressure, and to provide the necessary technical basis for reducing the underground accidents.
2 Methodology/Material& Methods
2.1 GA-SVM-Kriging Interpolation Algorithm
In this paper, a regional description algorithm of formation pressure based on geostatistics was proposed [9]. It mainly consists of two parts: the variogram which can analyze the correlation and variogram of regional formation pressure, and Kriging interpolation algorithm which is suitable for the spatial interpolation of formation pressure.
In this paper, in view of the shortcomings of conventional spatial interpolation algorithm, which is complex and needs subjective judgment of spatial difference model, support vector machine algorithm is used to fit the experimental variogram [10,11]. This method does not need to optimize and fit the theoretical variogram coefficient, so it makes up for the shortcomings of ordinary Kriging interpolation method. In this paper, the Gaussian RBF kernel function is selected as the kernel function of SVM, and the regression function form is:
There are three parameters to be determined in SVM regression model: insensitive loss parameter ε, penalty parameter C and kernel parameter of RBF kernel function σ. In this paper, genetic algorithm (GA) [12] is used to optimize three important parameters in SVM model. The parameters of SVM model are optimized based on genetic algorithm. The steps are as follows:
a) Initialization population: M initial populations are randomly generated by binary coding, and the preset number of iterations is N.
b) Calculation of fitness: SVM is trained with the corresponding parameters of each individual in the group, and the fitness of each individual is calculated.
c) Selection: according to the roulette method, the number of individuals selected and the probability of individual selection in the initial population G(0) were determined, and the excellent individuals with high probability were selected, and then their information was transmitted to the next generation of new species.
d) Crossover: set the crossover probability PC, pair the parent population randomly, and generate new individuals.
e) Variation: for a given variation probability Pm, M × Pm individuals are randomly selected first, and the k-th character is used for mutation operation to replace the information on the corresponding position of the selected chromosome to generate new individuals.
f) Termination condition judgment: if the termination condition is met, the output result will be stopped. Otherwise, go to step b to continue the calculation.
g) Decoding: decoding the optimal individual, and finally get the optimal solution of three parameters in SVM model.
In this paper, the function that can reflect the regression performance of SVM is chosen as the fitness function:
In formula:
The GA-SVM-Kriging interpolation algorithm is mainly divided into the following three steps:
a) Calculation of experimental coefficient of variation
b) The SVM algorithm optimized by genetic algorithm is used to regression fit the experimental coefficient of variation
c) For the position
2.2 Construction of 3D Model of Formation Pressure with Uncertainty
Previous studies have proved that the same or similar geological, seismic, logging and other parameters have the same or similar response to the same formation and the formation in the profile [13]. Therefore, the key geological parameters of the same formation and section in the region are consistent. Taking the target formation as the basic unit and considering the geological characteristics of the target formation, this paper studies and establishes the three-dimensional model for the formation pressure in the target area. The calculation method is mainly divided into the following steps:
(1) Calculation of formation pressure with uncertainty
According to the uncertainty analysis method of formation pressure proposed by the authors [14,15], the formation pressure with uncertainty can be established (P = [u, cv], u—mean value, cv—standard deviation), as shown in Fig. 1.
(2) Virtual well deployment
Virtual well deployment is to grid the formation in the area. The target formation is divided into areas with the same volume size in equal steps. The grid numbers NX and NY are divided in the X and Y directions on the plane, which respectively represent the well pattern density of the virtual wells in the two directions. The grid number NZ is divided in the Z direction on the depth, which represents the density of the formation pressure dispersion point along the vertical well depth direction of the virtual wells. A matrix of size
(3) Calculation of formation pressure of virtual well based on GA-SVM-Kriging
Suppose there are N drilled wells in this area, and the coordinates of the drilled wells are
If the target well location is
In formula:
According to the above method, the formation pressure of all N wells has been transplanted to the target well, and the formation pressure of the target well on formation j is finally obtained as follows:
(4) Construction of 3D model of drilling geomechanics with uncertainty
According to the above algorithm, the formation pressure of each virtual well in the target area can be calculated. Then, based on the calculation results, the depth h of the virtual well along the Z direction, plus the X and Y directions, is reconstructed to form a 3D formation space position matrix H3, the matrix size is
(5) Model visualization
The 3D visualization of regional formation pressure can more intuitively understand the regional distribution of the formation, which is of great significance for the optimal design of directional wells, risk aversion and regional exploration and development [16]. Based on the formation matrix, through the analysis of the 3D depth matrix H3 and the 3D formation pressure matrix P3, we can get: ① the 3D distribution of the formation pressure of the target formation; ② the horizontal two-dimensional regional formation pressure at a certain depth; ③ the pressure curve of the whole well section in the vertical well depth. In this paper, a program based on MATLAB is developed to realize the visualization of 3D model of formation pressure area.
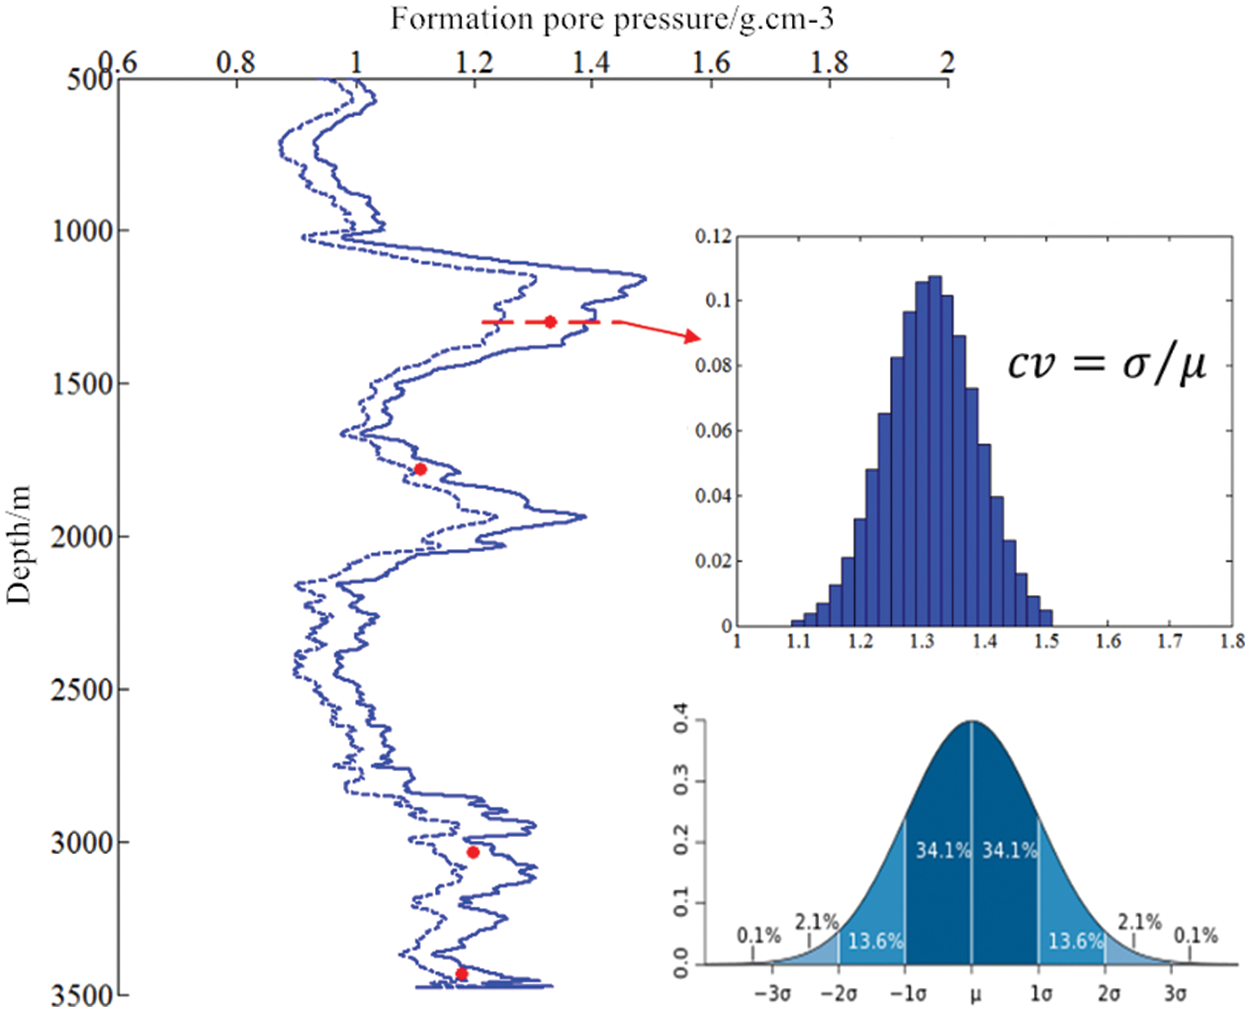
Figure 1: Schematic diagram of drilling geological mechanics parameters with uncertainty
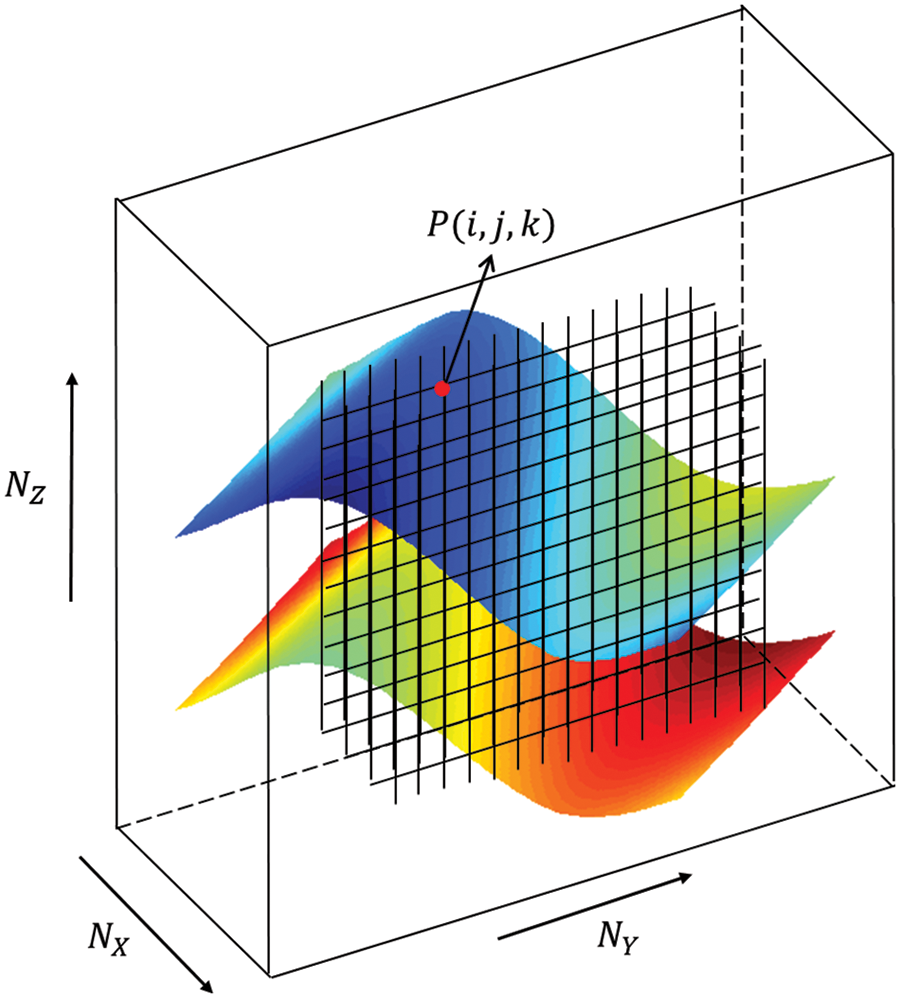
Figure 2: Schematic diagram of virtual well deployment
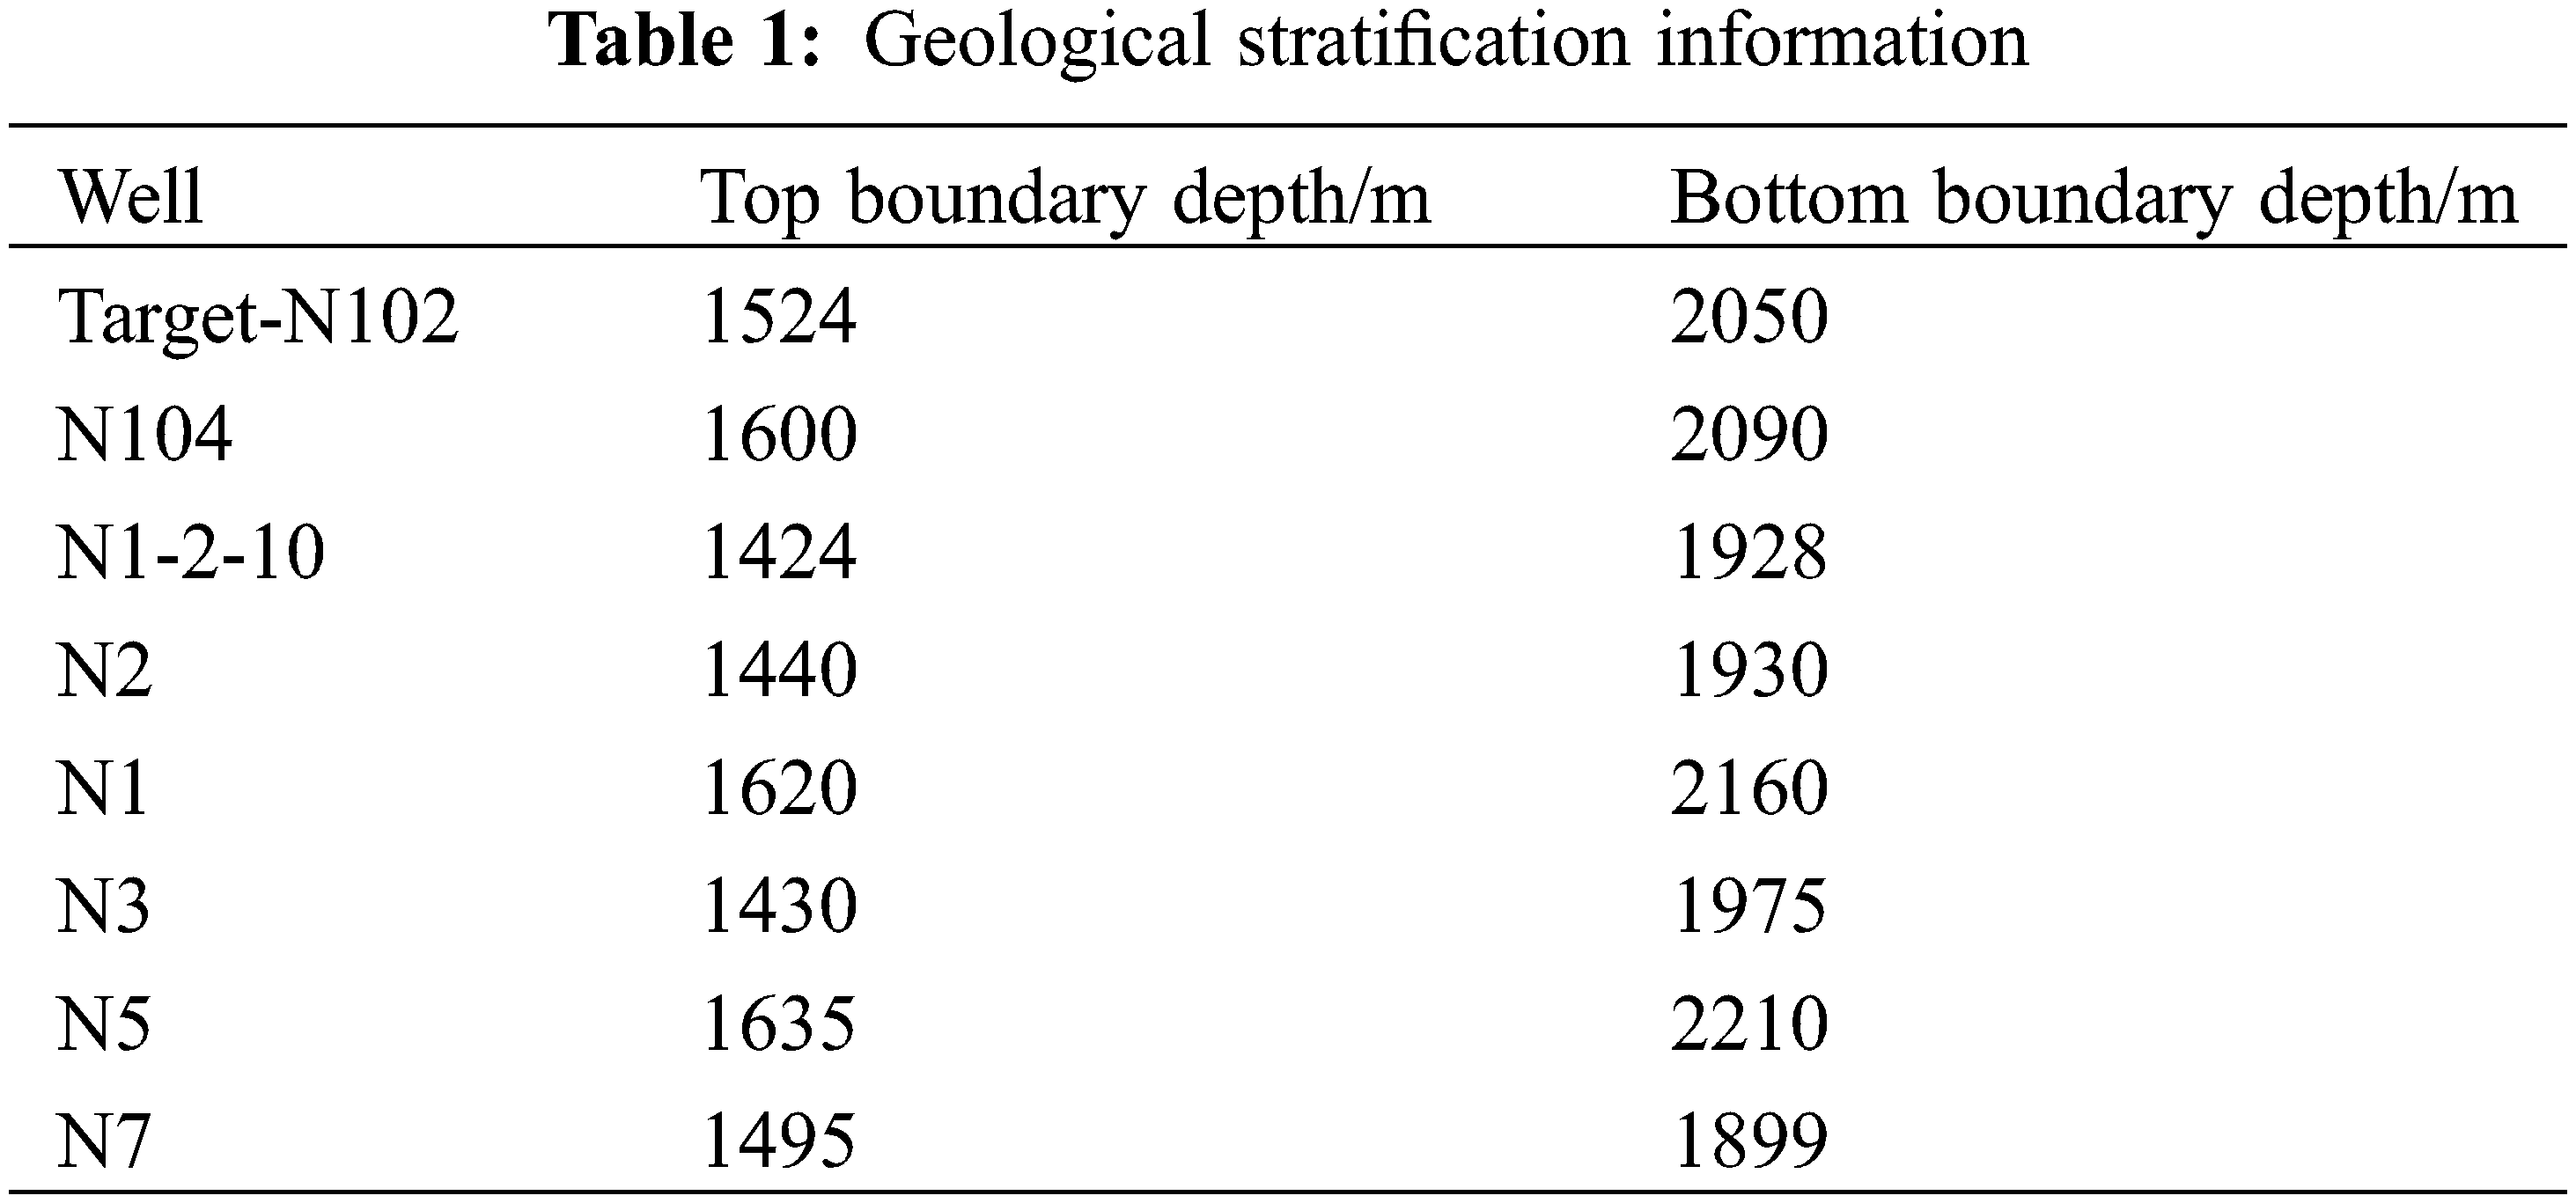
The geological research results of XX block show that the fold fault zone is strong, the geological situation is complex, the stratum is soft and hard interlaced, the stratum dip angle is large, and the stratum anisotropy is strong. Because of its complex structural conditions, it is difficult to understand the spatial distribution of formation pressure in the block, which leads to various downhole complex situations and accidents such as blowout, leakage, collapse, jamming and drilling tool breaking. In order to meet the requirements of drilling engineering, it is necessary to study the distribution of formation pressure in three dimensions. In this paper, N102, N104, N1-2-10, N2, N1, N3, N5 and N7 wells in XX block are selected for example analysis, and well location deployment is shown in Fig. 3. Geological stratification information is shown in Table 1. Taking the regional description of formation pore pressure with uncertainty as an example, the calculation process and application effect of this algorithm are described in detail. The N102 well in this area is selected as the target well to be drilled, and the rest wells are adjacent drilled; the LLH group is selected as the research horizon, and the geological stratification information of LLH group is shown in Table 1, and the specific steps are as follows.
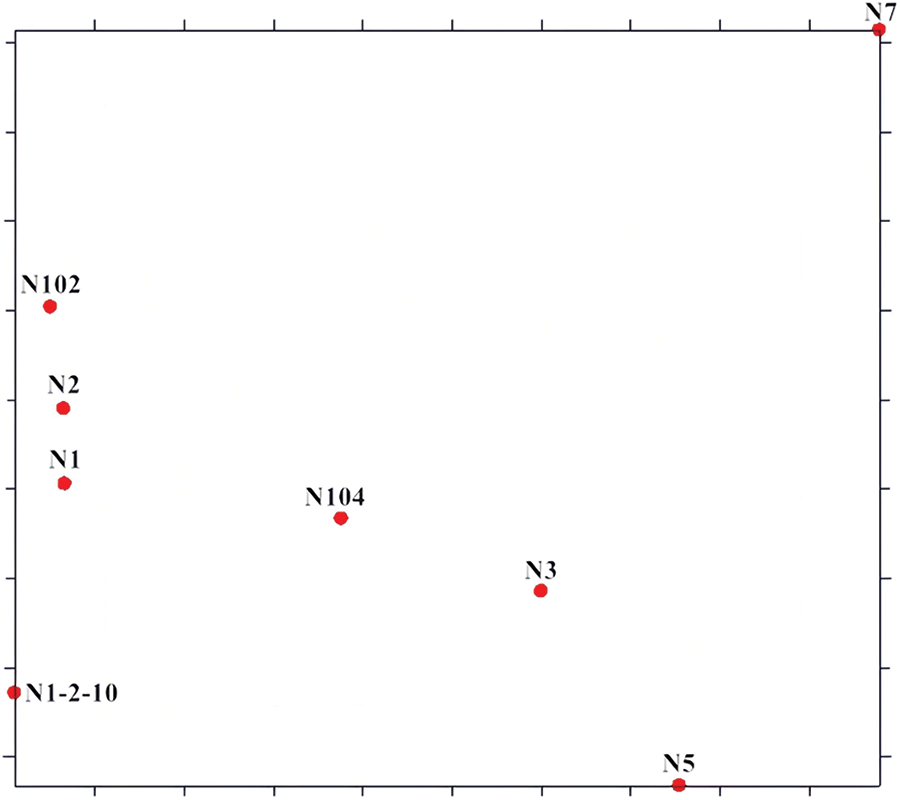
Figure 3: Diagram of well deployment
1. Calculate the formation pore pressure profile with uncertainty in the whole well section of each drilled well; select the mean value of formation pore pressure of each well for mapping, and the results are shown in Fig. 4.
2. The mean value of formation pore pressure of each well is calculated by layer group statistics, and the expectation of formation pore pressure of each layer group is calculated, respectively. Then, Kriging algorithm based on GA optimization SVM parameters established in Section 2.2 is used to calculate the theoretical variation function. Taking LLH group as an example for specific calculation, the parameter values are shown in Table 2, and finally the SVM based variogram regression fitting results are obtained. After theoretical calculation, it is found that the variogram fitting goodness coefficient of Kriging algorithm based on GA optimized SVM parameters
3. Based on the algorithm in this paper, the formation pressure of 7 adjacent wells is transplanted to the depth of the target well to be drilled, and then the spatial interpolation curve of the pressure of the target well to be drilled is obtained on the basis of comprehensive consideration of the geological structure of the block. Similarly, the formation pressure of any virtual well in the area can be obtained by the above method, and the 3D model of the formation pressure of the target layer group is constructed based on the pressure interpolation result of the virtual well. The 3D visualization of the model is realized by programming. Based on this method, the 3D formation pressure model mean value and variation coefficient of LLH formation is constructed, and the results are shown in Figs. 5 and 6.
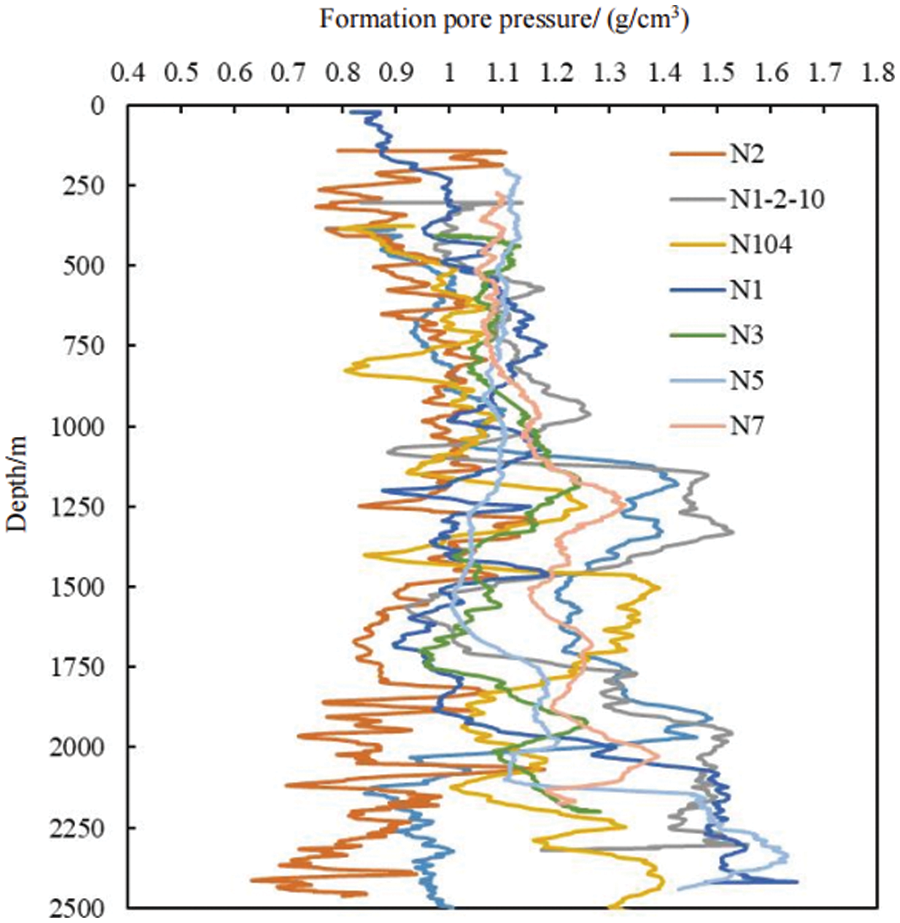
Figure 4: Profile of mean formation pore pressure of drilled wells
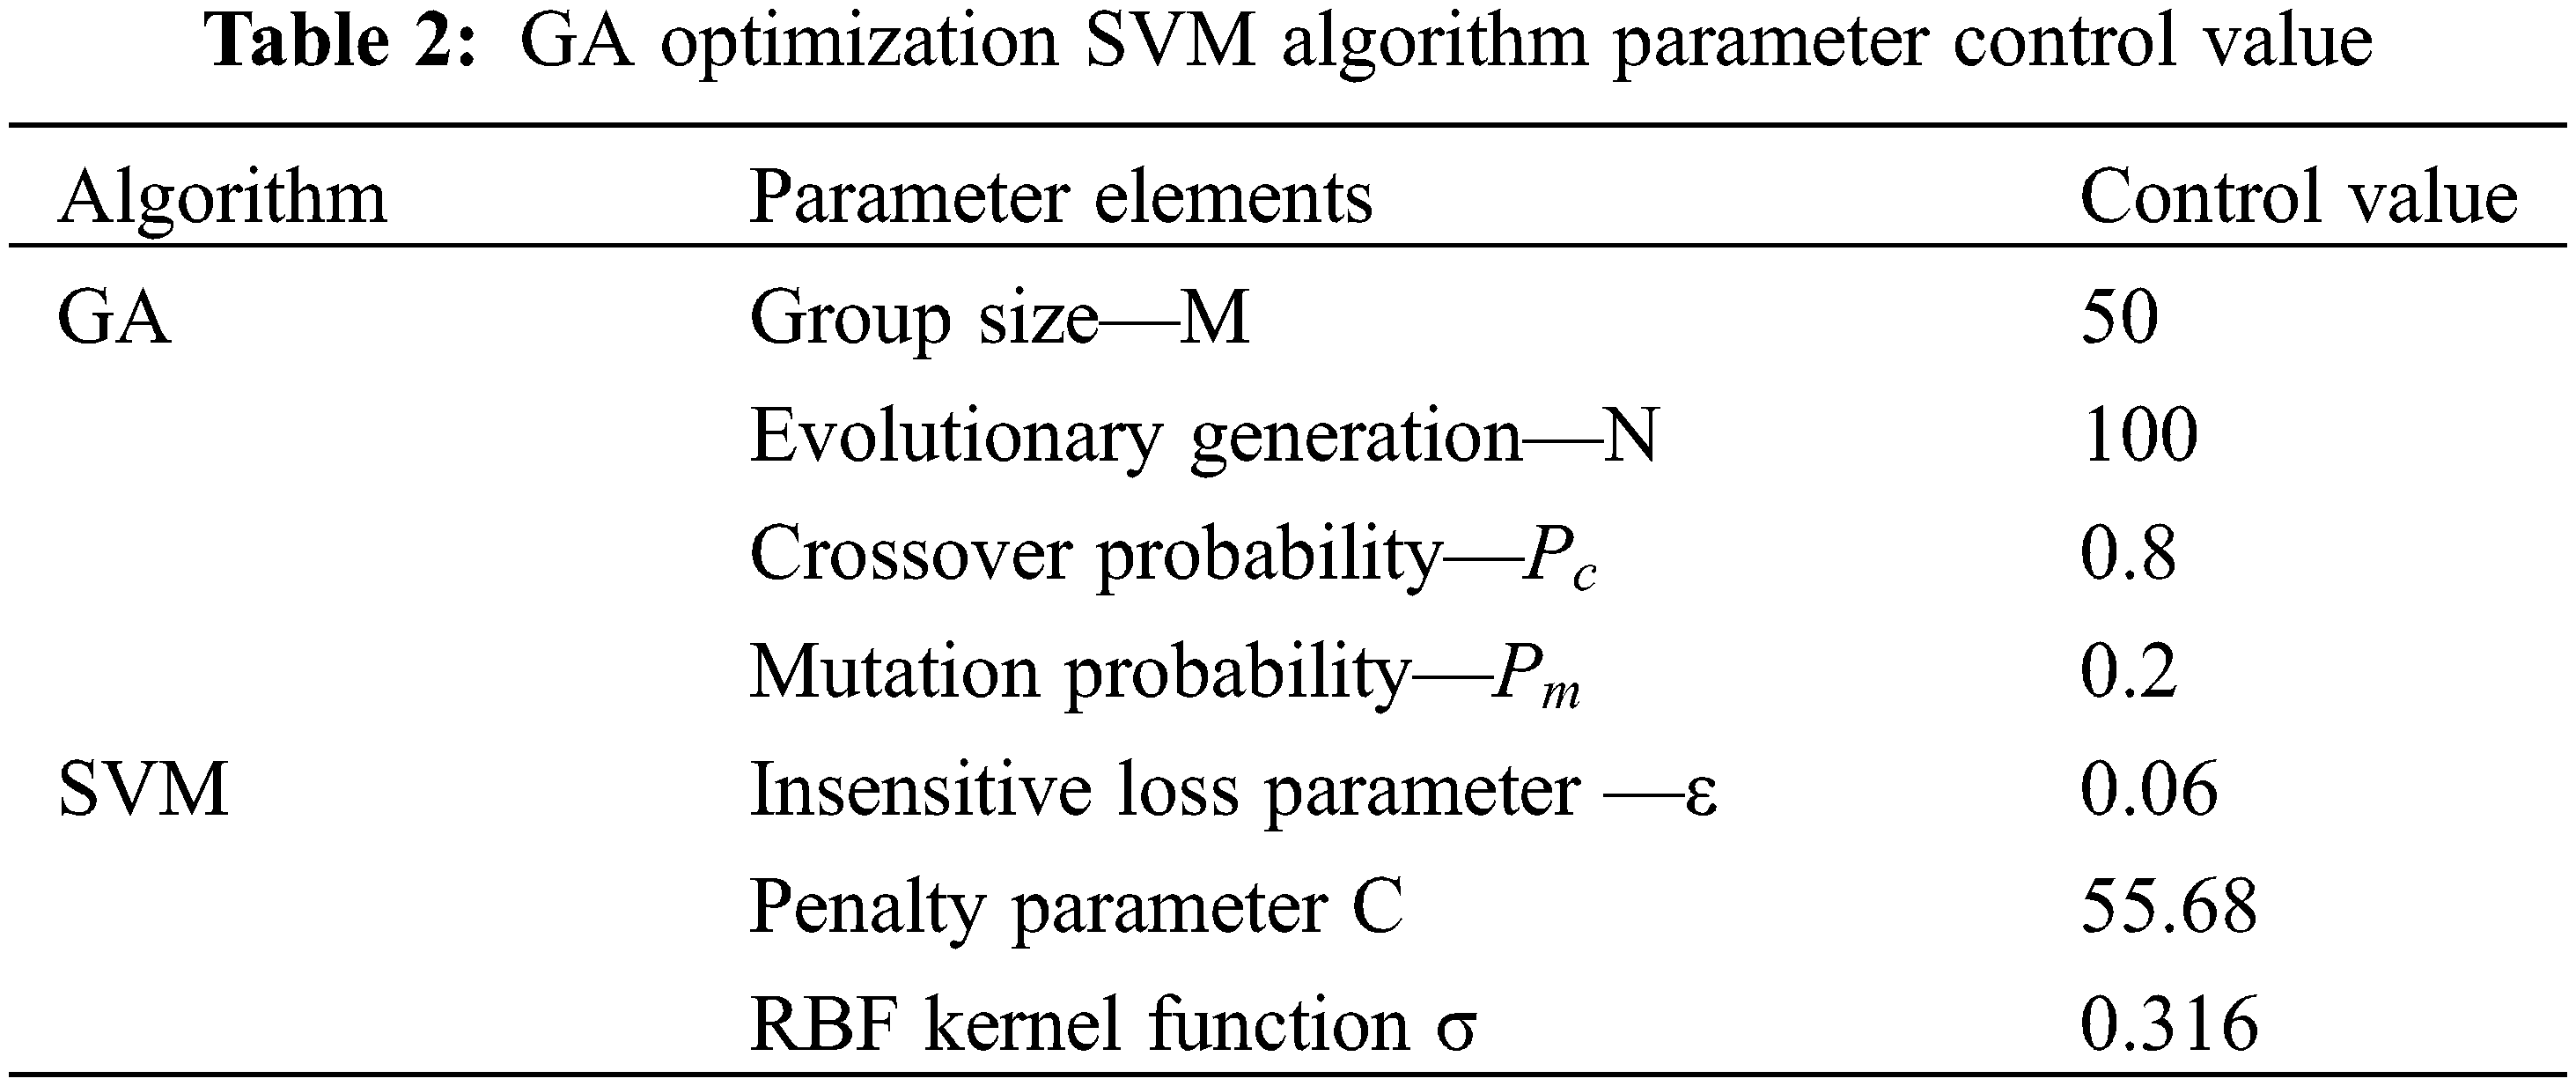
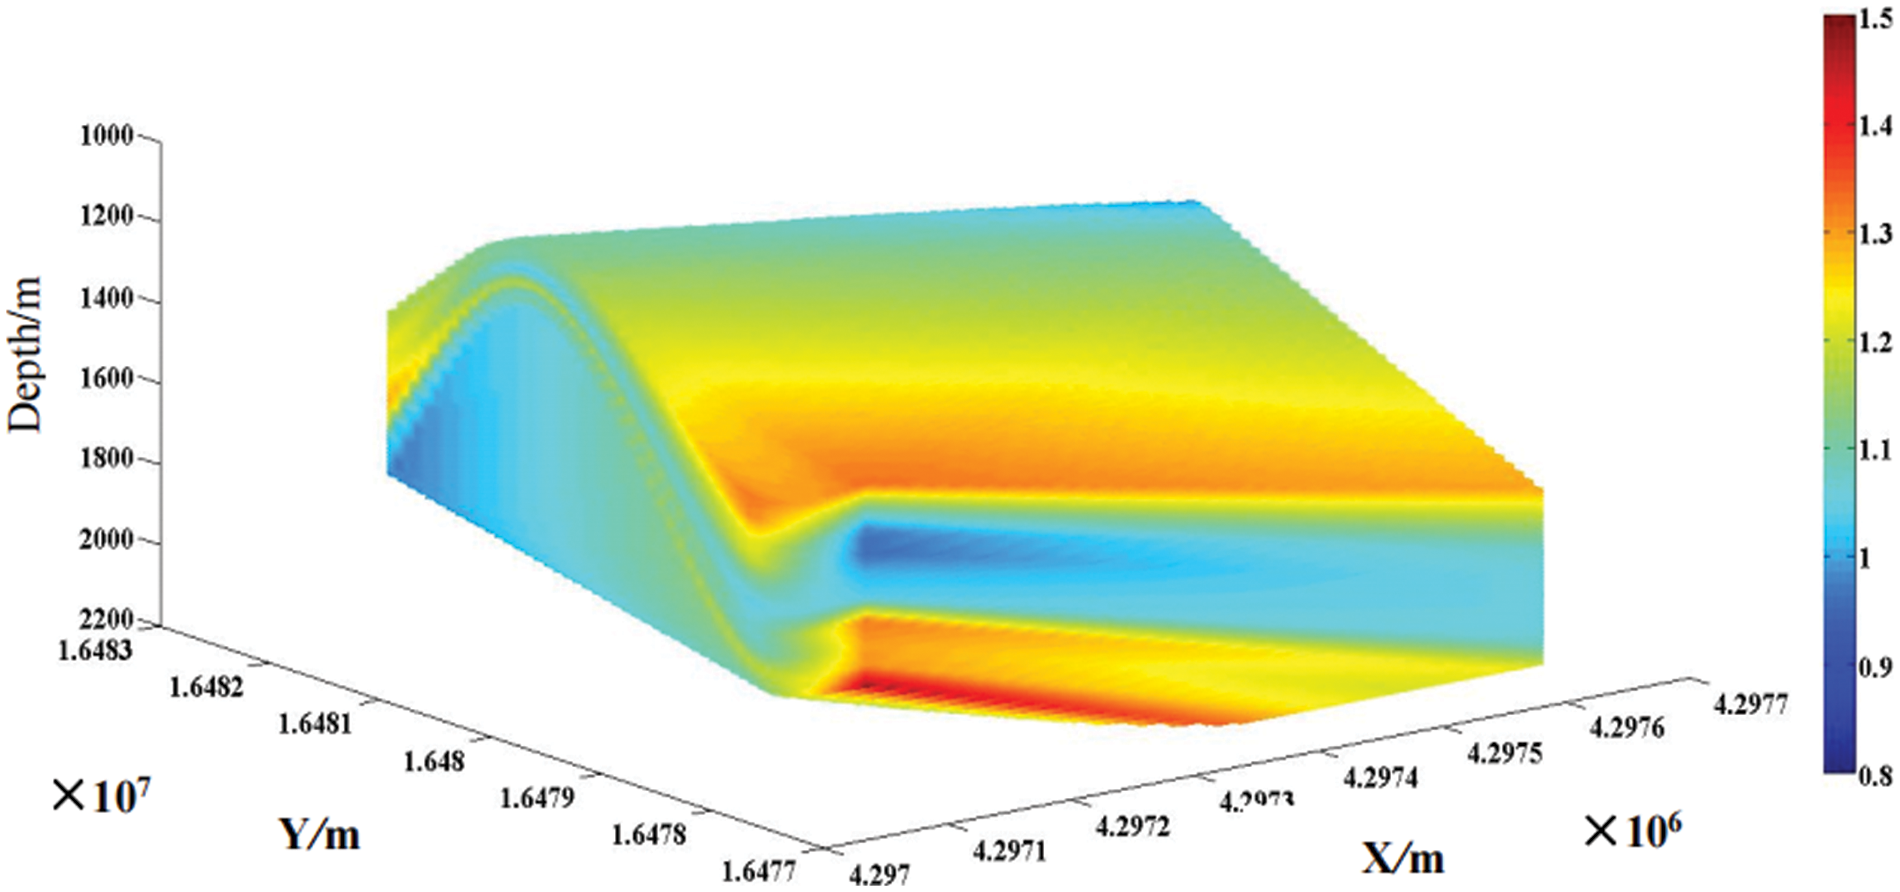
Figure 5: 3D model of spatial distribution of pore pressure in LLH layer of XX block
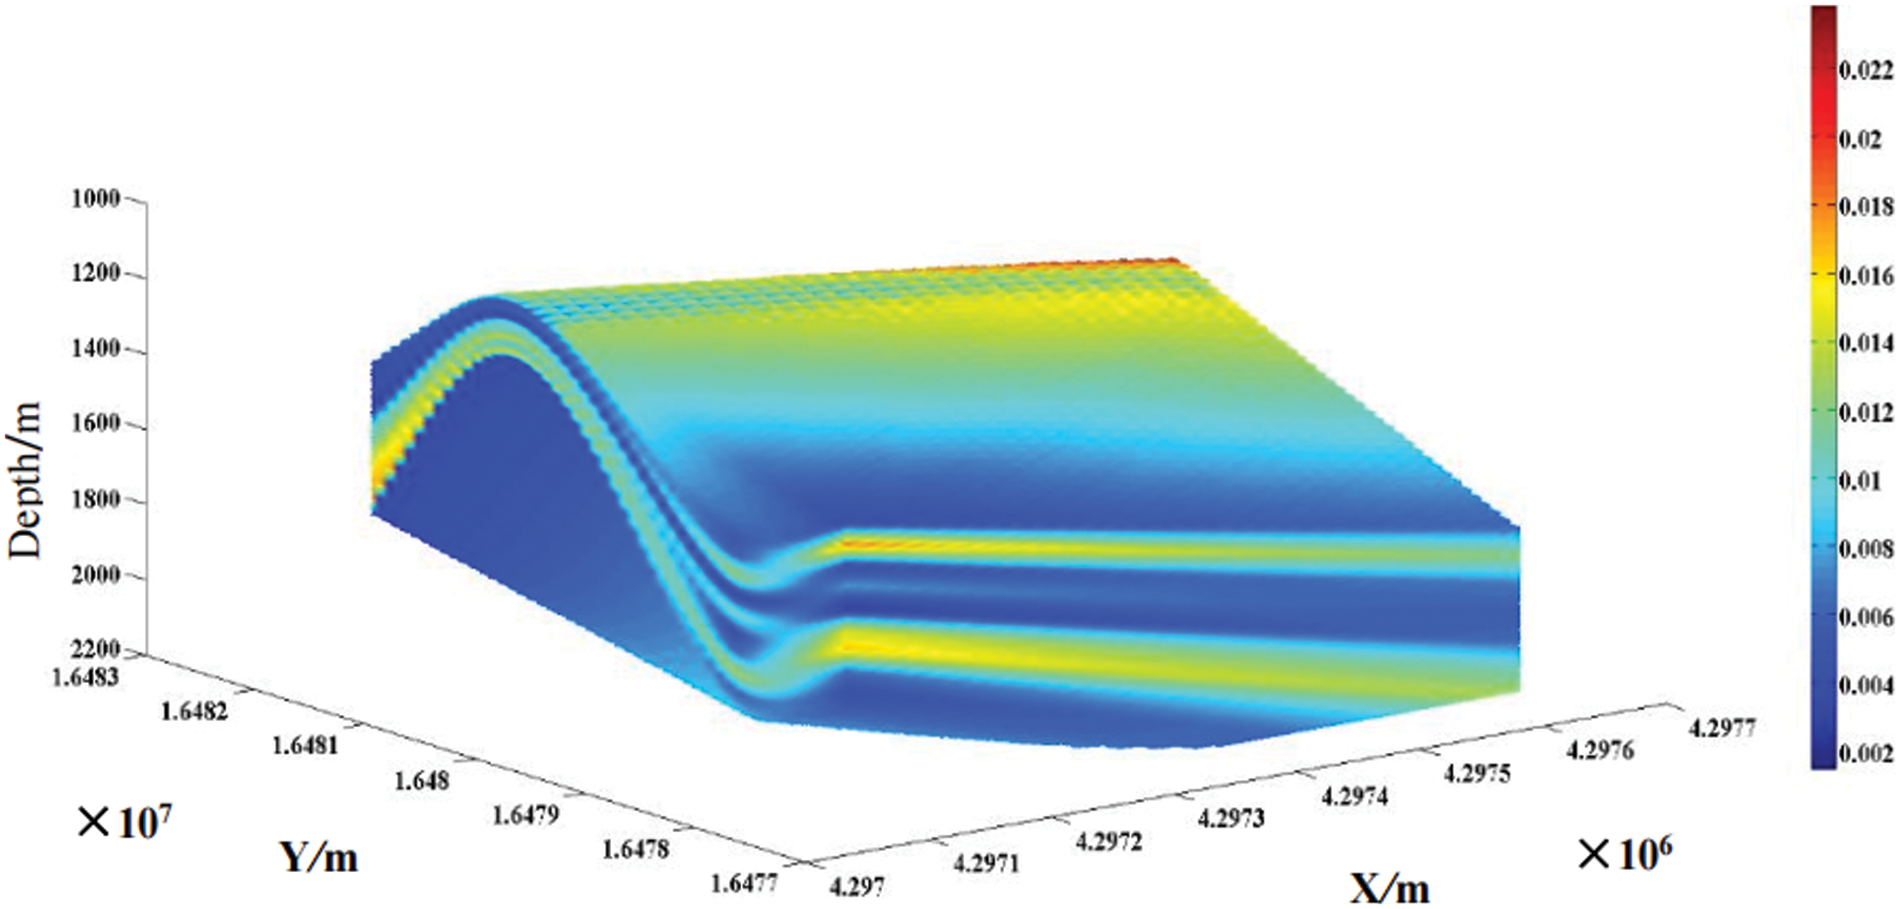
Figure 6: 3D model of spatial distribution of variation coefficient in LLH layer of XX block
a) In this paper, the method three-dimensional model for the formation pressure with uncertainty in wellbores based on the drilled well logging data is established. The 3D formation pressure of the area is constructed layer by layer based on the formation group, and the reliability of the method is verified by the calculation of an example. The algorithm of 3D model of formation pressure makes full use of the characteristics of well logging data with good continuity and high separation rate, and solves the problem of 3D formation pressure construction lack of seismic exploration data or poor seismic data quality.
b) The supporting software has been developed to realize the 3D visualization of regional formation pressure, which can display the regional formation pressure layer by layer, rotate, cut the profile arbitrarily, etc., and also can obtain any pressure profile to be drilled in the region, which provides the basis for the refined design of the well structure to be dri/lled and the drilling fluid density.
c) The accuracy of adjacent well data, the complexity of regional geological structure and the continuity of target formation are the key factors affecting the accuracy of regional formation pressure calculation. For the area with complex geological structure, it is necessary to fully grasp the geological structure and calculate the regional formation pressure by structure and block.
Funding Statement: The project is supported by Scientific Research and Technology Development Project of CNPC “Study on Exploration and Development Theory and Key Technology of Gulong Shale Oil in Daqing” (2021ZZ10-03) and Scientific Research and Technology Development Project of CNPC “Development of Integrated Software (Smart Drilling) for Drilling and Completion Engineering Design and Optimization Decision” (2020B-4019) and Scientific Research and Technology Development Project of CNPC “Integration and Experiment of Safe, Optimal and Fast Drilling and Completion Technology for Complex Ultra Deep Wells” (2020F-46) and project funded by China Postdoctoral Science Foundation “Research on the Effect of Stress Distribution Difference on Acoustic Propagation Characteristics in Drill String” (2021M693508).
Availability of Data and Materials: The data that support the findings of this study are available from the corresponding author upon reasonable request.
Conflicts of Interest: The authors declare that they have no conflicts of interest to report regarding the present study.
References
1. Jiang, X. (2006). Drilling accidents and complex problems. China: Petroleum Industry Press. [Google Scholar]
2. Bian, C. S. (2009). Integrated approach for predicting abnormal formation pressure and its application in Ying’er Sag. Geological Science and Technology Information, 13(5), 68–89. [Google Scholar]
3. Ye, Z., Fan, H., Ji, R. (2014). Investigation and application of pore pressure monitoring method based on LWD data. Petroleum Drilling Techniques, 42(2), 41–45. [Google Scholar]
4. Sayers, C. M., Boer, L. D., Nagy, Z. R. (2006). Well-constrained seismic estimation of pore-pressure with uncertainty. Seg Technical Program Expanded Abstracts, 25(1), 1530–1542. [Google Scholar]
5. Doyen, P. M., Malinverno, A., Prioul, R. (2003). Seismic pore-pressure prediction with uncertainty using a probabilistic mechanical earth model. SPE 20031366.Houston, USA. [Google Scholar]
6. Sayers, C. M., Woodward, M. J., Bartman, R. C. (2000). Predrill pore-pressure prediction using seismic data. Geophysics, 67(4), 1286–1294. https://doi.org/10.1190/1.1500391 [Google Scholar] [CrossRef]
7. Fan, H., Ye, Z., Ji, R. (2011). Investigation on 3D overburden pressure calculation method. Chinese Journal of Rock Mechanics and Engineering, 30(2), 3878–3883. [Google Scholar]
8. Cibin, P. M., Mantovani, M., Moglia, A. (2011). Pore pressure prediction from Vp/Vs ratio volumes. Studies in Surface Science & Catalysis, 138(11), 267–274. https://doi.org/10.3997/2214-4609.20149176 [Google Scholar] [CrossRef]
9. Li, L., Wang, Y. (2006). Review of application of geostatistics. Progress in Exploration Geophysics, 29(3), 163–169. [Google Scholar]
10. Li, H. (2005). Support vector machine regression algorithm and its application. China: South China University of Technology. [Google Scholar]
11. Rumpf, T., Mahlein, A. K., Steiner, U., Oerke, E. C., Dehne, H. W. et al. (2010). Early detection and classification of plant diseases with support vector machines based on hyperspectral reflectance. Computers and Electronics in Agriculture, 74(1), 91–99. https://doi.org/10.1016/j.compag.2010.06.009 [Google Scholar] [CrossRef]
12. Wang, H., Zhang, R., Liu, W. (2011). Kriging interpolation method optimized by support vector machine and its application in oceanic data. Transactions of Atmospheric Sciences, 34(5), 567–573. [Google Scholar]
13. Guan, Z., Wei, K. (2013). Establishing the formation pressure profile of predrilling well based on adjacent wells data. Journal of China University of Petroleum, 37(5), 71–75. [Google Scholar]
14. Ke, K., Guan, Z., Zhou, H. (2009). An approach to determining predrilling formation pore pressure with credibility for deep-water exploration well. Journal of China University of Petroleum (Natural Science Edition), 33(5), 61–67. [Google Scholar]
15. Sheng, Y., Guan, Z., Zhao, T. (2016). Study on method of determining the formation pressure with credibility. Science Technology and Engineering, 16(2), 37–42. [Google Scholar]
16. Shi, X. (2007). Application of petrel software to 3D fine geologic modeling. Xinjiang Petroleum Geology, 28(6), 763–774. [Google Scholar]
Cite This Article
 Copyright © 2023 The Author(s). Published by Tech Science Press.
This work is licensed under a Creative Commons Attribution 4.0 International License , which permits unrestricted use, distribution, and reproduction in any medium, provided the original work is properly cited.
 Downloads
 Citation Tools