
 Submit a Paper
 Propose a Special lssue
 Open Access
ARTICLE
Load-Aware VM Migration Using Hypergraph Based CDB-LSTM
1 School of Computing, SASTRA Deemed-to-be University, Thanjavur, 613401, Tamilnadu, India
2 Center for Information Super Highway (CISH), School of Computing, SASTRA Deemed-to-be University, Thanjavur, 613401, Tamilnadu, India
* Corresponding Author: V. S. Shankar Sriram. Email:
Intelligent Automation & Soft Computing 2023, 35(3), 3279-3294. https://doi.org/10.32604/iasc.2023.023700
Received 17 September 2021; Accepted 04 November 2021; Issue published 17 August 2022
 View Full Text
 Download PDF
Abstract
Live Virtual Machine (VM) migration is one of the foremost techniques for progressing Cloud Data Centers’ (CDC) proficiency as it leads to better resource usage. The workload of CDC is often dynamic in nature, it is better to envisage the upcoming workload for early detection of overload status, underload status and to trigger the migration at an appropriate point wherein enough number of resources are available. Though various statistical and machine learning approaches are widely applied for resource usage prediction, they often failed to handle the increase of non-linear CDC data. To overcome this issue, a novel Hypergrah based Convolutional Deep Bi-Directional-Long Short Term Memory (CDB-LSTM) model is proposed. The CDB-LSTM adopts Helly property of Hypergraph and Savitzky–Golay (SG) filter to select informative samples and exclude noisy inference & outliers. The proposed approach optimizes resource usage prediction and reduces the number of migrations with minimal computational complexity during live VM migration. Further, the proposed prediction approach implements the correlation co-efficient measure to select the appropriate destination server for VM migration. A Hypergraph based CDB-LSTM was validated using Google cluster dataset and compared with state-of-the-art approaches in terms of various evaluation metrics.
Keywords
Over the past few years, Cloud Computing [1], has emerged as a new computing paradigm, offering its users with dynamically scalable services at flexible prices [2]. Owing to its flexibility, it is widely used in hosting and delivering IT services [3]. Cloud Computing works on the principle of virtualization of resources with on-demand and pay-as-you-go model policy [4]. Although the concept of virtualization increases resource utilization, the operating cost of cloud still increases gradually owing to the over consumption of electrical energy and intensification of VMs. Thus, live VM Migration has become an efficient approach in managing cloud resources by enabling administrators to transfer VM between two physical machines without service disruption.
Live VM migration provides uninterrupted cloud services during VM consolidation [5,6] which also upholds fault tolerance, load balancing and minimizes Service Level Agreement (SLA) breaches [7,8]. However, it is essential to perceive CPU utilization, memory, disk and power consumption for preventing resource wastage [8]. Also it enables the end-users to experience the cloud resources without break. Live VM migration approach provides an energy efficient cloud environment by integrating normal loads of multiple servers on a few physical machines and put in an energy saving mode for the idle servers [9,10]. While performing live VM migration, CDC workload parameters such as CPU, Disk and memory utilization plays a vital role and envisaging those parameters for the upcoming workload, still remains an open challenge [11], as the CDC workload parameters are highly dynamic and non-linear in nature [12,13]. Thus, determining the workload parameters for live VM migration can be viewed as a prediction problem as it predicts the upcoming workload parameters in advance [14,15].
Recent research works reveal that Deep Learning (DL) approaches yield prolific solutions in the field of predictive analytics [16]. Among the existing DL approaches, Long Short-Term Memory (LSTM) is one of the promising approaches for handling the ever-growing CDC data [17]. LSTM relies on Recurrent Neural Network (RNN) architecture which yields higher accuracy with lesser complexity [18]. However, a standard LSTM still suffers due to vanishing and exploding gradient problems while handling massive amount of data, memory bandwidth and overfitting. To overcome the setbacks, dimensionality reduction techniques are applied in the recent studies. Among the dimensionality reduction techniques, Hypergraph is found to be an appropriate mathematical tool as it captures the n-ary relationship among the high dimensional elements [19]. However, to the best of authors’ knowledge very few have attempted hypergraph for solving the aforementioned setbacks and the complete significance of hypergraph remains unexploited. Due to enormous data generation by CDC with highly fluctuating resource usage, the conventional prediction models may take more extensive operational time to predict the larger-scale cloud data. Thus, to address these limitations, this article presents a novel prediction-based live VM migration scheme by incorporating the benefits of Bi-LSTM [17,20], and Hypergraph. The aim of this study is to design a prediction based live VM migration process, which reduces unwanted migrations thereby preventing resource wastage and the major contributions of this article are as follows:
1. This work proposes an integrated resource usage prediction algorithm using three major attributes like CPU, RAM, and DISK usage by integrating the Hypergraph based Convolutional layer with Deep Bi-LSTM (CDB-LSTM) model
2. The application of Helly property of hypergraph for selecting the informative samples enhance the performance of LSTM by minimizing the computational complexity and adopted the SG filter [21] to exclude noisy inference and outliers
3. Hypergraph based CDB-LSTM performs better than predictive analytics thereby identifying the sudden spikes of cloud resource usage
4. The correlation based destination server selection has been carried out
5. The proposed model is validated using Google cluster dataset and evaluated in terms of error metrics: RMSE, R2, MAE, and MAPE.
The remaining sections are organized as follows, Section 2 deals with the recent research works on live VM migration schemes. Section 3 describes the proposed methodology and phases involved in the proposed methods, Section 4 presents the experimental results and discussions of the proposed technique and Section 5 concludes the paper with future work.
Cloud Service Providers (CSPs) provide a wide range of services that encourage consumers to use cloud services that results in increased demand for resources. As a result, accurate resource forecasting has become an inevitable component in avoiding SLA breaches and server breakdowns [17]. Researchers have contributed models or algorithms that use statistical, machine learning, and deep learning approaches to anticipate resource usage. The above-mentioned techniques fall into one of two types: linear data prediction or non-linear data prediction [17] and are discussed below.
Most of the statistical techniques are fit for linear pattern prediction models. The popular time-series linear prediction models are Moving Average (MA), Autoregressive Moving Average (ARMA), Autoregressive Integrated Moving Average (ARIMA), Exponential Smoothing (ES), and its variants. This section presents the various research works carried out using statistical techniques with respect to the time series data for resource usage prediction. Dinda [22], developed a predictive framework for CPU load forecast using CPU logs. The righteousness of the proposed system was evaluated using an array of statistical models like MA, Auto Regressive (AR), and ARMA and concluded that AR is suited for the chosen dataset. Subirats et al. [23], proposed an ensemble approach-based energy-efficient prediction algorithm to identify the future status. It includes resources of virtual machines, infrastructure, and service level of the cloud data center environment. The model comprises of four unique statistical prediction methods: ES, double ES, MA, and Linear Regression (LR) for resource prediction. The final output as future predicted usage of each VM resource was obtained with the lowest average absolute error. As an evolution in the statistical time series forecasting and analysis approaches, the integration of advantages of AR and MA contributed generously to the development of a hybrid technique called ARIMA [24,25]. Due to several benefits of ARIMA, it has been used as a forecasting model for various applications and achieved better results. ARIMA has been used as either a single or a hybrid technique for forecasting. However, as a statistical approach, ARIMA is not able to forecast the data in a nonlinear fashion. Hence, various hybrid models and machine learning-based prediction strategies are evolved.
2.2 Machine Learning Techniques
Machine Learning (ML) techniques are successfully implemented for the diverse applications (Bioinformatics, Cloud Computing, Cyber Security, etc). Regression techniques act as an appropriate solution for the time series forecasting problems. Generally, neural networks can handle non-linear and non-stationary data, which is a significant drawback in statistical techniques. Few ML regression-based studies are explored: Baldan et al. [13], proposed an integrated model with a neural network for error correction and workload prediction using linear regression models. Lu et al. [26], proposed a back propagation-based workload prediction model for a data center named Rand Variable Learning rate Backpropagation Neural Network (RVLBPNN). RVLBPNN has been evaluated to prove the proficiency of the model in predicting the latency-sensitive task using Google cluster trace. Nevertheless, RVLBPNN fails to incorporate the periodicity effects of the workload behavior which enhances the prediction accuracy. A Bayesian model-based predictive framework [27], was developed to forecast whether the application is CPU intensive or memory intensive. Hsieh et al. [28], proposed a model for dynamic VM consolidation by forecasting CPU utilization using Gray–Markov model. Gray forecasting model does not requires massive volume of training data to forecast, but fails to forecast correctly when the occurrence of fluctuation is higher. Authors in [29], proposed an SVR-based predictive framework and applied Sequential Minimal Optimization Algorithm (SMOA) for the training and regression estimation of the prediction method and increases the accuracy. However, the comparison of the proposed system have utilized a single resource-based prediction strategy. The above-stated Machine learning-based time series forecasting models are not sufficient to process or handle the huge datasets. Henceforth, there is a necessity to use deep learning techniques for resource usage prediction, energy-demand forecast, etc.
Apart from conventional methods, deep learning approaches are explored much in recent times [30–32] for time-series prediction. Deep learning models are good at analysing the hierarchical and distributed features that reside in data nonlinearity. Bi et al. [33], incorporated a standard LSTM model to predict the workload of a data centre. As a pre-processing technique, the SG filter is incorporated to smoothen the workload series. Since the standard LSTM method is adopted, that fails to obtain considerable gain in prediction accuracy. Miao et al. [34], developed an intelligent task prediction model using LSTM for offloading the computation to mobile edge computing environment. This model fails to focus on choosing the precise destination based on optimal resource rich server. In [35], a prediction technique is developed that examines the dependency in a large-scale system and builds two separate time series models depending on day and time. Using two-dimensional time series information, an improved LSTM model is suggested for forecasting future workload. Gupta et al. [36], enhanced the LSTM and added the gradient descent approach to the prediction model to estimate online cloud load. However, the finding overlooks the fact that in the process of cloud load forecasting, the gradient descent approach necessitates more iterations to adjust model parameters and a longer training period. Pham et al. [31], incorporated fuzzy recurrence plots with LSTM for time series data. This model precisely determines the system's characteristics by increasing the feature dimension for very short time-series data. Further, the variants of LSTM such as GridLSTM [37], Bi-directional LSTM (Bi-LSTM) [38], and convolutional LSTM [39] are evolved and the vital difference between the variants lies in connections in the LSTM. Danihelka et al. [37], proved that, in recollecting the digital sequences, 2D GridLSTM outperforms over stacked LSTM as the multidimensional time-series data. However, an accurate prediction could be achieved by processing the historical and future information together using Bi-LSTM. Few researchers proposed predictive frameworks using Bi-LSTM [40]. As a variant to Bi-LSTM, deep Bi-LSTM has been evolved to improve the accuracy [41]. Hanson et al. [42], proposed a deep Bi-LSTM model to predict intrinsic protein disorders. The solution obtained from the prediction model helps in inspecting the long-range interactions in bioinformatics applications. Authors [17], implemented deep Bi-LSTM with GridLSTM to predict the cloud resource requirements. The proposed system in [17], fails to focus on spatiotemporal properties on the cloud utilization data. Authors in [41], proposed a deep Bi-LSTM model to forecast the load in advance but failed to address spatiotemporal issue. Though the researchers used deep configuration to predict load rather than peak load and manage the spatiotemporal issue, it is observed from the literature that, deep LSTM models failed to enhance the accuracy compared to deep Bi-LSTM. The above conclusion made us focus on hybridizing the benefits of Convolution and deep Bi-LSTM layers.
Handling the massive amount of CDC data remains a challenging task during VM migration. It is quite evident from the literature that the performance of deep learning model increases as the data grows.
Thus, to forecast the CDC data, CDB-LSTM is proposed. However, if the data grows the computational complexity of Bi-LSTM increases which is a trade-off. Henceforth for efficient VM migration, a novel Hypergraph based CDB-LSTM is proposed which reduces the computational complexity. Capturing the n-ary relationship among data attributes using Hypergraph pave the way for the proposed system to work efficiently. By keeping the informative samples identified by the Hypergraph, the proposed Hypergraph based CDB-LSTM for VM migration can attain a high success rate with low computational complexity. Fig. 1 illustrates the proposed framework with four modules, 1. Informative sample extraction, 2. Convolutional deep Bi-LSTM, 3. Load classification, and 4. Trigger Migration.
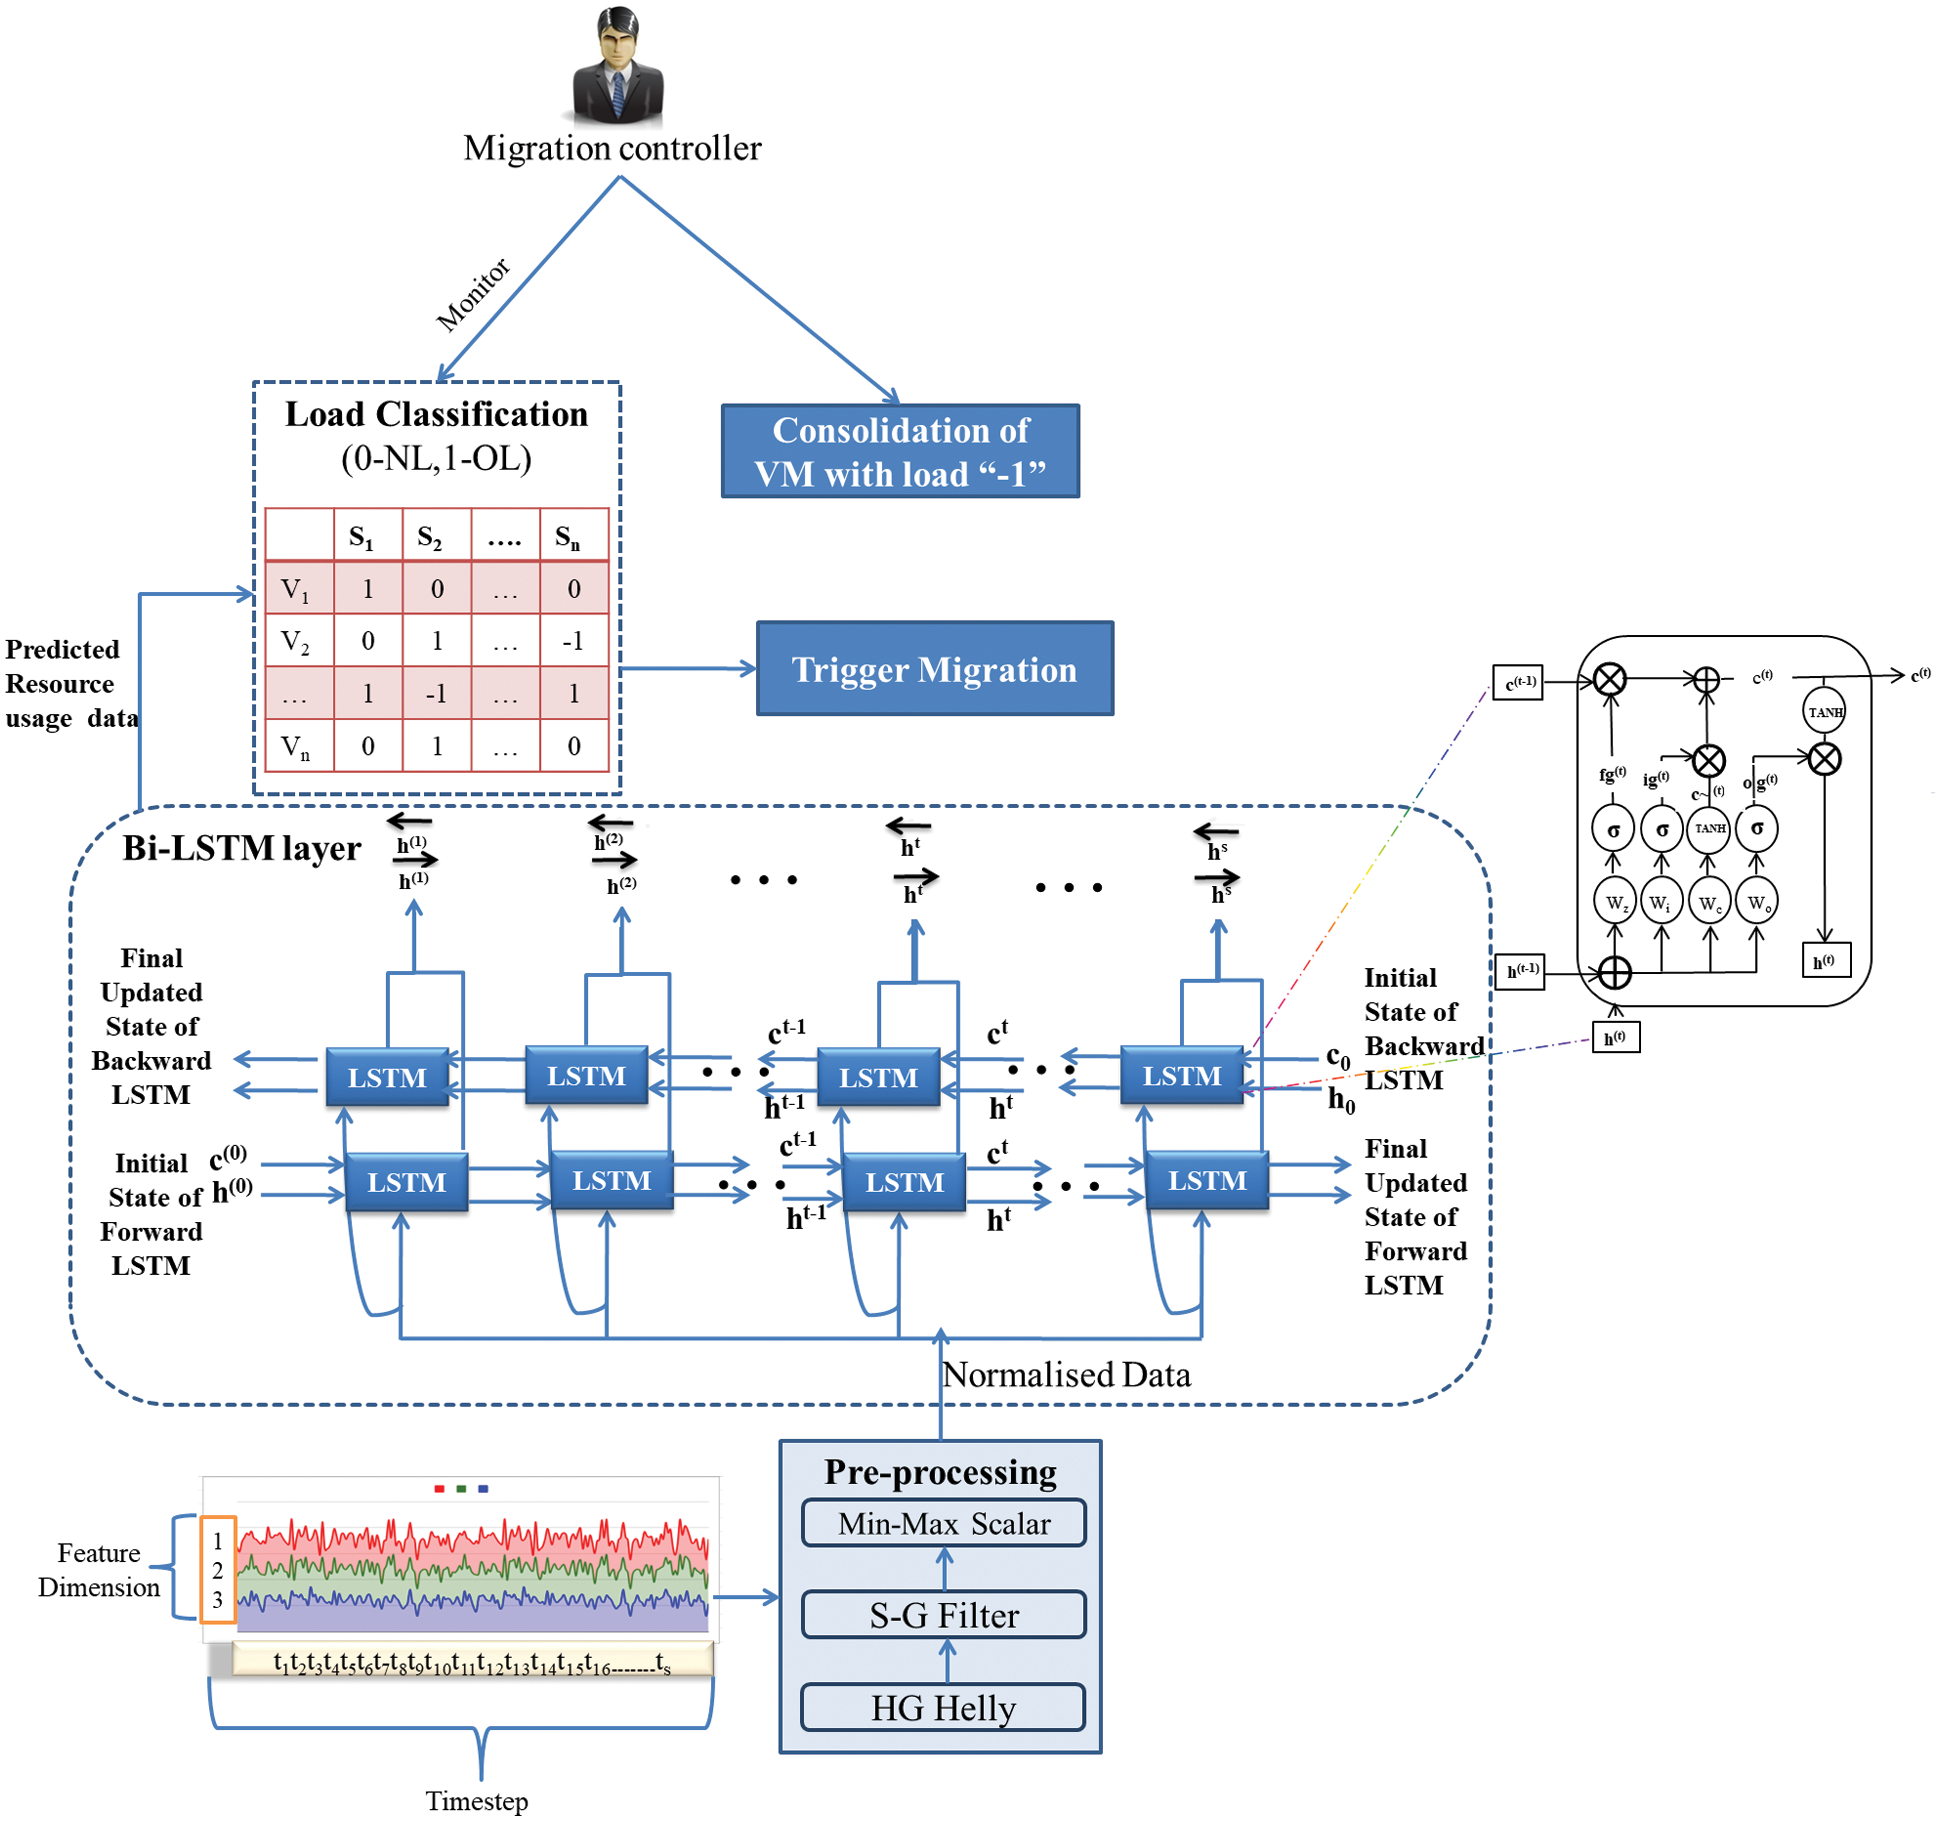
Figure 1: Proposed framework of Hypergraph based CDB-LSTM
3.1 Informative Sample Extraction Using Hypergraph–Helly Property
As an initial step, the application of Helly property in hypergraph was used to extract informative samples from the Google cluster dataset. The informative sample selection using Helly property is indigenously built from which the samples that satisfies Helly property is taken as training exemplars for the proposed deep learning model. Three features of proposed system are represented in the form of triplet
3.2 Convolution Deep Bi-directional Long Short Term Memory (CDB-LSTM)
The extracted features are treated as an input for CDB-LSTM. The Bi-LSTM network executes the input sequence using two unidirectional LSTM stacked up and down for both forward and backward pass and double the number of memory cells [43]. Consequently, separate hidden states
where, σ represents the operations of addition, multiplication, and concatenation (or average)
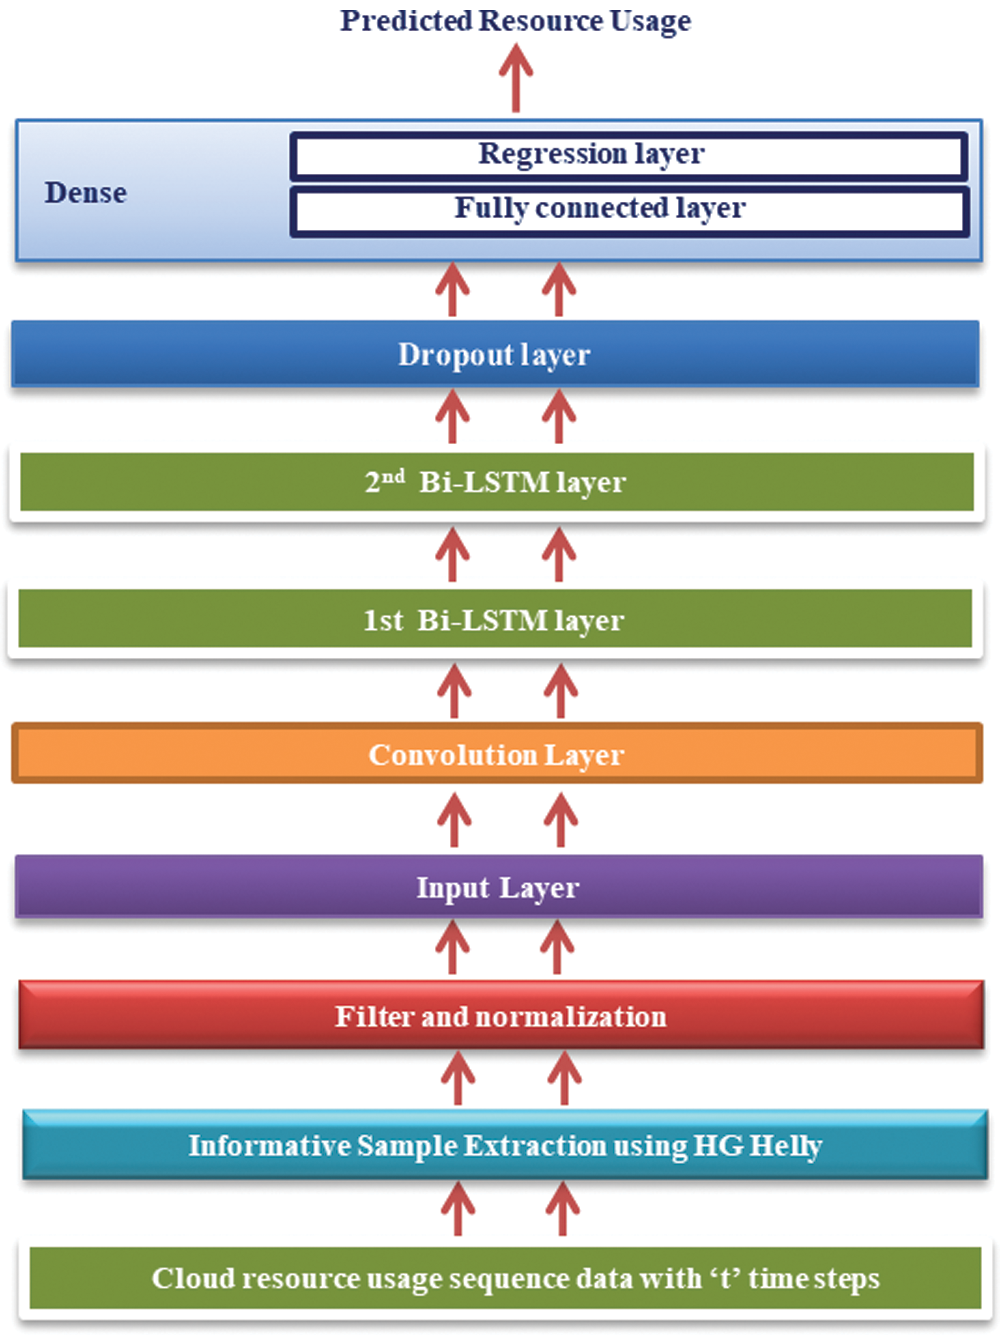
Figure 2: Layer representation of CDB-LSTM
The normalized output is fed to the input layer in a resource matrix with “t” time steps. Next, this resource usage sequence data is given to the convolution layer, which aims at extracting spatiotemporal features.
Here, we employed a one-dimensional convolution kernel filter to obtain the local perceptual domain. The computational process of the convolutional kernel can be written as
where
where,
1. The terms at timestamp
2. The terms at timestamp
3. The terms at termstimestamp
4.
5.
To explore the periodic features of the resource usage time series data, the temporal output information is associated with a hypergraph based convolutional deep Bi-LSTM network for precise prediction. Then, the dropout layer ensures the establishment of model generalization and avoidance of overfitting. Finally, the mapping of input resource usage to the output future demand forecast is accomplished by a fully connected and regression layer, collectively known as a dense layer.
3.3 Load Classification: Server Load Clustering
This section briefly explains the method used for server clustering based on the threshold value of VM resources (Algorithm 1). For server allocation, load migration controller observes the load handled by the servers for the determination of VM resource usage rate. The challenge occurs when there is a lack in server maintenance while allocating the resources. To address this issue, the classification of predicted workloads is carried out by formulating the server cluster table as presented in Tab. 1.

The Tab. 1 is generated based on three VM resources (C-CPU, R-RAM, and D-Disk usage). The threshold value ‘t’ is considered based on the resource original capacity (CAP). The threshold value for the VM resources is categorized into the range of 25%–85% (Upper and lower threshold limits are estimated to adjust the tradeoff between resource wastage and the number of migrations). The VM resources are presented as

3.4 Trigger Migration-Destination Server Selection using Correlation Measure and VM Consolidation
3.4.1 Destination Server Selection using Correlation Measure
The server cluster table is used to analyse the future load status of each server. The server is identified as overloaded when the predicted VM resource entry is N (1). To select the appropriate VM from its host server, consumes high resources. Therefore, all the VMs resource values are sorted in descending order and the higher-order VM is chosen to resolve the problem of server failure as mentioned in the Eq. (8). Further, the process relies on finding the correlation between the resources. So, Pearson Correlation Coefficient is applied for choosing a suitable destination server. It predicts the value between –1 and 1 with the interpretation, if a value that is greater than 1 indicates it is highly correlated, whereas –1 indicates no correlation between the resources.
where
The correlation value is determined using the prediction value for the selected VM to be migrated (Eq. (8)) and the residual capacity from each normal loaded server. Thus, the highly correlated values represent the availability for future overloaded VM to avoid the accommodation of one or more heavily running VM in overloaded servers that may trigger unnecessary migrations. The predicted usage and free space of each server is expressed as in Eqs. (9) and (10)
where ‘
If the correlation
The significant issue of the CDC is resource wastage that results in unnecessary power usage. Therefore, the objective of this module is to classify underloaded VMs (Algorithm 2). Underloading occurs when all three VM resources were less than 10% of their capacity. Then the server is selected with the value N (−1), and triggers the VM in idle mode to migrate the VMs to servers with a higher number of N (0). As a result, the VM consolidation improves the energy efficiency of the system by allocating the unconsumed cloud resource usage to the desirable servers even at peak hours. This module decreases superfluous force utilization and uses the resources in an enhanced way.

The proposed hypergraph based CDB-LSTM is simulated using Cloudsim 3.0.3, Java-based toolkit with the Eclipse Oxygen (4.7)-an Integrated Development Environment (IDE) platform on an Intel® Core™ i5-4200U CPU, 8 GB RAM, and 1.6 GHz processing speed to test the efficacy of the proposed model.
This section demonstrates the evaluation metrics in terms of learning model metrics and migration metrics.
• Mean Square Error (MSE): Determined by computing the average of square of true and predicted values from all the samples in a dataset
• Root Mean Square Error (RMSE): Calculated from the standard deviation of the error
• Mean Absolute Error (MAE): Consider the average of difference between the true and predicted values from all the samples in a dataset and generates the output
• Mean Absolute Percentage Error (MAPE): An estimation technique to measure the prediction accuracy in terms of percentage
• R2: Determine how well a model fits in the dataset.
• Number of Migrations: One of the key migration metrics, the number of migrations implies the total number of VMs, which are transited from the source physical server to the targeted physical server. It is always desirable to have smaller number of migrations in a cloud environment
• Energy Consumption: Energy Consumption (EC) is defined as the power consumption at time
where,
4.2 Dataset Description, Simulation Environment and Pre-Processing
Google Cluster Dataset (GCD) [44] has been traced for 29 days. The GCD workload compromises 670000 jobs,each job with one or more tasks, and the 670000 jobs totally contains 40 million task events. This traced database is publicly available, and from that, three attributes are taken to perform the experimental evaluation of the proposed method. The selected attributes contain information about CPU, RAM, and Disk usage.
The informative samples are extracted using helly property which reduced the dimensionality of the sample space as shown in Tab. 2.

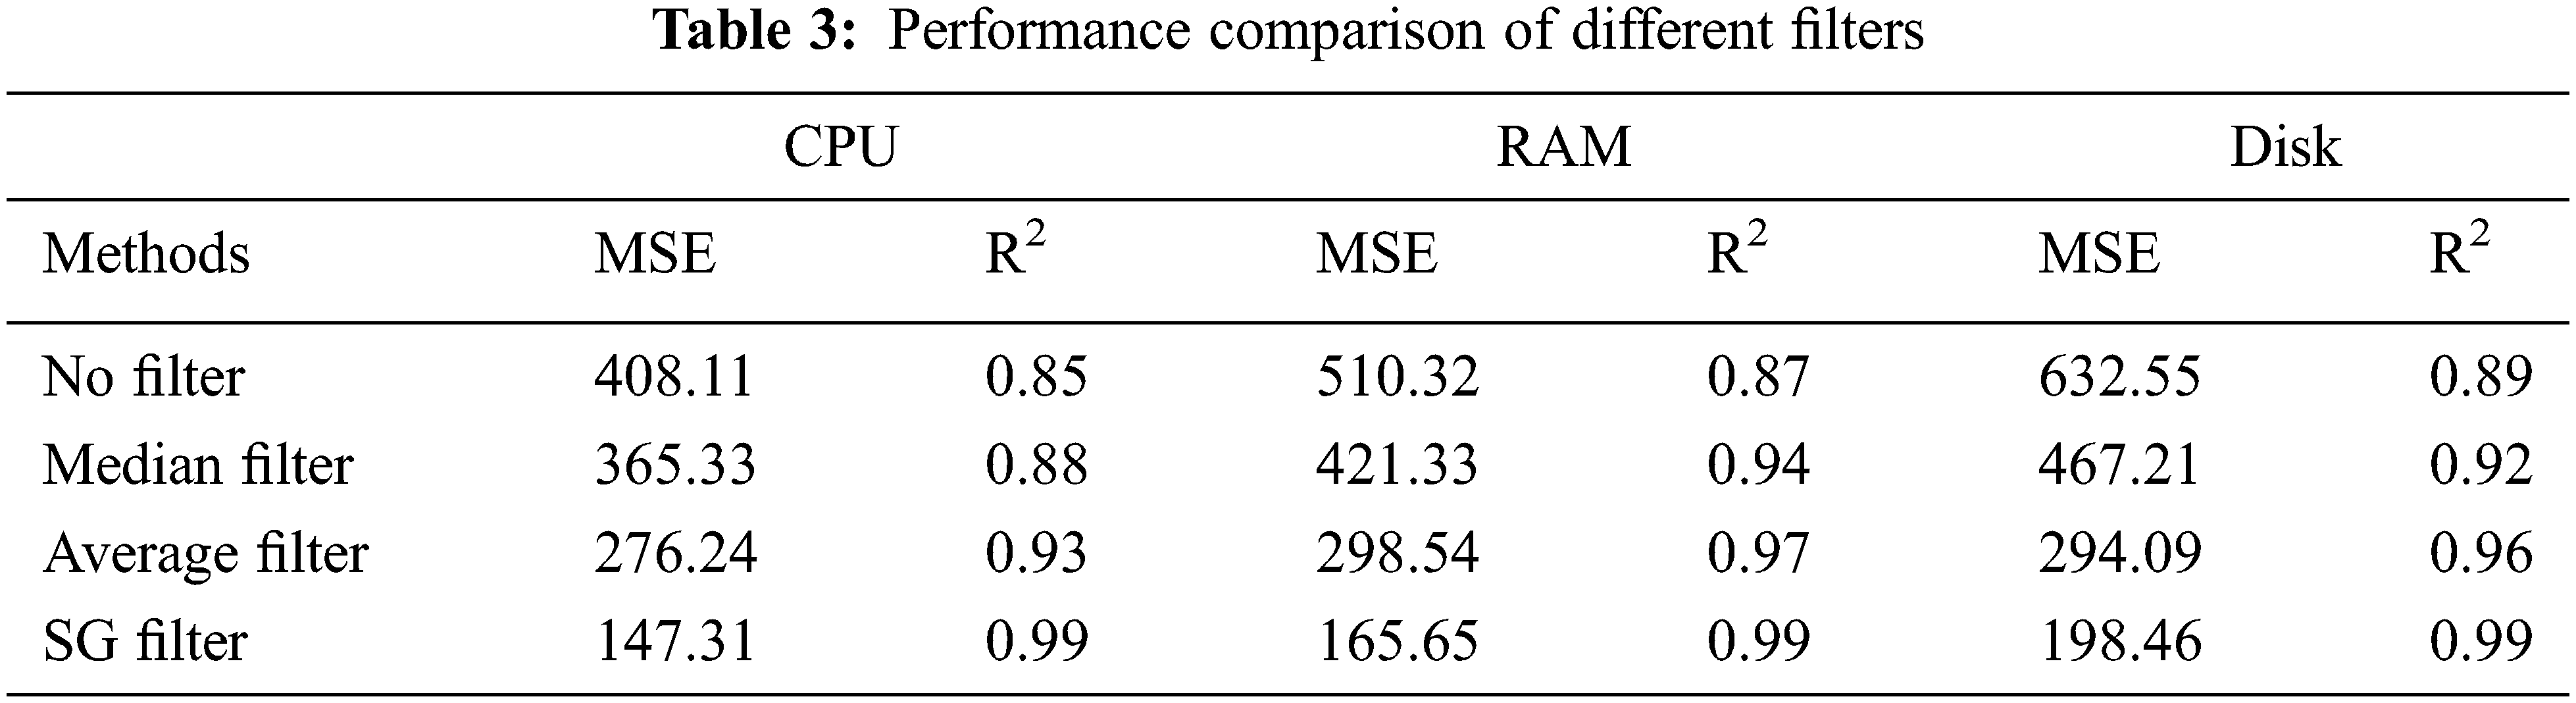
We compared different filter techniques using two major assessment metrics: MSE and R2, as shown in Tab. 3. Over the proposed model, several filtering techniques are used. It has been observed that combining the SG filter with the Hypergraph based CDB-LSTM results in improved performance when compared with all the filter techniques.
The MSE between the original data and the pre-processed data employing SG-Filter is shown in Fig. 3a. The Mean Square Error metric is used to determine the differences between the original data and the smoothed data. The presence of more substantial changes is indicated by a higher MSE score. Based on the results of this experiment, it is obvious using the SG filter with a window size of 11 resulted in a lower error value of 0.002458.
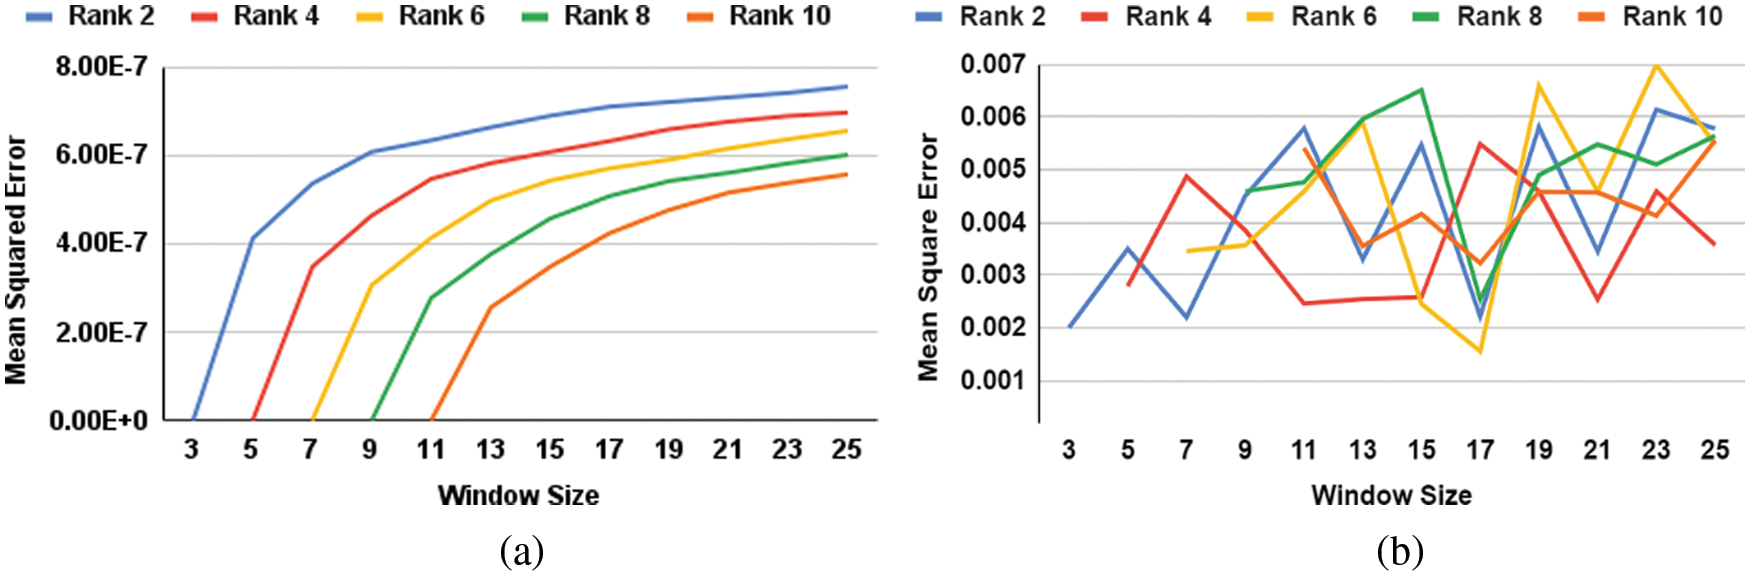
Figure 3: (a) MSE between original data and processed data by SG filter (b) MSE with proposed Hypergraph based CDB-LSTM and SG filter
The comparison of different rankings and window sizes for MSE between the original data and the predicted data using the SG Filter was shown in Fig. 3b. The SG filter with rank 6 at window size 11 was chosen as the final parameter settings to build our proposed model based on the results.
4.3 Parameter Setting Experiments
The experiments were conducted to select the best combination of network hyperparameters (number of neurons, Batch size, and Epochs) for resource usage prediction. Tab. 4, shows the extracted results based on these parameters for investigation. The optimum hyperparameters identified are Batch Size (2000) and the Epochs (500) and the corresponding number of neurons (70) with the RMSE value 0.161, which shows the accurate prediction performance.

The proposed model is evaluated and compared with two different metrics: 1) learning model metrics: to evaluate the performance of the prediction model and 2) migration metrics: it describes the impact of prediction model which helps to mitigate the server failure viz. resource prediction.
Tab. 5, presents the performance comparison of different forecasting techniques (ARIMA, SVR RNN, LSTM, Conv LSTM, and Bi-LSTM) based on the following metrics, Accuracy, RMSE, R2, MAE, and MAPE. Furthermore, the informative samples are extracted from Helly property of hypergraph and SG filter is applied to remove the noisy data. It is observed from Tab. 5, the deep learning models performs better than the statistical models. As a result, the proposed deep learning models exactly predicts the unexpected workload at earlier stage to avoid the server failures.

The proposed Hypergraph based CDB-LSTM model is compared with Automatic Live Migration (ALM) [45], Combined Forecast Load Aware (CF-LA) [46], and Bi-directional Grid LSTM (BG-LSTM) [17] to determine the optimum resource prediction model. It is executed in a simulation environment, and the results were observed in terms of cloud metrics, including the Number of migrations and Energy utilization. Fig. 4a, compares the Number of migrations based on the demand prediction.
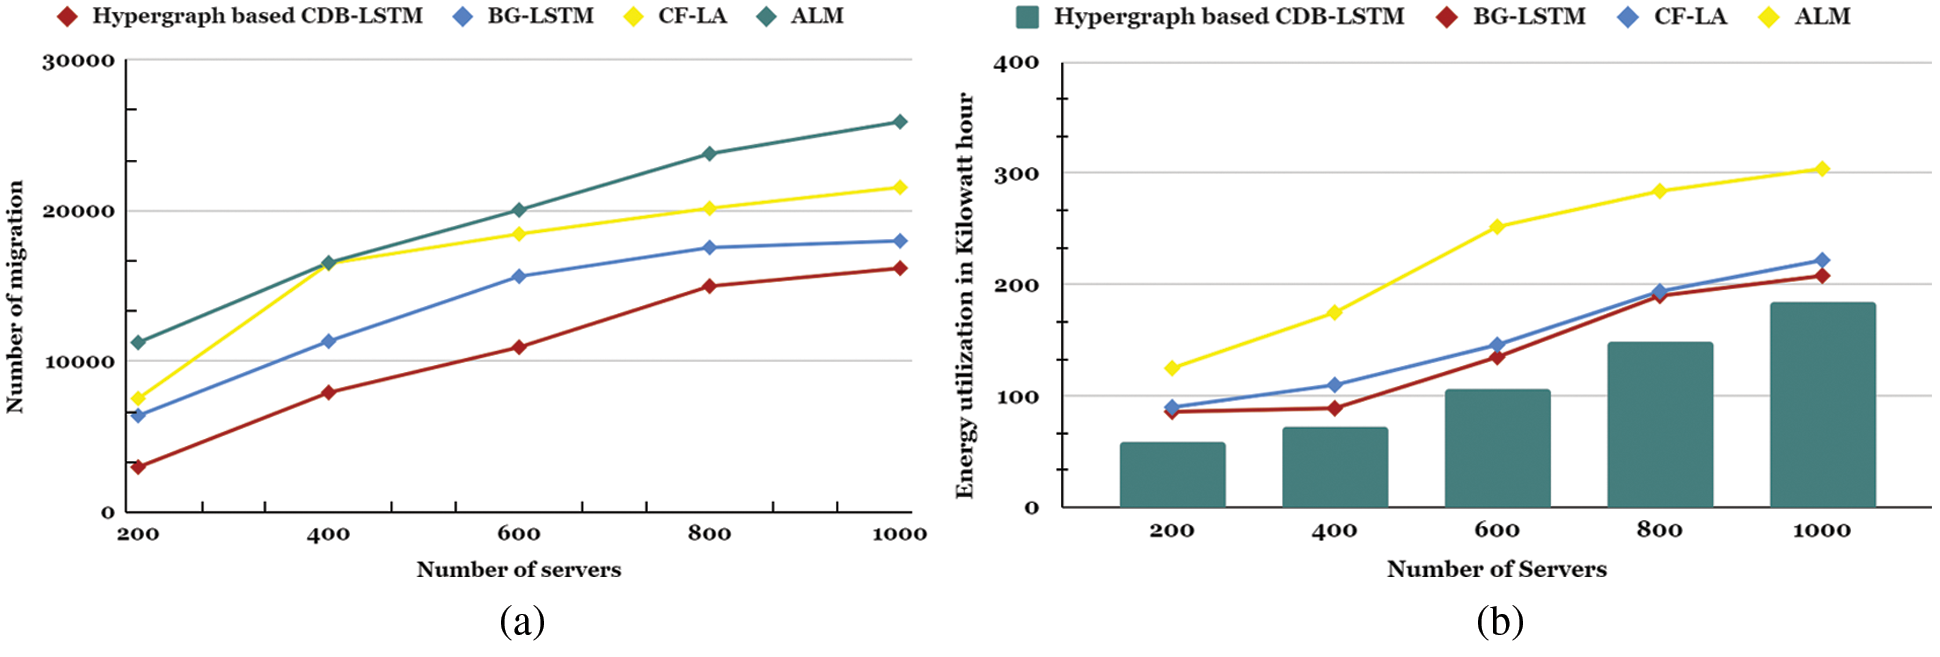
Figure 4: (a) Number of migrations vs. number of servers (b) Energy consumption vs. number of servers
For example, the earlier techniques ALM and CF-LA at 400 servers have more significance than 15000 triggers of migrations. It is clear that the Number of migrations using the BG-LSTM technique is less compared to the statistical-based prediction models. Moreover, for the same experiment, the proposed model has achieved the count of 647 migrations which is greater than the other three methods. Based on the discussion, it can be concluded that the Hypergraph based CDB-LSTM forecast the non-linear pattern of cloud resource demand better than other prior research works.
The energy utilization is compared in Fig. 4b, across five different numbers of servers. It is observed that all three other methods have a higher utilization value of energy consumption crossed above 250 KWh compared to the proposed model. Among those three, the BG-LSTM model is little closer to the proposed model with 100 KWh especially with 400 servers.
Live VM Migration is an exceptionally viable approach for expanding the performance level by overseeing the available resources dynamically. The occurrence of sudden rise in the VM workload is unexpected, which automatically degrades the performance of the cloud data center. Thus, in this research work, the demand for virtual machine resources on a cloud data center was accurately anticipated during live VM migration using the proposed hypergraph based CDB-LSTM model that captures the future resource utilization in an effective way by extracting helly informative samples at different instances. The proposed Hypergraph based CDB-LSTM model was validated using the Google cluster dataset to show that it minimizes the number of migrations and energy utilization than the other state-of-the-art approaches. The future work is to decrease the migration downtime and ensure secure migration in the cloud data center.
Funding Statement: The authors received no specific funding for this study.
Conflicts of Interest: The authors declare that they have no conflicts of interest to report regarding the present study.
References
1. G. Singh and A. K. Singh, “Optimizing multi-VM migration by allocating transfer and compression rate using Geometric Programming,” Simulation Modelling Practice and Theory, vol. 106, no. 5, pp. 102201, 2021. [Google Scholar]
2. H. Jin, X. Wang, S. Wu, S. Di and X. Shi, “Towards optimized fine-grained pricing of IaaS cloud platform,” IEEE Transactions on Cloud Computing, vol. 3, no. 4, pp. 436–448, 2015. [Google Scholar]
3. N. Kumar, G. S. Aujla, S. Garg, K. Kaur, R. Ranjan et al., “Renewable energy-based multi-indexed job classification and container management scheme for sustainability of cloud data centers,” IEEE Transactions on Industrial Informatics, vol. 15, no. 5, pp. 2947–2957, 2019. [Google Scholar]
4. J. N. Witanto, H. Lim and M. Atiquzzaman, “Adaptive selection of dynamic VM consolidation algorithm using neural network for cloud resource management,” Future Generation Computer Systems, vol. 87, no. 4, pp. 35–42, 2018. [Google Scholar]
5. X. Wan, X. Zhang, L. Chen and J. Zhu, “An improved vTPM migration protocol based trusted channel,” in Int. Conf. on Systems and Informatics (ICSAI2012), Shandong, China, pp. 870–875, 2012. [Google Scholar]
6. X. Xu and B. Davda, “A hypervisor approach to enable live migration with passthrough SR-IOV network devices,” ACM SIGOPS Operating Systems Review, vol. 51, no. 1, pp. 15–23, 2017. [Google Scholar]
7. A. Choudhary, M. C. Govil, G. Singh, L. K. Awasthi, E. S. Pilli et al., “A critical survey of live virtual machine migration techniques,” Journal of Cloud Computing, vol. 6, no. 1, pp. 599, 2017. [Google Scholar]
8. C. S. Annadanam, S. Chapram and Ramesh. T, “Intermediate node selection for Scatter-Gather VM migration in cloud data center,” Engineering Science and Technology, An International Journal, vol. 23, no. 5, pp. 989–997, 2020. [Google Scholar]
9. M. A. Altahat, A. Agarwal, N. Goel and J. Kozlowski, “Dynamic hybrid-copy live virtual machine migration: Analysis and comparison,” Procedia Computer Science, vol. 171, no. 3, pp. 1459–1468, 2020. [Google Scholar]
10. K. Kaur, S. Garg, G. Kaddoum, E. Bou-Harb and K. K. R. Choo, “A big data-enabled consolidated framework for energy efficient software defined data centers in IoT setups,” IEEE Transactions on Industrial Informatics, vol. 16, no. 4, pp. 2687–2697, 2020. [Google Scholar]
11. T. Le, “A survey of live virtual machine migration techniques,” Computer Science Review, vol. 38, no. 8, pp. 100304, 2020. [Google Scholar]
12. B. Mao, Y. Yang, S. Wu, H. Jiang and K. C. Li, “IOFollow: Improving the performance of VM live storage migration with IO following in the cloud,” Future Generation Computer Systems, vol. 91, no. 3, pp. 167–176, 2019. [Google Scholar]
13. F. J. Baldan, S. Ramirez-Gallego, C. Bergmeir, F. Herrera and J. M. Benitez, “A forecasting methodology for workload forecasting in cloud systems,” IEEE Transactions on Cloud Computing, vol. 6, no. 4, pp. 929–941, 2018. [Google Scholar]
14. X. Wang, J. Cao, D. Yang, Z. Qin and R. Buyya, “Online cloud resource prediction via scalable window waveform sampling on classified workloads,” Future Generation Computer Systems, vol. 117, no. 7, pp. 338–358, 2021. [Google Scholar]
15. F. Tseng, X. Wang, L. Chou, H. Chao and V. C. M. Leung, “Dynamic resource prediction and allocation for cloud data center using the multiobjective genetic algorithm,” IEEE Systems Journal, vol. 12, no. 2, pp. 1688–1699, 2018. [Google Scholar]
16. F. Kartal and U. Özveren, “A deep learning approach for prediction of syngas lower heating value from CFB gasifier in Aspen plus®,” Energy, vol. 209, no. 6, pp. 118457, 2020. [Google Scholar]
17. J. Bi, S. Li, H. Yuan and M. Zhou, “Integrated deep learning method for workload and resource prediction in cloud systems,” Neurocomputing, vol. 424, no. 1, pp. 35–48, 2021. [Google Scholar]
18. J. Q. Wang, Y. Du and J. Wang, “LSTM based long-term energy consumption prediction with periodicity,” Energy, vol. 197, no. 11, pp. 117197, 2020. [Google Scholar]
19. H. A.G., C. Vigneswaran and S. S. Shankar, “Unsupervised bin-wise pre-training: A fusion of information theory and hypergraph,” Knowledge-Based Systems, vol. 195, pp. 105650, 2020. [Google Scholar]
20. S. Liang, D. Wang, J. Wu, R. Wang and R. Wang, “Method of bidirectional LSTM modelling for the atmospheric temperature,” Intelligent Automation & Soft Computing, vol. 29, no. 3, pp. 701–714, 2021. [Google Scholar]
21. A. Savitzky and M. J. E. Golay, “Smoothing and differentiation of data by simplified least-squares procedures,” Analytical Chemistry, vol. 36, no. 8, pp. 1627–1639, 1964. [Google Scholar]
22. P. A. Dinda, “Design, implementation, and performance of an extensible toolkit for resource prediction in distributed systems,” IEEE Transactions on Parallel and Distributed Systems, vol. 17, no. 2, pp. 160–173, 2006. [Google Scholar]
23. J. Subirats and J. Guitart, “Assessing and forecasting energy efficiency on Cloud computing platforms,” Future Generation Computer Systems, vol. 45, no. 1, pp. 70–94, 2015. [Google Scholar]
24. Y. Gao, H. Guan, Z. Qi, B. Wang and L. Liu, “Quality of service aware power management for virtualized data centers,” Journal of Systems Architecture, vol. 59, no. 4–5, pp. 245–259, 2013. [Google Scholar]
25. D. Ömer Faruk, “A hybrid neural network and ARIMA model for water quality time series prediction,” Engineering Applications of Artificial Intelligence, vol. 23, no. 4, pp. 586–594, 2010. [Google Scholar]
26. Y. Lu, J. Panneerselvam, L. Liu and Y. Wu, “RVLBPNN: A workload forecasting model for smart cloud computing,” Scientific Programming, vol. 2016, pp. 1–9, 2016. [Google Scholar]
27. S. Kumaraswamy and M. K. Nair, “Intelligent VMs prediction in cloud computing environment,” in SmartTechCon, Bengaluru, India, pp. 288–294, 2017. [Google Scholar]
28. S. Y. Hsieh, C. S. Liu, R. Buyya and A. Y. Zomaya, “Utilization-prediction-aware virtual machine consolidation approach for energy-efficient cloud data centers,” Journal of Parallel and Distributed Computing, vol. 139, no. 2, pp. 99–109, 2020. [Google Scholar]
29. L. Abdullah, H. Li, S. Al-Jamali, A. Al-Badwi and C. Ruan, “Predicting multi-attribute host resource utilization using support vector regression technique,” IEEE Access, vol. 8, pp. 66048–66067, 2020. [Google Scholar]
30. S. Barra, S. M. Carta, A. Corriga, A. S. Podda and D. R. Recupero, “Deep learning and time series-to-image encoding for financial forecasting,” IEEE/CAA Journal of Automatica Sinica, vol. 7, no. 3, pp. 683–692, 2020. [Google Scholar]
31. T. D. Pham, K. Wårdell, A. Eklund and G. Salerud, “Classification of short time series in early Parkinsons disease with deep learning of fuzzy recurrence plots,” IEEE/CAA Journal of Automatica Sinica, vol. 6, no. 6, pp. 1306–1317, 2019. [Google Scholar]
32. B. Song, Y. Yu, Y. Zhou, Z. Wang and S. Du, “Host load prediction with long short-term memory in cloud computing,” Journal of Supercomputing, vol. 74, no. 12, pp. 6554–6568, 2018. [Google Scholar]
33. J. Bi, S. Li, H. Yuan, Z. Zhao and H. Liu, “Deep neural networks for predicting task time series in cloud computing systems,” in IEEE 16th Int. Conf. on Networking, Sensing and Control (ICNSC), Banff, Canada, pp. 86–91, 2019. [Google Scholar]
34. Y. Miao, G. Wu, M. Li, A. Ghoneim, M. Al-Rakhami et al., “Intelligent task prediction and computation offloading based on mobile-edge cloud computing,” Future Generation Computer Systems, vol. 102, no. 5, pp. 925–931, 2020. [Google Scholar]
35. X. Tang, “Large-Scale computing systems workload prediction using parallel improved LSTM neural network,” IEEE Access, vol. 7, pp. 40525–40533, 2019. [Google Scholar]
36. S. Gupta, A. D. Dileep and T. A. Gonsalves, “Online sparse BLSTM models for resource usage prediction in cloud datacentres,” IEEE Transactions on Network and Service Management, vol. 17, no. 4, pp. 2335–2349, 2020. [Google Scholar]
37. N. Kalchbrenner, I. Danihelka and A. Graves, “Grid long short-term memory,” arXiv preprint arXiv:1507.01526, 2016. [Google Scholar]
38. G. Lample, M. Ballesteros, S. Subramanian, K. Kawakami and C. Dyer, “Neural architectures for named entity recognition,” arXiv preprint arXiv:1603.01360, 2016. [Google Scholar]
39. X. Shi, Z. Chen, H. Wang, D. -Y. Yeung, W. Wong et al., “Convolutional LSTM network: A machine learning approach for precipitation nowcasting,” in Advances in Neural Information Processing Systems, Montreal, Canada, pp. 802–810, 2015. [Google Scholar]
40. A. Kulshrestha, V. Krishnaswamy and M. Sharma, “Bayesian BILSTM approach for tourism demand forecasting,” Annals of Tourism Research, vol. 83, no. 2, pp. 102925, 2020. [Google Scholar]
41. N. Mughees, S. A. Mohsin, A. Mughees and A. Mughees, “Deep sequence to sequence Bi-LSTM neural networks for day-ahead peak load forecasting,” Expert Systems with Applications, vol. 175, no. 7, pp. 114844, 2021. [Google Scholar]
42. J. Hanson, Y. Yang, K. Paliwal and Y. Zhou, “Improving protein disorder prediction by deep bidirectional long short-term memory recurrent neural networks,” Bioinformatics, vol. 33, no. 5, pp. 685–692, 2017. [Google Scholar]
43. S. Wang, X. Wang, S. Wang and D. Wang, “Bi-directional long short-term memory method based on attention mechanism and rolling update for short-term load forecasting,” International Journal of Electrical Power & Energy Systems, vol. 109, no. 2, pp. 470–479, 2019. [Google Scholar]
44. C. Reiss, J. Wilkes and J. L. Hellerstein, Google cluster-usage traces: Format + schema. Google Inc., White Paper, Mountain View, CA, USA, 2011. [Google Scholar]
45. M. Forsman, A. Glad, L. Lundberg and D. Ilie, “Algorithms for automated live migration of virtual machines,” Journal of Systems and Software, vol. 101, no. 1, pp. 110–126, 2015. [Google Scholar]
46. G. J. L. Paulraj, S. A. J. Francis, J. D. Peter and I. J. Jebadurai, “A combined forecast-based virtual machine migration in cloud data centers,” Computers & Electrical Engineering, vol. 69, no. 8, pp. 287–300, 2018. [Google Scholar]
Cite This Article
 Copyright © 2023 The Author(s). Published by Tech Science Press.
This work is licensed under a Creative Commons Attribution 4.0 International License , which permits unrestricted use, distribution, and reproduction in any medium, provided the original work is properly cited.
 Downloads
 Citation Tools