
 Submit a Paper
 Propose a Special lssue
 Open Access
ARTICLE
Forecasting Stock Volatility Using Wavelet-based Exponential Generalized Autoregressive Conditional Heteroscedasticity Methods
1 School of Mathematical Science, Universiti Sains Malaysia, Penang, Malaysia
2 Department of Risk Management and Insurance, Faculty of Business, The University of Jordan, Jordan
3 Department of Basic Sciences, College of Science and Theoretical Studies, Saudi Electronic University, Riyadh, Saudi Arabia
* Corresponding Author: Nawaf N. Hamadneh. Email:
Intelligent Automation & Soft Computing 2023, 35(3), 2589-2601. https://doi.org/10.32604/iasc.2023.024001
Received 30 September 2021; Accepted 11 February 2022; Issue published 17 August 2022
 View Full Text
 Download PDF
Abstract
In this study, we proposed a new model to improve the accuracy of forecasting the stock market volatility pattern. The hypothesized model was validated empirically using a data set collected from the Saudi Arabia stock Exchange (Tadawul). The data is the daily closed price index data from August 2011 to December 2019 with 2027 observations. The proposed forecasting model combines the best maximum overlapping discrete wavelet transform (MODWT) function (Bl14) and exponential generalized autoregressive conditional heteroscedasticity (EGARCH) model. The results show the model's ability to analyze stock market data, highlight important events that contain the most volatile data, and improve forecast accuracy. The results were compared from a number of mathematical models, which are the non-linear spectral model, autoregressive integrated moving average (ARIMA) model and EGARCH model. The performance of the forecasting model will be evaluated based on some of error functions such as Mean absolute percentage error (MAPE), Mean absolute scaled error (MASE) and Root means squared error (RMSE).Keywords
In the world of trade and industry, there are a number of financial markets. Stock markets is one the important markets that make up the composition of the ownership of the companies. There is no doubt about the fact that stock market volatility is of interest to both market practitioners and policy makers, especially for emerging countries. Opinions differ about volatility, some investors view it as a profit opportunity, and some investors view it as a threat of loss, which requires a hedging method to protect the investment. Commonly, the fluctuations in the stock market measure fluctuations in stock returns. Commonly, the fluctuations in the stock market measure fluctuations in stock returns. Opinions differ about volatility, some investors view it as a profit opportunity, and some investors view it as a threat of loss, which requires a hedging method to protect the investment. Forecasting stock market volatility is particularly important for organizations involved in options trading and portfolio management. Forecasting assists researchers to make appropriate decisions. It can be divided into three major categories, namely, short-term forecasting, medium-term forecasting and long-term forecasting. Short-term forecasting generally builds forecasts for one hour to a few days. Medium term forecasting predicts for a week to a month and finally, long term forecasting usually predicts the load for a year or more. Note that, forecasting horizon is the length of time into the future for which forecasts are to be organized. Where forecasting accuracy is a very significant component for time series data, in the forecasting area, the accuracy is a criterion for choosing the forecasting method. Forecasting accuracy is very important in stock markets since the stock market is very attractive to investors as we hope that they can profit financially from buying and selling stock. Mathematical modeling plays a significant role in determining the relationship between the present values of financial indicators and their expected values. Fluctuations in stock markets are generally attributed to a set of variables and factors that may intertwine with each other. It is worth noting that one of the most important forecasting models in econometrics is the volatility modeling of financial time series. It is a fundamental and important area of investigation in econometrics. Among the characteristics analyzed in volatility prediction models are the fat (heavy)-tailed distribution and volatility clustering [1,2]. This is why research into prediction models is a rapidly growing and always interesting field. The factors consist of various fluctuations in macroeconomic variables such as interest rate fluctuations, the spread of global uncertainty, and external shocks such as oil price shocks. Expectations related to the spread of the COVID-19 epidemic are deepening the volatility and expectations in the growth of companies and the policies emanating from the globally dominant companies, especially those that drive prices [3–5]. Therefore, many researchers have been interested in stock market volatility during the COVID-19 epidemic [6–8]. As the main objective is to develop forecasting methods to reduce the effects of fluctuations in the financial markets, and thus maintain the stability of the financial markets from sudden shocks. This is in addition to investigating new indicators that affect global stock market volatility during the COVID-19 pandemic.
Various studies indicate that stock market volatility changes over time, which means that stock market volatility is not random. Poon et al. [9] found that the autoregressive conditional heteroscedasticity (ARCH) and generalized autoregressive conditional heteroscedasticity (GARCH) classes of time-series models are essential for predicting volatility. Abdalla et al. [10] examined GARCH models to estimate market volatility in Tadawul from 2007 to 2011. Kalyanaraman [11] used a hybrid of the automatic regression (AR) model and the GARAG model as the AR (1)- GARCH (1, 1) model to estimate conditional volatility in Tadawul from 2004 to 2013. The results showed that the symmetric linear GARCH (1, 1) model is suitable for estimating stock market volatility and that the Tadawul returns variable time fluctuations and follow an abnormal distribution.
Many studies are also investigating the topic EGARCH with WT, since it has many applications in the field of electricity price forecasting, Qiao et al. [12] demonstrated WT's optimal Wavelet orders and layers in forecasting US electricity prices, which led to the creation of a new hybrid model. The model is using 240 schemes to choose WT parameters and predict each scheme using stacked auto-encoder (SAE) and long-term memory (LSTM), the new hybrid model is called WT-SAE-LSTM. The most efficient performance of the hybrid model is in residential, commercial and industrial electricity price situations, providing high prediction accuracy compared to other models such as backpropagation neural network.
Electricity prices are characterized by high volatility, high frequency, instability and nonstationary, so it becomes imperative to improve forecast accuracy. Yang et al. [13] proposed a new hybrid model for daily electricity price forecast data for countries of Pennsylvania, New Jersey and Maryland (PJM), Australian and Spanish markets. Based on WT's combination, the kernel Extreme Learning Machine (KELM) relies on self-adaptive particle swarm optimization and automatic retraction moving average (ARMA). This method has the advantage of giving a more accurate, general and practical prediction than other hybrid methods. Kumar et al. [14] are applied to the electricity market in New South Wales to verify the proposed model’s performance. Its price prediction approach combines wavelet model, seasonal autoregressive integrated moving average (SARIMA) model and Glosten-Jagannathan-Runkle GARCH (GJR-GARCH) model. Wu [15] studied the influence of the window on in-sample coefficient estimation and out-of-sample forecasting. The findings show that coefficient estimation is stable under different window settings. However, in forecasting, a specified window size demonstrates significantly higher accuracy of left-tail forecasts in stable patterns. It allows you to improve your out-of-sample forecast by selecting a window from the past data. Kumar et al. [14] used the Dynamic Conditional Correlation (DCC) model, Integrated GARCH (1,1) model and WT model to analyze the return and volatility. The results showed moderate volatility spread across the return pairs, the crypto currency's volatility could be related to its own volatility-increased repercussions of volatility after 2017 and the impact of fluctuations in Bitcoin prices on other crypto currencies.
Jarrah et al. [16] concluded that WT and Artificial Neural Network (ANN) models are more accurate forecasting of the day’s closing price compare with the ARIMA method depend on the error function, which are MSE, RMSE and MAE. Xie et al. [17] are used Locally stationary wavelet (LSW) processes relies on non-decimated wavelets to investigate and forecast non-stationary time series. They have proposed a new algorithm based on LSW modeling has been proposed, and it outperforms traditional Garage models with which volatility were predicted.
Ismail et al. [18] demonstrated that the MODWT-GARCH (1, 1) linear maximum interferometric wavelength actually gives an accurate yield prediction value. The results revealed that the MODWT-EGARCH (1, 1) model provides underestimated forecasting returns. In contrast, MODWT and GARCH (1, 1) models give an accurate predict value of the observed returns. Audu [19] reviewed traditional classical volatility models. Practical evidence from the research has pointed to the symmetric MODWT-GARCH model (1, 1), which gives more accurate volatility to forecast stock markets in African countries than the traditional linear GARCH (1, 1) model. The Forecasting produced through MODWT-EGARCH (1, 1) actually reduces the value of the original returns while the MODWT-GARCH (1, 1) model creates an accurate prediction value of the original returns. Sharghi et al. [20] proposed a new model of wavelet exponential smoothing (WES) with two scenarios (WES1, WES2) for the estimation of daily and monthly suspended sediment load in two rivers in Iran and USA. The wavelet methods were applied to the daily data of global deaths of COVID-19 and daily bitcoin prices from December 31, 2019 to April 29, 2020 by [21]. They found that levels of COVID-19 caused Bitcoin prices to spike. Finta et al. [22] examined the relationship of volatility between oil and the stock markets in the USA and KSA. They discovered that volatility spreads faster from oil to stock markets than volatility spreads from stock markets to oil. Jammazi [23] concluded that the variances of changes in crude oil are more fluctuate than those of changes in stock market returns in short run scale.
Some studies have used WT, co-integration tests, and Granger causality tests to identify the existence of long-term relationships [24]. Paul et al. [25] examined export volatility, and identified short- and long-term relationships between onion export and domestic prices using co-integration analysis and Granger Causality. Volatility estimating is especially crucial for organizations that trade in stocks and manage portfolios [26]. Mathematical modeling can establish a link between present financial indicator and their expected future values. Designing a quantitative forecast model provides an accurate assessment of the future market direction, as one of the major issues in economics is the volatility of financial time series. The seminal (G) ARCH models have been effectively used in analyzing the most common of price volatility features [1,2]. Accordingly, no study has examined the application of MODWT with EGARCH to model and improve forecast accuracy in stock market volatility. It is worth noting that a lot of research has been conducted using multiple methods to search for different models of WT functions, as well as using other auxiliary models.. Therefore, there is a large scope in searching the comparative application of all MODWT models that are Haar, Daubechies (D4), Coiflet (C6), Least symmetric (LA8) and best localized (Bl14) in combination with EGARCH models. In this study, a new prediction model that by combining MODWT models with EGARCH model based on some of statistical tests will improve the accuracy of the forecasting stock volatility.
This paper is organized as follows: In the next section, the mathematical models used in this research are reviewed and discussed, and then the research design and methodology is presented in Section 3. As for the discussion of the results, they are in Section 4. In the last section, the conclusions of the paper are presented.
The WT model is a mathematical model that used to convert the original time series data into a time-scale domain [27]. The main idea of WT is to analyze time series observations into different series of coefficients through a group of wave-like 23 functions. Moreover, WT is a supreme tool for studying non-stationary and non-linear time series data, so it is suitable model for reducing noise and removing the trend. In addition, this model is very suitable for non-stationary data, especially stock market data. WT is divided into three types namely: Discrete WT (DWT), continuous WT (CWT) and MODWT. Note that, DWT model can be used specified number of data J, while MODWT can be used for any size of data. In this paper, we will use MODWT model because it is more effective and easy to implement [28]. WT is satisfy the admissibility condition, as it is applied in many life applications such as image analysis and signal processing [29]:
where
There are two types of WT that are father WT and mother WT as shown in Eqs. (2) and (3).
where j = 1,2,3,…, J , J is the the number of data points.
The general mathematical model is resented in Eq. (4)
In more details,
The WT model is using to approximate the coefficient in Eq. (6), where
The ARMA model is used to describe stationary time series, where stationary time series, where the building process involves the following steps: model identification, model parameter estimation, model diagnostics and forecasting phase. Note that, this model is a combination of the moving average (MA) model and AR model, where MA is the value at time (t) of the time series and is influenced by present error term. The time series {
where
where p: order of AR, d: degree of differencing (I) and q: order of MA. If no differencing is done (d = 0) then the ARIMA model reduces to the ordinary ARMA model.
The ARCH is a statistical model introduced to exhibit volatility in financial market. This model is appropriate when the conditional variance follows the AR and the return of stocks (
where
The ARCH model is generalized into GARCH (p,q) model to assume that
where
The simpler GARCH (1, 1) model is suitable for estimating the variable time fluctuations returned in a large number of time series models. It is widely used in statistical programs that describe GARCH models for financial markets that are affected by global events and thus impact on economic growth. The EGARCH model is defined as [30]:
where the coefficient
The continuously return per day for the close price on day
The volatility
where
In this study, we used several types of accuracy criteria: error functions. There are another statistical criteria that can also use such as the Akaike information criterion (AIC, AICs), and the Bayesian information criterion (BIC) [31–33]. The MAPE criterion is one the error function that we have used, where the function is given as
where
where the numerator is the forecast error for a given period, defined as the actual value (
The RMSE is defined as a function used to measure the differences between two estimates, which is as follows:
where
Many other criterion can be used to test the performance of the models such as AIC and BIC [29].
where
3 Research Design and Methodology
The main objectives of this study are summarized as follows:
• Modeling the volatility data using the return series.
• Discussing the fluctuations during the historical data issued from Tadawul in the period from 2011 to 2019.
• Using the details coefficients to detect the fluctuations and go through the historical volatility data.
• Using a fitted EGARCH- ARIMA model with the approximation coefficients to make the forecasting.
• Improving the forecasting accuracy by combining MODWT's functions with EGARCH model in order to introduce new method, which is called EGARCH-MODWT.
The mechanism of the proposed model is summarized as: MODWT converts time series data into two groups: details (DA1 (n)) and approximation series (CA1 (n)). These two series give good behavior for the financial data. Then, the transformed data can be anticipated more precisely. Moreover, we have used the approximation series since the series behave as the main component of the transform. We note that when the data pattern is very rough, the wavelet process is repeatedly applied. The aim of pre-processing is to minimize the error between the signal before and after transformation. In addition, the approximation series is investigated if series have the main component of the transform. The wavelet procedure is frequently applied when the data pattern is highly rough. The goal of preprocessing is to reduce the error values between the signals before and after conversion. It is necessary to note that the adaptive noise in the training pattern has a significant impact on the problem of overfitting. Note that this can be done through the wavelet procedure. Therefore, we adopt MODWT twice for the pre-processing of the training data. Fig. 1 explain the process of modification method as it shows the financial data of Tadawul is decomposed into two parts: the details of the coefficient and the rounding coefficient. Details coefficient data have non-stationary data, high fluctuation, and discuss the main feature of the dataset. However, approximation coefficient data have stationary data, lower fluctuation, and used with EGARCH to improve the forecasting accuracy.
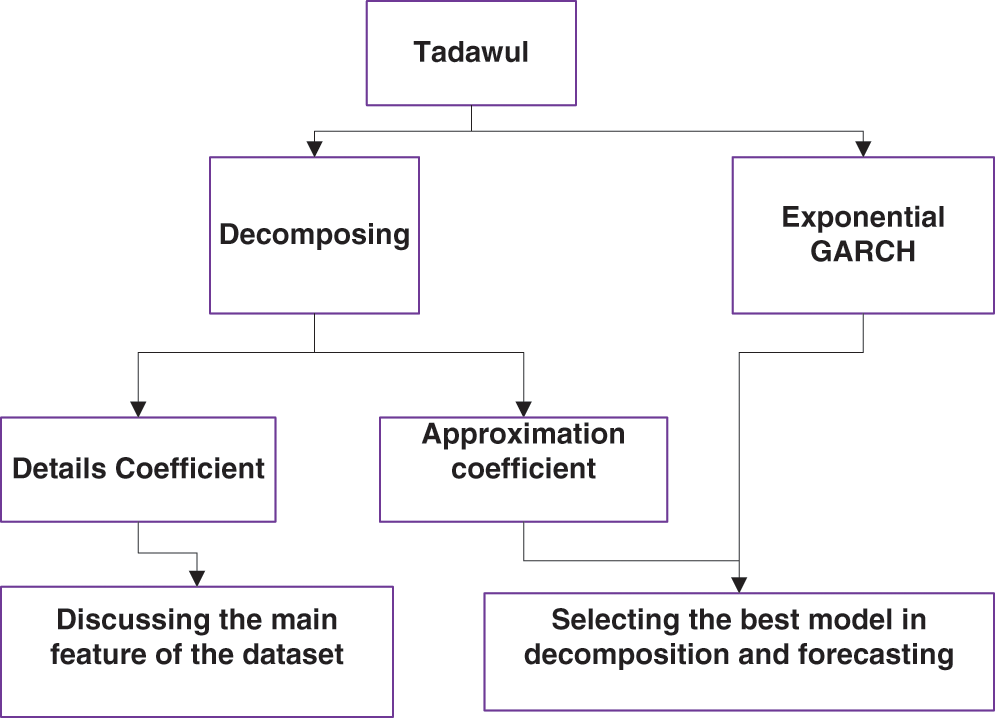
Figure 1: Research flowchart
It is noticeable that GARCH model accounts for stochastic volatility in a time series of returns but the returns may have components other than that can be explained by stochastic, such as trends or moving average. Thus, they may be inappropriate when an asymmetric effect is observed as a different instability. Moreover, the GARCH is not suitable for the high volatile data with high level of magnitudes and fluctuations such as stock market data. Therefore, MODWT can be smoothness the series and make it more predictable [34].
In this study, 90% of the original and transformed data were used to propose the best model. Moreover, we tested the best model by applying it to the rest of the data, which represents 10% of the data. Note that, since we have a huge number of data then the dividing the data into 90/10 is sufficient.
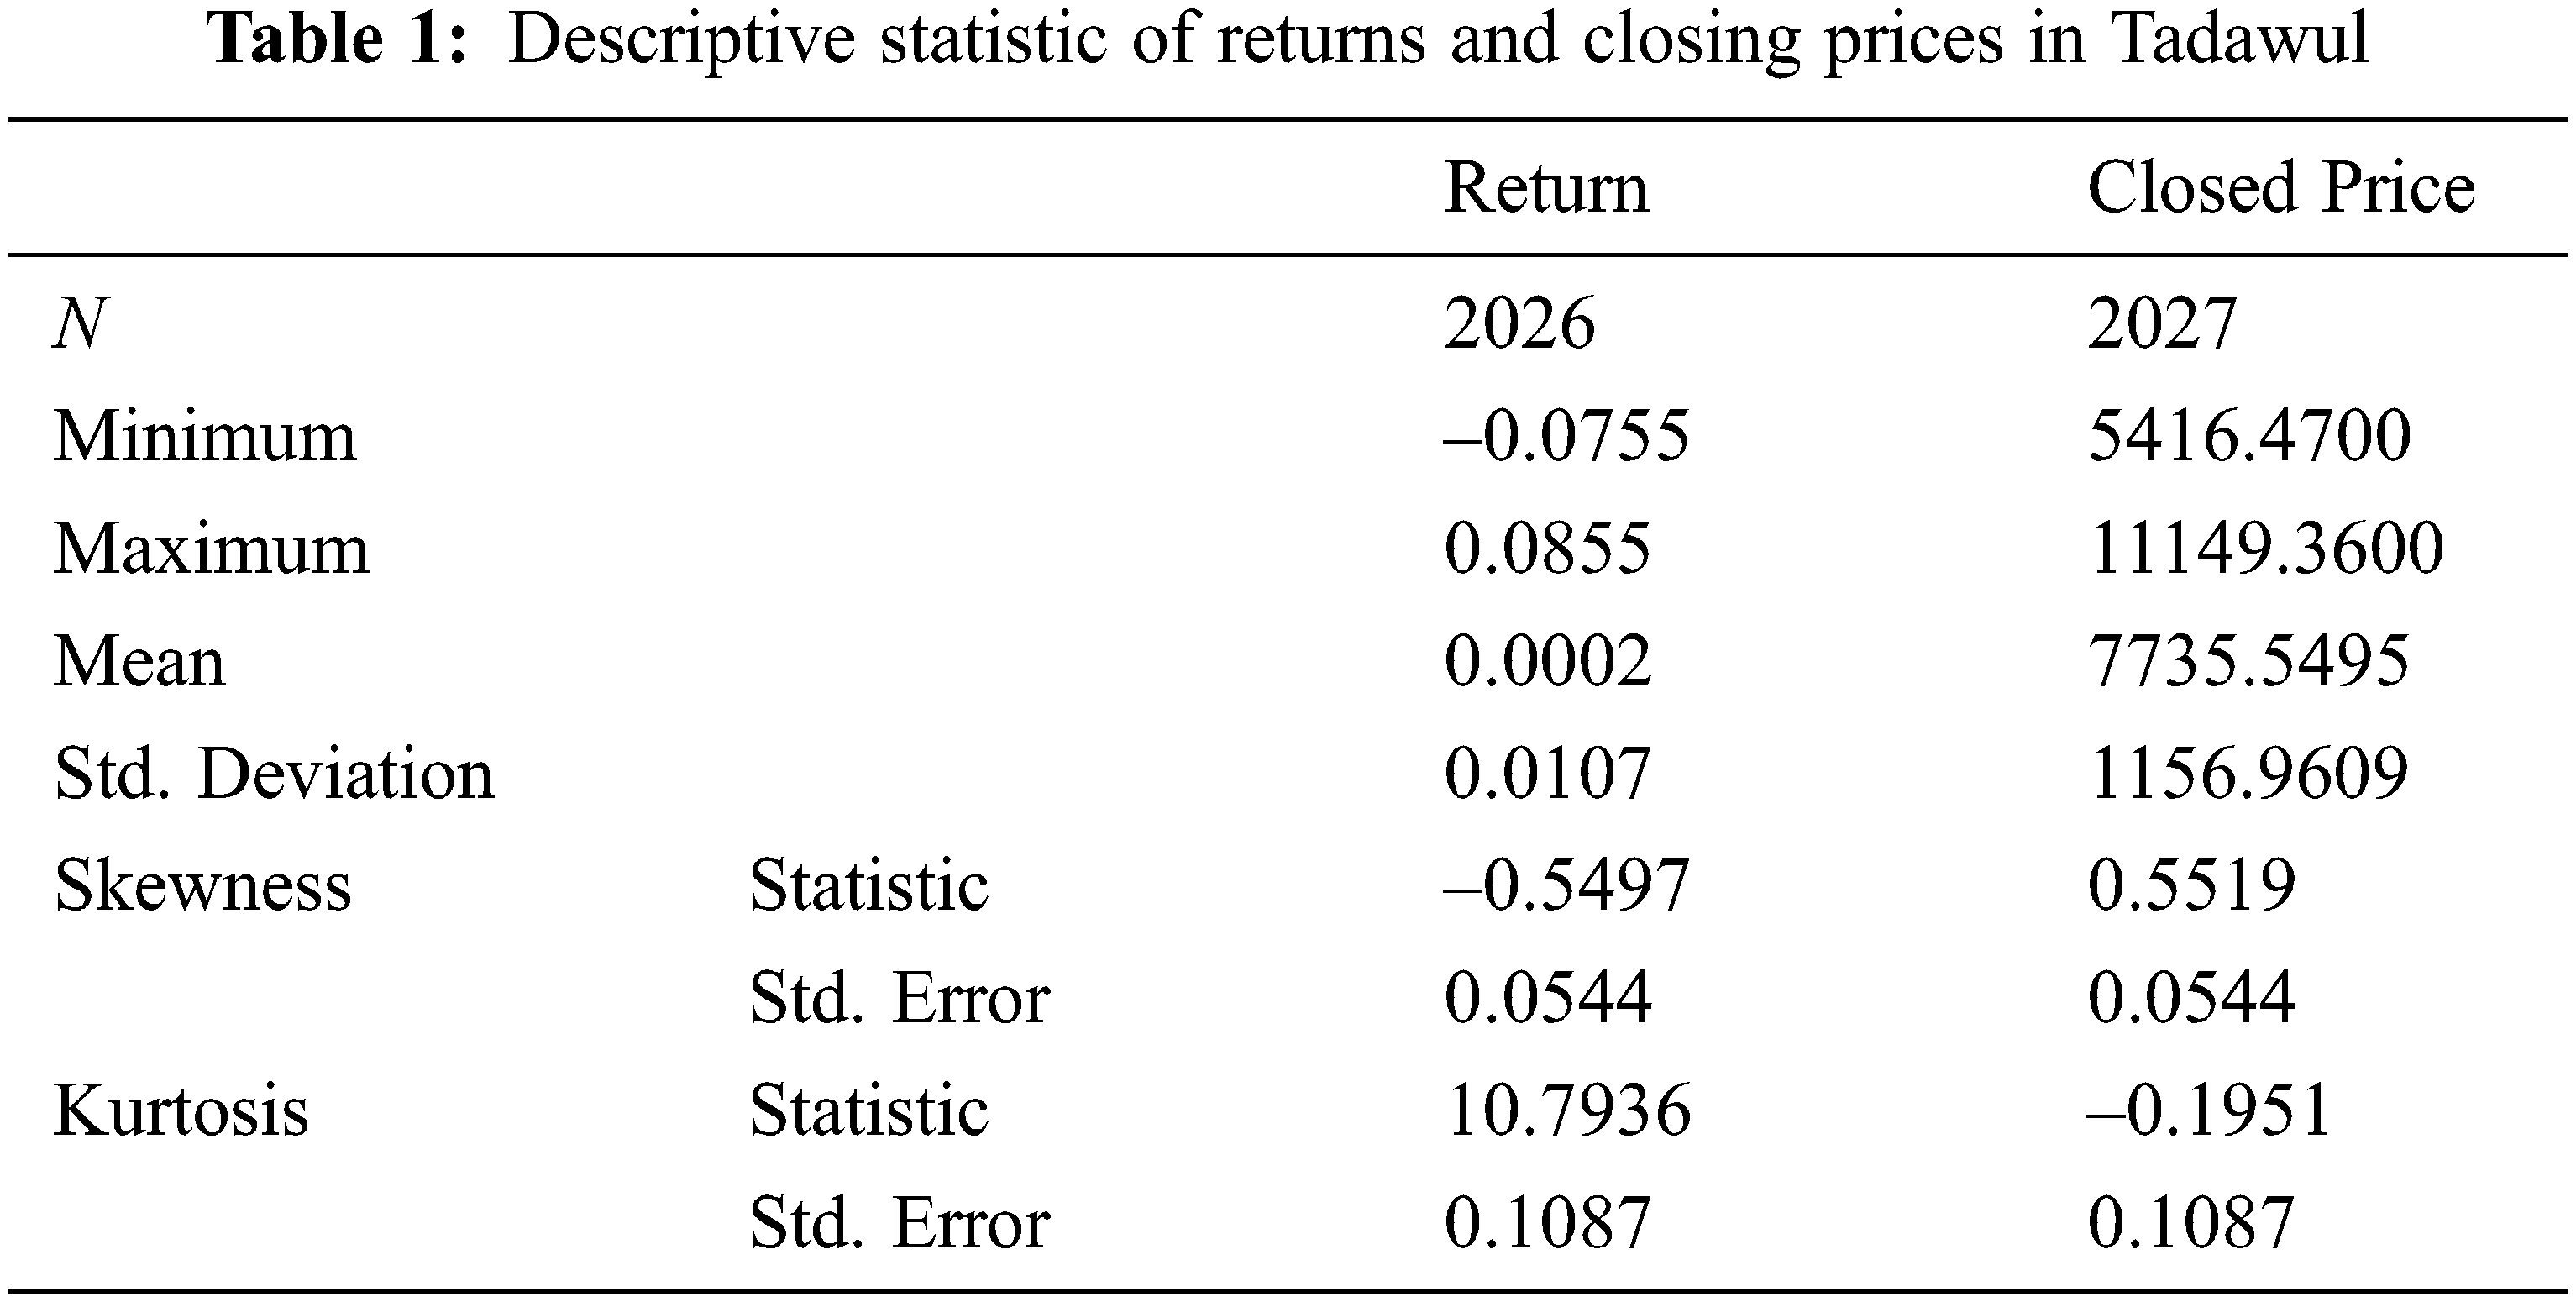
The day-to-day closing prices data was collected from 10 August 2011 until 31 December 2019, where the size of the sample is 2027. Tab. 1 shows the descriptive statistic of returns and closing prices.
The current study examines the volatility pattern of Tadawul. It was chosen for different reasons; the emerging markets have excited historical experience for stock market volatility. The Tadawul, as an example, has significant volatility due to imbalance in information, randomly trading, unprofessional in financial analysis. In addition, the investors of other countries except Gulf Cooperation Council (GCC) are not allowed to invest in Tadawul. Therefore, the volatility data will be decomposed in Fig. 2 using Bl14-MODWT' model. Then, the fluctuations during the selected period will be discussed. Moreover, Fig. 2 depicts the dataset decomposition using data from the MODWT model’s Bl14 model. This approach is appropriate for revealing the fluctuations, magnitudes, and phases for the dataset's closing price. Bl14 decomposes historical data into a variety of resolution levels that highlight its essential structure and creates detail coefficients at each of the one decomposition levels. The level of decomposition can be carried out by the WT according to the MODWT mechanism. According to the Kingdom's vision, Tadawul will be one of the largest financial markets at the regional and international levels. Where important steps have been taken to liberalize the market, which will lead to stimulating foreign investment and raising the efficiency of the market.
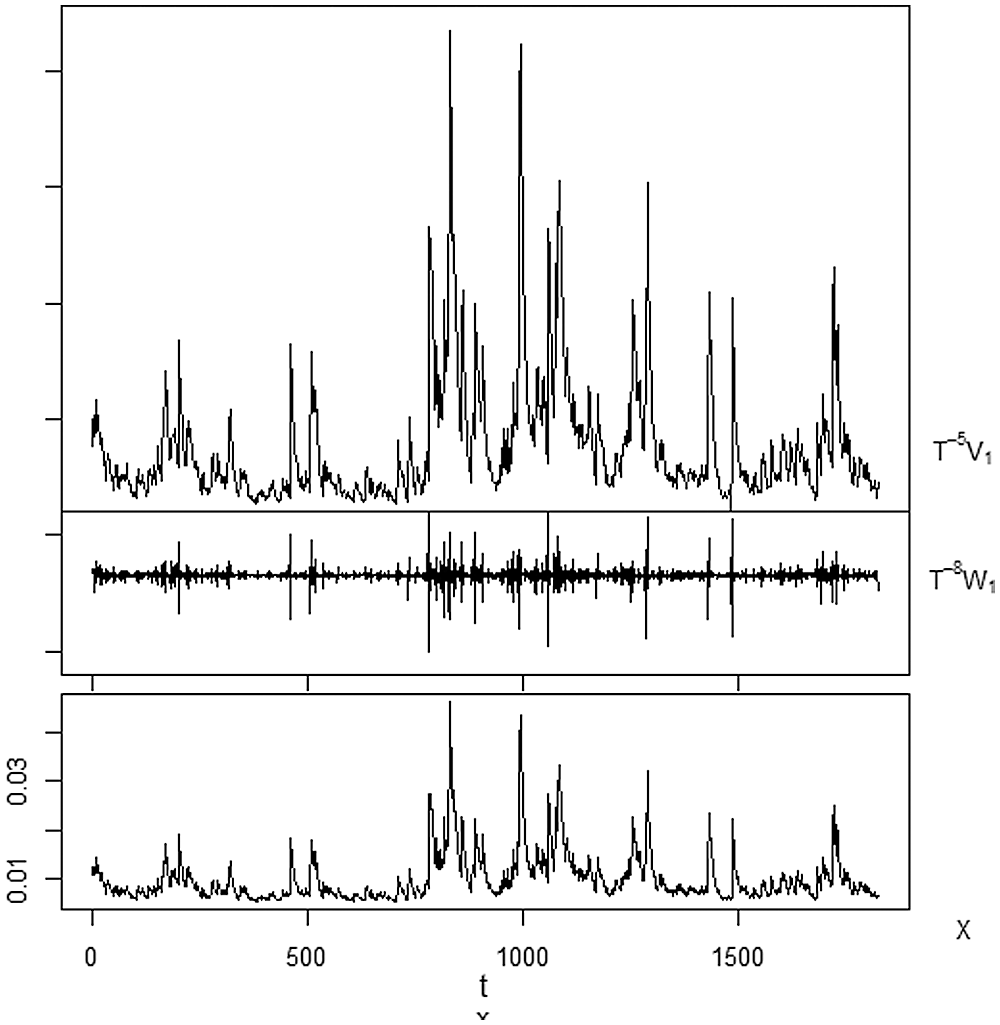
Figure 2: Decomposing the data using MODWT - Bl14 function
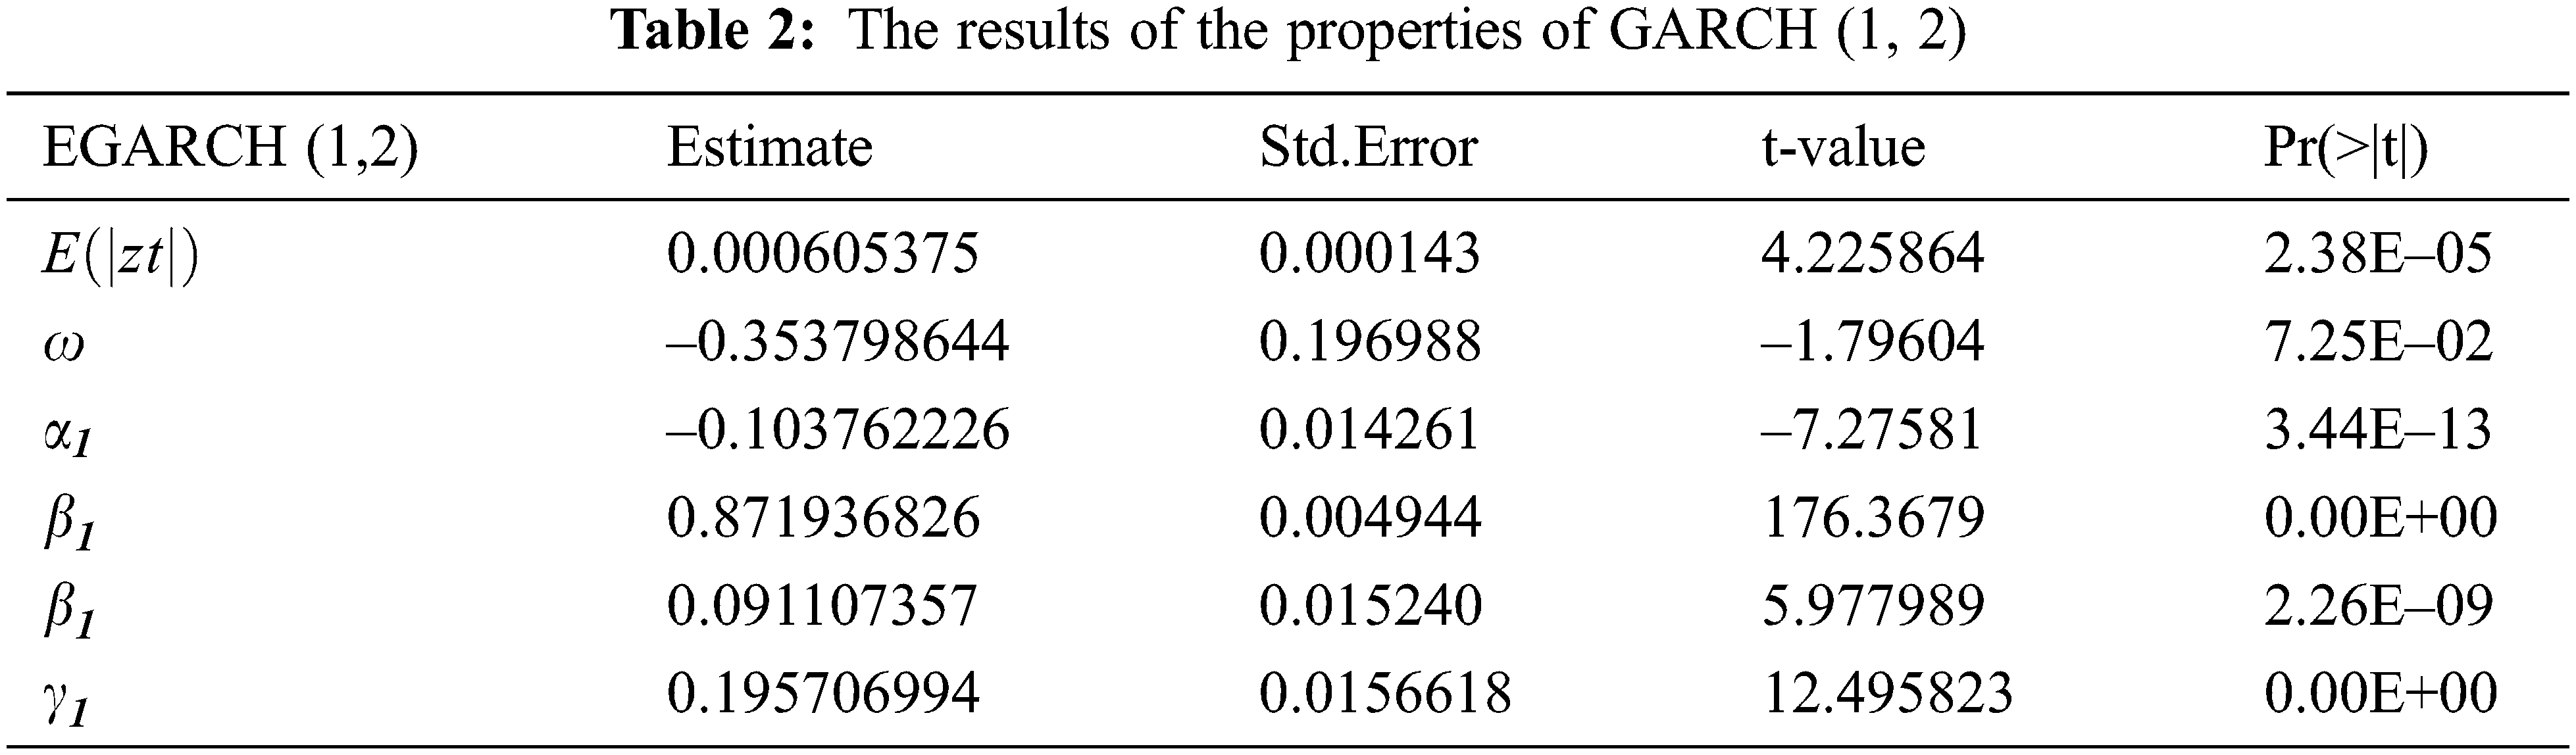
The process of improving the accuracy of forecasting fluctuations in Tadawul is very important, because of several factors. Among these factors is the COVID-19 pandemic and its accompanying repercussions on the market. Thus, in this article EGARCH-MODWT model will be combined together to improve prediction accuracy. Therefore, the fit EGARCH model is EGARCH (1, 2) with the estimated parameters that mentioned in Tab. 2.
Tab. 3 shows the results of using the suggested models using training data, which is 90% of the total sum of the data used. The ARIMA- Direct is the model obtained when we apply the pure ARIMA model directly on the original data. Haar-EGRACH is the combination of the EGARCH (1, 2) model with Haar function. D4-EGARCH is the combination of the EGARCH (1, 2) model with D 4 function. LA8-EGARCH is the combination of the EGARCH (1, 2) model with LA8 function. Bl14-EGARCH is the combination of the EGARCH (1, 2) model with Bl14 function. C6-EGARCH is the combination of the EGARCH (1, 2) model with C6 function. Finally, we compare the result for EGARCH (1, 2). Therefore, the best model is Bl14- EGARCH (1, 2), since the minimum values of the error functions are as follows: RMSE =
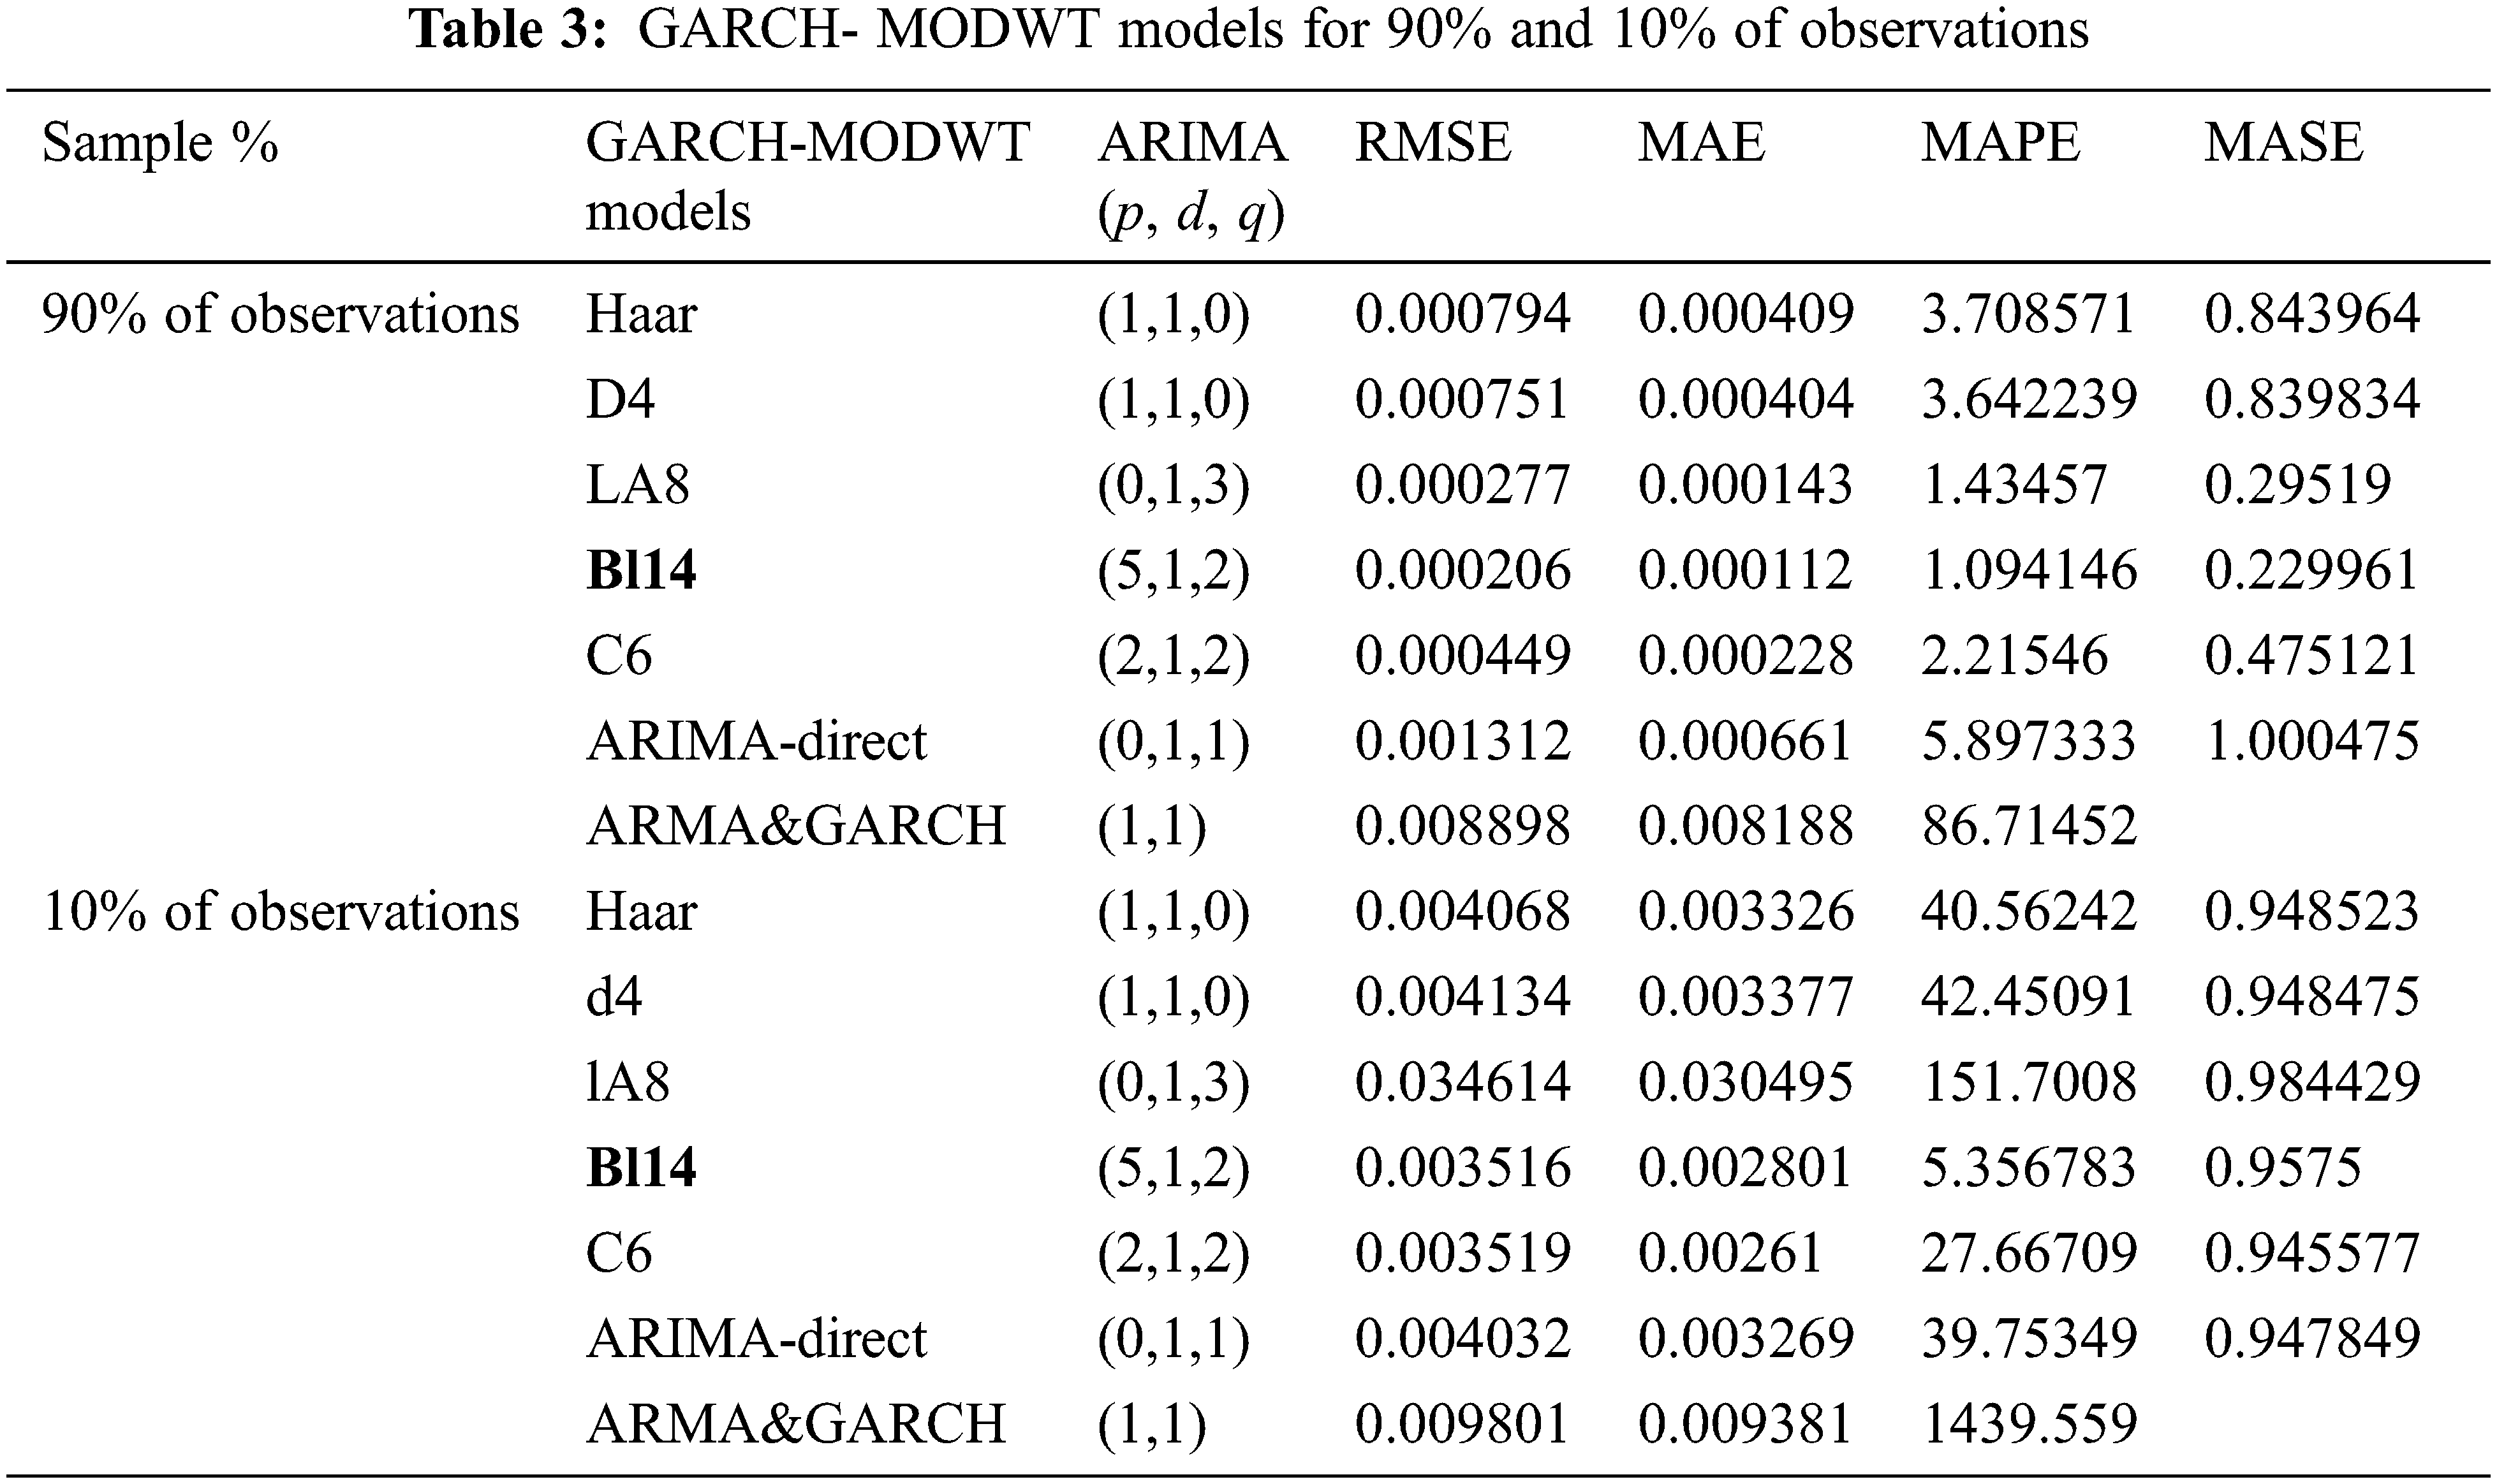
The remaining data set, representing 10% of the original data, was used to test the performance of the suggested models. The results show that the best model is Bl14-EGARCH, since it has the minimum values of the error function that are RMSE =
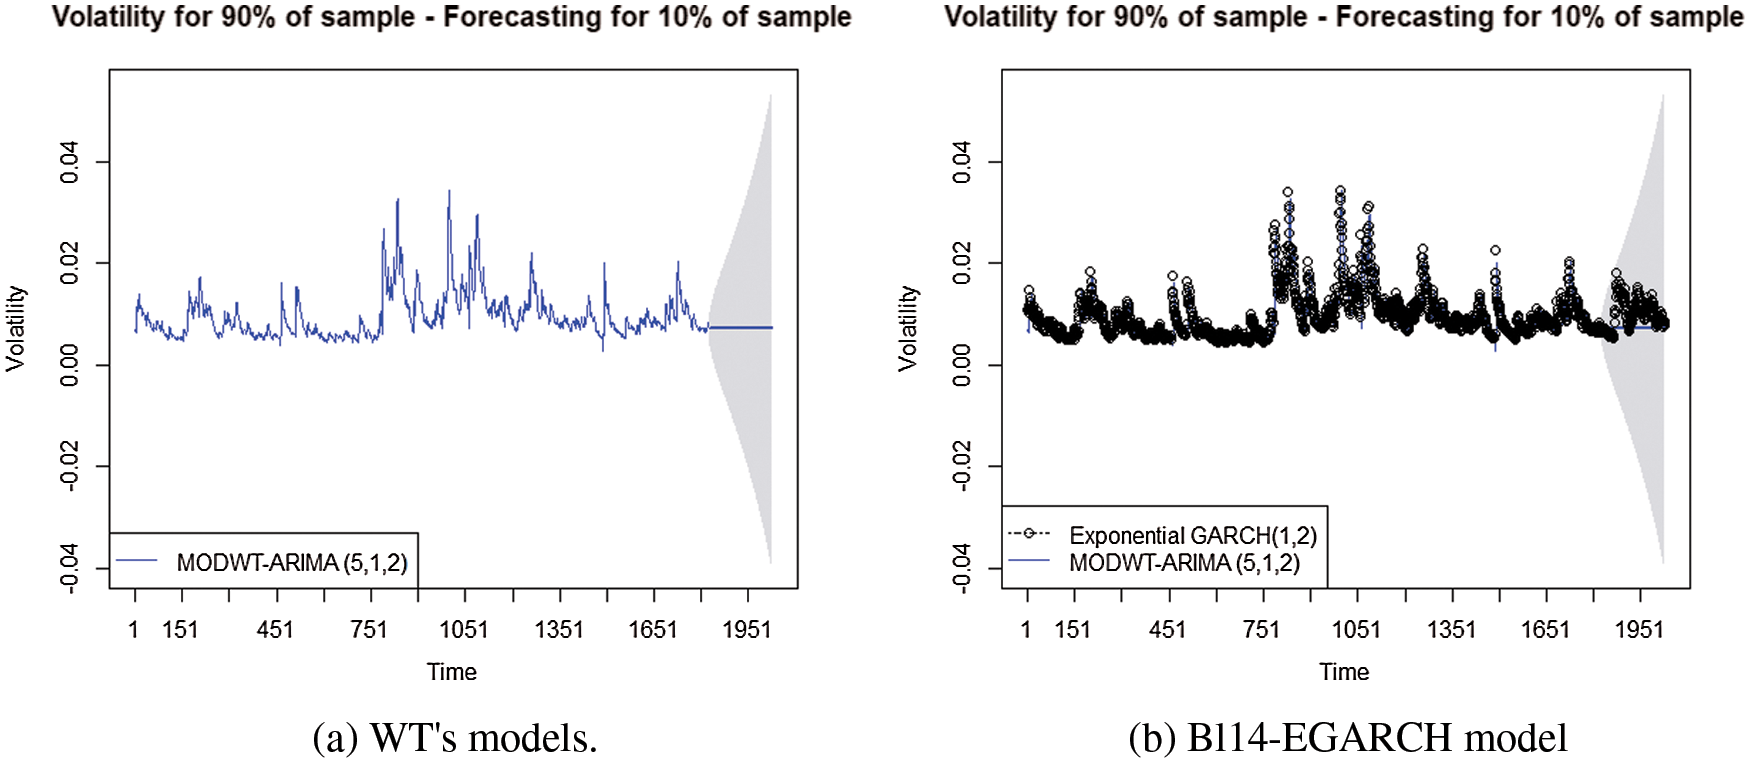
Figure 3: Forecasting diagram from WT’s models and EGARCH- Bl14 model
In this study, we proposed successfully a mathematical model to forecast the financial sustainability especially the stock market volatility pattern. As the forecasting accuracy was studied and improved using the daily returns series of the closing price index in Tadawul from August 2011 to December 2019. The Tadawul was chosen as an example of the emerging markets has significant volatility due to imbalance in information, randomly trading, unprofessional in financial analysis. The results of the model show the great ability to analyze stock exchange data and improve forecast accuracy, especially the most volatile data. Note that, the main objective is to develop forecasting methods to reduce the effects of fluctuations in the financial markets, and thus maintain the stability of the financial markets from sudden shocks. The new model is a hybrid of non-linear spectral model, which is MODWT and the GARCH model. We found that the fit EGARCH model is EGARCH (1, 2) for data set. Furthermore, the combination of Bl14 and EGARCH (1, 2) is the best model compared with other suggested models, which are Haar, D4, C4, LA8 and Bl14-EGARCH (1, 2). Note that, LA8-EGRACH is the combination of the EGARCH (1, 2) model with LA8 function. Bl14-EGRACH is the combination of the EGARCH (1, 2) model with Bl14 model. C6-EGRACH is the combination of the EGARCH (1, 2) model with C6 model. Moreover, the model's ability to analyze important events and predictability was demonstrated. The work can be extended for other stock markets and can be used for any huge number of data.
Funding Statement: The authors received no specific funding for this study.
Conflicts of Interest: The authors declare that they have no conflicts of interest to report regarding the present study.
References
1. R. F. Engle, “Autoregressive conditional heteroscedasticity with estimates of the variance of United Kingdom inflation,” Econometrica: Journal of the Econometric Society, vol. 50, no. 4, pp. 987–1007, 1982. [Google Scholar]
2. T. Bollerslev, “Generalized autoregressive conditional heteroskedasticity,” Journal of Econometrics, vol. 31, no. 3, pp. 307–327, 1986. [Google Scholar]
3. N. N. Hamadneh, W. A. Khan, W. Ashraf, S. H. Atawneh, I. Khan et al., “Artificial neural networks for prediction of covid-19 in Saudi Arabia,” Computers, Materials and Continua, vol. 66, no. 3, pp. 2787–2796, 2021. [Google Scholar]
4. N. N. Hamadneh, M. Tahir and W. A. Khan, “Using artificial neural network with prey predator algorithm for prediction of the COVID-19: The case of Brazil and Mexico,” Mathematics, vol. 9, no. 2, pp. 1–14, 2021. [Google Scholar]
5. P. Verma, A. Dumka, A. Bhardwaj, A. Ashok, M. C. Kestwal et al., “A statistical analysis of impact of COVID19 on the global economy and stock index returns,” SN Computer Science, vol. 2, no. 1, pp. 1–13, 2021. [Google Scholar]
6. N. Engelhardt, M. Krause, D. Neukirchen and P. N. Posch, “Trust and stock market volatility during the COVID-19 crisis,” Finance Research Letters, vol. 38, no. 12, pp. 101873, 2021. [Google Scholar]
7. F. Díaz, P. A. Henríquez and D. Winkelried, “Stock market volatility and the COVID-19 reproductive number,” Research in International Business and Finance, vol. 59, pp. 1–11, 2022. [Google Scholar]
8. B. Rakshit and Y. Neog, “Effects of the COVID-19 pandemic on stock market returns and volatilities: Evidence from selected emerging economies,” Studies in Economics and Finance, vol. ahead-of-print, no. ahead-of-print, pp. 1–23, 2021. [Google Scholar]
9. S. H. Poon and C. W. Granger, “Forecasting volatility in financial markets: A review,” Journal of Economic Literature, vol. 41, no. 2, pp. 478–539, 2003. [Google Scholar]
10. S. Z. S. Abdalla and Z. Suliman, “Modelling stock returns volatility: Empirical evidence from Saudi Stock Exchange,” International Research Journal of Finance and Economics, vol. 85, pp. 166–179, 2012. [Google Scholar]
11. L. Kalyanaraman, “Stock market volatility in Saudi Arabia: An application of univariate GARCH model,” Asian Social Science, vol. 10, no. 10, pp. 142–152, 2014. [Google Scholar]
12. W. Qiao and Z. Yang, “Forecast the electricity price of US using a wavelet transform-based hybrid model,” Energy, vol. 193, pp. 1–20, 2020. [Google Scholar]
13. Z. Yang, L. Ce and L. Lian, “Electricity price forecasting by a hybrid model, combining wavelet transform, ARMA and kernel-based extreme learning machine methods,” Applied Energy, vol. 190, pp. 291–305, 2017. [Google Scholar]
14. A. S. Kumar and S. Anandarao, “Volatility spillover in crypto-currency markets: Some evidences from GARCH and wavelet analysis,” Physica A: Statistical Mechanics and its Applications, vol. 524, no. 4, pp. 448–458, 2019. [Google Scholar]
15. C. Wu, “Window effect with Markov-switching GARCH model in cryptocurrency market,” Chaos, Solitons & Fractals, vol. 146, no. 2, pp. 1–7, 2021. [Google Scholar]
16. M. Jarrah and N. Salim, “A recurrent neural network and a discrete wavelet transform to predict the Saudi stock price trends,” International Journal of Advanced Computer Science and Applications, vol. 10, no. 4, pp. 155–162, 2019. [Google Scholar]
17. Y. Xie, J. Yu and B. Ranneby, “Forecasting using locally stationary wavelet processes,” Journal of Statistical Computation and Simulation, vol. 79, no. 9, pp. 1067–1082, 2009. [Google Scholar]
18. M. T. Ismail, B. Audu and M. M. Tumala, “Volatility forecasting with the wavelet transformation algorithm garch model: Evidence from african stock markets,” Journal of Finance and Data Science, vol. 2, no. 2, pp. 125–135, 2016. [Google Scholar]
19. B. Audu, “Forecasting stock market volatility using wavelet transformation algorithm of garch model,” Ph.D. dissertation, Universiti Sains Malaysia, Malysia, 2017. [Google Scholar]
20. E. Sharghi, V. Nourani, H. Najafi and S. Soleimani, “Wavelet-exponential smoothing: A new hybrid method for suspended sediment load modeling,” Environmental Processes, vol. 6, no. 1, pp. 191–218, 2019. [Google Scholar]
21. J. W. Goodell and S. Goutte, “Diversifying with cryptocurrencies during COVID-19,” SSRN Electronic Journal, vol. 45, no. 2, pp. 1–38, 2020. [Google Scholar]
22. M. A. Finta, B. Frijns and A. Tourani-Rad, “Volatility spillovers among oil and stock markets in the US and Saudi Arabia,” Applied Economics, vol. 51, no. 4, pp. 329–345, 2019. [Google Scholar]
23. R. Jammazi, “Cross dynamics of oil-stock interactions: A redundant wavelet analysis,” Energy, vol. 44, no. 1, pp. 750–777, 2012. [Google Scholar]
24. I. Ghosh and T. Chaudhuri, “Understanding and forecasting stock market volatility through wavelet decomposition, statistical learning and econometric methods,” SSRN, pp. 1–16, 2016. http://dx.doi.org/10.2139/ssrn.2930876. [Google Scholar]
25. R. K. Paul, R. Saxena, S. Chaurasia and S. Rana, “Examining export volatility, structural breaks in price volatility and linkages between domestic and export prices of onion in India,” Agricultural Economics Research Review, vol. 28, no. 347-2016-17200, pp. 101–116, 2015. [Google Scholar]
26. K. Arias-Calluari, F. Alonso-Marroquin, M. N. Najafi and M. Harré, “Methods for forecasting the effect of exogenous risks on stock markets,” Physica A: Statistical Mechanics and its Applications, vol. 568, no. 5, pp. 125587, 2021. [Google Scholar]
27. A. H. Alenezy, M. T. Ismail, S. A. Wadi, M. Tahir, N. N. Hamadneh et al., “Forecasting stock market volatility using hybrid of adaptive network of fuzzy inference system and wavelet functions,” Journal of Mathematics, vol. 2021, no. 4, pp. 1–10, 2021. [Google Scholar]
28. R. Gençay, F. Selçuk and B. J. Whitcher, An introduction to wavelets and other filtering methods in finance and economics. Amsterdam, Netherlands: Elsevier, 2001. [Google Scholar]
29. J. J. Jaber, N. Ismail, S. Ramli, S. Al Wadi and D. Boughaci, “Assessment OF credit losses based ON arima-wavelet method,” Journal of Theoretical and Applied Information Technology, vol. 98, no. 9, pp. 1379–1392, 2020. [Google Scholar]
30. C. Chatfield and H. Xing, The analysis of time series: An introduction with R. London, UK: Chapman and Hall/CRC, 2019. [Google Scholar]
31. N. N. Hamadneh, “Dead sea water levels analysis using artificial neural networks and firefly algorithm,” International Journal of Swarm Intelligence Research (IJSIR), vol. 11, no. 3, pp. 19–29, 2020. [Google Scholar]
32. J. J. Jaber, N. Ismail, S. N. M. Ramli, B. Albadareen and N. N. Hamadneh, “Estimating loss given default based on beta regression,” Computers, Materials & Continua, vol. 66, no. 3, pp. 3329–3344, 2021. [Google Scholar]
33. N. N. Hamadneh, W. S. Khan and W. A. Khan, “Prediction of thermal conductivities of polyacrylonitrile electrospun nanocomposite fibers using artificial neural network and prey predator algorithm,” Journal of King Saud University-Science, vol. 31, no. 4, pp. 618–627, 2019. [Google Scholar]
34. C. Francq, L. Horvath and J. M. Zakoïan, “Merits and drawbacks of variance targeting in GARCH models,” Journal of Financial Econometrics, vol. 9, no. 4, pp. 619–656, 2011. [Google Scholar]
Cite This Article
 Copyright © 2023 The Author(s). Published by Tech Science Press.
This work is licensed under a Creative Commons Attribution 4.0 International License , which permits unrestricted use, distribution, and reproduction in any medium, provided the original work is properly cited.
 Downloads
 Citation Tools