
 Submit a Paper
 Propose a Special lssue
 Open Access
ARTICLE
Generating of Test Data by Harmony Search Against Genetic Algorithms
1 Department of Information Technology, College of Computers and Information Technology, Taif University, P.O. Box 11099, Taif, 21944, Saudi Arabia
2 Department of Mathematics and Computer Science, Faculty of Science, Beni-Suef University, Beni-Suef, 62521, Egypt
* Corresponding Author: Ahmed S. Ghiduk. Email:
Intelligent Automation & Soft Computing 2023, 36(1), 647-665. https://doi.org/10.32604/iasc.2023.031865
Received 28 April 2022; Accepted 29 June 2022; Issue published 29 September 2022
 View Full Text
 Download PDF
Abstract
Many search-based algorithms have been successfully applied in several software engineering activities. Genetic algorithms (GAs) are the most used in the scientific domains by scholars to solve software testing problems. They imitate the theory of natural selection and evolution. The harmony search algorithm (HSA) is one of the most recent search algorithms in the last years. It imitates the behavior of a musician to find the best harmony. Scholars have estimated the similarities and the differences between genetic algorithms and the harmony search algorithm in diverse research domains. The test data generation process represents a critical task in software validation. Unfortunately, there is no work comparing the performance of genetic algorithms and the harmony search algorithm in the test data generation process. This paper studies the similarities and the differences between genetic algorithms and the harmony search algorithm based on the ability and speed of finding the required test data. The current research performs an empirical comparison of the HSA and the GAs, and then the significance of the results is estimated using the t-Test. The study investigates the efficiency of the harmony search algorithm and the genetic algorithms according to (1) the time performance, (2) the significance of the generated test data, and (3) the adequacy of the generated test data to satisfy a given testing criterion. The results showed that the harmony search algorithm is significantly faster than the genetic algorithms because the t-Test showed that the p-value of the time values is 0.026 < α (α is the significance level = 0.05 at 95% confidence level). In contrast, there is no significant difference between the two algorithms in generating the adequate test data because the t-Test showed that the p-value of the fitness values is 0.25 > α.Keywords
Many search-based algorithms, particularly genetic algorithms [1,2] and harmony search algorithms [3,4], have been successfully employed in a wide range of software engineering fields. GAs are considered the most utilized search-based algorithms in solving software engineering problems [5]. GAs imitate the theory of natural selection and evolution. HSA is regarded as the most recent search algorithm in the last years, proposed by Geem et al. in 2001. It imitates the behavior of a musician to find the best harmony.
Scholars have conducted comparative studies to estimate the similarities and differences between genetic algorithms and harmony search algorithms in diverse research domains [6–10].
Peraza et al. [6] compared HSA and GAs using a set of mathematical problems to estimate the efficiency of each algorithm. The obtained results showed that the efficiency of the harmony search algorithm is better than the efficiency of genetic algorithms in solving the selected mathematical problems. Kim et al. [7] compared the harmony search algorithm with genetic algorithms in solving the max-cut problem. The suggested harmony search algorithm gave superior results to genetic algorithms. Ghozi et al. [8] employed the harmony search algorithm and genetic algorithms to solve the geometry optimization problem of a steel structure. The results showed that the harmony search algorithm is 53% faster than genetic algorithms. Zongo et al. [9] used the harmony search algorithm to solve the power dispatch problem and compared the obtained results with genetic algorithms and particle swarm optimization techniques. The obtained results showed that the harmony search algorithm produces the minimum cost of production of real power and the minimum power loss in the system. Khan et al. [10] employed and compared HSA and GAs to find the solution to generator maintenance scheduling problems for water and power development authorities. The results of the experiments conducted by HSA are superior to those obtained by GAs. In addition, HSA is completely fast and needs less time for execution.
Genetic and harmony search algorithms have been successfully employed in many software testing processes. GAs have been successfully used in software testing [11,12], cost estimation [13], project management, and others [14]. Lately, the harmony search algorithm has been successfully used in several software engineering processes [15,16] (e.g., software testing [17] and cost estimation [18], software modularization [19], fault prediction [20], and software architecture design [21]). Both genetic algorithms and the harmony search algorithm have been utilized in many similar tasks in software engineering. Therefore, many comparative studies are needed to estimate the efficiency of GAs and HSA in these tasks and explore the similarities and differences between them.
This paper assesses the similarities and the differences between the genetic algorithms and the harmony search algorithm in the software engineering domain. The current paper introduces a comparative study between the genetic algorithms with the harmony search algorithm in the test data generation process. This study explores the similarities and differences between genetic algorithms and harmony search algorithms based on the ability to find the required test data. This study compares the HSA and GAs experimentally by conducting an empirical comparison and statistically by applying the t-Test to the results of the empirical study. The study investigates the efficiency of the harmony search algorithm and the genetic algorithms according to the time performance, the significance of the generated test data, and the adequacy of the generated test data to satisfy a given testing criterion. The comparison results showed that the harmony search algorithm is significantly faster than the genetic algorithms. In contrast, there is no significant difference between the efficiency of the harmony search algorithm and the genetic algorithms in generating adequate test data.
The structure of the paper is as follows. Section 2 introduces the concepts of genetic algorithms, the harmony search algorithm, and test data generation. Section 3 presents the details of the comparison between HSA and GAs and the obtained results as well. The conclusion of the paper is given in Section 4.
This section briefly gives the concepts of the two compared algorithms (the GAs and the HSA) and the software testing criterion employed to compare the two algorithms.
Genetic algorithms (GAs) [1,2] were proposed to find the optimal solutions for some optimization problems. They imitate the theory of natural selection and evolution. GAs use a random set of solutions as the initial population (P). Then, GAs repeatedly apply two evolution processes (crossover and mutation) to the initial set of solutions to get the optimal solution. The pseudocode of the standard genetic algorithm is given in Fig. 1. Besides, a brief description of this procedure is given below.
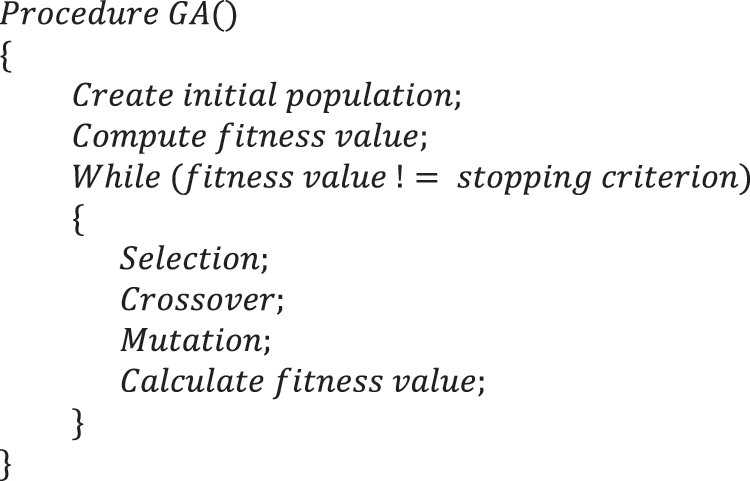
Figure 1: Pseudocode of genetic algorithms
The basic procedure of GAs consists of five phases. In the first phase, a set of PS elements is randomly generated. Each element in that set represents a candidate solution for the given problem. Every element in the solution set is called a chromosome, and the solution set is called a population. Each chromosome comprises N values called genes. Genes’ values can be numerical, binary, or characters. For example, the initial population
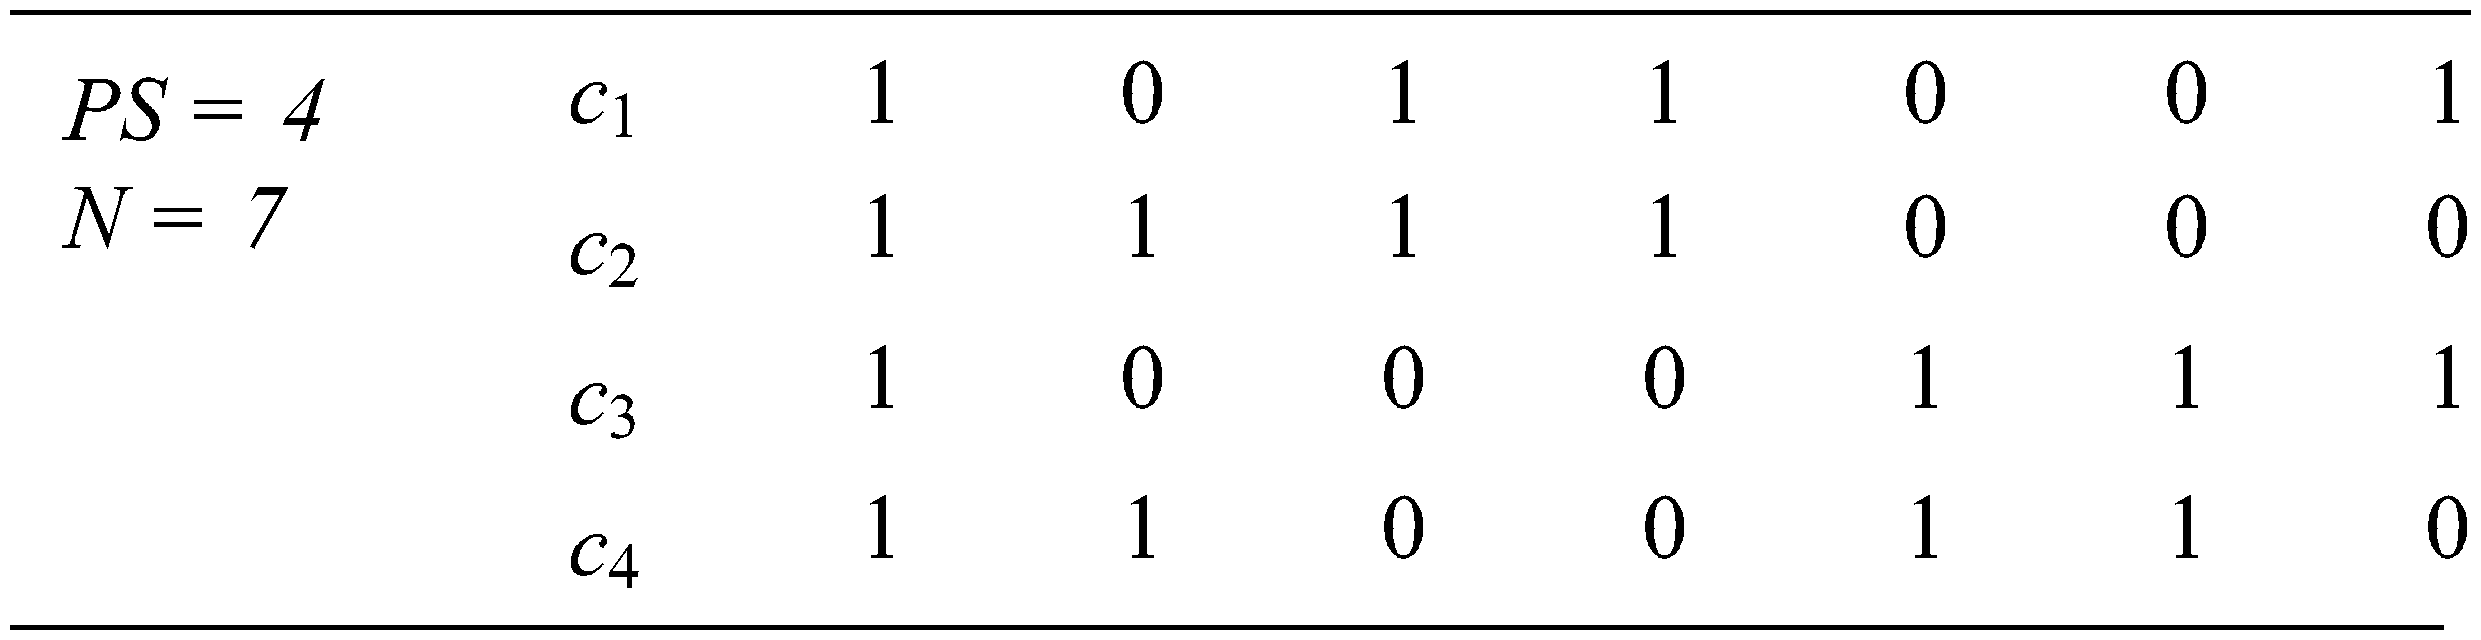
The population size (PS) is experimentally determined, while the length (N) of the chromosome is problem-based. The binary values in each chromosome are decoded into numerical values to get the required inputs. In the test input generation process, the chromosome is a suite of inputs of the tested software [11], and the length N depends on the domains of these inputs.
The second phase is the most critical phase in GAs and all search-based algorithms. The importance of this stage comes from the Fitness Function (f), which represents the problem to be solved. All search-based algorithms aim to find the optimal solution for the fitness function. This fitness function assesses each candidate solution (chromosome). In the test data generation process, the fitness function can be the coverage ratio of paths or branches in coverage testing [11,12] or the killing ratio in mutation testing [22]. After assessing each chromosome using f, each chromosome gets a fitness value as below.
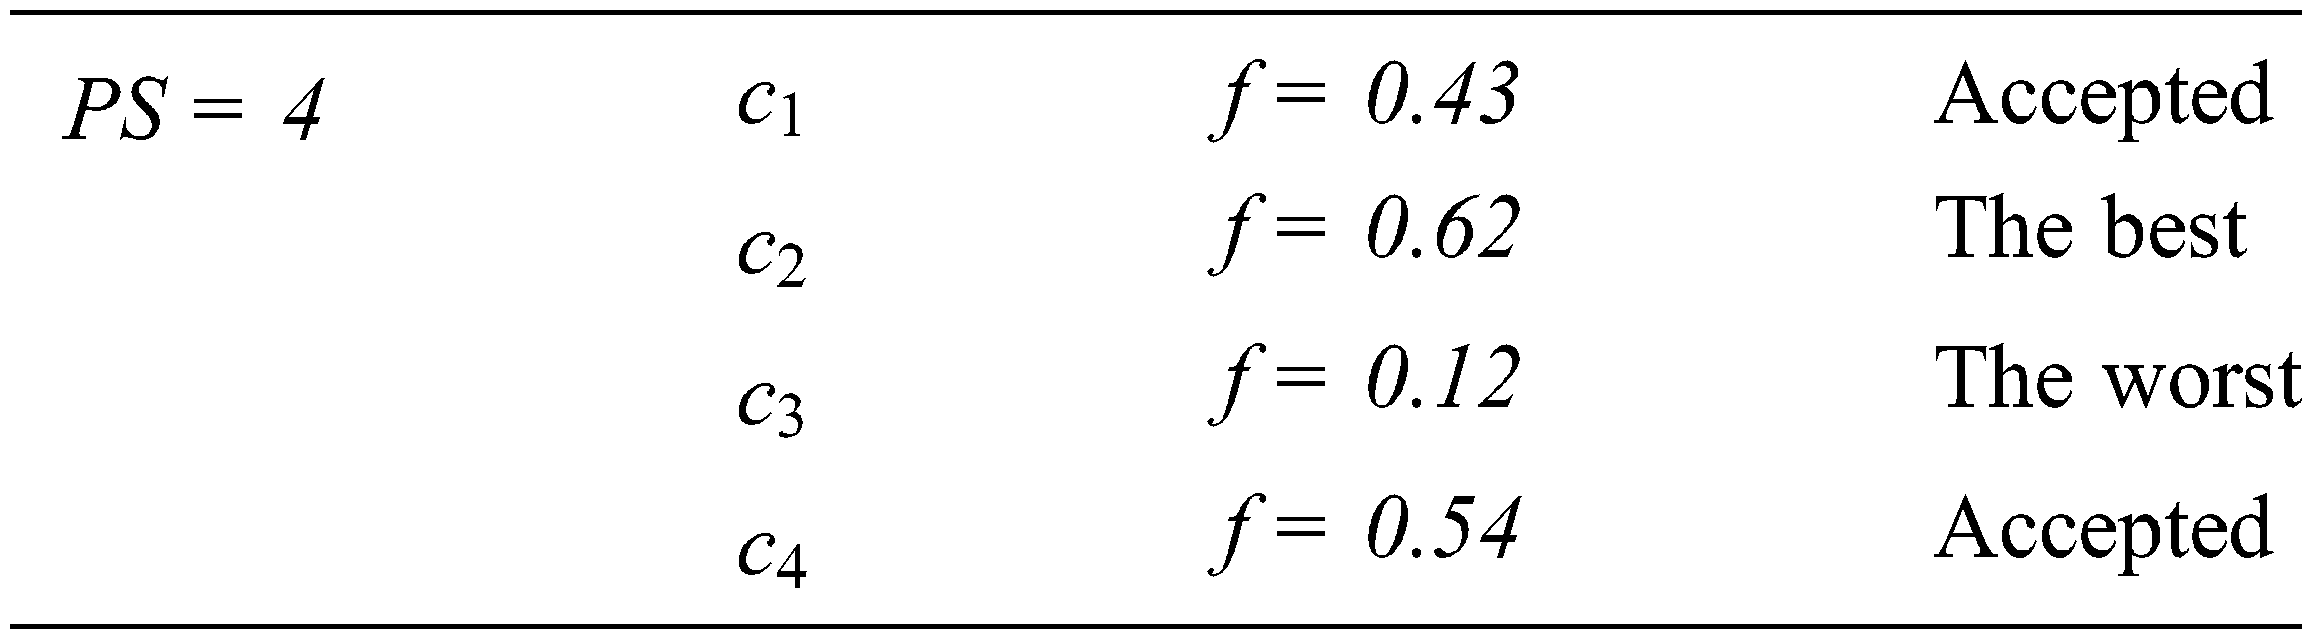
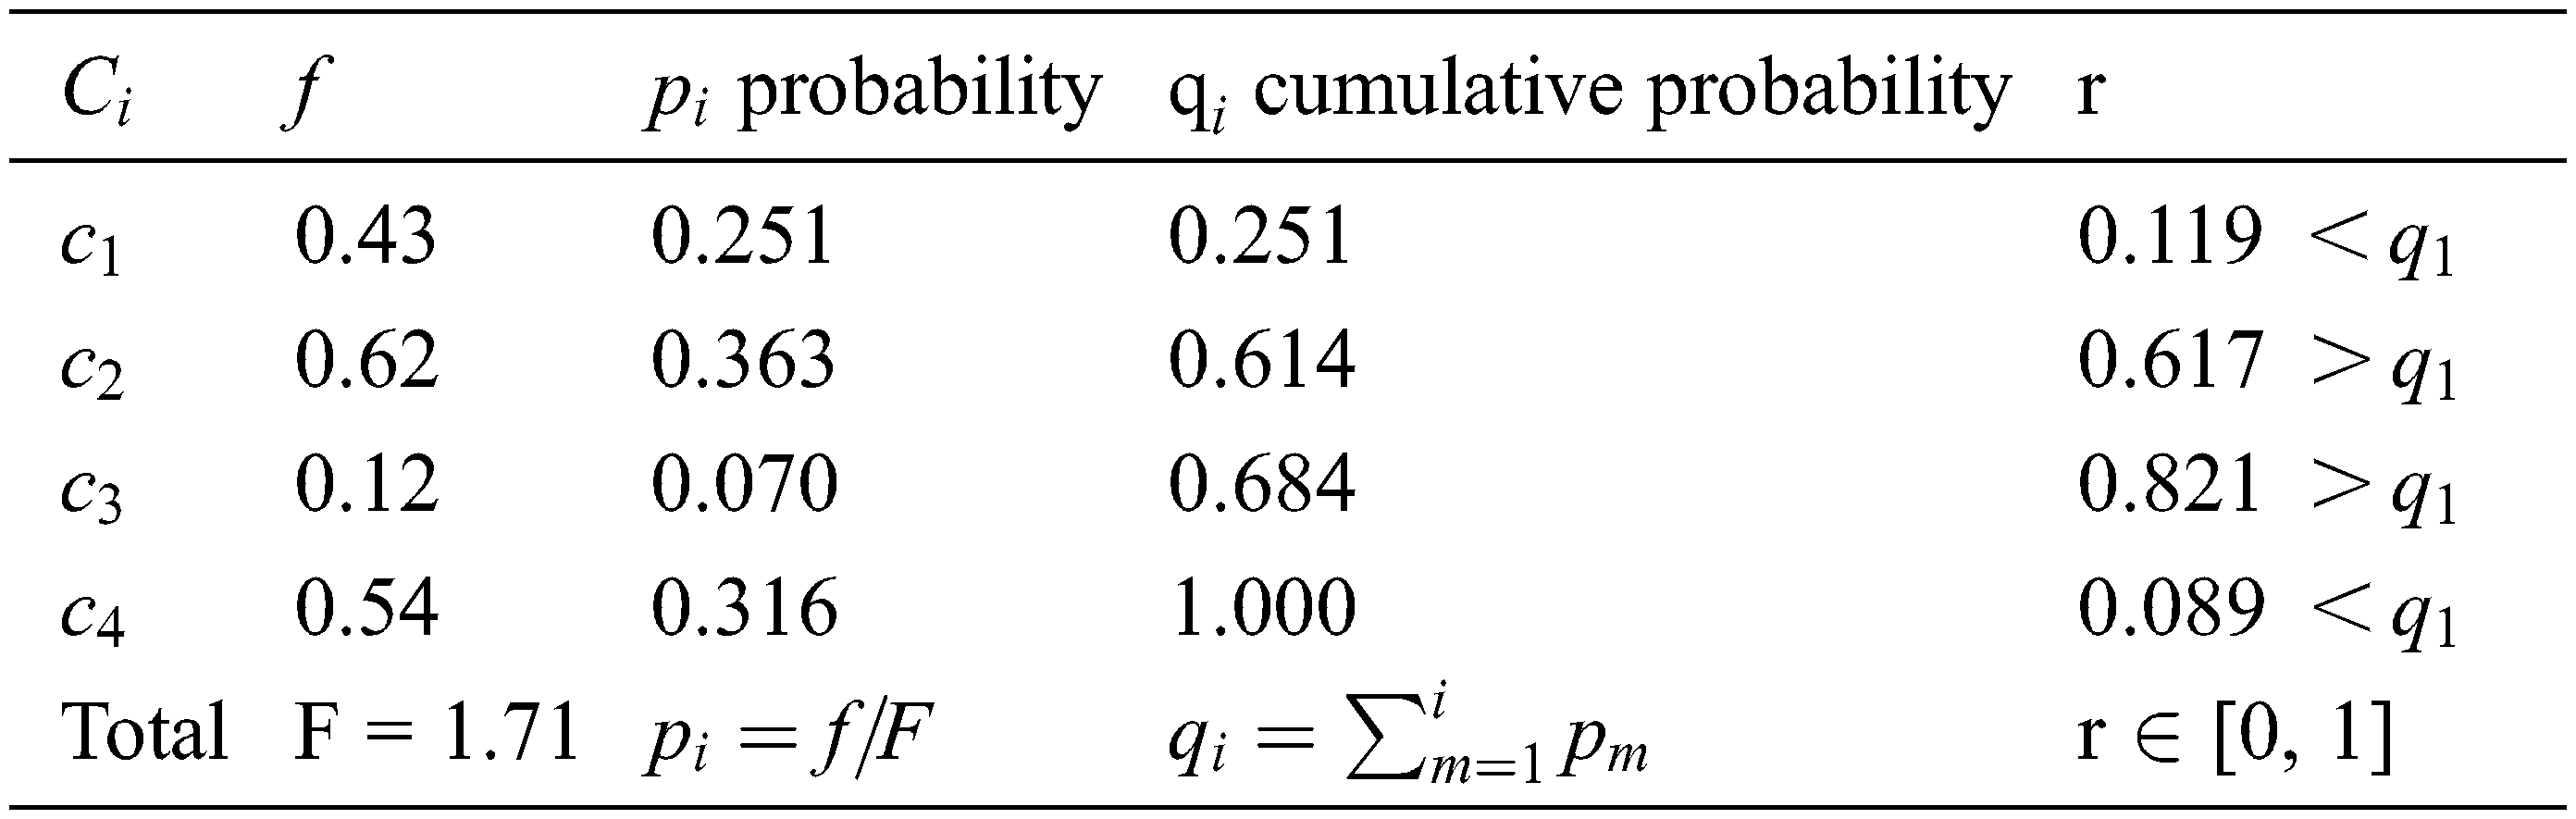
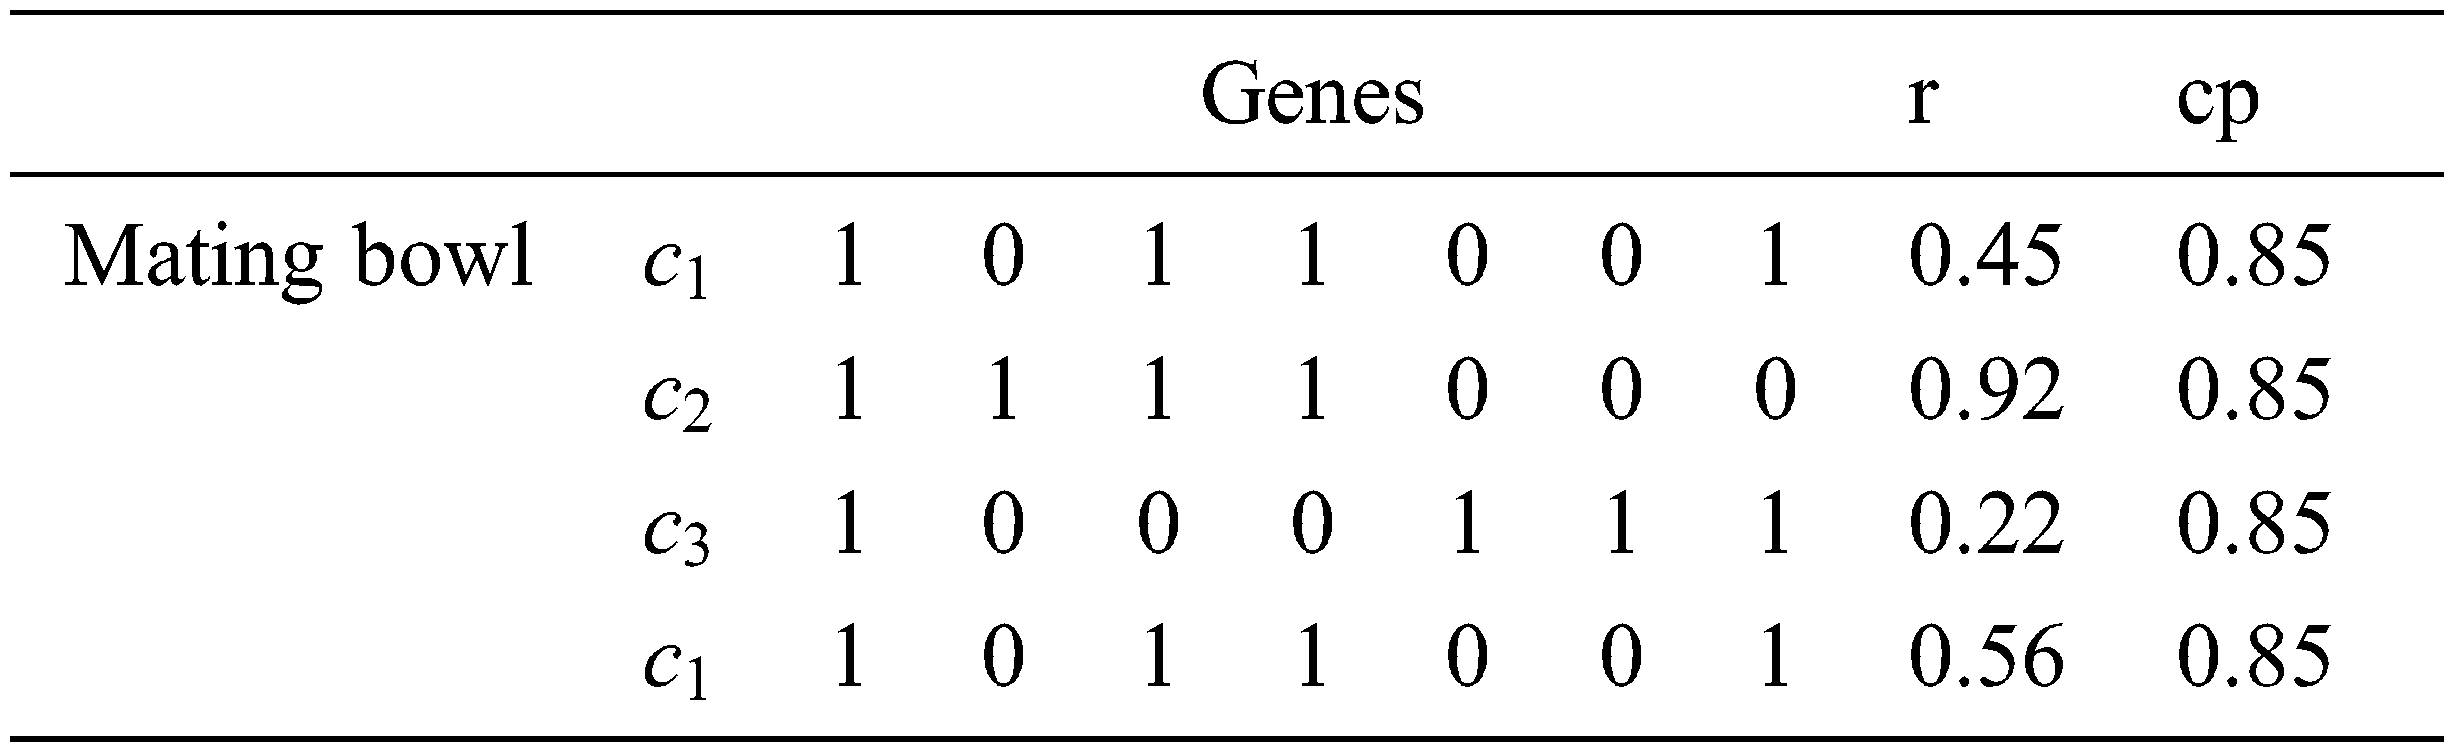
The third phase is the selection phase. Some solutions/chromosomes (mating bowl) are selected for breeding and reproduction to find new solutions. Selecting the solutions in the mating bowl can be performed by the roulette wheel, rank selection method, or others [1,2]. The roulette wheel method selects the chromosome based on the ratio of its fitness value to the total fitness. The roulette wheel finds for each chromosome the total fitness (F), the probability (
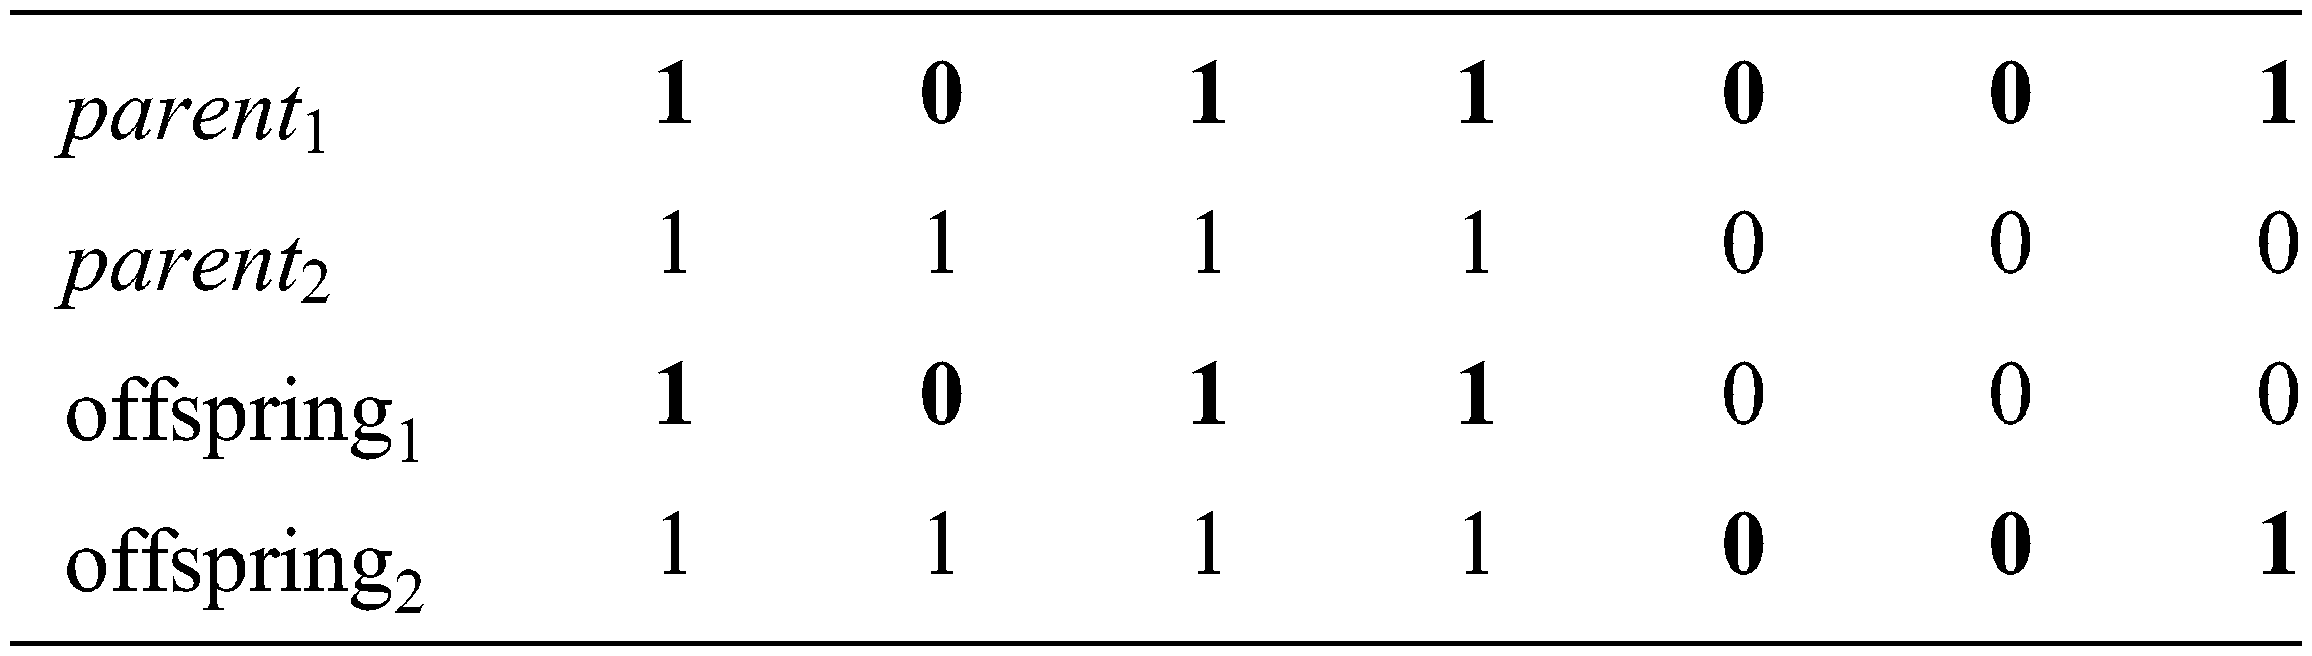
The fourth phase (Crossover) [1,2] is the vital process in the GAs. In the crossover, two chromosomes are selected from the mating bowl. Then, a body of genes is exchanged between the chromosomes chosen to produce two new offsprings. Crossover creates a random number r from [0, 1] for each chromosome on the mating bowl and compares it with the cp value (crossover probability). If r < cp for a chromosome, then this chromosome will participate in the crossover operation.
To produce the new offsprings, every couple of the picked chromosomes (parents) exchange their genes at a randomly chosen position. This process is repeated over and over till the population is completed.
The fifth phase is the Mutation operation [1,2] that takes place after the crossover operation. For each chromosome in the current population, the mutation operator creates a random number r from the range [0, 1] for each gene. If r < mp (mutation probability), then the value of this gene is flipped as follows.
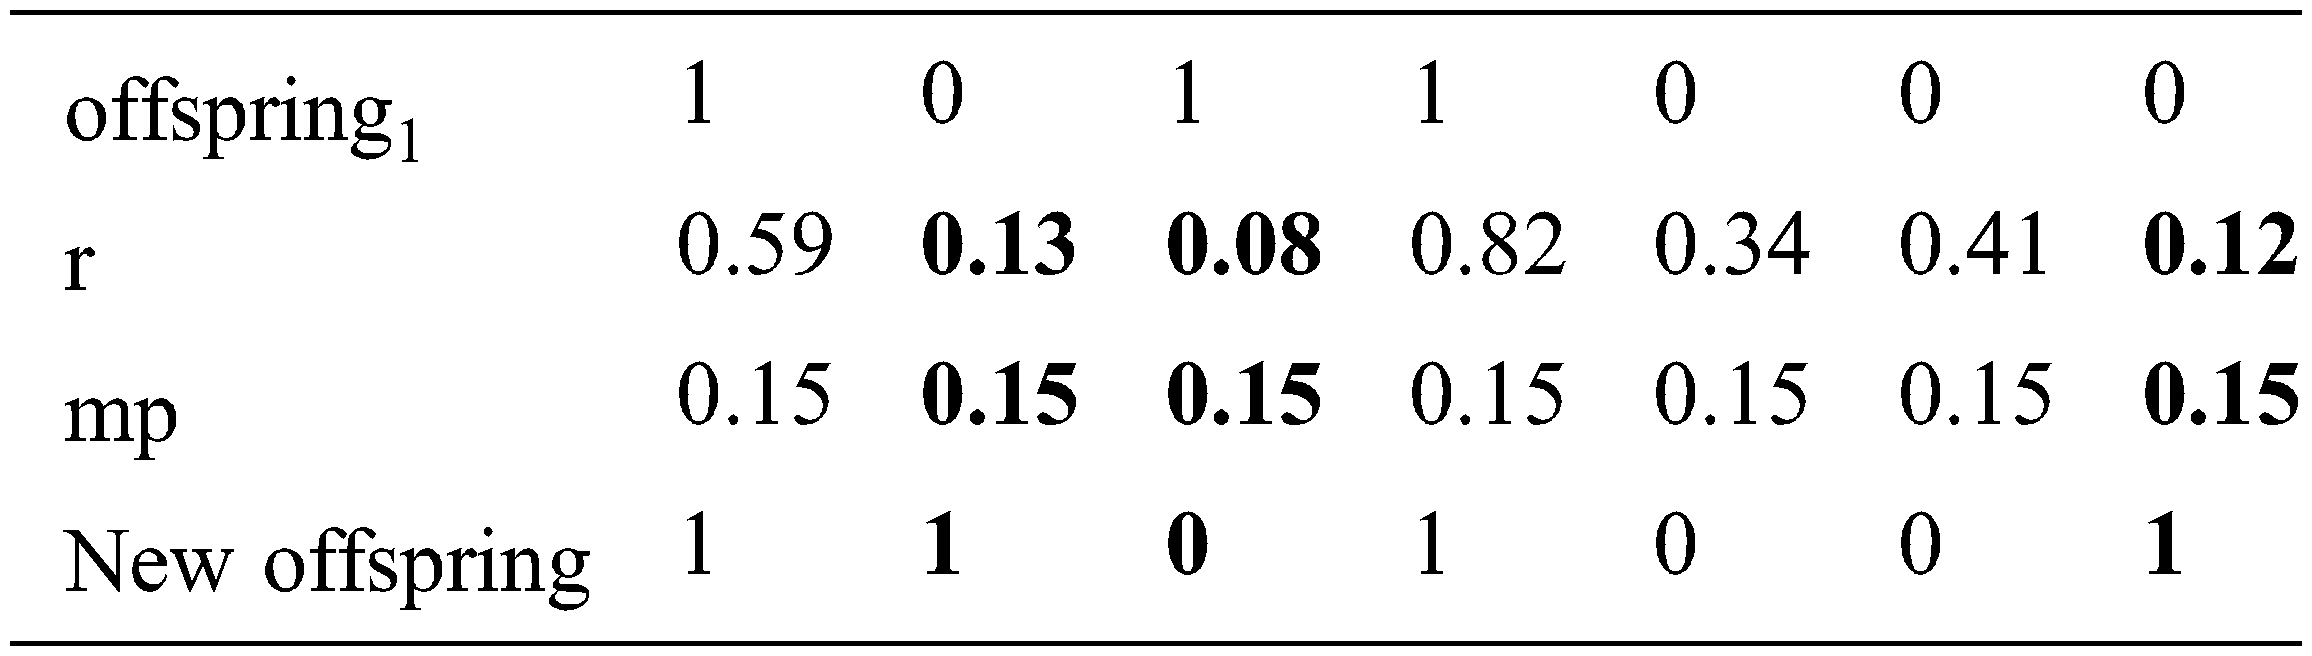
Finally, this procedure is repeated over and over till getting the optimal solution or reaching the maximum number of generations. Scholars used cp = 0.85 and mp = 0.15, which are problem based.
The harmony search algorithm (HSA) is one of the most recent search algorithms. HSA has been developed by Geem et al. [3] to solve some optimization problems. It imitates the behavior of a musician to find the best harmony. HSA starts its operations with a set of randomly generated solutions (harmonies) and saves them in the Harmony Memory (HM). Then, a new solution is randomly created based on two factors (Harmony Memory Considering Rate (HMCR) and Pitching Adjustment Rate (PAR)). If the new solution is better than the worst one in the HM, then the new solution takes the place of the worst one in the HM. The pseudocode of the harmony search algorithm is given in Fig. 2, and its description is given below.
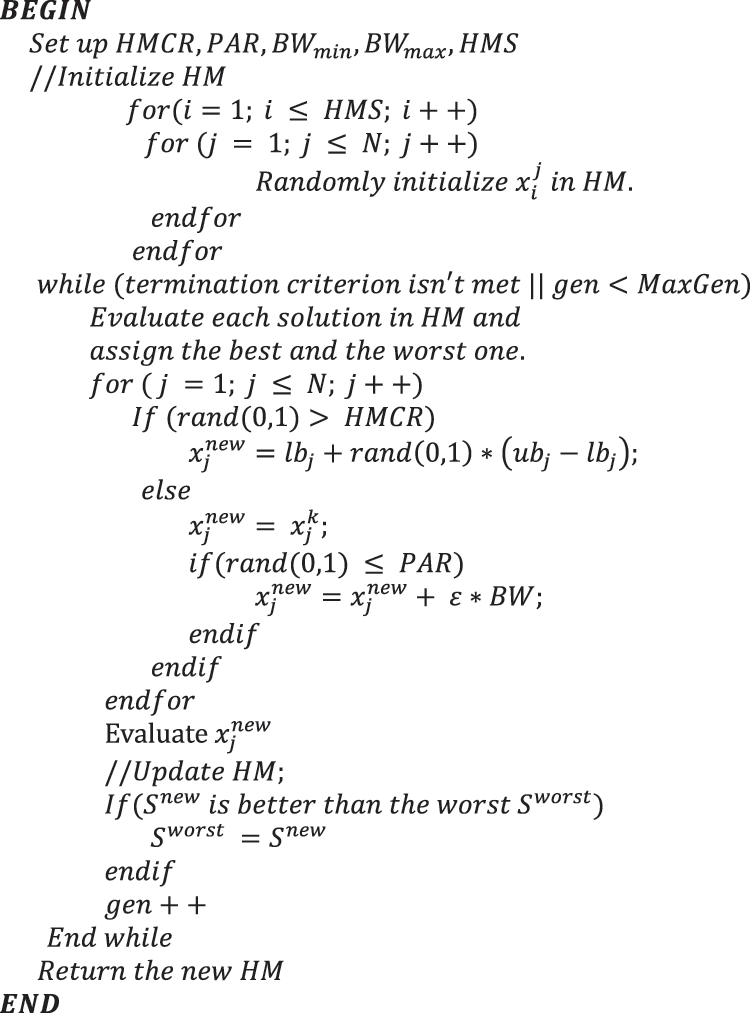
Figure 2: Pseudocode of harmony search algorithm
Firstly, the five critical factors of the harmony memory search algorithm are selected. These factors are (1) the number of solutions in the HM or the harmony memory size (HMS), (2) HMCR (the harmony memory considering rate), (3) PAR (the pitch adjustment rate), (4) the maximum number of generation (MaxGen), and (5) the distance bandwidth between variables or pitch adjustment bandwidth (BW). The PAR and the HMCR values are randomly selected from the range [0, 1], while the bandwidth value (BW) is computed using the following formula.
where
Secondly, a random set of solutions is generated after setting up the parameters of the HSA. This set consists of HMS elements (solutions), and every element consists of N values. This set is called the harmony search memory (HM). Therefore, this set can be considered as a matrix with HMS rows and N columns. The general form of this matrix is given below.
Each solution is a row or set of values as
The third step is evaluating the fitness of each solution. As in genetic algorithms, this step is the most critical in the HSA. The task of this step is formulating the Fitness Function (f), which represents the problem to be solved. Preparing this function is the main challenge for the HAS, and HSA aims to find the optimal solution for the fitness function. The fitness function assesses each solution. Then, the best and the worst solutions in the HM are marked. In test input generation, the fitness function can be the proportion of the number of the covered branches to the total number of branches in the control-flow graph.
The fourth step is the vital process in the HSA, which improvises the new harmony (solution) based on the HMCR, the PAR, and the BW. This process is performed as follows.
Suppose the new solution is
In the beginning, a number
Finally, the fitness value of
Test data [23,24] are a set of inputs utilized to execute the program under test and prove its correctness by exploring errors’ existence. For example, the set of test data {(4, 5, 6), (5, 5, 5) (3, 3, 4)} consists of three test input groups for the triangle classifier program. The volume of the detected errors measures the quality of the test data. The adequacy of the test data can be measured by the satisfaction of a specific test coverage criterion [25,26].
Generating the test data [23,24], whether manual or automatic, is a critical issue in the software testing process. The manual generation of the test data is time-consuming and isn’t a successful technique in producing the desired data. This dilemma drives the tester to create the test data automatically to reduce the consumed time.
The scholars introduced several methods for the automatic generation of these data. The first class of these techniques depends on the random generation of the test data [27,28]. The second class of these methods depends on mutation testing to generate the test data [29,30]. The third class of these methods depends on the search-based algorithms that are the most used techniques in generating the test data [11,17]. The last class of these methods depends on merging two or more of the previous approaches to find the test data. [31].
3 Harmony Search Algorithm vs. Genetic Algorithms
This section introduces the details of the comparative study. This study compares the harmony search algorithm and genetic algorithms theoretically and empirically.
The analytical comparison illustrates the necessary settings for each algorithm of the compared algorithms and the efficiency of each one according to the previous comparative studies. Tab. 1 gives the differences and similarities between HSA and GAs based on the theoretical analysis of the related work.
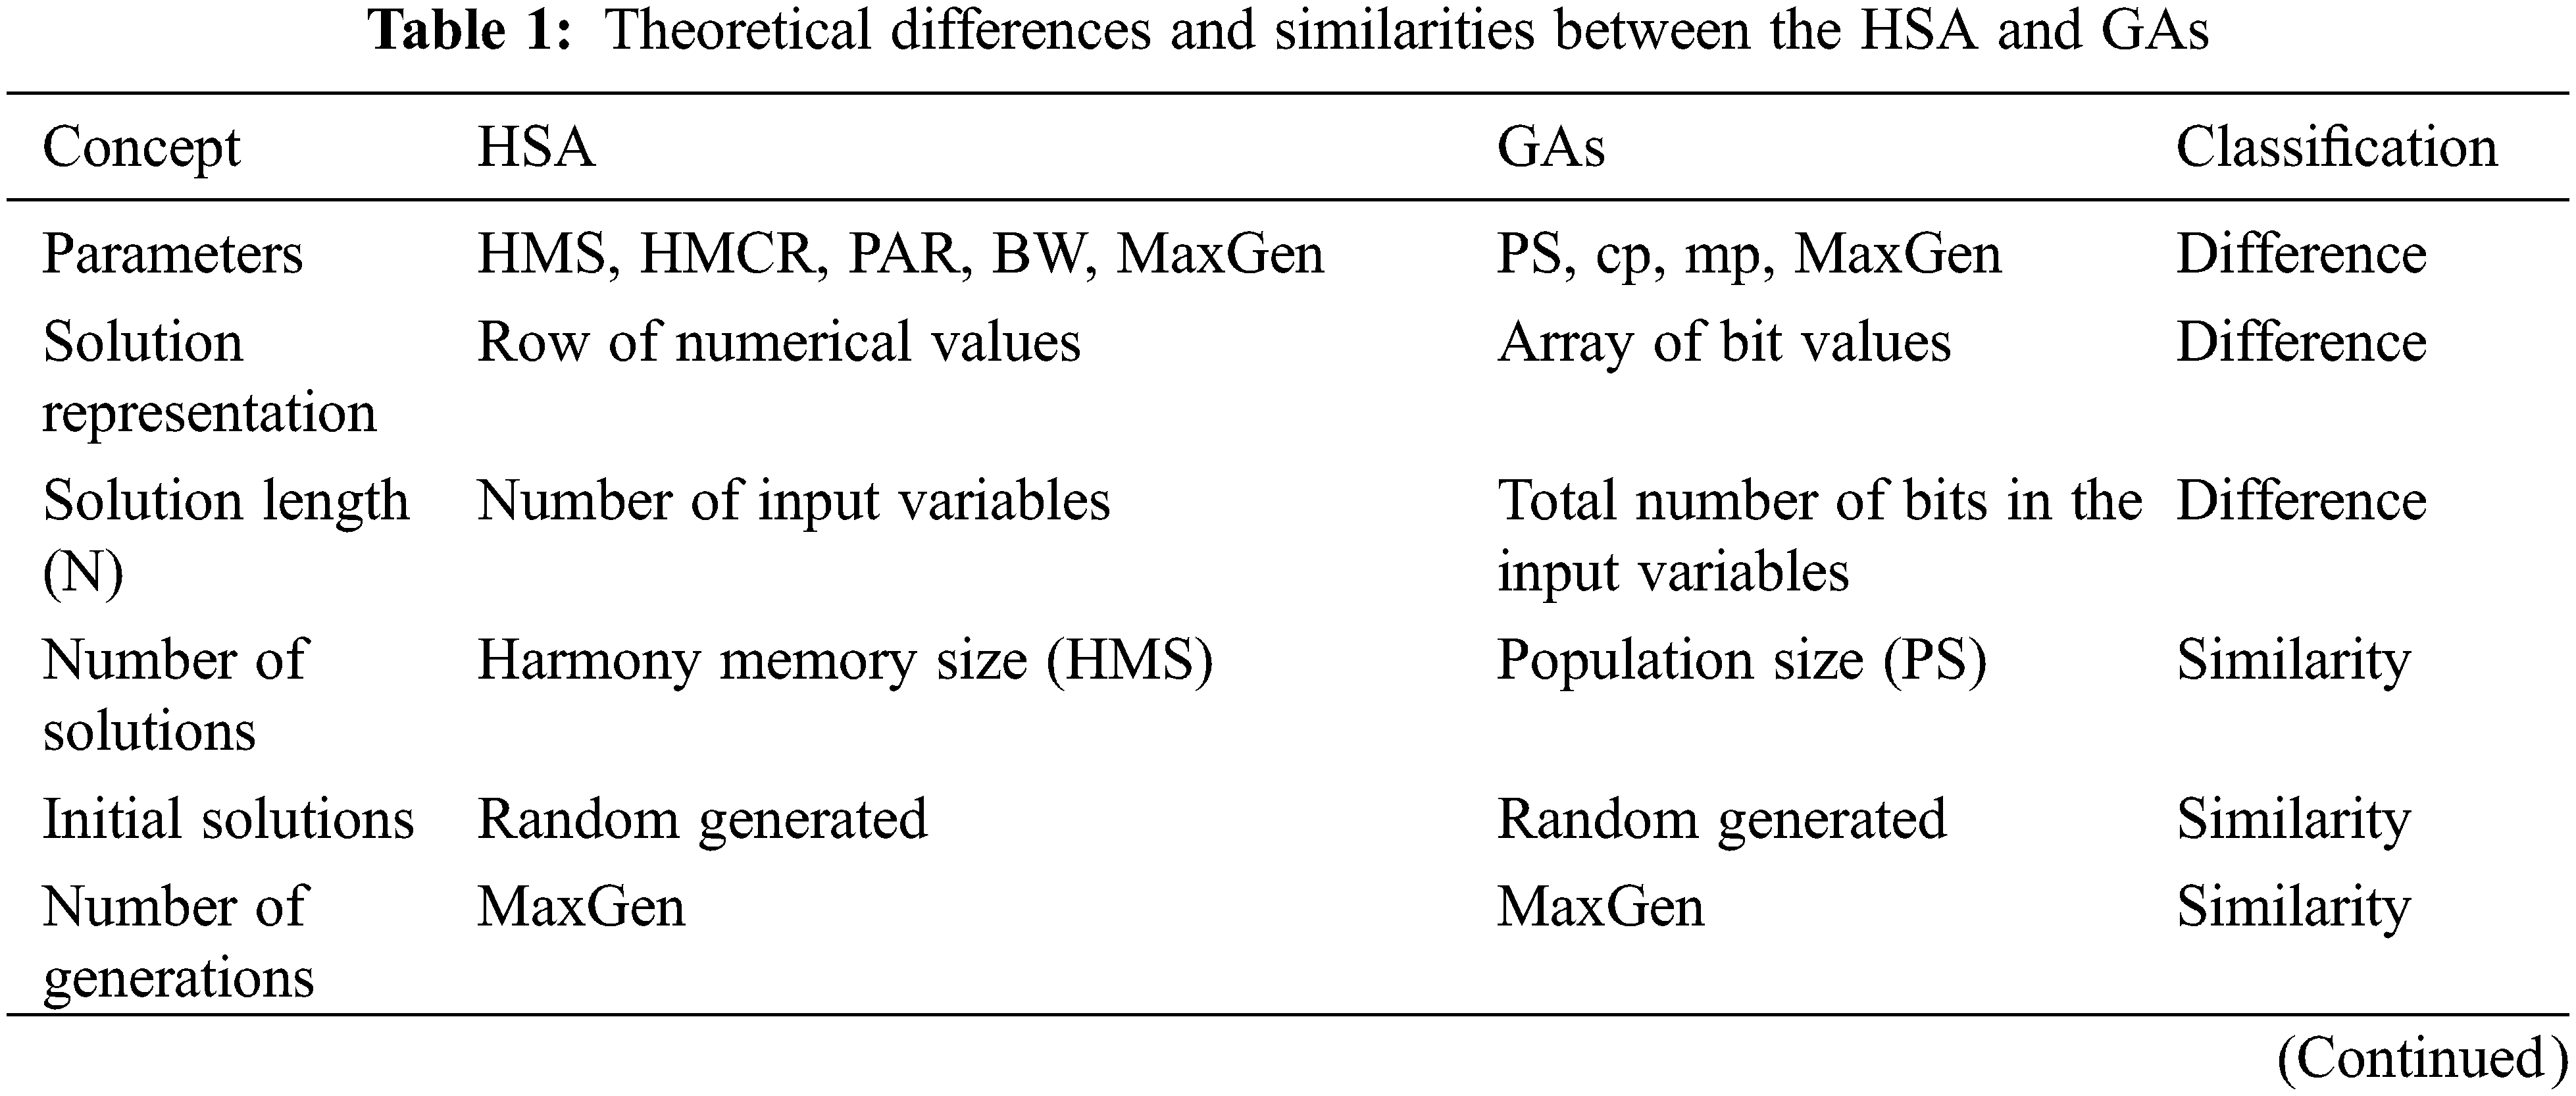
From Tab. 1, there are many similarities between the harmony search algorithm and the genetic algorithms. Both HSA and GAs can formulate the given optimization problem as a fitness function and solve it significantly. Both HSA and GAs start with a random set of solutions with configurable size, and each algorithm evolves the initial set many times to find the targeted solution. The HSA and the GAs have been utilized in several software engineering aspects. The genetic algorithms have been successfully used in software testing [11,12], cost estimation [13], project management, and others [14]. The harmony search algorithm has been successfully used in several software engineering processes such as software testing [17], cost estimation [18], software modularization [19], fault prediction [20], and software architecture design [21]. The harmony search algorithm [17] and the genetic algorithms [11] have been successfully used in test data generation. The applications of the harmony search algorithm and the applications of genetic algorithms are surveyed in ref [15] and ref [5], respectively.
From Tab. 1, there are some differences between the harmony search algorithm and genetic algorithms. The significant difference between the harmony search algorithm and the genetic algorithm is the reproduction process. Genetic algorithms use two operations (crossover and mutation) to generate the new solution. In contrast, the harmony search algorithm improvises a new solution using a specific formula in terms of HMCR, PAR, and BW. The harmony search algorithm represents the solution as an array of numerical values, but genetic algorithms represent the solution as an array of binary values. The length of this array depends on the number of input variables in the given problem. According to the previous comparative studies [6–10], the harmony search algorithm is faster than the genetic algorithms in solving the given problem.
The empirical comparison aims at estimating the similarity and dissimilarity between the harmony search algorithm and the genetic algorithms and their efficiency in generating the test data. The settings, procedure, and results of the comparative study given below depend on the guidelines proposed by Coccia et al. [32]. To illustrate this comparison, the triangle classifier program (Fig. 3) will be the program under test. This program gets three non-zero positive numerical values and returns the type of the triangle according to its sides as equilateral, isosceles, and scalene. Suppose the domain of each one of the input variables x, y, and z is [1, 10].
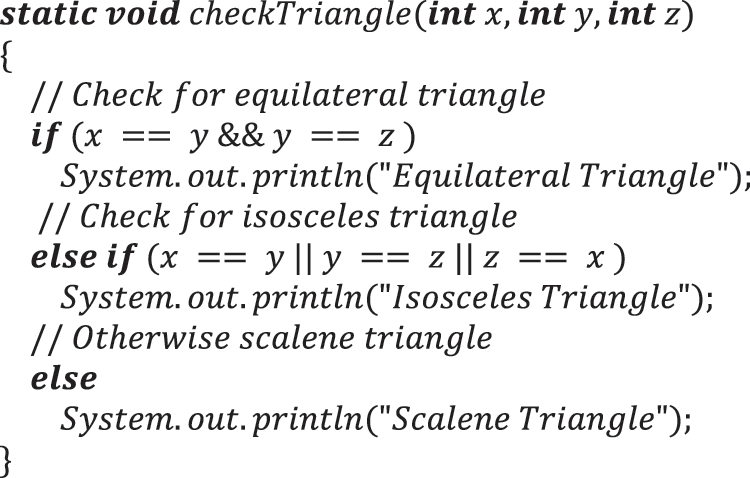
Figure 3: Java triangle classifier program
For the fairness between the two compared algorithms (HSA and GAs), the settings of these algorithms were adjusted similarly (see Tab. 2).
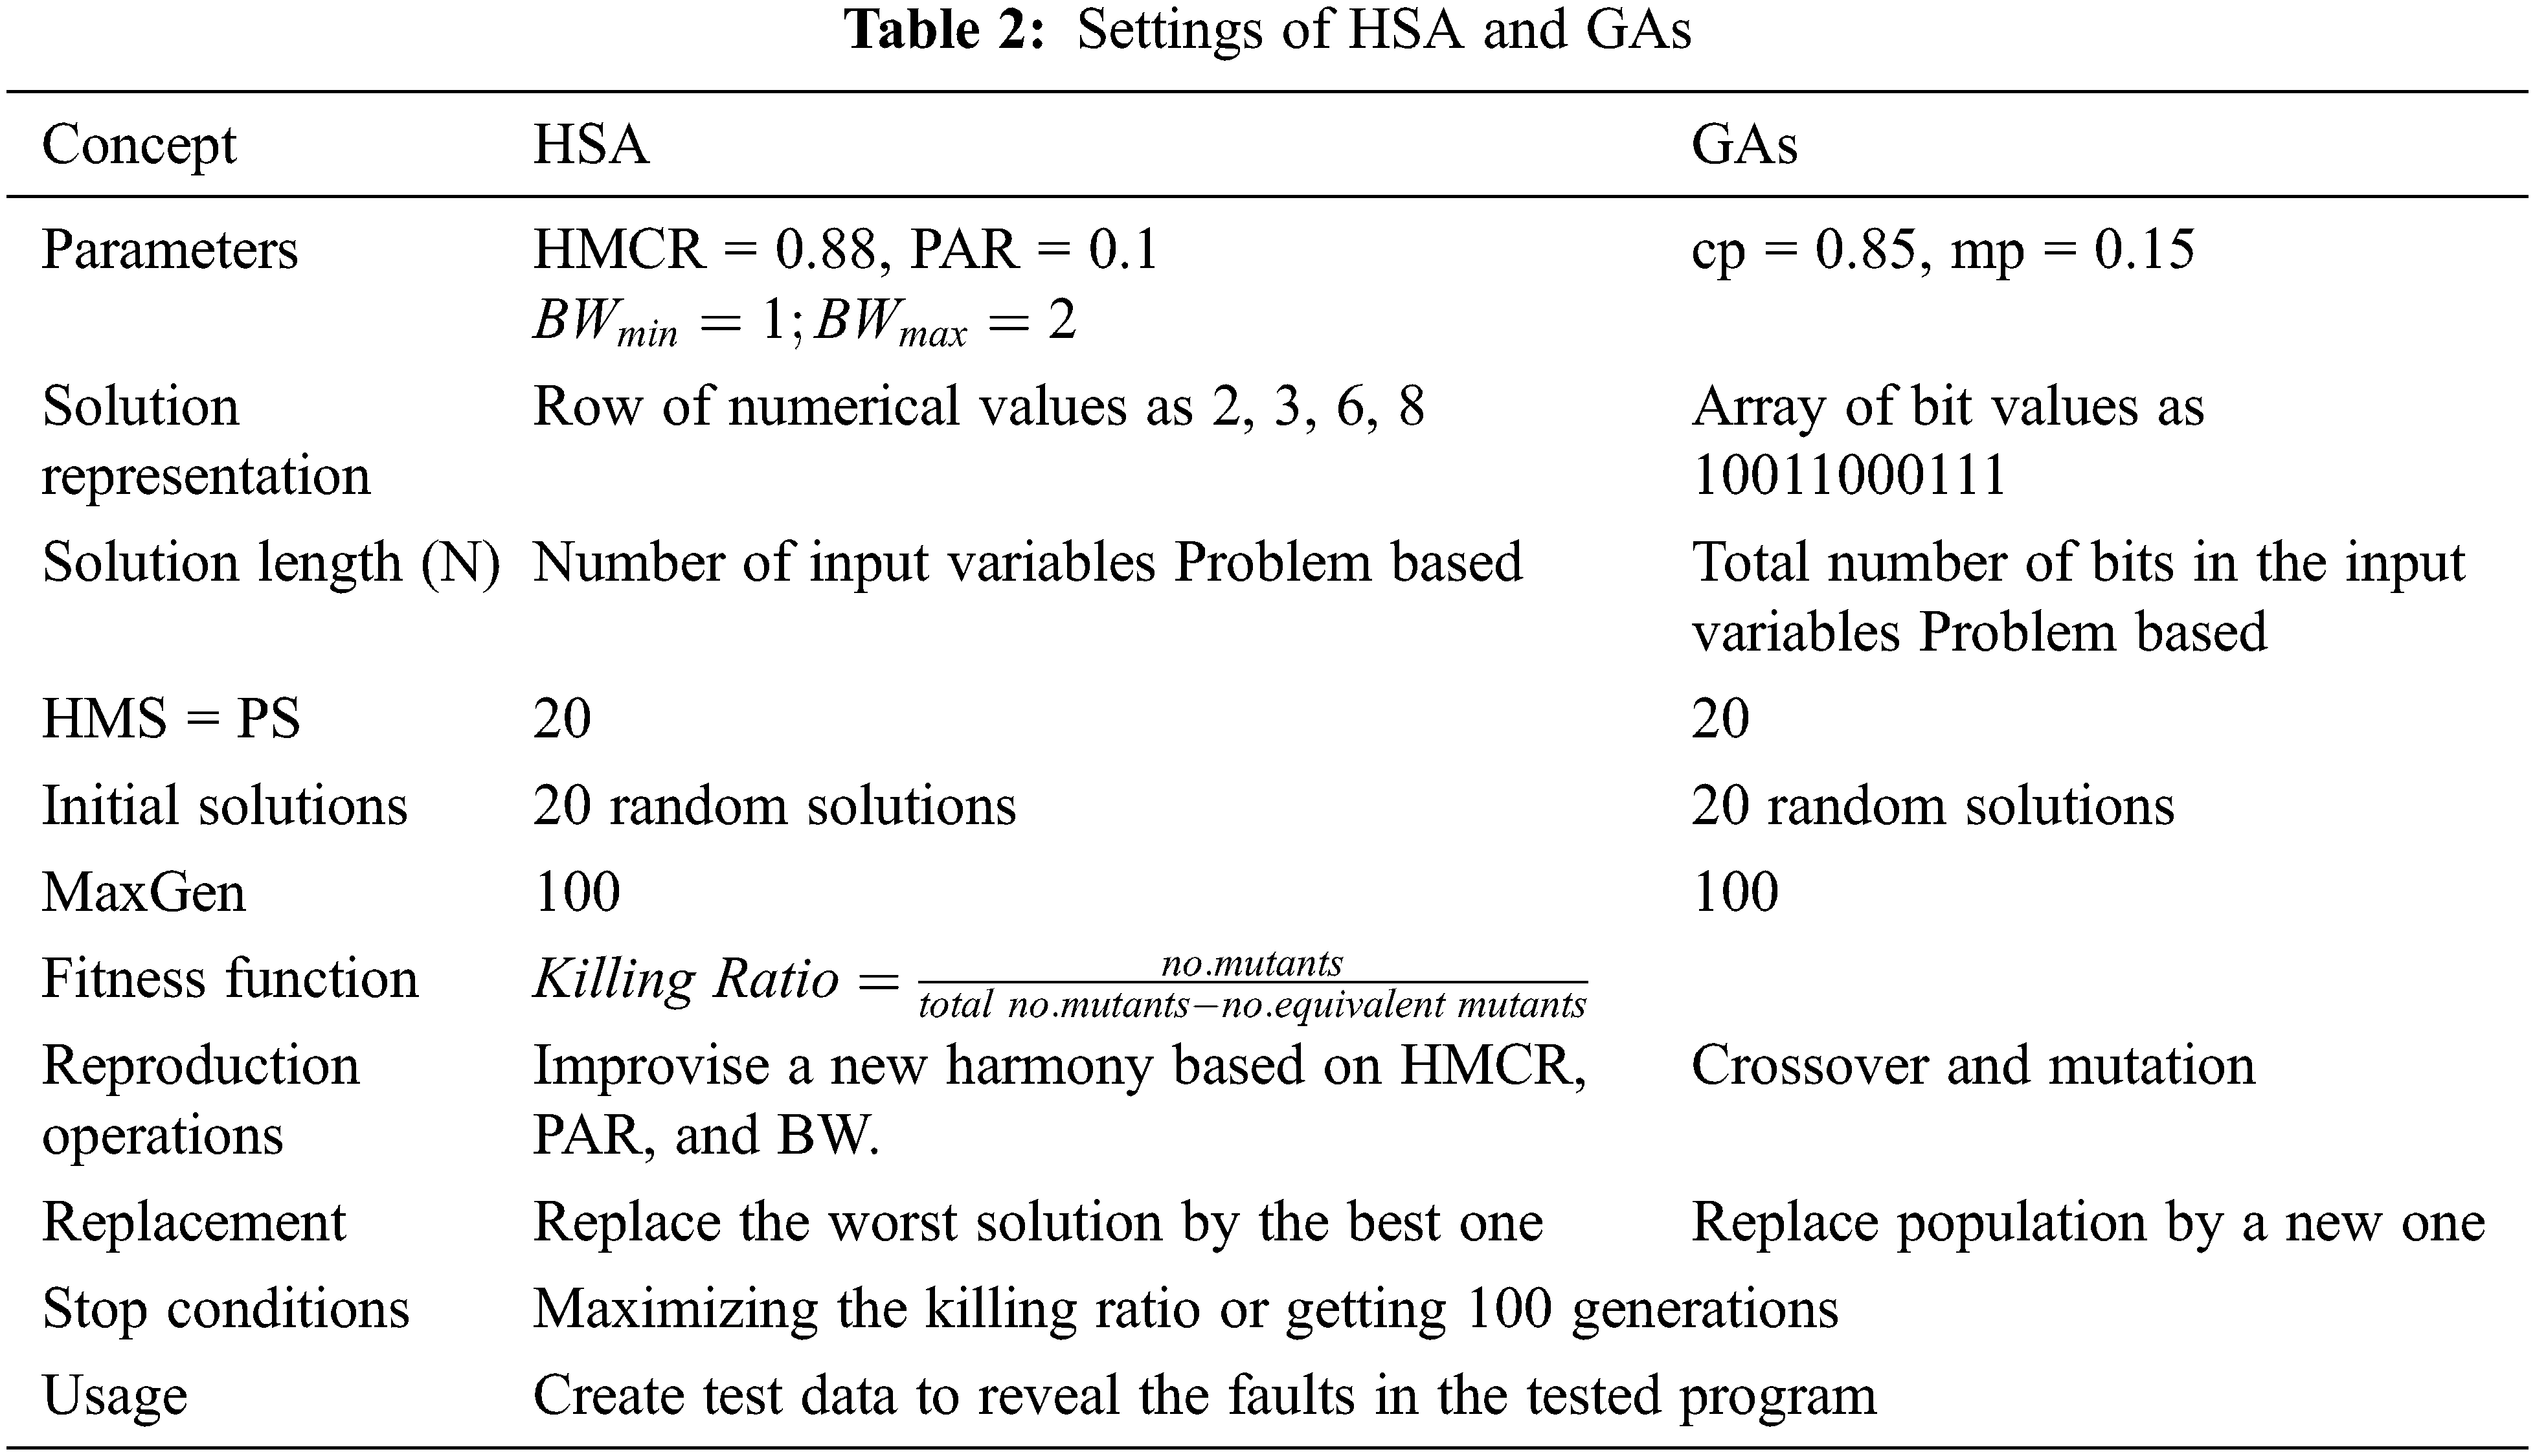
The parameters of the harmony search algorithm were adapted as follows: HMS = 20, MaxGen = 100, HMCR = 0.88, PAR = 0.1,
The harmony search algorithm randomly generates a two-dimensional matrix to be the initial set of solutions (e.g., HM = 20 × 3 matrix for the triangle classifier program) and genetic algorithms randomly generate a two-dimensional matrix to be the initial set of solutions (e.g., P = 20 × 12 matrix for the triangle classifier program). For fairness, the harmony search algorithm and genetic algorithms start with the same initial set of solutions (HM and P). HM and P can be matrices as the following.
To evaluate the fitness of each solution in HM and P, both the compared algorithms use the killing ratio as the fitness function. The compared algorithms used the following formula to evaluate the fitness of the solutions.
A mutant is considered “killed” if the result of executing the original code using one of the test inputs is unlike the result of this mutant. On the other hand, a mutant is considered “alive” if the result of the original code is similar to the result of this mutant. If the execution of the mutant gives the same result as the original code for all inputs in the given set of test inputs, this mutant is considered an “equivalent” one. These mutants can be constructed using the “MuJava” tool [33].
In reproduction operations, the harmony search algorithm uses the procedure and formulas given in the fourth step of Section 2.B. In contrast, the GAs use the crossover and mutation operations presented in the fourth and the fifth steps of Section 2.A. The processes of each algorithm will stop after getting 100 generations, or the killing ratio reaches at least 95%.
3.2.2 The Procedure of the Study
The study follows the following procedure (see Fig. 4).
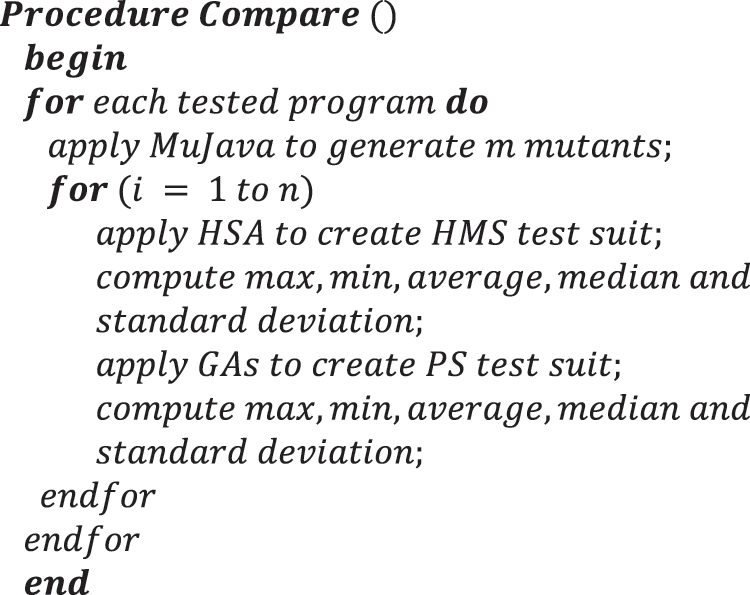
Figure 4: The procedure of the comparative study
• The MuJava-analysis tool is executed on each tested programs to construct m mutated versions of the program (m mutants).
• Both the harmony search algorithm and the genetic algorithm are executed on each tested program to generate a suite of test inputs consisting of k solutions (k = HMS = PS).
• During the execution of HSA and GAs, each tested program and its m mutated versions are executed using each of the k tests in the test suit generated by the HSA and the one generated by GAs. Subsequently, the killing ratio is computed to get the fitness of each solution in the test suit.
• The execution of the HSA and GAs is repeated n times; then, the maximum, minimum, average, median, and standard deviation are computed.
The tested programs are picked from refs [34,35]. The tested programs are nine Java programs with various structures. The tested programs are Mid (finds the middle of three values), Max (finds the maximum of three values), Rem (finds the remainder of the division of two values), Tri (finds the triangle’s type), Pow (finds the power of a value), Day (finds the number of days between two dates), Ecld (Euclide’s algorithm that finds the highest common divisor of two values), Prim (finds the prime numbers), and Root (calculates square root).
3.2.4 The Results of the Study
The comparative study investigates the efficiency of the harmony search algorithm and the genetic algorithms according to three criteria. These criteria are (1) the time performance, (2) the significance of the generated test data, and (3) the adequacy of the generated test data to satisfy a given ratio.
The genetic and harmony search algorithms were executed 270 times to estimate the time performance. The results showed that the harmony search algorithm consumed 400 s to execute its procedure 270 times, while the genetic algorithms consumed 500 s to perform its process the same number of times.
Fig. 5 shows the time curves of the harmony search algorithm and the genetic algorithms. The time curve of the harmony search algorithm is constantly below the time curve of the genetic algorithms. From the results, the harmony search algorithm finished the target number of iterations (e.g., 50, 100, 150, 200, 250, and 300) before the genetic algorithms. Therefore, the harmony search algorithm is continuously faster than the genetic algorithms.
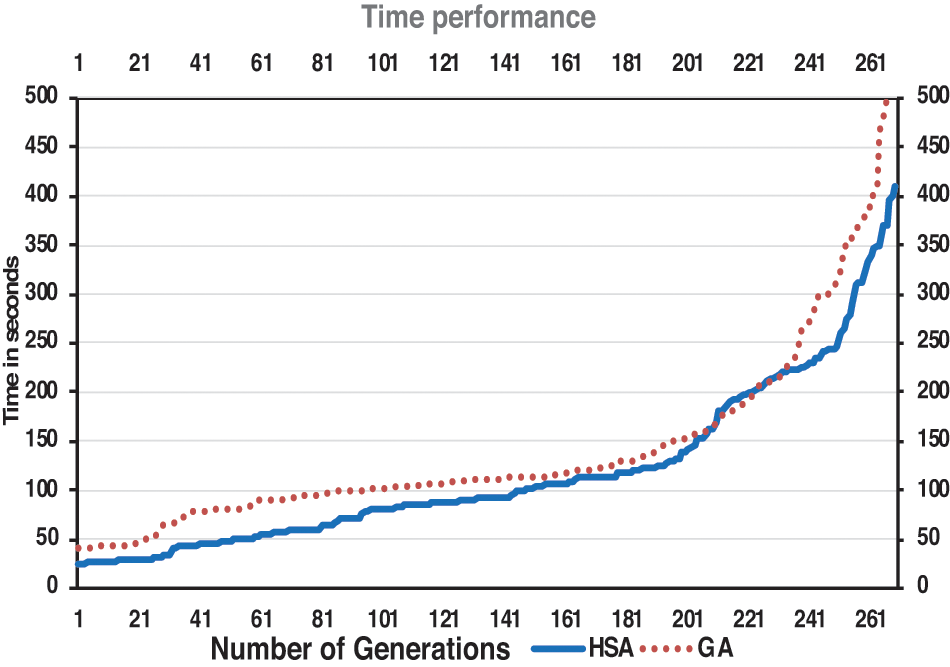
Figure 5: Time performance of HSA and GAs
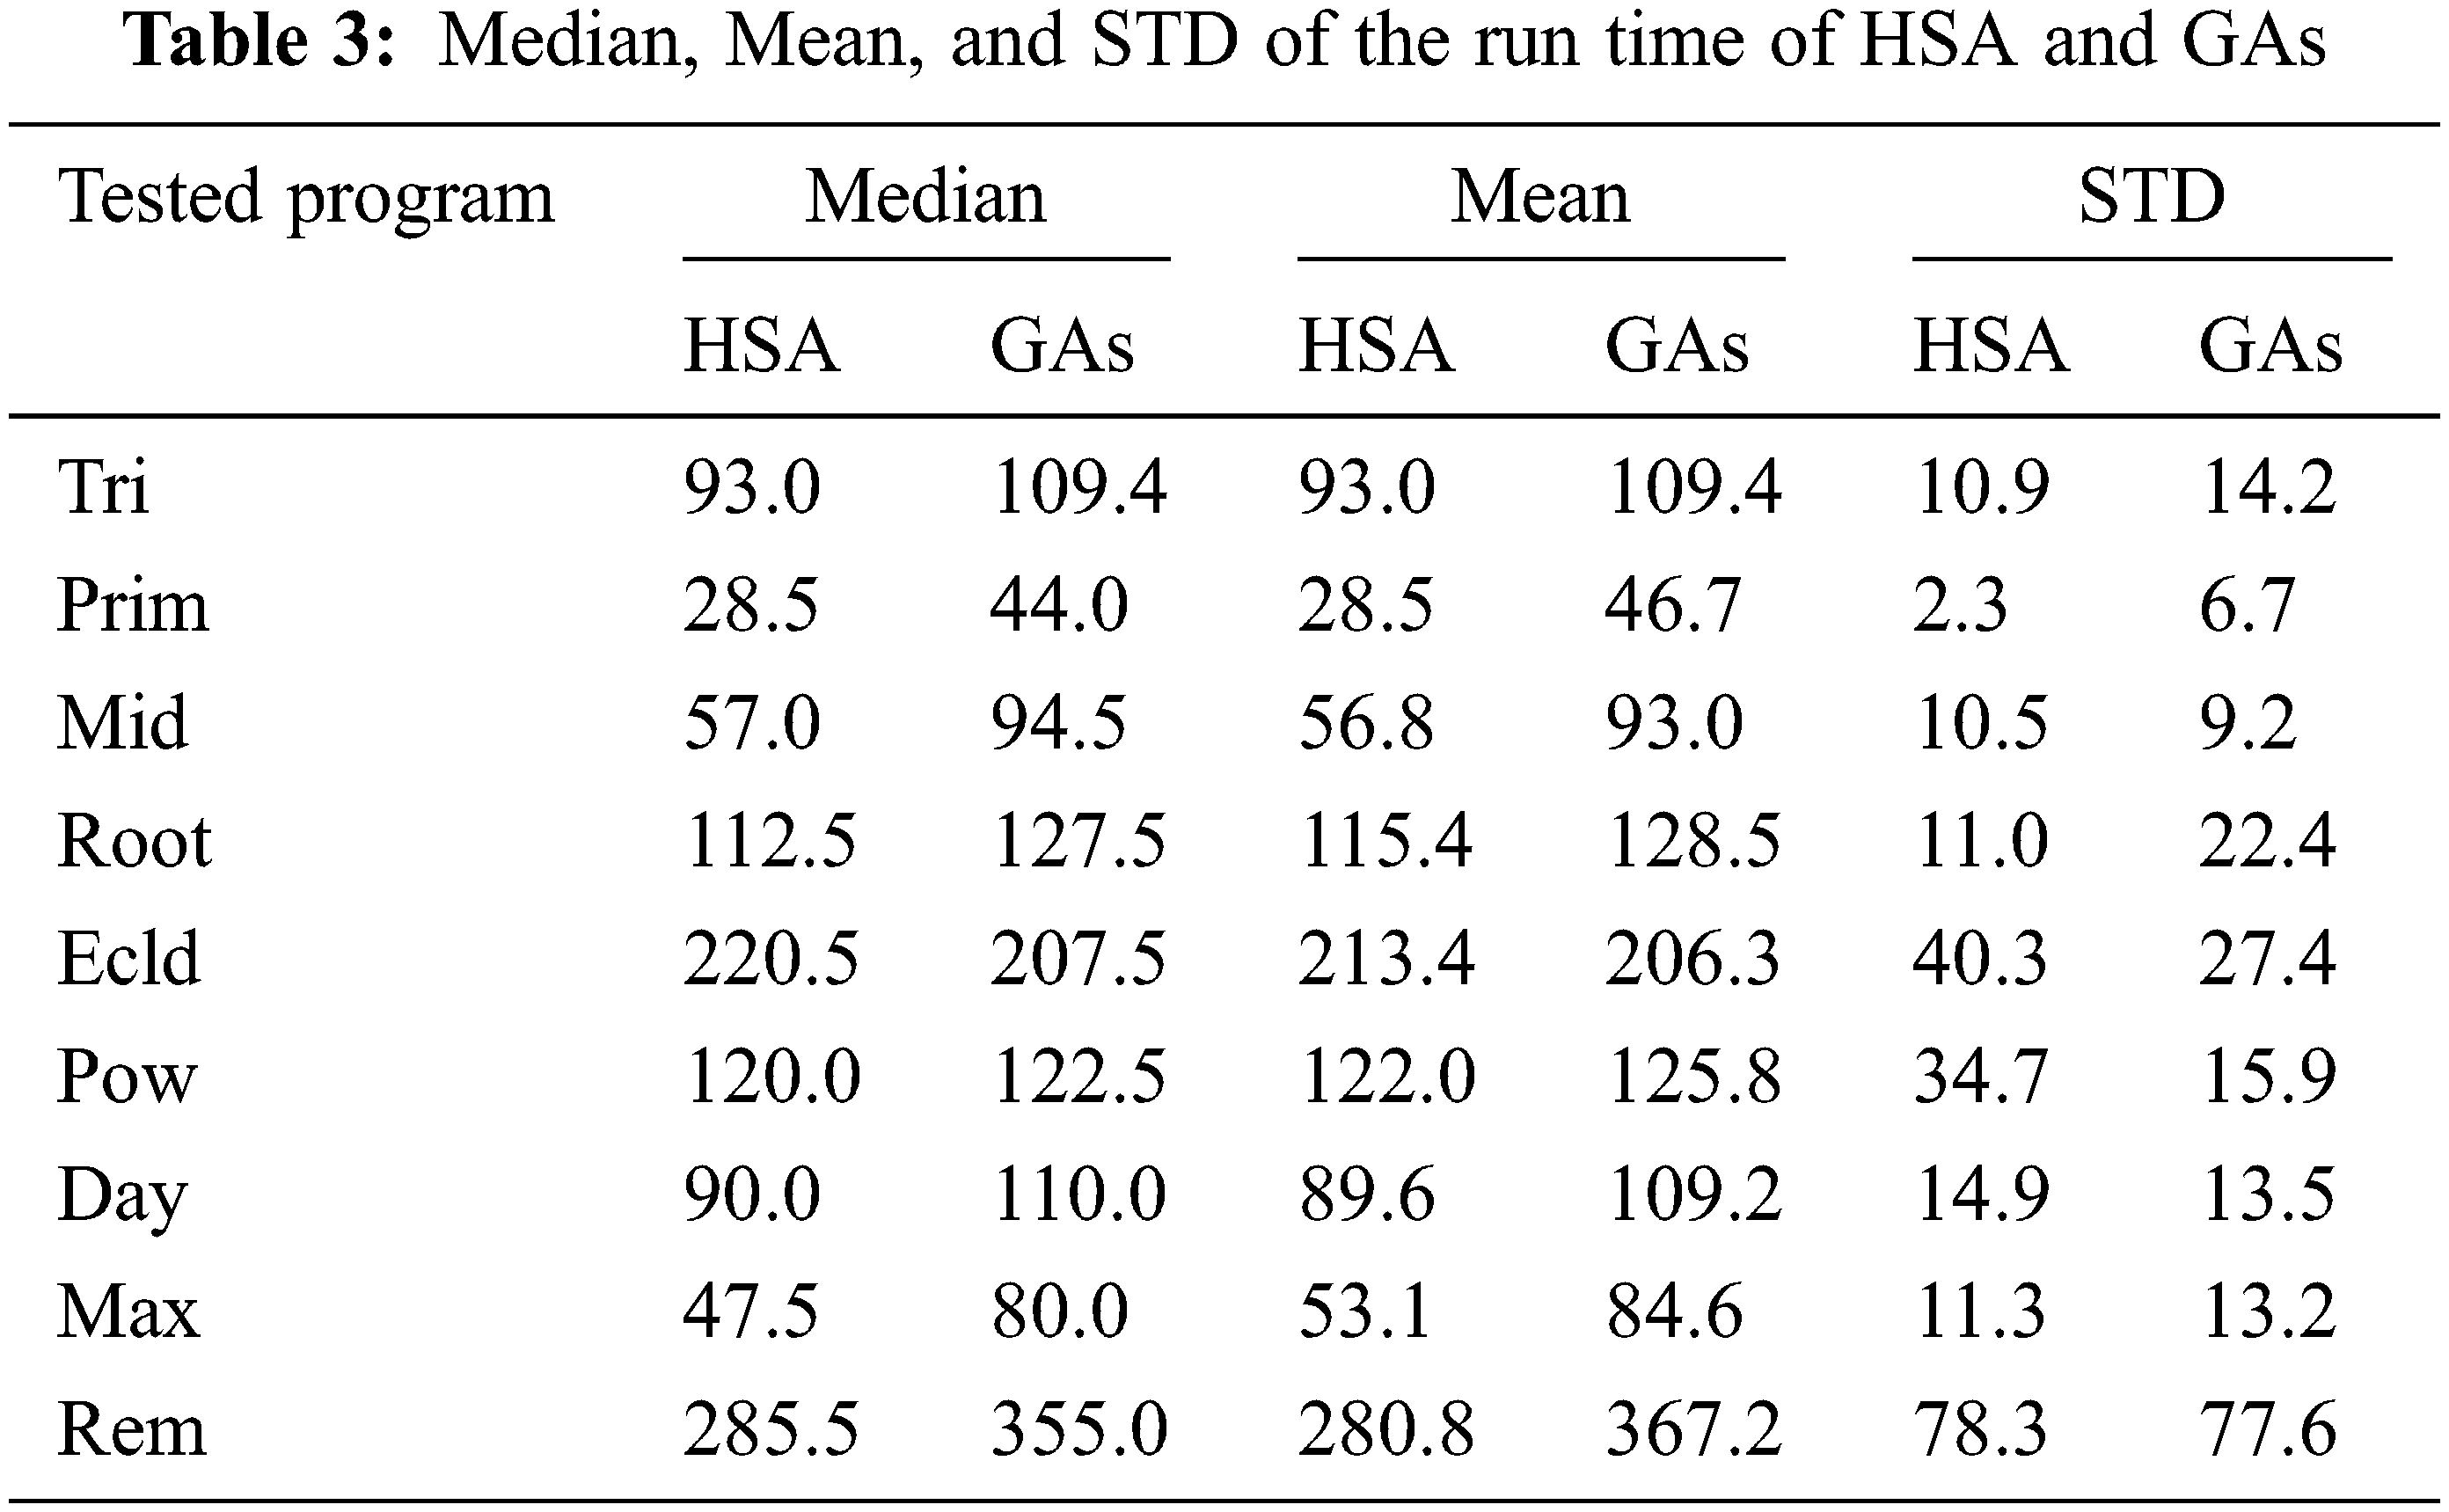
Figs. 6 and 7 show the scattering of the time values of the harmony search algorithm and the genetic algorithms, respectively. Tab. 4 shows the median, mean, and STD of the run time of the HSA and the GAs. In addition, most time values of the harmony search algorithm lie in the range from 40 to 60 s, while most time values of the genetic algorithms lie from 80 to 105 s. Therefore, the time values of the harmony search algorithm are more compact than the time values of the genetic algorithms.
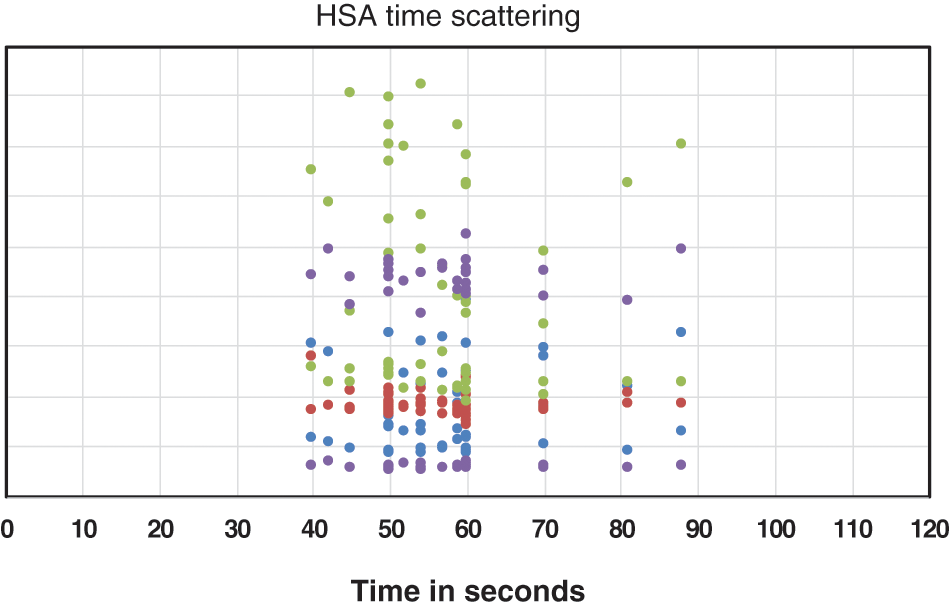
Figure 6: Scattering of the time values of HSA
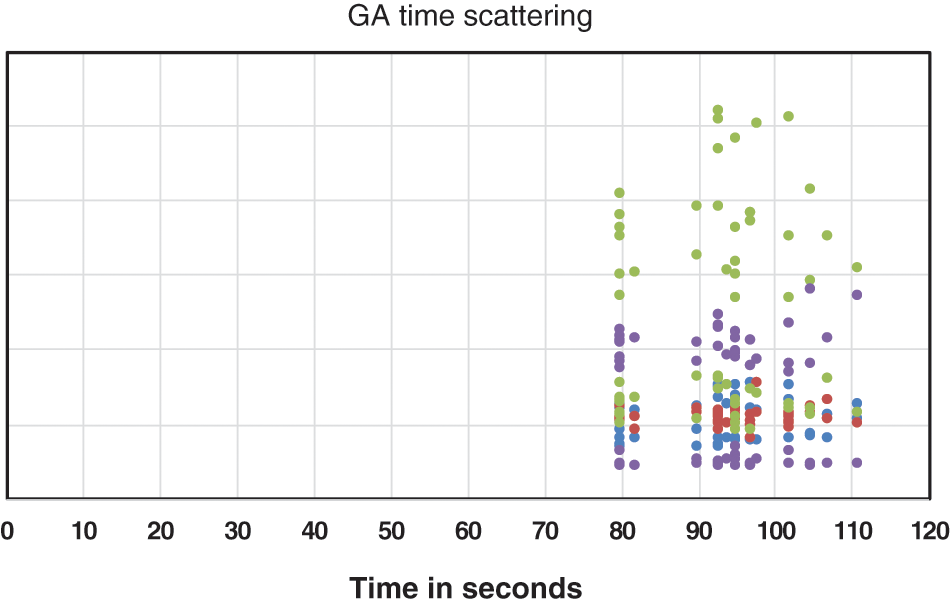
Figure 7: Scattering of the time values of GAs
The most frequent time value of the harmony search algorithm is 60 s (MODE(HSA) = 60 s), while the most frequent time value of the genetic algorithms is 80 s (MODE(GAs) = 80 s).
The Significance of the Generated Test Data
The harmony search algorithm and the genetic algorithms were executed 30 times on each tested program to estimate the significance of the generated test data; the median, mean, and standard deviation (STD) of the fitness values were computed.
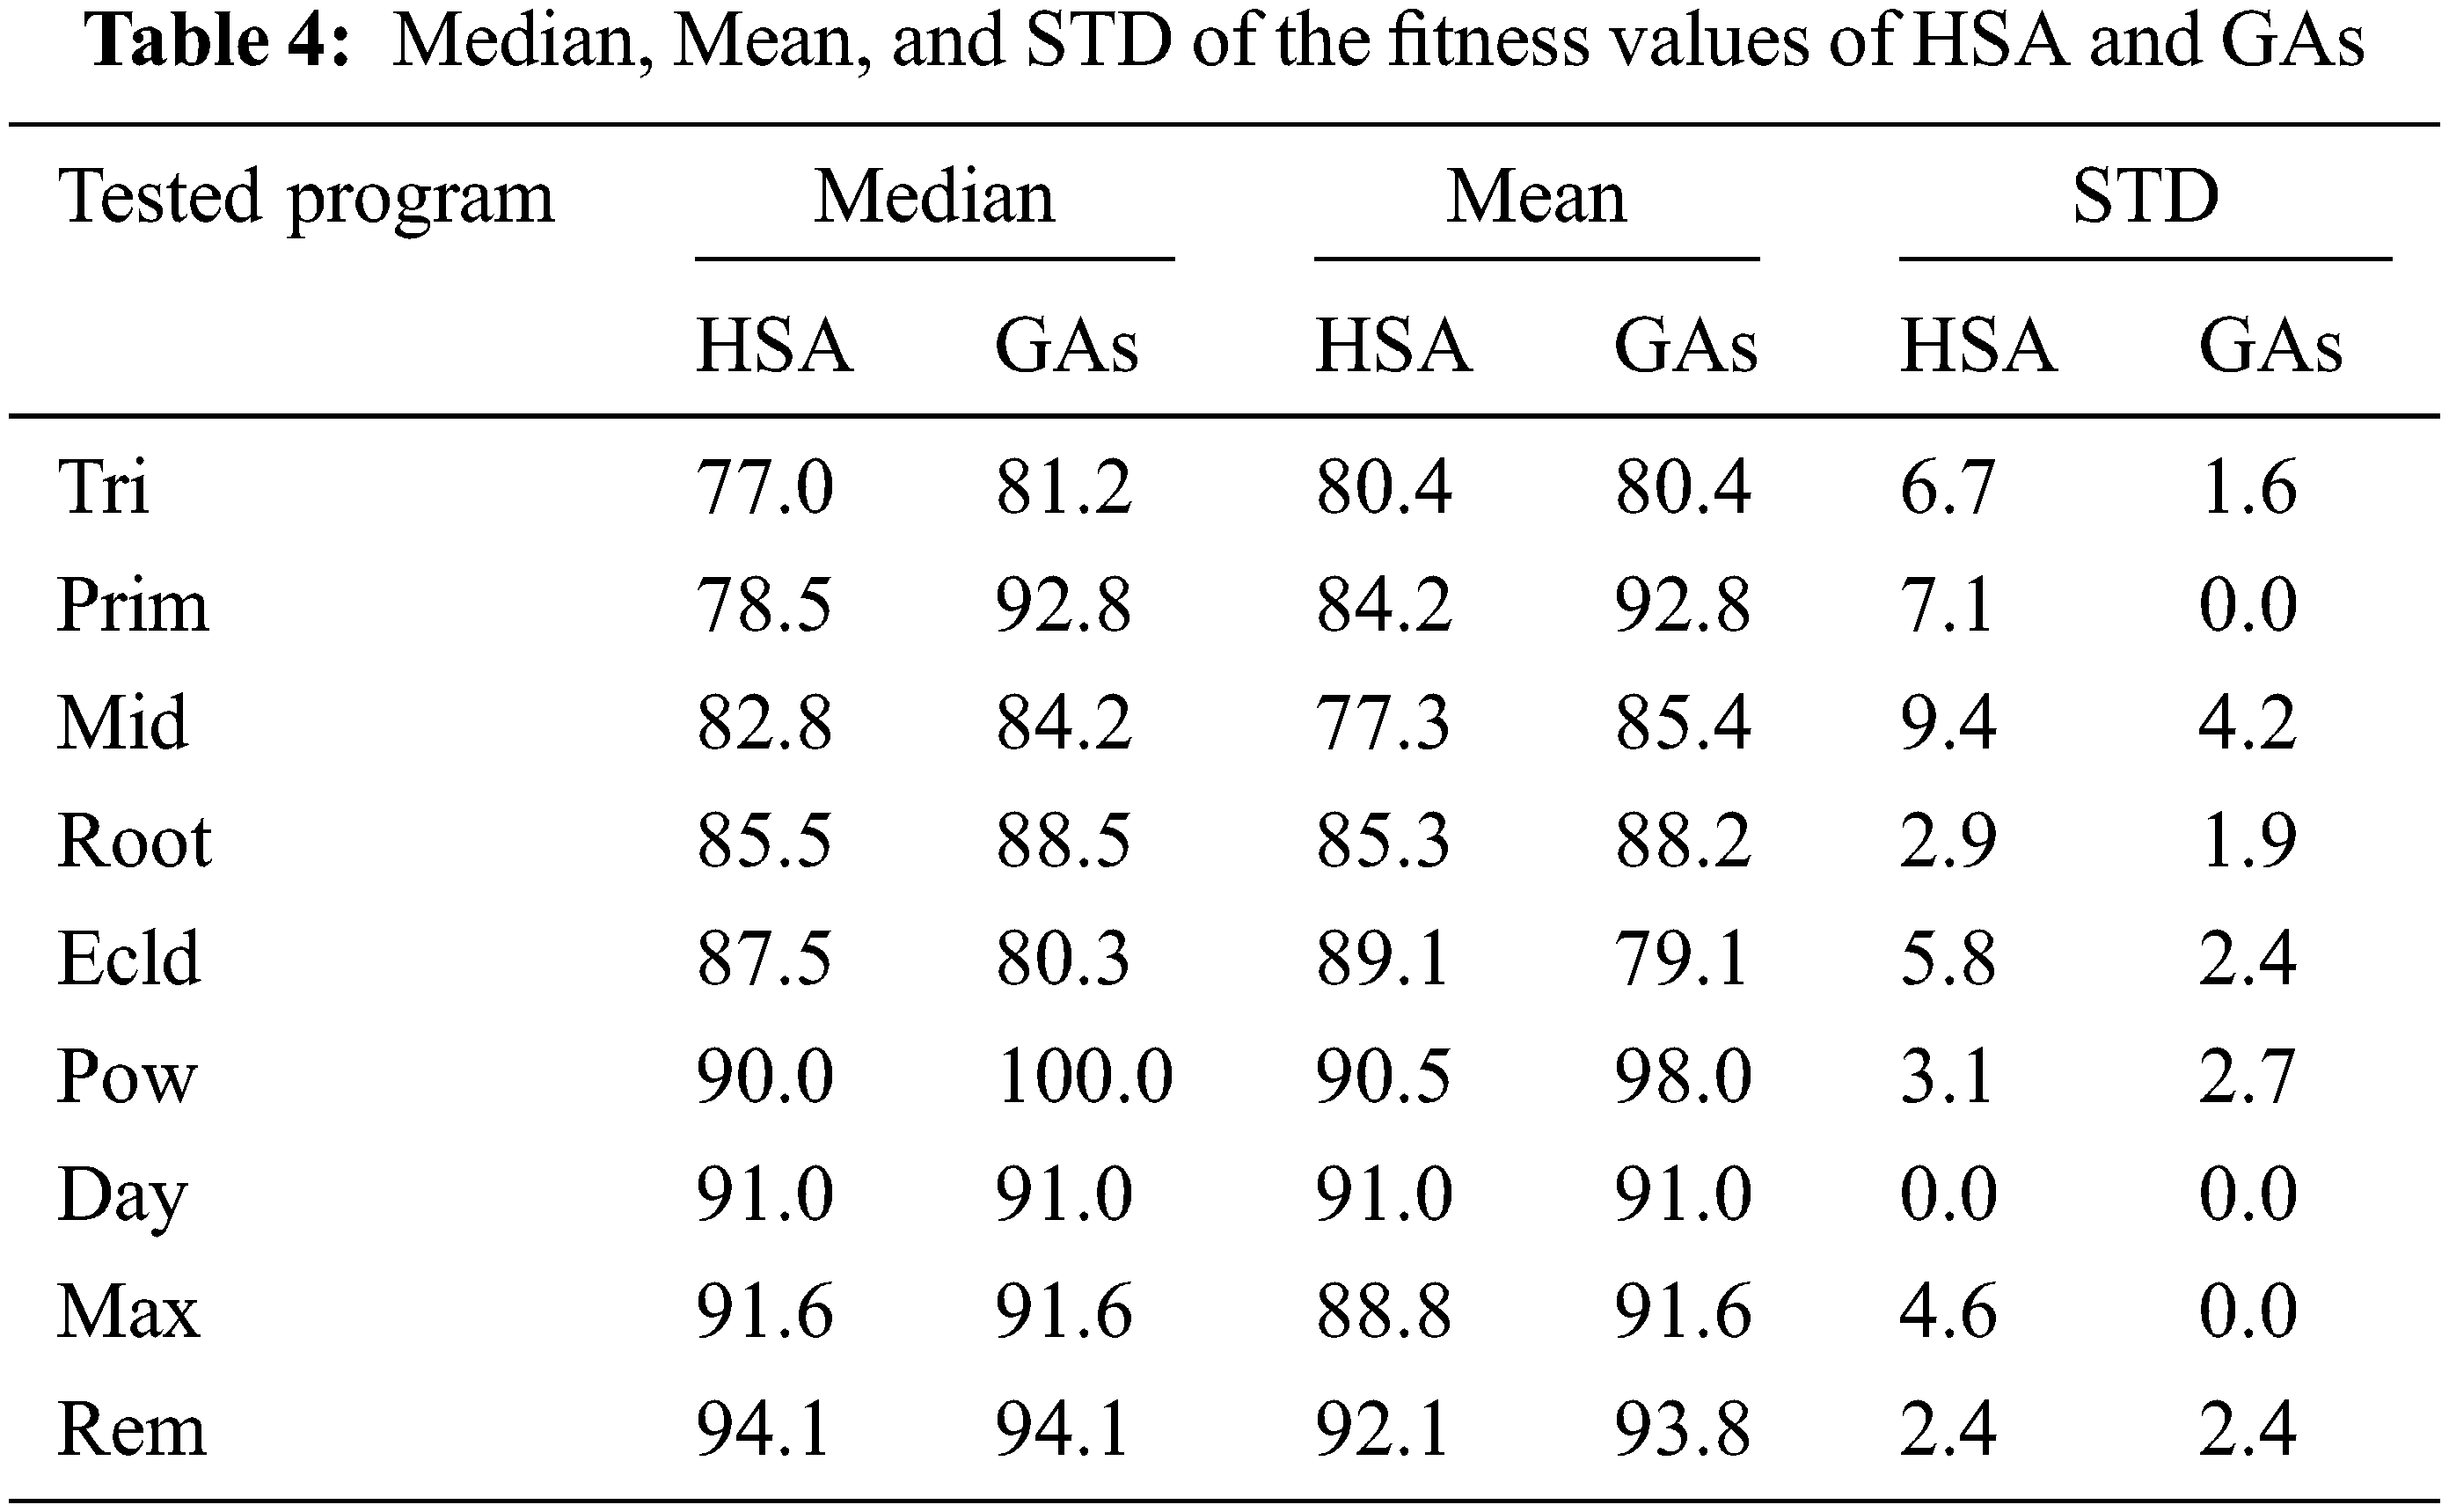
Tab. 4 gives the values of median, mean, and STD of the fitness values of the harmony search algorithm and the genetic algorithms. The results showed that the fitness values of the genetic algorithms are more significant than the values of the harmony search algorithm. According to the values of the fitness function, the values of the mean for GAs lie between 79 and 98, while the mean values for HSA lie between 77 and 92. Fig. 8 shows the progress of the fitness value with time passing for the harmony search algorithm and the genetic algorithms. The curve of the fitness function for the harmony search algorithm is constantly below the curve of the fitness function for the genetic algorithms. For the same number of generations, the values of the fitness function for the genetic algorithms are better than the corresponding values for the harmony search algorithm.
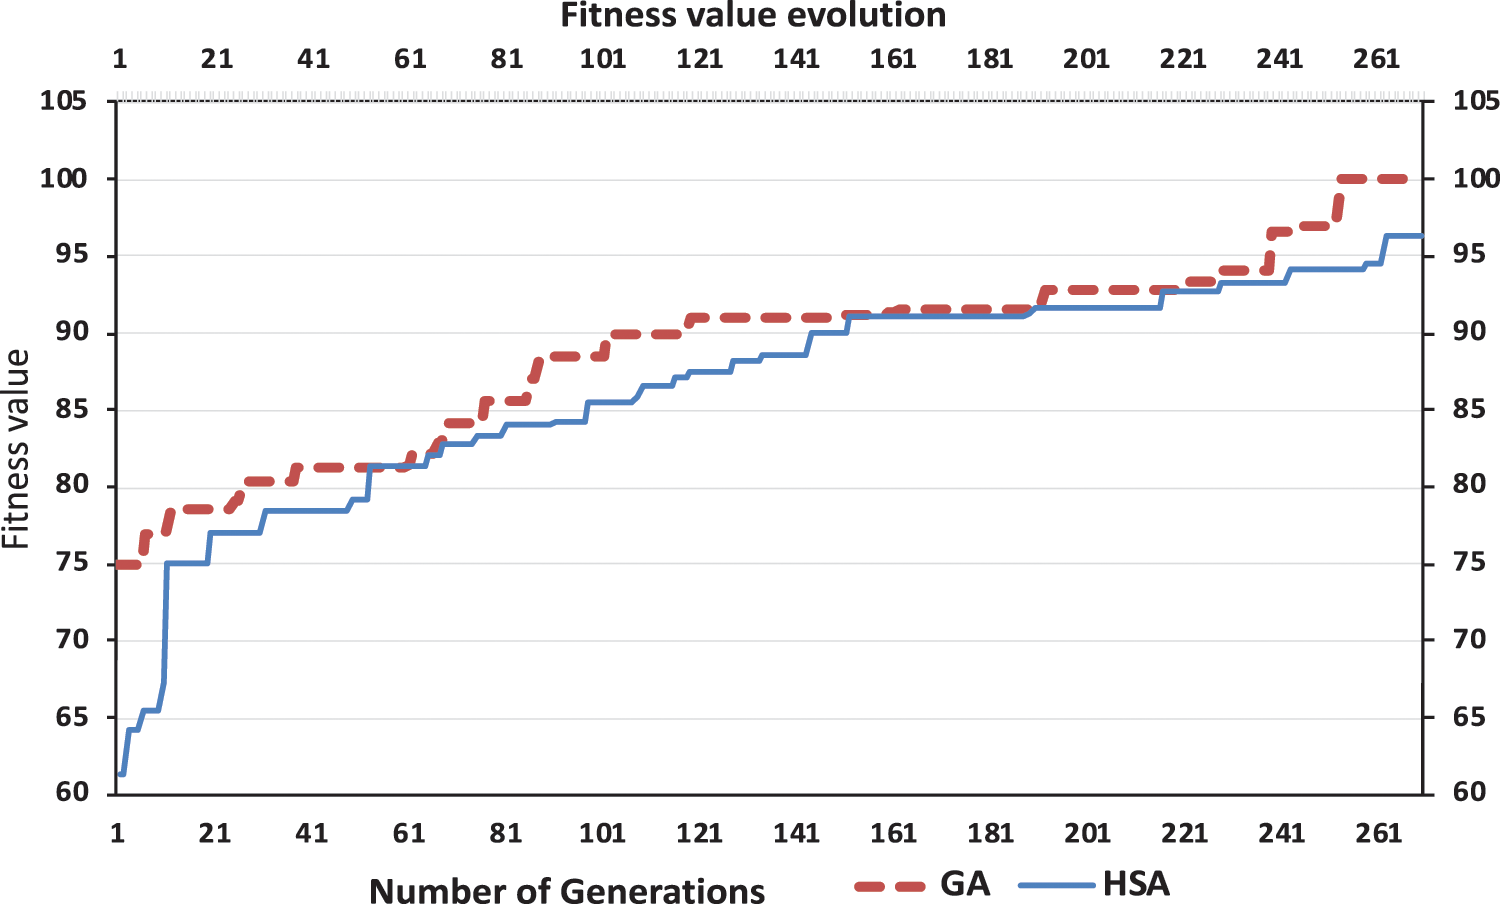
Figure 8: Fitness value evolution for HSA and GAs
Fig. 9 shows the scattering of the fitness values of the harmony search algorithm and the genetic algorithms. From Fig. 9 and Tab. 4, the standard deviation of the fitness function of GAs lies in the range of 0 to 4.2. In addition, the standard deviation of the harmony search algorithm lies in the range from 0 to 9.4. Therefore, the standard deviation of the fitness function of GAs is smaller than the standard deviation of the HSA. Besides, the values of the fitness function of the HSA lie in the range from 61 to 96 and are more scattered than the values of the fitness function of the GAs, which lie in the range from 75 to 100.
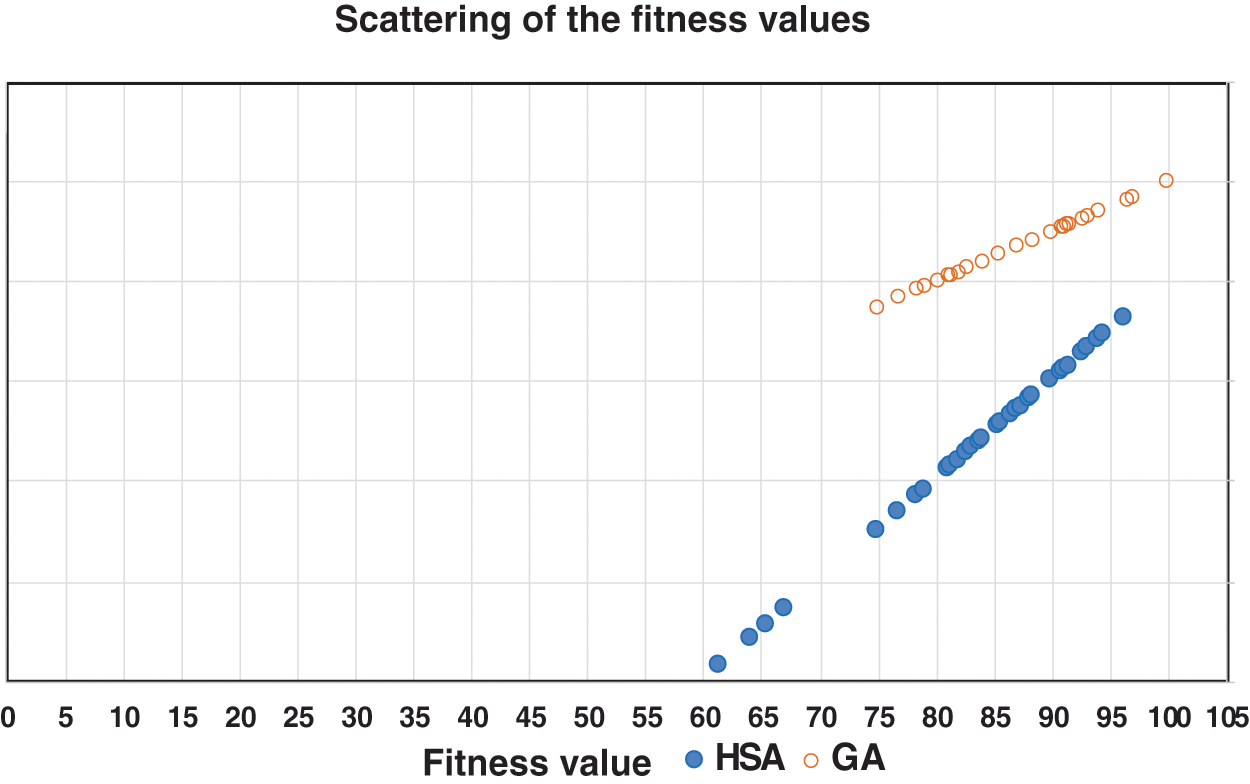
Figure 9: Scattering of the fitness values for HSA and GAs
The Adequacy of the Generated Test Data
The harmony search algorithm and the genetic algorithms are applied to all tested programs to maximize the fitness function (to be more than 90%) to estimate the adequacy of the generated data.
Fig. 10 shows the ratio of the adequacy of the generated test data. From Fig. 10, it is clear that both the harmony search algorithm and the genetic algorithms have the same ability to adequately create the test data to satisfy a specific fitness value. According to Fig. 10, both the harmony search algorithm and the genetic algorithms met the targeted fitness value (+90%) with the same efficiency of 89%.
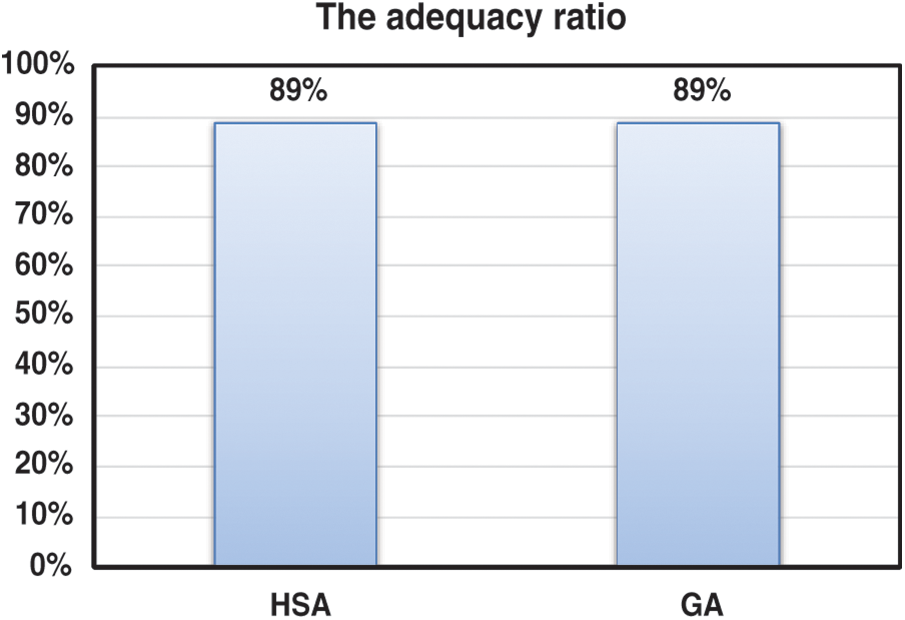
Figure 10: The adequacy ratio of the generated test data
3.2.5 Results Summary of the Empirical Comparison
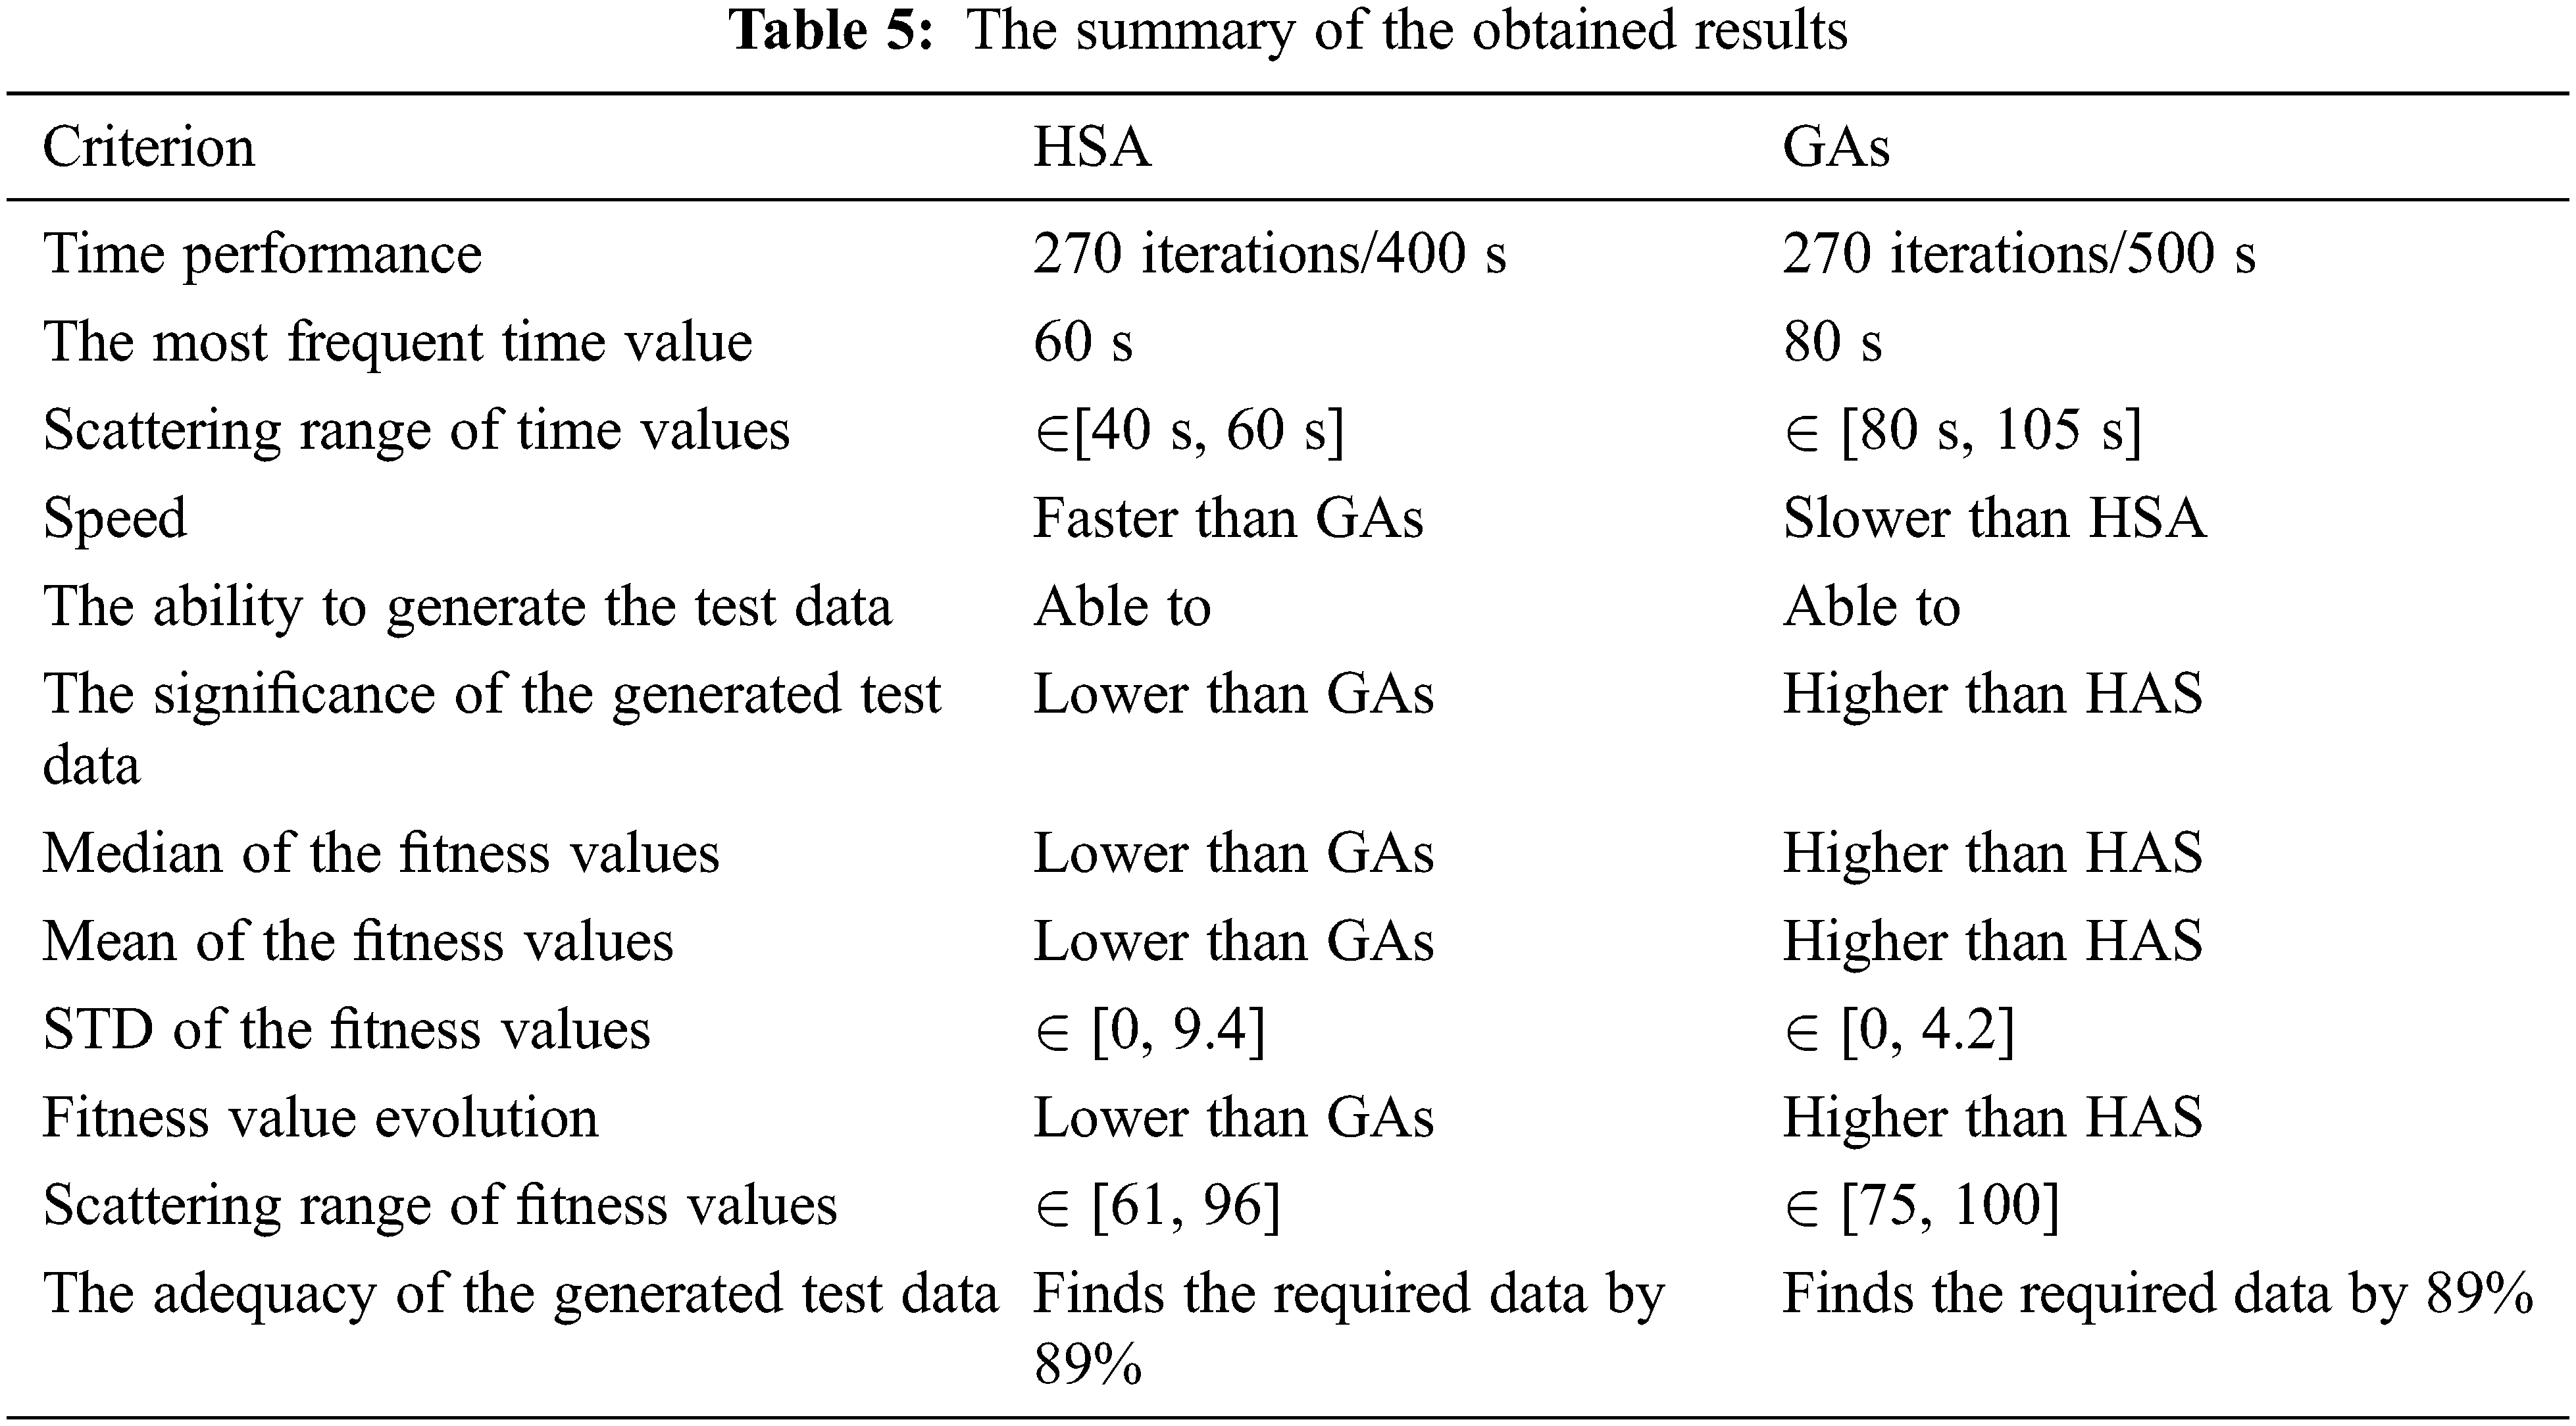
In this study, the harmony search and the genetic algorithms were empirically compared according to three criteria. These criteria are (1) the time performance, (2) the significance of the generated test data, and (3) the adequacy of the generated test data to reach a given fitness value. The obtained results were summarized in Tab. 5.
The results in Tab. 5 showed many similarities and differences between the harmony search algorithm and genetic algorithms. The harmony search and genetic algorithms can generate the required test data. Besides, both the harmony search and the genetic algorithms have the same efficiency in generating adequate test data to satisfy a specific testing criterion. In contrast, the harmony search algorithm is faster than the genetic algorithms in developing the test data for a specific testing criterion.
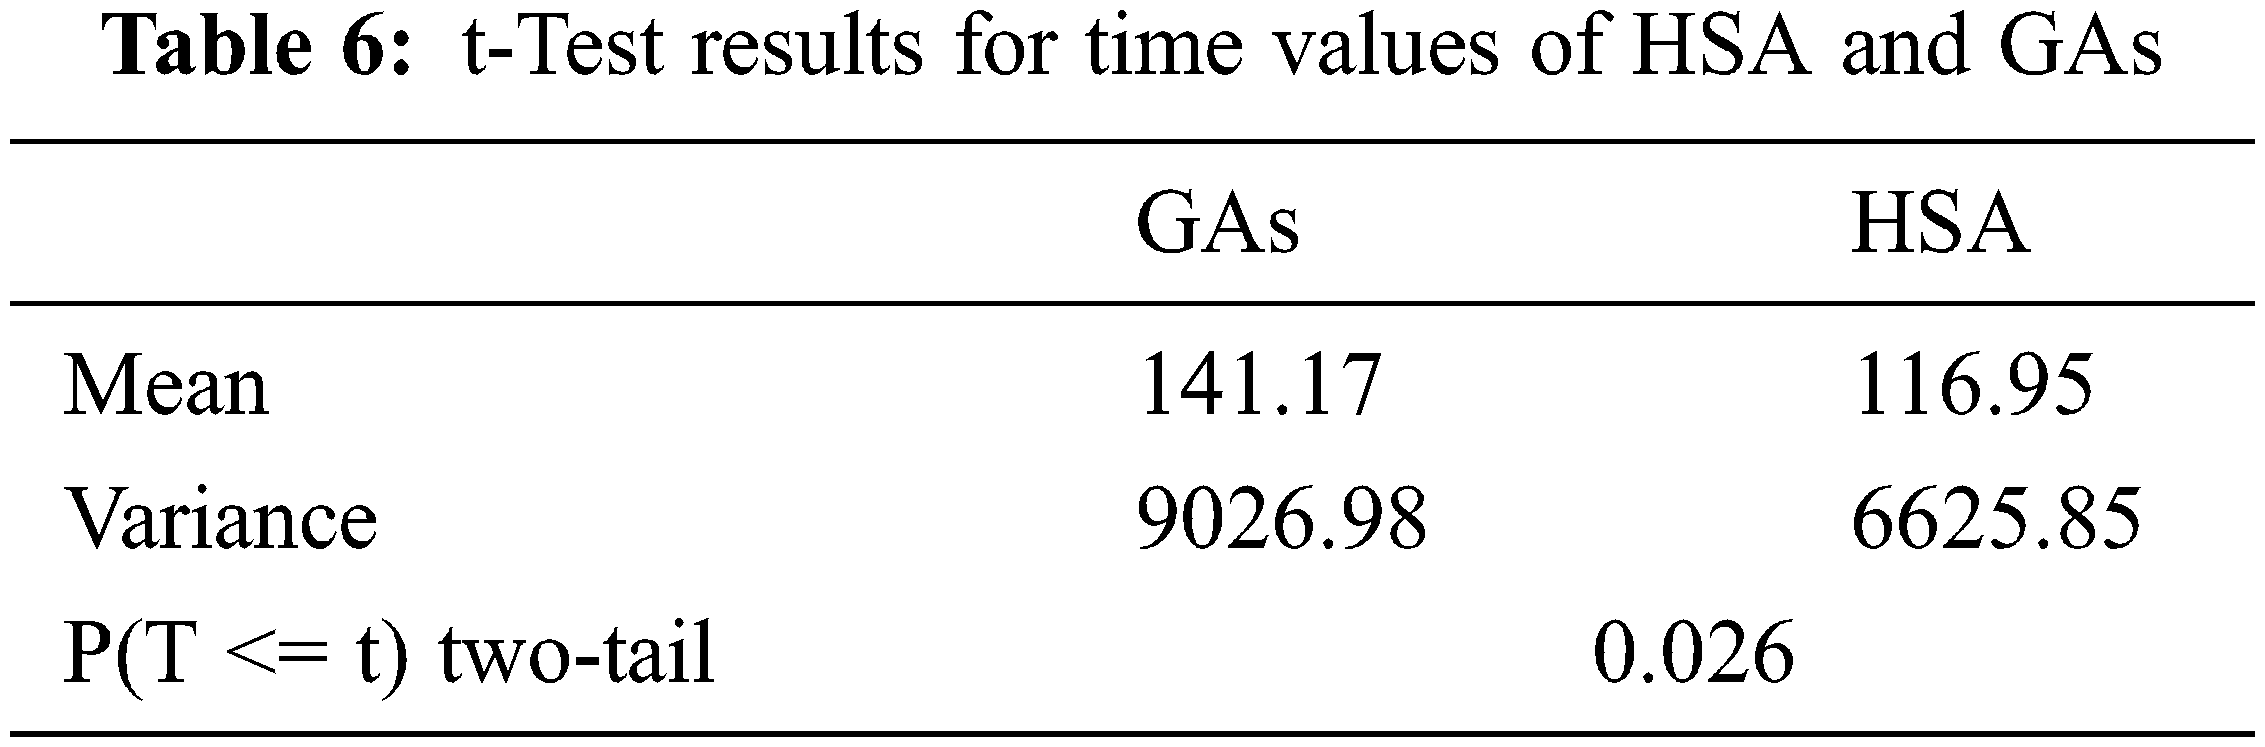
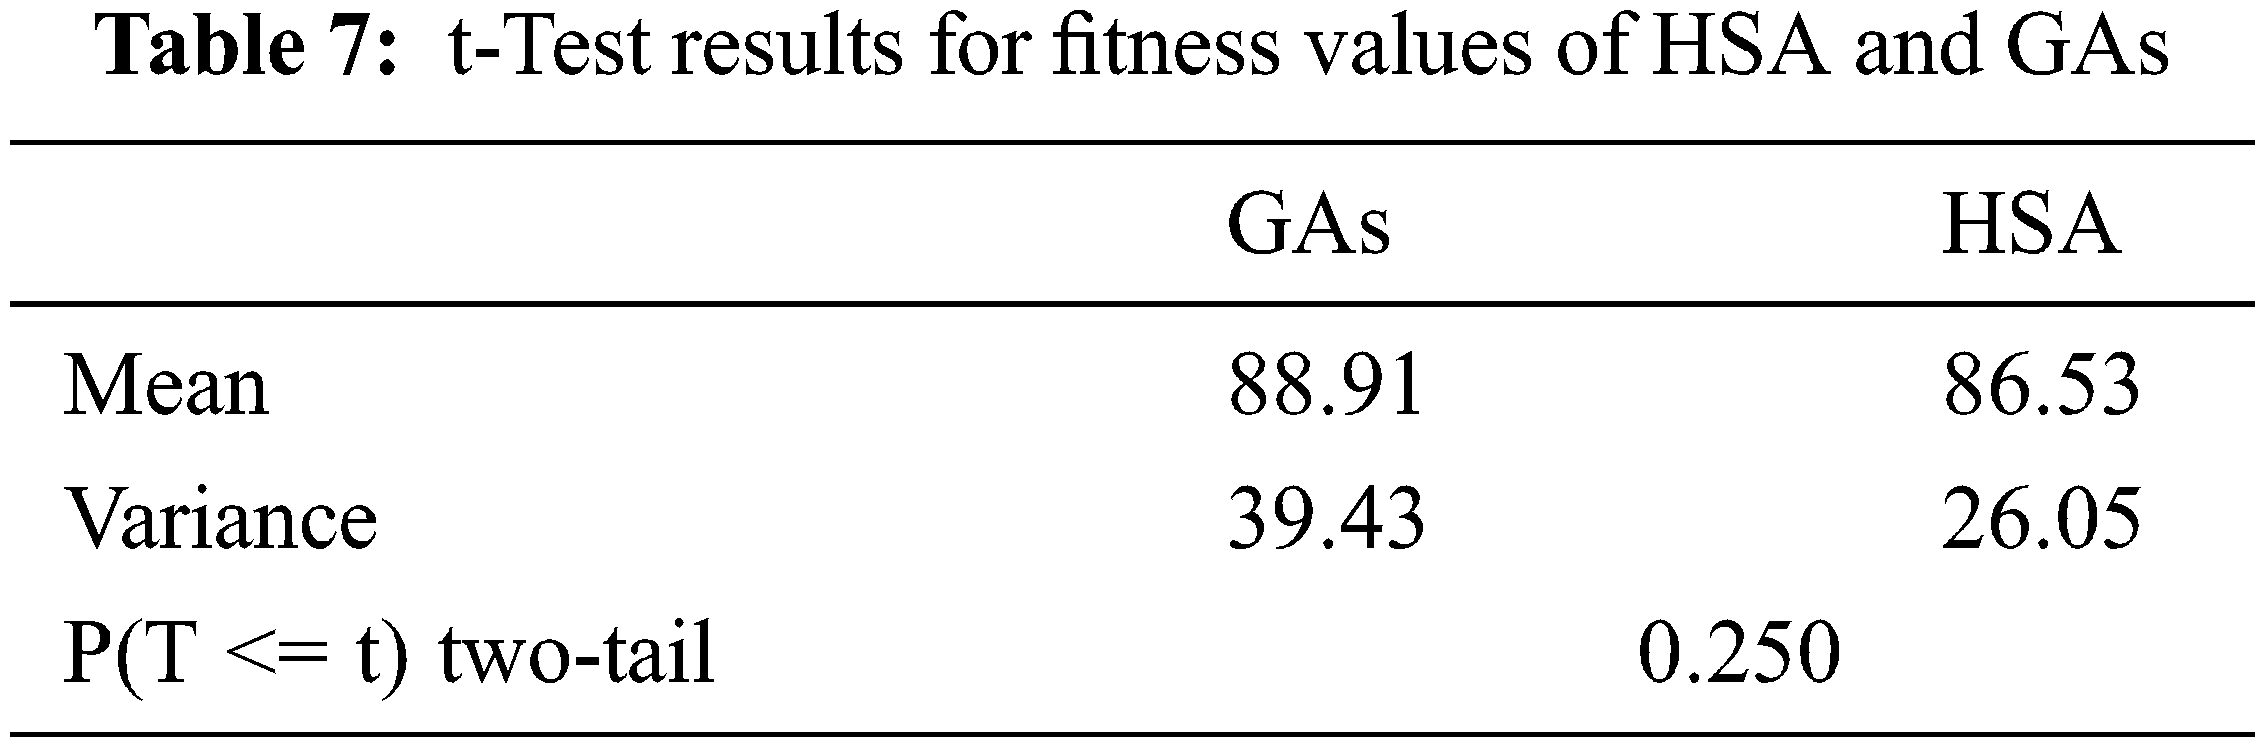
To accurately estimate the time performance and the efficiency of the harmony search algorithm and the genetic algorithms, the statistical t-Test has been applied to the means values of the time and fitness functions given in Tabs. 3 and 4.
Tab. 6 gives the results of applying the t-Test to the data of time values given in Tab. 3. From Tab. 6, the p-value is 0.026, and the alpha level (
Tab. 7 gives the results of applying the t-Test to the data of fitness values given in Tab. 4. From Tab. 7, the p-value is 0.25, and the alpha level (
The genetic and harmony search algorithms have been successfully applied in several software testing aspects, such as test data generation. Although the test data generation process represents an essential task in software validation, there is no work comparing the efficiency of genetic algorithms and harmony search algorithms in the test data generation process. This paper studied the similarities and differences between genetic algorithms and the harmony search algorithm based on the efficiency and speed in finding the necessary test data. This study compared the HSA and GAs by two methods: (1) The empirical method based on conducting an empirical comparison between HSA and GAs in the test data generation process; (2) The statistical method based on the results of the empirical study to investigate the significance of the similarities and the differences between HSA and GAs. The two methods investigated the efficiency of the harmony search algorithm and the genetic algorithms based on the time performance, the significance of the generated test data, and the adequacy of the generated test data to satisfy the mutation testing criterion. The comparison results showed that the harmony search algorithm is significantly faster than the genetic algorithms. The t-Test showed that the p-value of the time values is 0.026 < α = 0.05. In contrast, there is no significant difference between the efficiency of the harmony search algorithm and the genetic algorithms in generating adequate test data. The t-Test showed that the p-value of the fitness values is 0.25 > α = 0.05.
Acknowledgement: Authors deeply acknowledge Taif University for supporting this study through Taif University Researchers Supporting Project number (TURSP-2020/231), Taif University, Taif, Saudi Arabia.
Funding Statement: Researchers Supporting Project number (TURSP-2020/231), Taif University, Taif, Saudi Arabia.
Conflicts of Interest: The authors declare that there are no conflicts of interest to report regarding the present study.
References
1. Z. Michalewicz, “Genetic algorithms,” in Genetic Algorithms + Data Structures = Evolution Programs, Third ed., vol, 1. Germany Berlin, Heidelberg: Springer, pp. 11–86, 1998. [Google Scholar]
2. D. E. Goldberg, “Some applications of genetic algorithms,” in Genetic Algorithms in Search, Optimization and Machine Learning, 1st ed., vol. 1, Boston, MA, USA: Addison-Wesley Longman Publishing Co., Inc, 1989. [Google Scholar]
3. Z. W. Geem, J. H. Kim and G. V. Loganathan, “A new heuristic optimization algorithm: Harmony search,” Simulation, vol. 76, no. 2, pp. 60–68, 2001. [Google Scholar]
4. A. Askarzadeh and E. Rashedi, “Harmony search algorithm: Basic concepts and engineering applications,” in Intelligent Nature-Inspired Computing, 1st ed., Hershey, Pennsylvania, USA: IGI-Global, vol. 1, pp. 1–36, 2017. [Google Scholar]
5. S. Katoch, S. S. Chauhan and V. Kumar, “A review on genetic algorithm: Past, present, and future,” Multimedia Tools and Applications, vol. 80, no. 5, pp. 8091–8126, 2021. [Google Scholar]
6. C. Peraza, F. Valdez and O. Castillo, “A harmony search algorithm comparison with genetic algorithms,” in Fuzzy Logic Augmentation of Nature-Inspired Optimization Metaheuristics. Studies in Computational Intelligence, 1st ed., vol. 574, Gewerbesrasse, Cham, Switzerland: Springer, Cham, pp. 105–123, 2015. [Google Scholar]
7. Y. Kim, Y. Yoon and Z. W. Geem, “A comparison study of harmony search and genetic algorithm for the max-cut problem,” Swarm and Evolutionary Computation, vol. 44, no. 3, pp. 130–135, 2019. [Google Scholar]
8. M. Ghozi and A. Budiati, “Comparison of genetic algorithm and harmony search method for 2D geometry optimization,” MATEC Web of Conferences, vol. 159, pp. 1–6, 2018. [Google Scholar]
9. O. Zongo and A. Oonsivilai, “Comparison between harmony search algorithm, genetic algorithm and particle swarm optimization in economic power dispatch,” International Review of Electrical Engineering, vol. 10, no. 2, pp. 286–292, 2015. [Google Scholar]
10. L. Khan, S. Mumtaz and A. Khattak, “Comparison of genetic algorithm and harmony search for generator maintenance scheduling,” Mehran University Research Journal of Engineering & Technology, vol. 31, no. 4, pp. 587–598, 2012. [Google Scholar]
11. A. S. Ghiduk, M. J. Harrold and M. R. Girgis, “Using genetic algorithms to aid test-data generation for data flow coverage,” in Proc. of 14th Asia-Pacific Software Engineering Conf. (APSEC 2007), Nagoya, Japan, pp. 41–48, 2007. [Google Scholar]
12. A. S. Ghiduk, “Automatic generation of basis test paths using variable length genetic algorithm,” International Journal of Information Processing Letters, vol. 114, no. 6, pp. 304–316, 2014. [Google Scholar]
13. C. V. Briciu, I. Filip and I. I. Indries, “Methods for cost estimation in software project management,” in Proc. of IOP Conf. Series: Materials Science and Engineering, Wuhan, China, pp. 1–10, 2016. [Google Scholar]
14. P. F. Ordoñez-Ordoñez, M. Quizhpe, O. M. Cumbicus-Pineda, V. Herrera Salazar and R. Figueroa-Diaz, “Application of genetic algorithms in software engineering: A systematic literature review,” in Communications in Computer and Information Science, 1st ed., vol. 895, Gewerbesrasse, Cham, Switzerland: Springer, Cham, pp. 659–670, 2019. [Google Scholar]
15. M. Dubey, V. Kumar, M. Kaur and T. Dao, “A systematic review on harmony search algorithm: Theory, literature, and applications,” Mathematical Problems in Engineering, vol. 2021, no. 2, pp. 1–22, 2021. [Google Scholar]
16. X. Z. Gao, V. Govindasamy, H. Xu, X. Wang and K. Zenger, “Harmony search method: Theory and applications,” Computational Intelligence and Neuroscience, vol. 2015, no. 2, pp. 1–10, 2015. [Google Scholar]
17. C. Mao, “Harmony search-based test data generation for branch coverage in software structural testing,” Neural Computing and Applications, vol. 25, no. 1, pp. 199–216, 2015. [Google Scholar]
18. S. M. Sabbagh Jafari and F. Ziaaddini, “Optimization of software cost estimation using harmony search algorithm,” in Proc. of 2016 1st Conf. on Swarm Intelligence and Evolutionary Computation (CSIEC), Bam, Iran, pp. 131–135, 2016. [Google Scholar]
19. A. Prajapati and J. K. Chhabra, “Harmony search based remodularization for object-oriented software systems,” Computer Languages, Systems & Structures, vol. 47, pp. 153–169, 2017. [Google Scholar]
20. J. Kang, S. Kwon, D. Ryu and J. Baik, “HASPO: Harmony search-based parameter optimization for just-in-time software defect prediction in maritime software,” Applied Sciences, vol. 11, no. 5, pp. 2002, 2021. [Google Scholar]
21. A. Prajapati and Z. W. Geem, “Harmony search-based approach for multi-objective software architecture reconstruction,” Mathematics, vol. 8, no. 11, pp. 1906, 2020. [Google Scholar]
22. A. S. Ghiduk, “Using evolutionary algorithms for higher-order mutation testing,” International Journal of Computer Science Issues, vol. 11, no. 2, pp. 93–104, 2014. [Google Scholar]
23. B. Beizer, “Flow graphs and path testing,” in Software Testing Techniques, 2nd ed., vol. 1, New York, NY, USA: Van Nostrand Reinhold, pp. 32–54, 1990. [Google Scholar]
24. D. Graham and M. Fewster, “Techniques for automating test execution,” in Software Test Automation: Effective Use of Test Execution Tools, 1st ed., vol. 1. Boston, MA, USA: Addison-Wesley Professional, pp. 3–142, 1999. [Google Scholar]
25. P. G. Frankl and E. J. Weyuker, “An applicable family of data flow testing criteria,” IEEE Transactions on Software Engineering, vol. 14, no. 10, pp. 1483–1498, 1988. [Google Scholar]
26. H. Zhu, P. A. V. Hall and J. H. R. May, “Software unit test coverage and adequacy,” ACM Computer Survey, vol. 29, no. 4, pp. 366–427, 1997. [Google Scholar]
27. C. Pacheco, S. K. Lahiri, M. D. Ernst and T. Ball, “Feedback-directed random test generation,” in Proc. of the 29th Int. Conf. on Software Engineering, ICSE’07, Minneapolis, MN, USA, pp. 75–84, 2007. [Google Scholar]
28. T. Y. Chen, “Adaptive random testing,” in Proc. of the 9th Asian Computing Science Conf., Chiang Mai, Thailand, pp. 443, 2004. [Google Scholar]
29. M. Liu, Y. Gao, J. Shan, J. Liu, L. Zhang et al., “An approach to test data generation for killing multiple mutants,” in Proc. of the 22nd IEEE Int. Conf. on Software Maintenance, ICSM’06, Philadelphia, PA, USA, pp. 113–122, 2006. [Google Scholar]
30. M. Papadakis, N. Malevris and M. Kallia, “Towards automating the generation of mutation tests,” in Proc. of the 5th Workshop on Automation of Software Test, AST '10, Cape Town, South Africa, pp. 111–118, 2010. [Google Scholar]
31. A. Singh, N. Garg and T. Saini, “A hybrid approach of genetic algorithm and particle swarm technique to software test case generation,” International Journal of Innovations in Engineering and Technology (IJIET), vol. 3, no. 4, pp. 208–214, 2014. [Google Scholar]
32. M. Coccia and I. Benati, “Comparative studies,” in Global Encyclopedia of Public Administration, Public Policy, and Governance, 1st ed., vol. 1197-1, Gewerbesrasse, Cham, Switzerland: Springer, Cham, pp. 1–7, 2018. [Google Scholar]
33. Y. Ma, J. Offutt and Y. Kwon, “MuJava: An automated class mutation system,” Journal of Software Testing, Verification and Reliability, vol. 15, no. 2, pp. 97–133, 2005. [Google Scholar]
34. M. Harman, Y. Jia and B. Langdon, “Strong higher order mutation-based test data generation,” in Proc. of the 8th European Software Engineering Conf. and the ACM SIGSOFT Symp. on the Foundations of Software Engineering (ESEC/FSE ’11), Szeged, Hungary, pp. 212–222, 2011. [Google Scholar]
35. A. S. Ghiduk, M. R. Girgis and M. H. Shehata, “Reducing the cost of higher-order mutation testing,” Arabian Journal for Science and Engineering, vol. 43, no. 12, pp. 7473–7486, 2018. [Google Scholar]
Cite This Article
 Copyright © 2023 The Author(s). Published by Tech Science Press.
This work is licensed under a Creative Commons Attribution 4.0 International License , which permits unrestricted use, distribution, and reproduction in any medium, provided the original work is properly cited.
 Downloads
 Citation Tools