
 Submit a Paper
 Propose a Special lssue
 Open Access
ARTICLE

Auxiliary Classifier of Generative Adversarial Network for Lung Cancer Diagnosis
1 Department of Electrical and Electronics Engineering, Panimalar Institute of Technology, Chennai, Tamil Nadu, India
2 Department of Electronics and Communication Engineering, Sri Indu College of Engineering and Technology, Hyderabad, India
3 Department of Electronics and Communication Engineering, Sri Chandrasekharendra Saraswathi Viswa Mahavidyalaya University, (Deemed University), Kanchipuram, Tamil Nadu, India
4 Electronics and Communication Engineering, Saveetha School of Engineering, Saveetha Institute of Medical and Technical Sciences, Chennai, Tamil Nadu, India
* Corresponding Author: P. S. Ramapraba. Email:
Intelligent Automation & Soft Computing 2023, 36(2), 2177-2189. https://doi.org/10.32604/iasc.2023.032040
Received 04 May 2022; Accepted 15 June 2022; Issue published 05 January 2023
 View Full Text
 Download PDF
Abstract
The classification of lung nodules is a challenging problem as the visual analysis of the nodules and non-nodules revealed homogenous textural patterns. In this work, an Auxiliary Classifier (AC)-Generative Adversarial Network (GAN) based Lung Cancer Classification (LCC) system is developed. The proposed AC-GAN-LCC system consists of three modules; preprocessing, Lungs Region Detection (LRD), and AC-GAN classification. A Wiener filter is employed in the preprocessing module to remove the Gaussian noise. In the LRD module, only the lung regions (left and right lungs) are detected using iterative thresholding and morphological operations. In order to extract the lung region only, flood filling and background subtraction. The detected lung regions are fed to the AC-GAN classifier to detect the nodules. It classifies the nodules into one of the two classes, i.e., binary classification (such as nodules or non-nodules). The AC-GAN is the extended version of the conditional GAN that predicts the label of a given image. Three different optimization techniques, adaptive gradient optimization, root mean square propagation optimization, and Adam optimization are employed for optimizing the AC-GAN architecture. The proposed AC-GAN-LCC system is evaluated on the Lung Image Database Consortium (LIDC) database Computed Tomography (CT) scan images. The proposed AC-GAN-LCC system classifies ∼15000 CT slices (7310 non-nodules and 7685 nodules). It provides an overall accuracy of 98.8% on the LIDC database using Adam optimization by a 10-fold cross-validation approach.Keywords
Cancer begins in the cell, which is the basic unit of the human body. The uncontrolled cell growth within the lung fields or the bronchial airways is lung cancer. Tobacco smoking is the most common cause of lung cancer, contributing to 85–90% of all lung cancers. Fig. 1 shows the estimated number of cancer cases in 2020 [1]. It is observed that lung cancer is the second leading cancer after breast cancer worldwide. To reduce mortality, an accurate lung cancer detection system is required. The lung scans are acquired using different imaging modalities, including Computed Tomography (CT), Magnetic Resonance Imaging (MRI), and positron emission tomography. The techniques based on CT are always preferred due to their speed and cost.
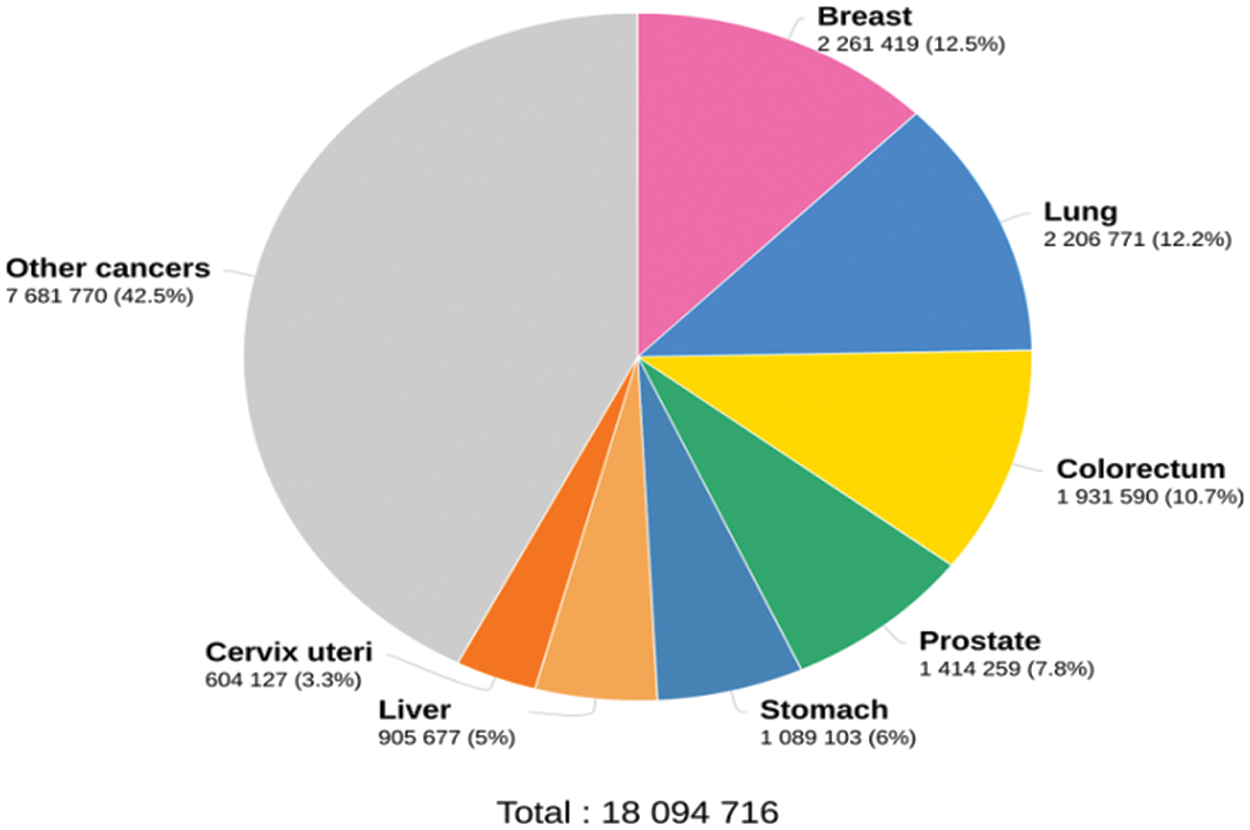
Figure 1: Cancer statistics in 2020
Different technologies demonstrated themselves as a potential technique to classify the lung nodules. Each method is based on a different machine learning concept that would be useful for the non-invasive identification of lung nodules.
Fisher Criterion (FC) based feature selection method is discussed in [2] with the help of the Genetic Algorithm (GA). It uses a local binary pattern, wavelet-based features, and a histogram of oriented gradients. The features selected by the FC-GA approach are fed to AdaBoost, Bayes classifier, and Support Vector Machine (SVM) classifiers to classify lung nodules. A multi-task Convolution Neural network (CNN) is designed in [3] for benign/malignant nodule classification. The nodules are viewed from nine two-dimensional views from different angles. An auxiliary and discriminating task is also designed to preserve the microscopic information for further analysis.
The restricted Boltzmann machines are discussed in [4] for feature learning of CT images. It uses a combination of both generative and discriminative representations. A deep learning system is designed in [5] for lung nodule classification. For effective training and more accuracy, batch normalization and dropout conditions are employed along with dense block architecture. Also, the input images are preprocessed at first using median and Laplacian filters with instant contrast enhancement. A lung pattern classification system is developed in [6] using deep CNN. It comprises five convolution layers, average pooling, and three dense layers. The convolution layer uses 2 × 2 kernels with a leaky rectified linear activation function.
A multiple view-based CNN for malignant estimation is described in [7] using lung CT scans. A compact feature representation is obtained by encoding the nodule’s volumetric information. It uses the cross-section view of nodules from multiple view angles. A gated dilated network is discussed in [8] for lung nodule classification. It replaces the max-pooling layers with multiple dilated convolutions and captures the scale variations effectively. To analyze the features, it uses a context-aware sub-network to guide them to a suitable layer. A vector quantization scheme is described in [9] for lung nodule detection. The vector quantization scheme identifies the initial nodules, and then rule-based filtering is employed to reduce false positives. Finally, feature-based SVM is used for the classification.
The multisource transfer learning for lung pattern classification is implemented in [10] with CNN. For transfer learning, six texture databases are utilized for pre-training the network and then fine-tuned for lung CT scans. A transferable texture CNN is described in [11] for lung nodule classification. An energy layer is integrated with the convolution layer to extract texture features. It comprises three convolution layers and an energy layer. A two-stage CNN is described in [12] for lung nodule classification. The first stage uses U-net based nodule segmentation, and the next step uses three CNN architectures with a dual pooling structure for classification. Different densely connected CNNs are employed in [13] for malignant nodule classification. AdaBoost is utilized to aggregate the outputs from the CNNs. Great demands arise in the medical domain to evaluate the characteristics of medical images that help identify the earliest abnormalities.
A lightweight CNN architecture is discussed in [14] to diagnose Covid-19 using chest X-rays. The image is given directly to the CNN architecture in [14], consisting of two convolution blocks and an average pooling layer. A fully connected layer with a softmax function is utilized for the classification. A transfer learning based system is designed in [15] using MobileNetV2. A Gaussian blur operation removes the Gaussian noise in the preprocessing stage with the sliding window concept. The standard activation function in MobileNetV2 is replaced by the exponential linear unit activation function for the classification. A deep CNN architecture is discussed in [15] for lung cancer classification. Two preprocessing steps, noise removal and enhancement, are performed before classification. Deep hunting optimization is also employed for accurate classification with batch normalization to speed up the classification process.
This work presents the Auxiliary Classifier (AC)-Generative Adversarial Network (GAN) for Lung Cancer Classification (LCC) system for the classification of nodules in the lung CT scans. The rest of the paper is as follows: Section 2 discusses the design of the proposed AC-GAN-LCC system with three modules. The results of the AC-GAN-LCC system on Lung Image Database Consortium (LIDC) database CT scan images are discussed in Section 3, and the conclusion is made in Section 4.
This section discusses the proposed AC-GAN-LCC system. It consists of three modules. They are preprocessing, Lungs Region Detection (LRD), and AC-GAN classification. A Wiener filter is employed in the 1st module to remove the Gaussian noise. The second module uses iterative thresholding and morphological operations to detect the lung regions (left and right lungs). The detected lung regions are fed to the AC-GAN classifier to detect the nodules in the final module.
In many image-based classification systems, preprocessing module is introduced to improve the system’s performance by removing unwanted information, background details, and noises. As a Gaussian distribution can model the random noise in CT scanners, the Wiener filter [16] is the best choice to remove the noise. The estimate (
where
where
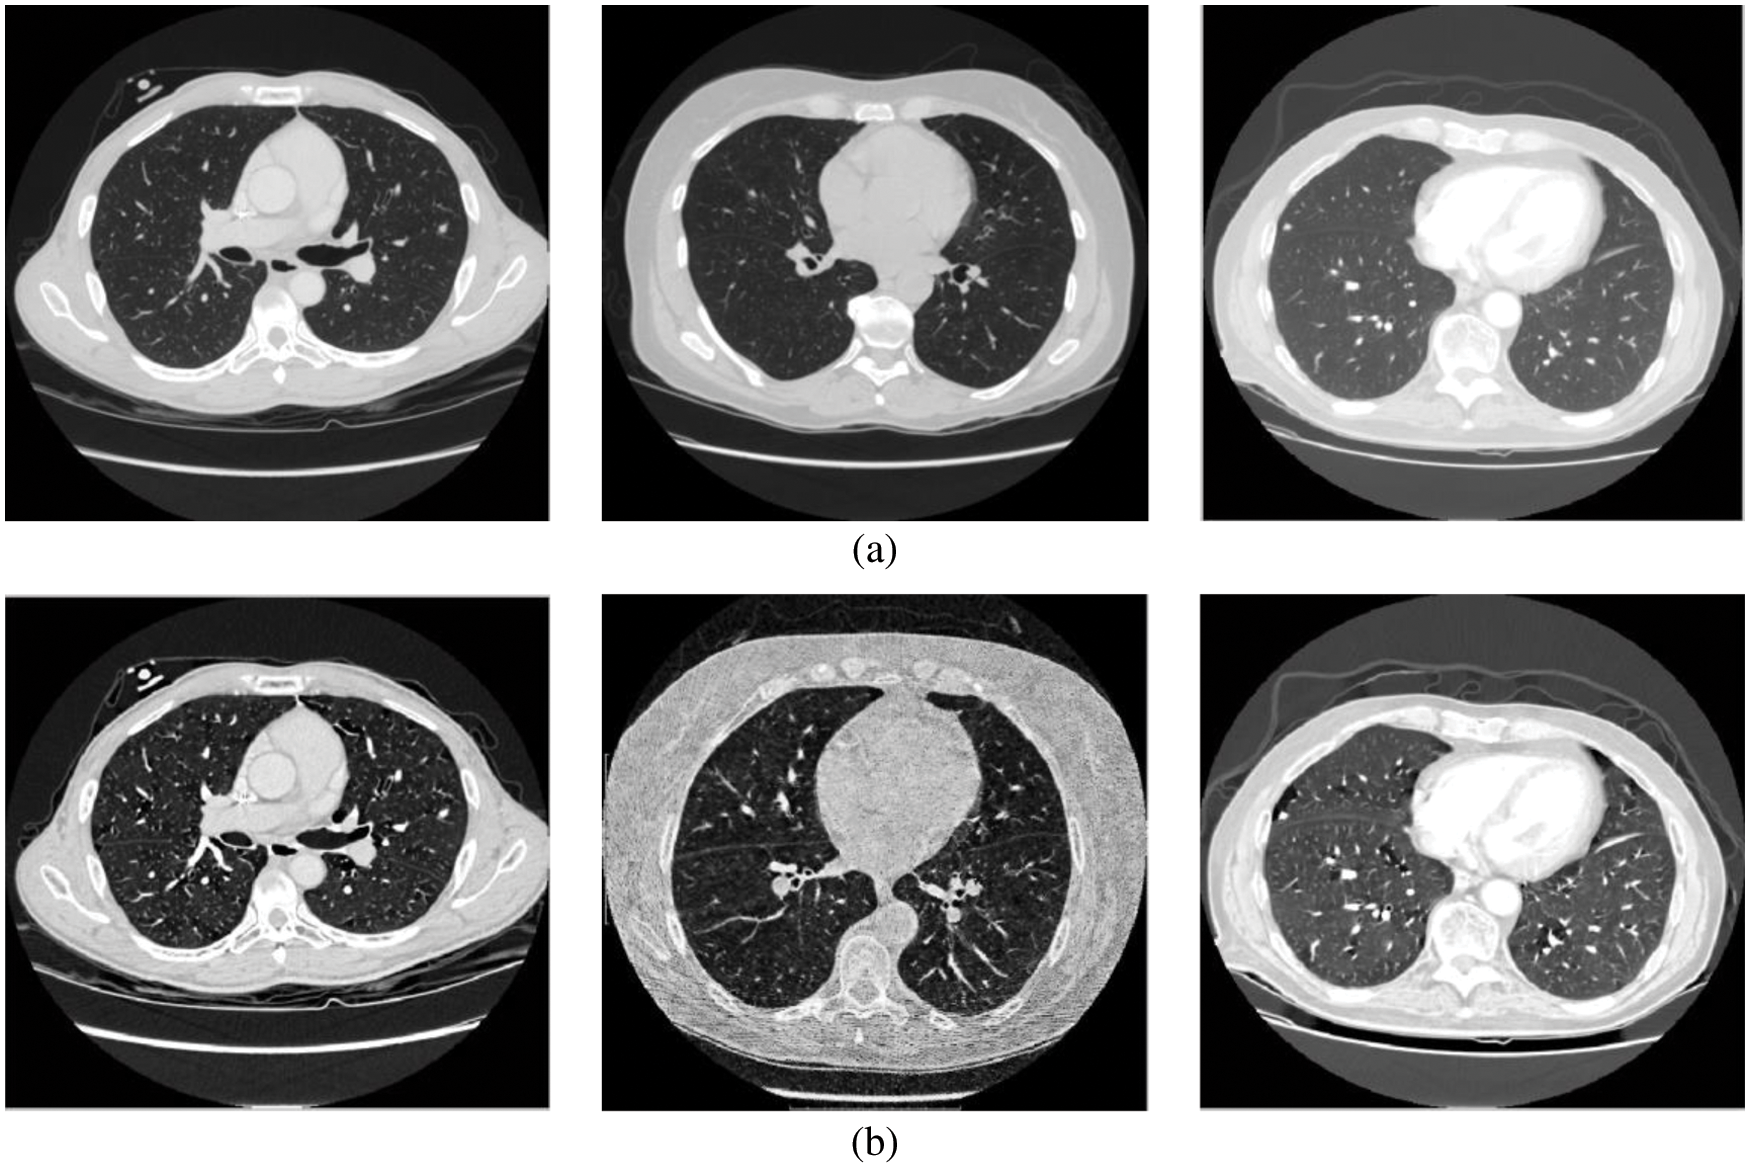
Figure 2: (a) Input CT scans (b) Wiener filtered image
This module employs iterative thresholding and morphological operations to detect the left and right lung regions. The thresholding algorithm selects a gray value (threshold value) for binarization or thresholding of the image, as shown in Fig. 3a. The global thresholding approach cannot adapt to the local variations in the CT lung scans. Thus iterative thresholding [17,18] is applied.
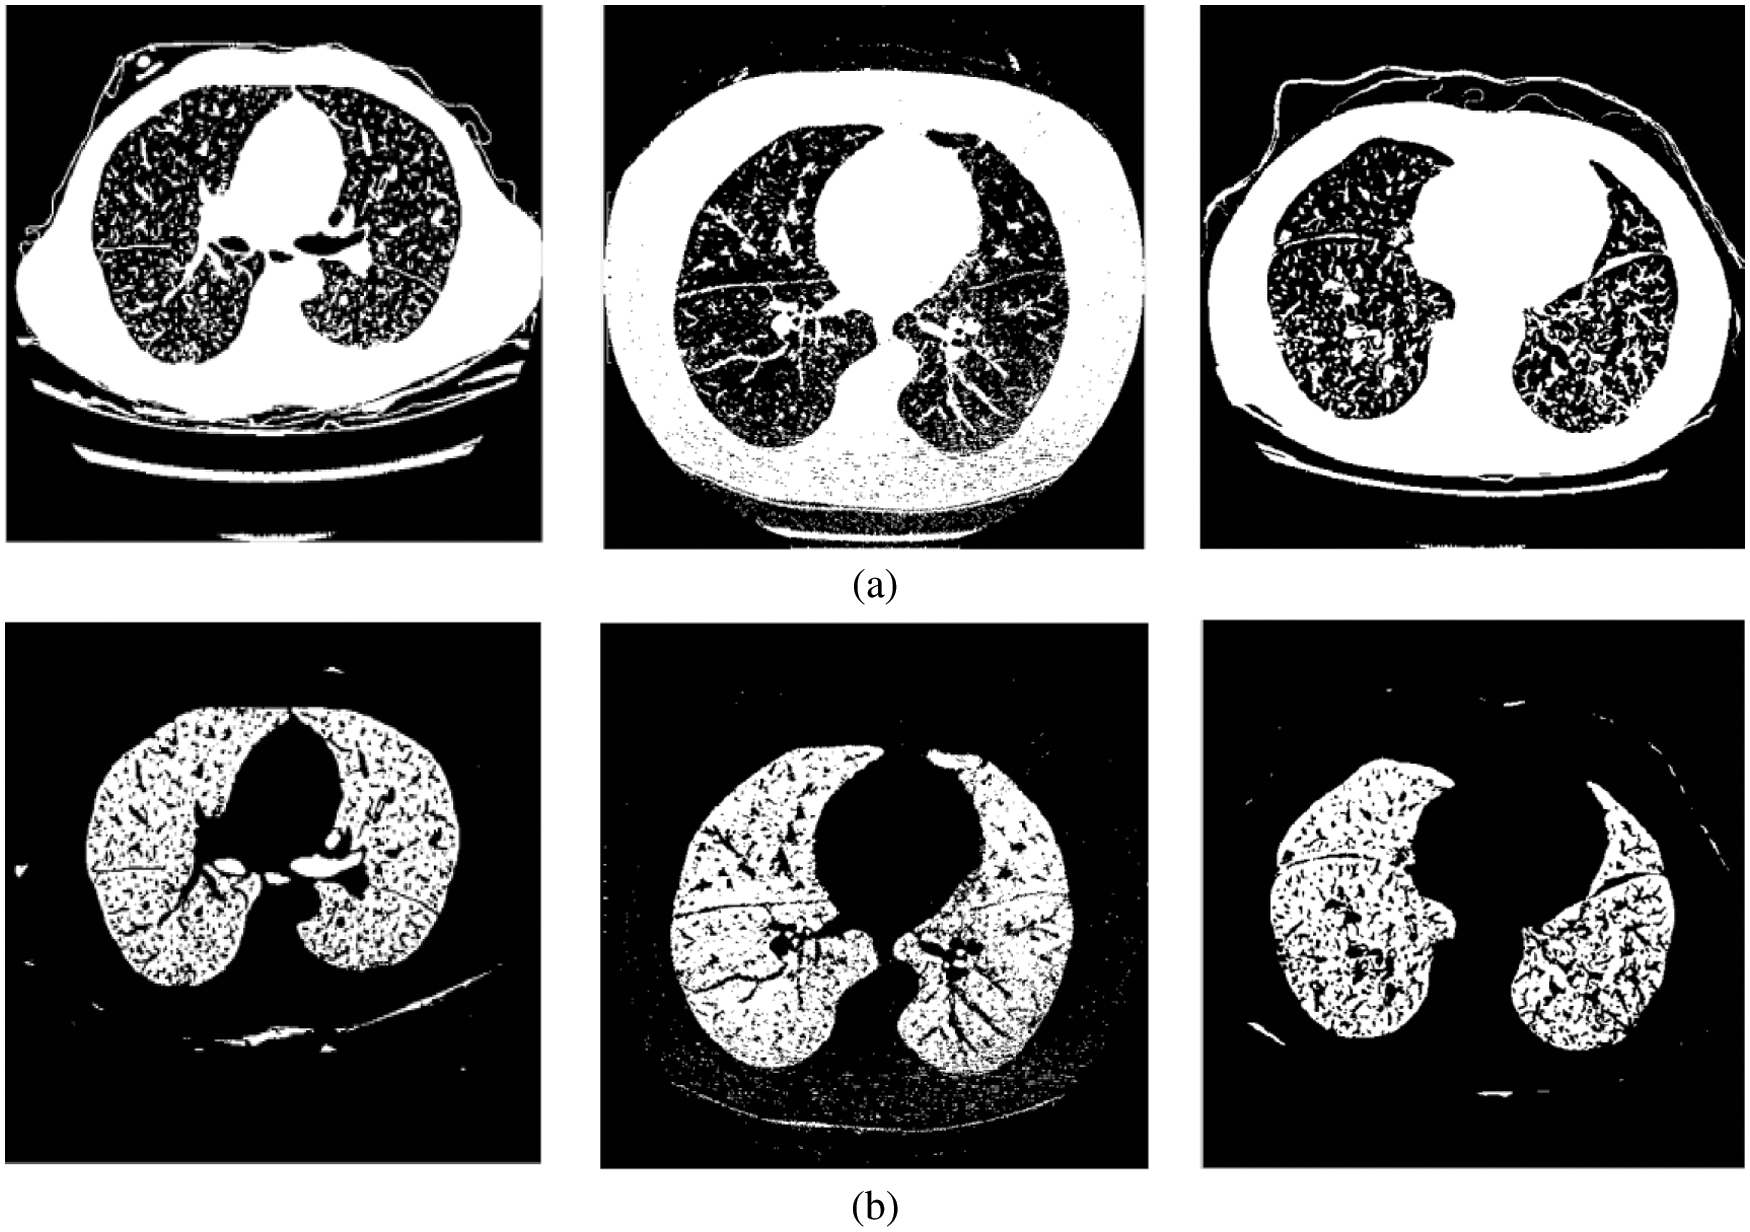
Figure 3: (a) Threshold image (b) Lung region image
The optimum threshold value is computed using Eq. (3).
where
The deep learning architectures; GAN [19] and CNN [20] are commonly used in many computer vision applications. GAN has generative and discriminative systems, whereas CNN only has discriminator models. Fig. 4 shows the inputs and outputs of the AC-GAN. In this work, the AC-GAN discriminator model is utilized to classify lung nodules present in the lung regions. The aim is to accurately maximize the probability of classifying the lung regions into nodules or non-nodules.
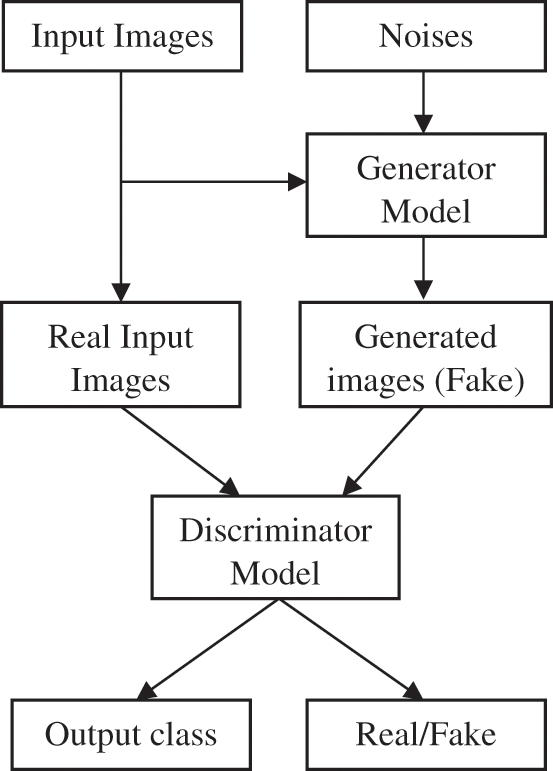
Figure 4: AC-GAN (inputs and outputs)
Three different optimization techniques, Adaptive Gradient Optimization (AGO), Root Mean Square Propagation Optimization (RMSPO), and Adam Optimization (AO), are employed for the optimization of the AC-GAN architecture. The AGO improves the performance of spare gradients problems, maintaining a per-parameter learning rate (0.005). The current magnitudes of the gradients are averaged in RMSPO for the weight, whereas the average of second moments is used in the AO. The proposed AC-GAN-LCC system uses a batch size of 100 with 50000 iterations. Table 1 summarizes the arrangement of layers in the AC-GAN architecture (Convolution (Conv) and Transposed Convolution (TConv)).
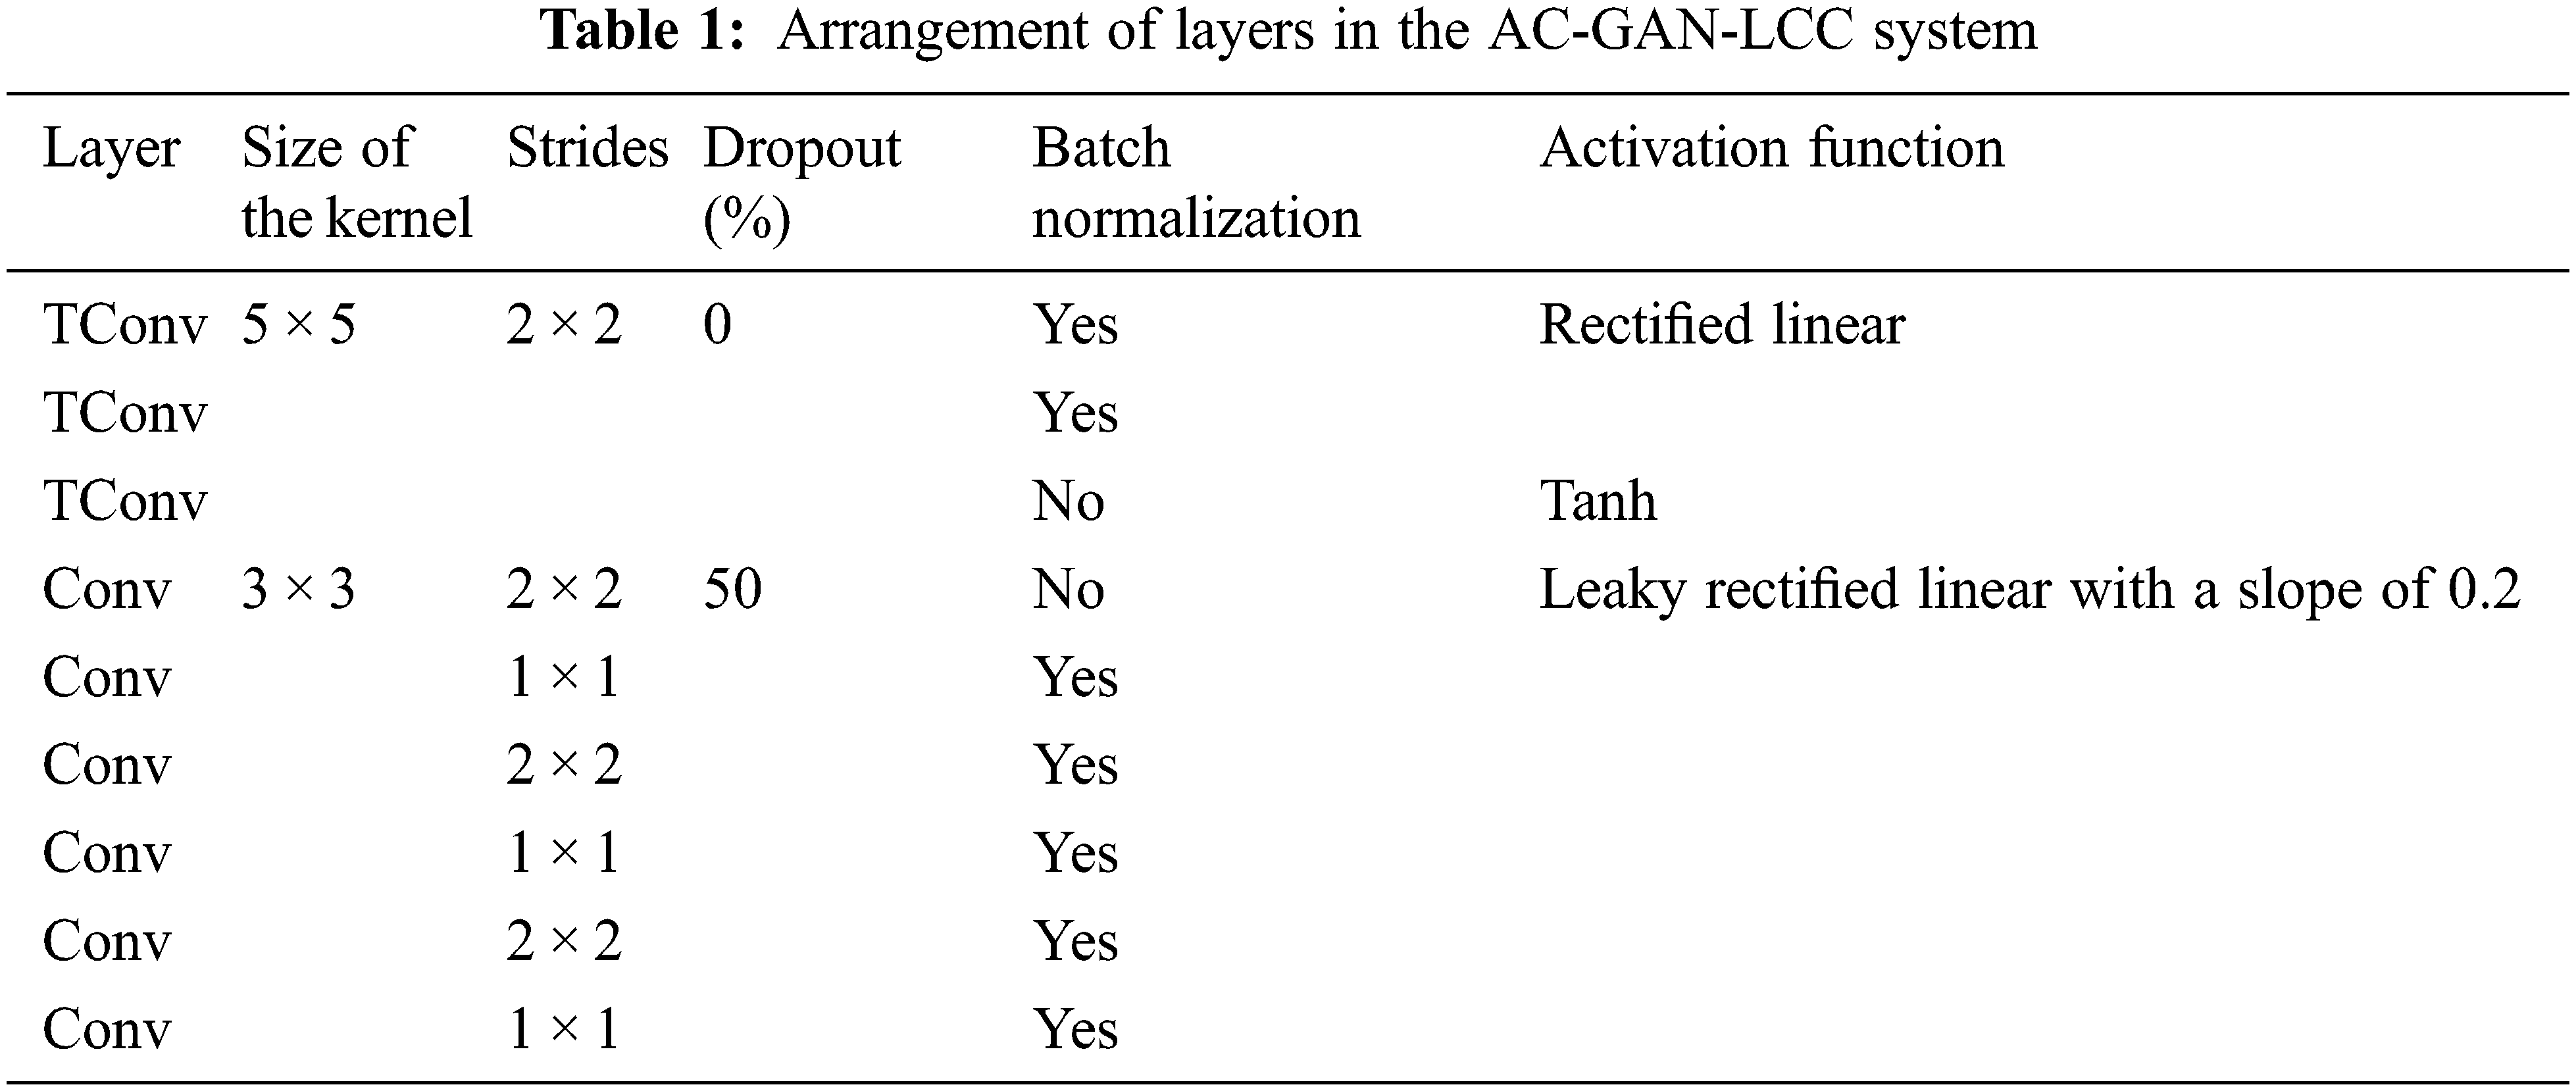
TConv is also called de-convolution which uses the regular convolution but the spatial transformation is reverted. The regular convolution for an input (
where y is the resulting matrix.
In Table 1, the step size used by the kernel when traversing over the inputs is defined as stride. Dropout is a regularization method used to overcome the problem of overfitting. The randomly selected neurons are ignored during training and their weights are not updated in the backward pass. Batch normalization normalizes or standardizes the activation of previous layers by mini-batch size instead of standardizing the whole data. Fig. 5 shows the activation functions used in the proposed architecture.
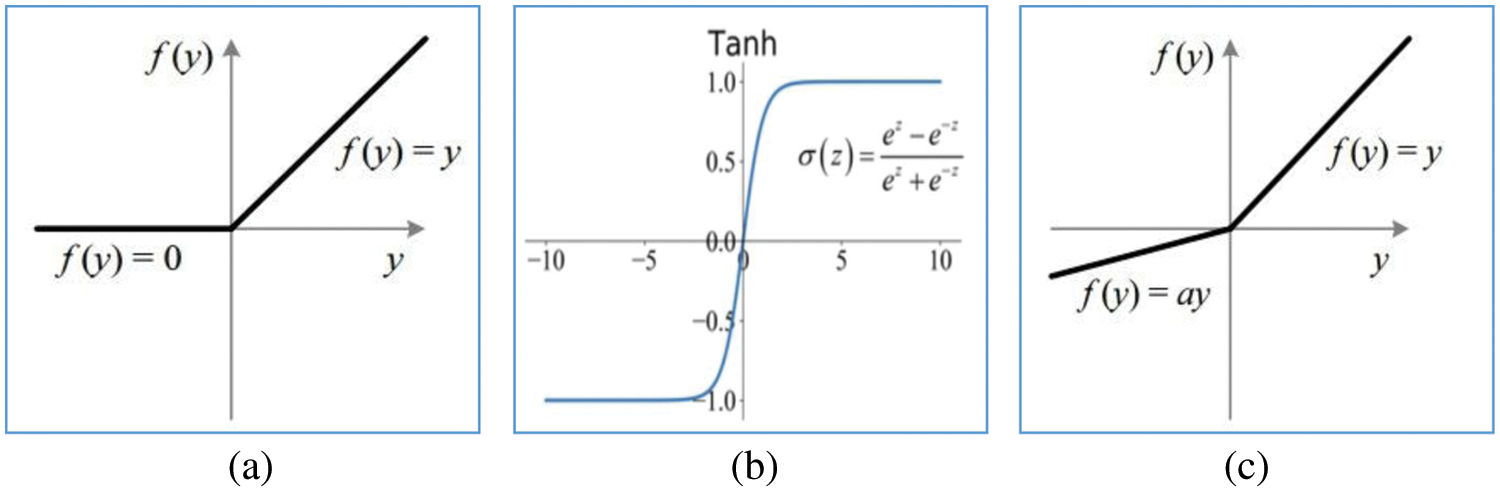
Figure 5: Activation functions (a) Rectified linear (b) Tanh (c) Leaky rectified linear with slope ‘a’
The CT lung images from LIDC [21,22] database images in the “Digital Imaging and Communications in Medicine” format are used to evaluate the AC-GAN-LCC system designed in the previous chapter. It is the world’s largest lung CT image database, collected from 1018 patients. Fig. 6 shows the sample images in the LIDC database. The size of CT scans in LIDC is 512 × 512 pixels. The layer thickness is between 1.25 and 3 mm, and 375,590 lung CT scans are available. From the annotations of four experienced radiologists, the information about the nodules is recorded in the extensible markup language file. Based on the ground truth data, the proposed system uses 14995 CT slices (7310 non-nodules and 7685 nodules) for the classification study. The performance of the AC-GAN-LCC system is validated using the k-fold (k = 10) cross-validation approach. Fig. 7 shows the procedure for the validation approach.
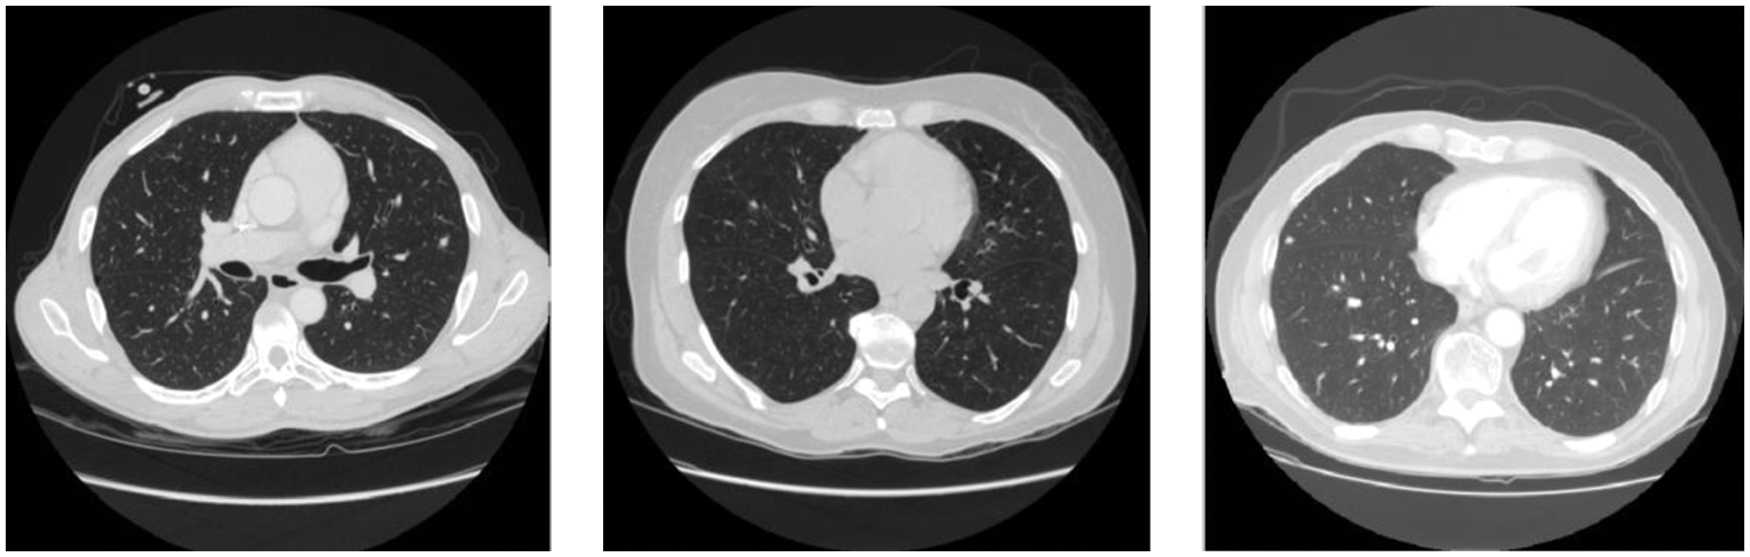
Figure 6: Sample CT scans in LIDC database
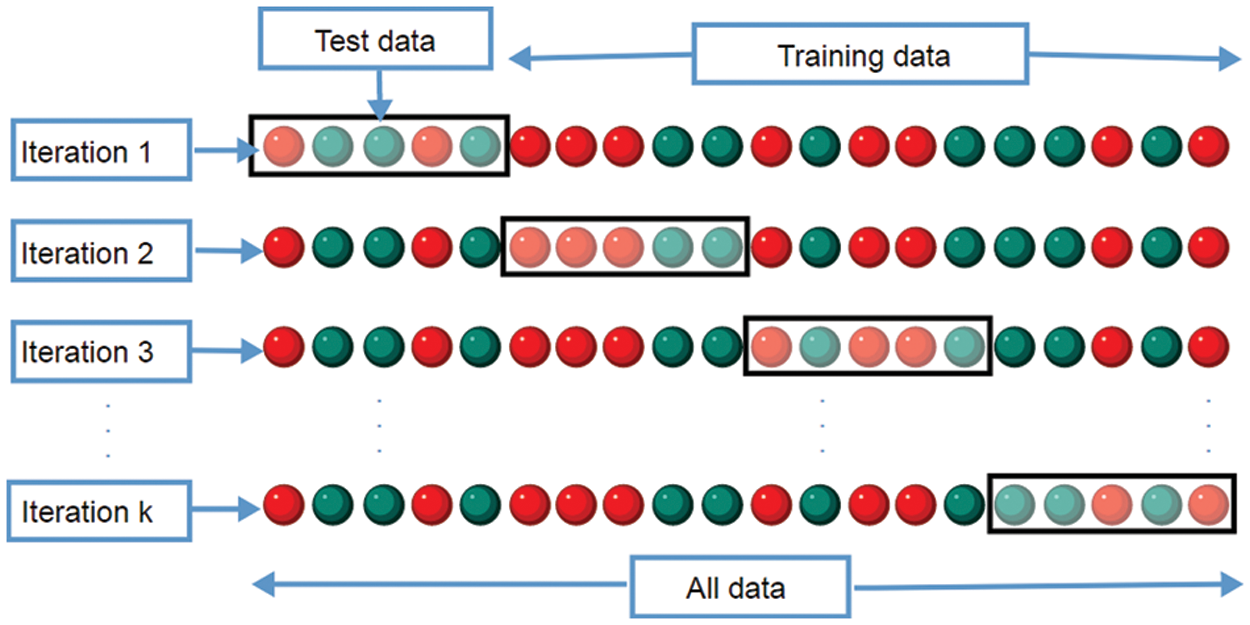
Figure 7: AC-GAN-LCC cross-validation procedure
The performance measures used in the AC-GAN-LCC system are as follows:
Sensitivity: The ability of the AC-GAN-LCC system to correctly classify the nodule CT scans with a positive condition, i.e., nodule. It is defined in Eq. (5).
where TP and FN are computed from the output of the AC-GAN-LCC system. The total number of nodule images correctly classified as nodules are counted as TP and misclassified as non-nodules are counted as FN.
Specificity: The ability of the AC-GAN-LCC system to correctly reject the non-nodule CT scans without a condition i.e., nodule. It is defined in Eq. (6).
The total number of non-nodule images correctly classified as non-nodules are counted as TN and misclassified as nodules are counted as FP.
Accuracy: The overall accuracy of the AC-GAN-LCC system is defined in Eq. (7). It is the ratio between the total number of correctly classified nodules and non-nodule images and the total number of tested images.
The performance of the AC-GAN-LCC system is evaluated using the combination of different optimization approaches and filtering. The various combinations are as follows: Wiener filter + AGO (WAGO), No preprocessing + AGO (NAGO), Wiener filter + RMSPO (WRMSPO), No preprocessing + RMSPO (NRMSPO), Wiener filter + AO (WAO) and No preprocessing + AO (NAO). The performances of the AC-GAN-LCC system are analyzed at first with no preprocessing and then analyzed with wiener filtered images. Table 2 illustrates the formation of the confusion matrix.
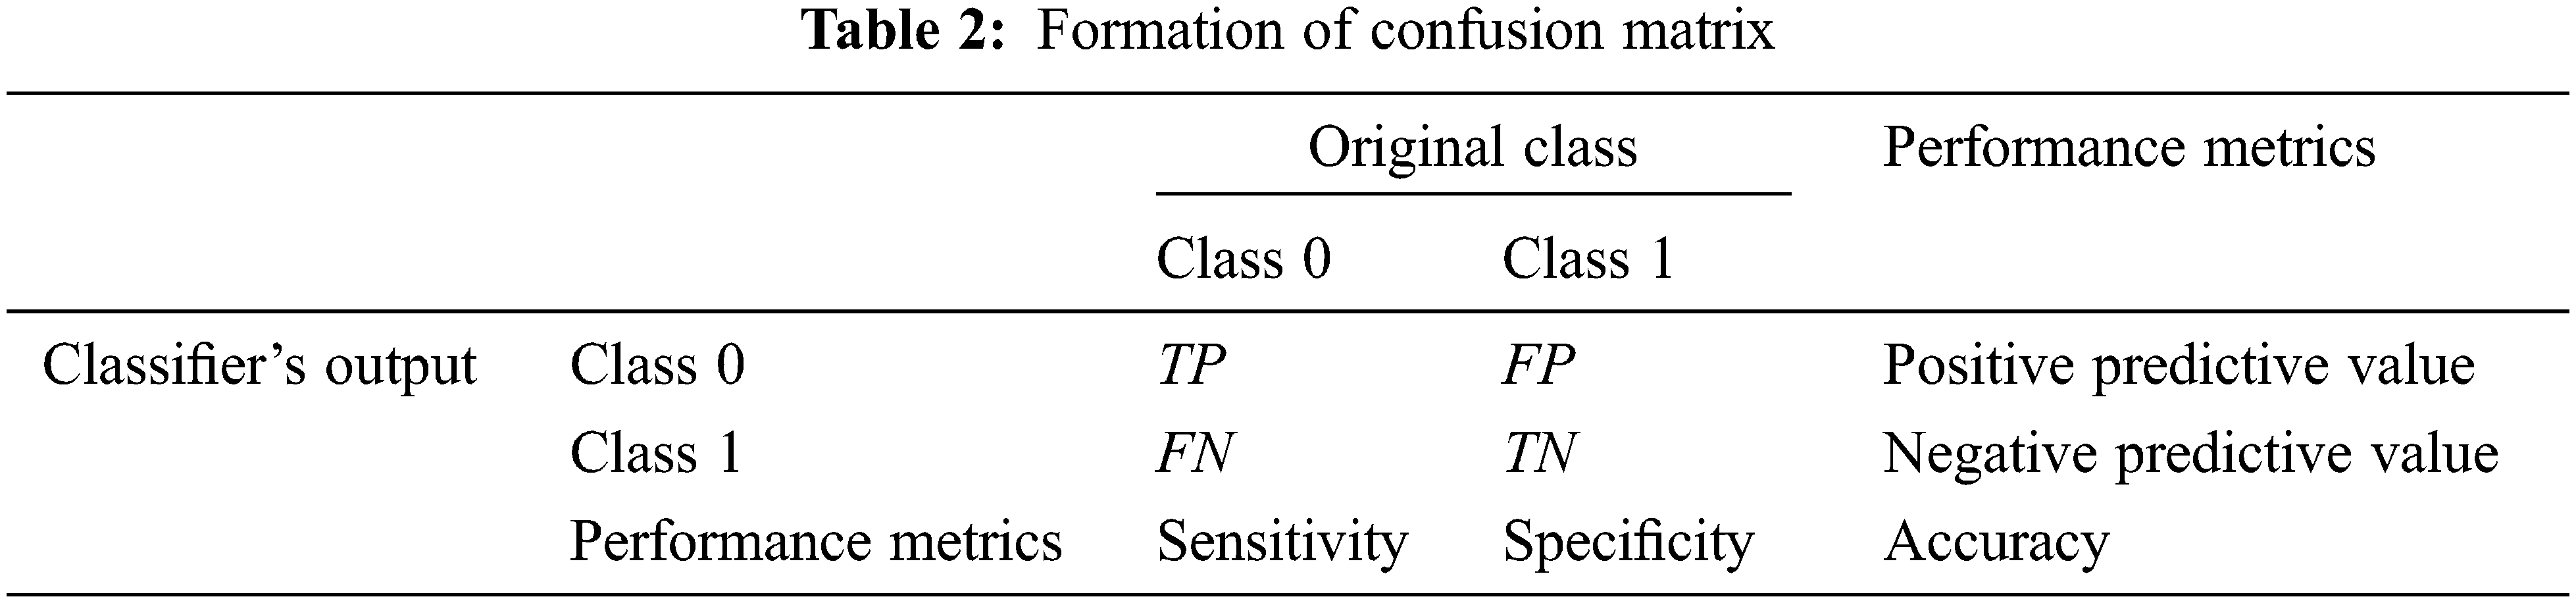
Fig. 8 shows the confusion matrices and ROCs of NAGO, NRMSPO and NAO based AC-GAN-LCC system.

Figure 8: Performances of the AC-GAN-LCC system with no preprocessing module
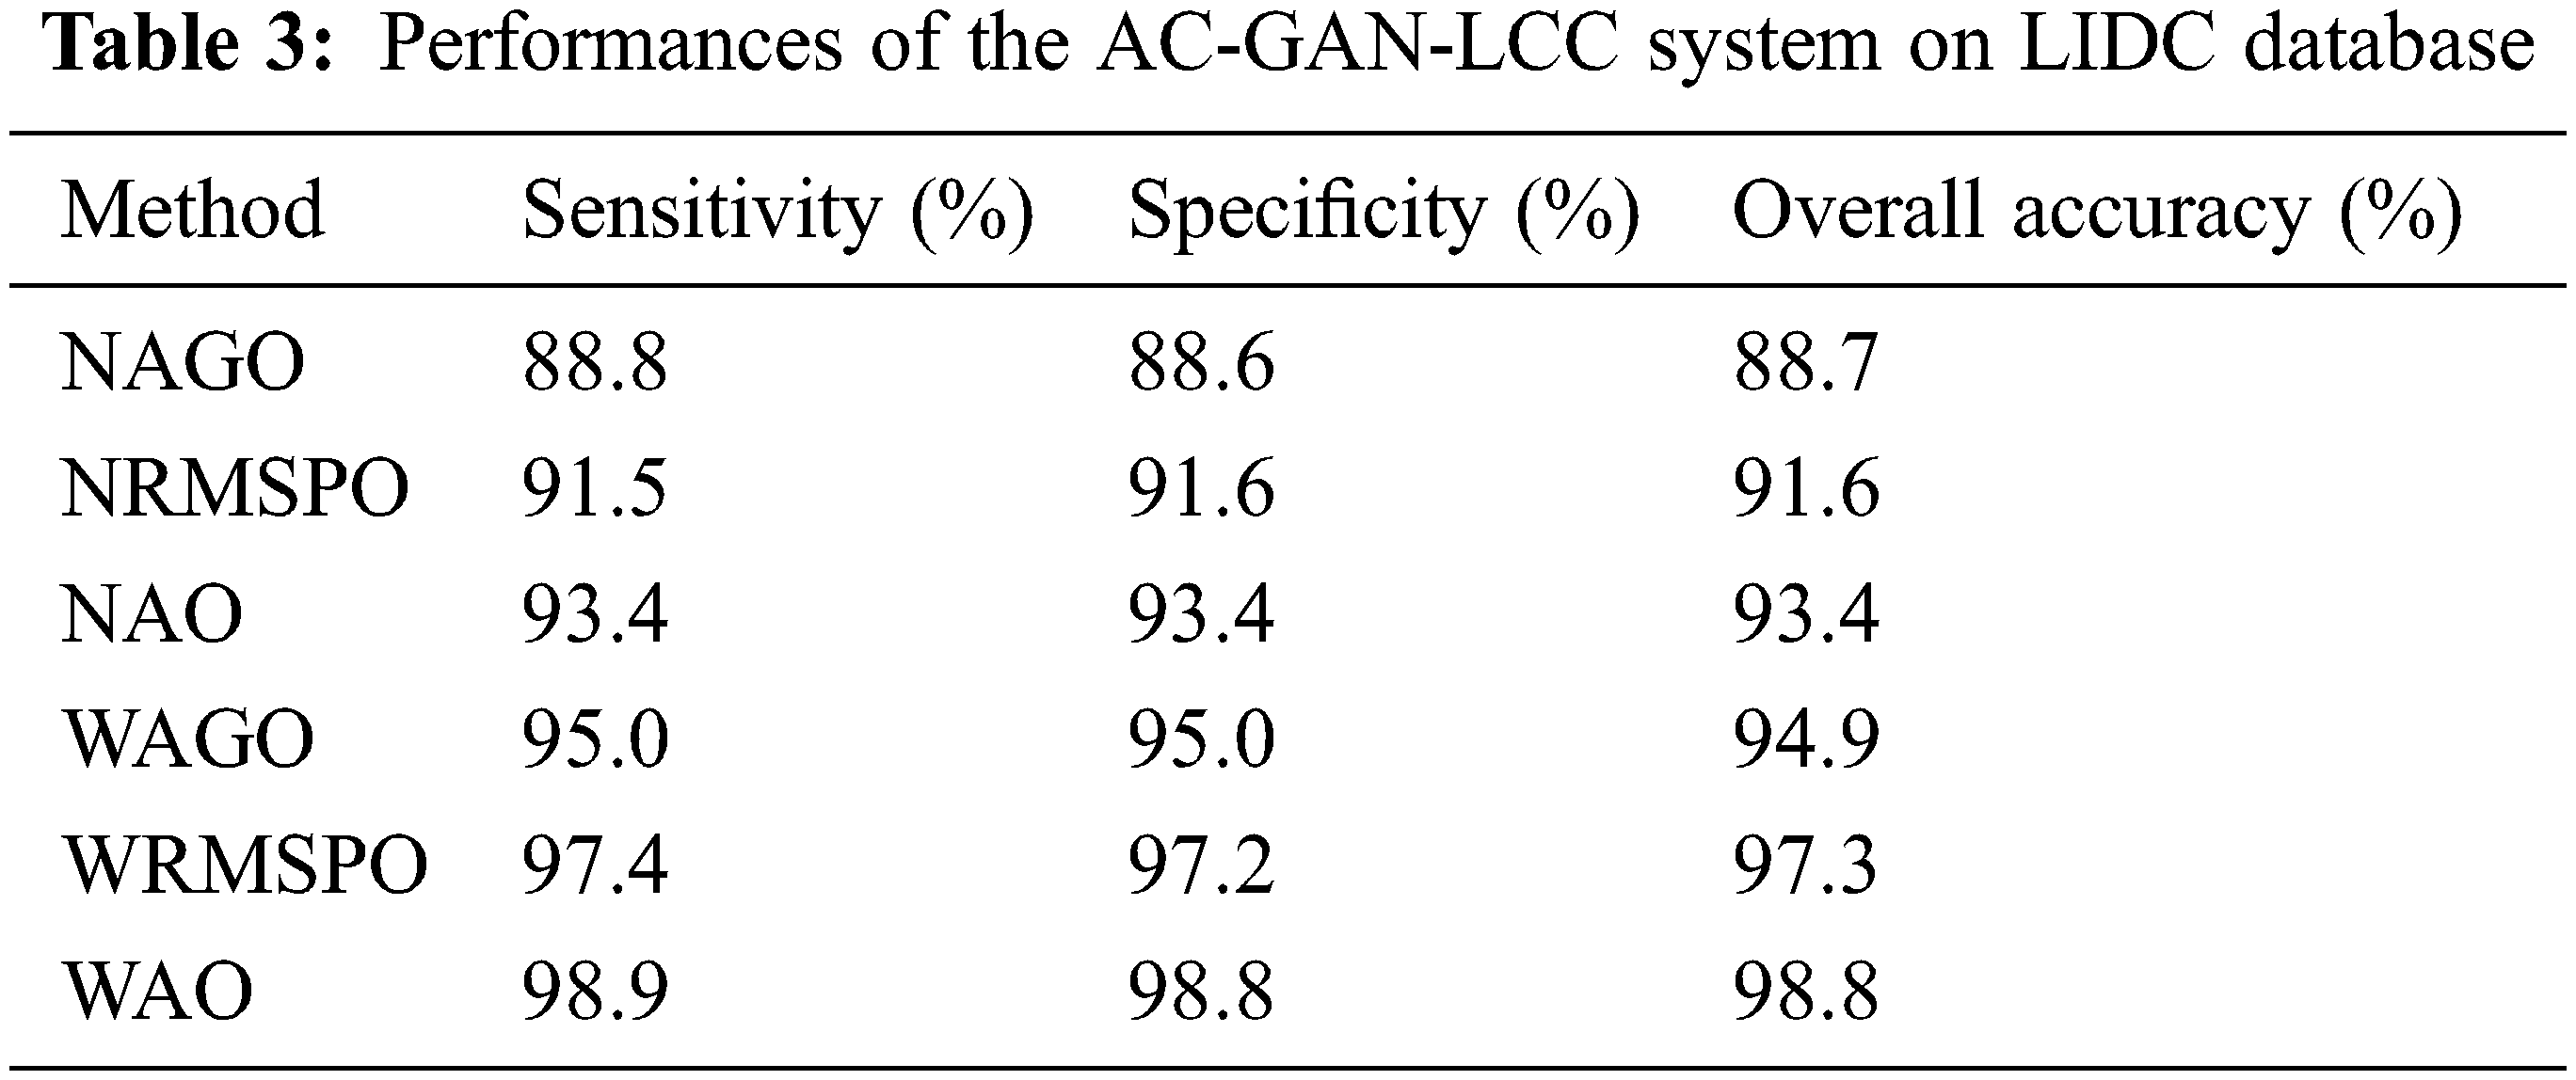
It is observed from Fig. 8 that the AC-GAN-LCC system with NAO provides promising results with 93.4% accuracy to NAGO (88.7%) and NRMSPO (91.6%) algorithms. The maximum sensitivity and specificity of the AC-GAN-LCC system is 93.4% by the NAO approach, whereas the measures are ∼91.5% for NRMSPO and ∼88.6% for NAGO algorithms. The best performer among the three optimization approaches is NAO, clearly visible in Fig. 8d. Fig. 9 shows the confusion matrices and ROCs of WAGO, WRMSPO, and WAO based AC-GAN-LCC system.
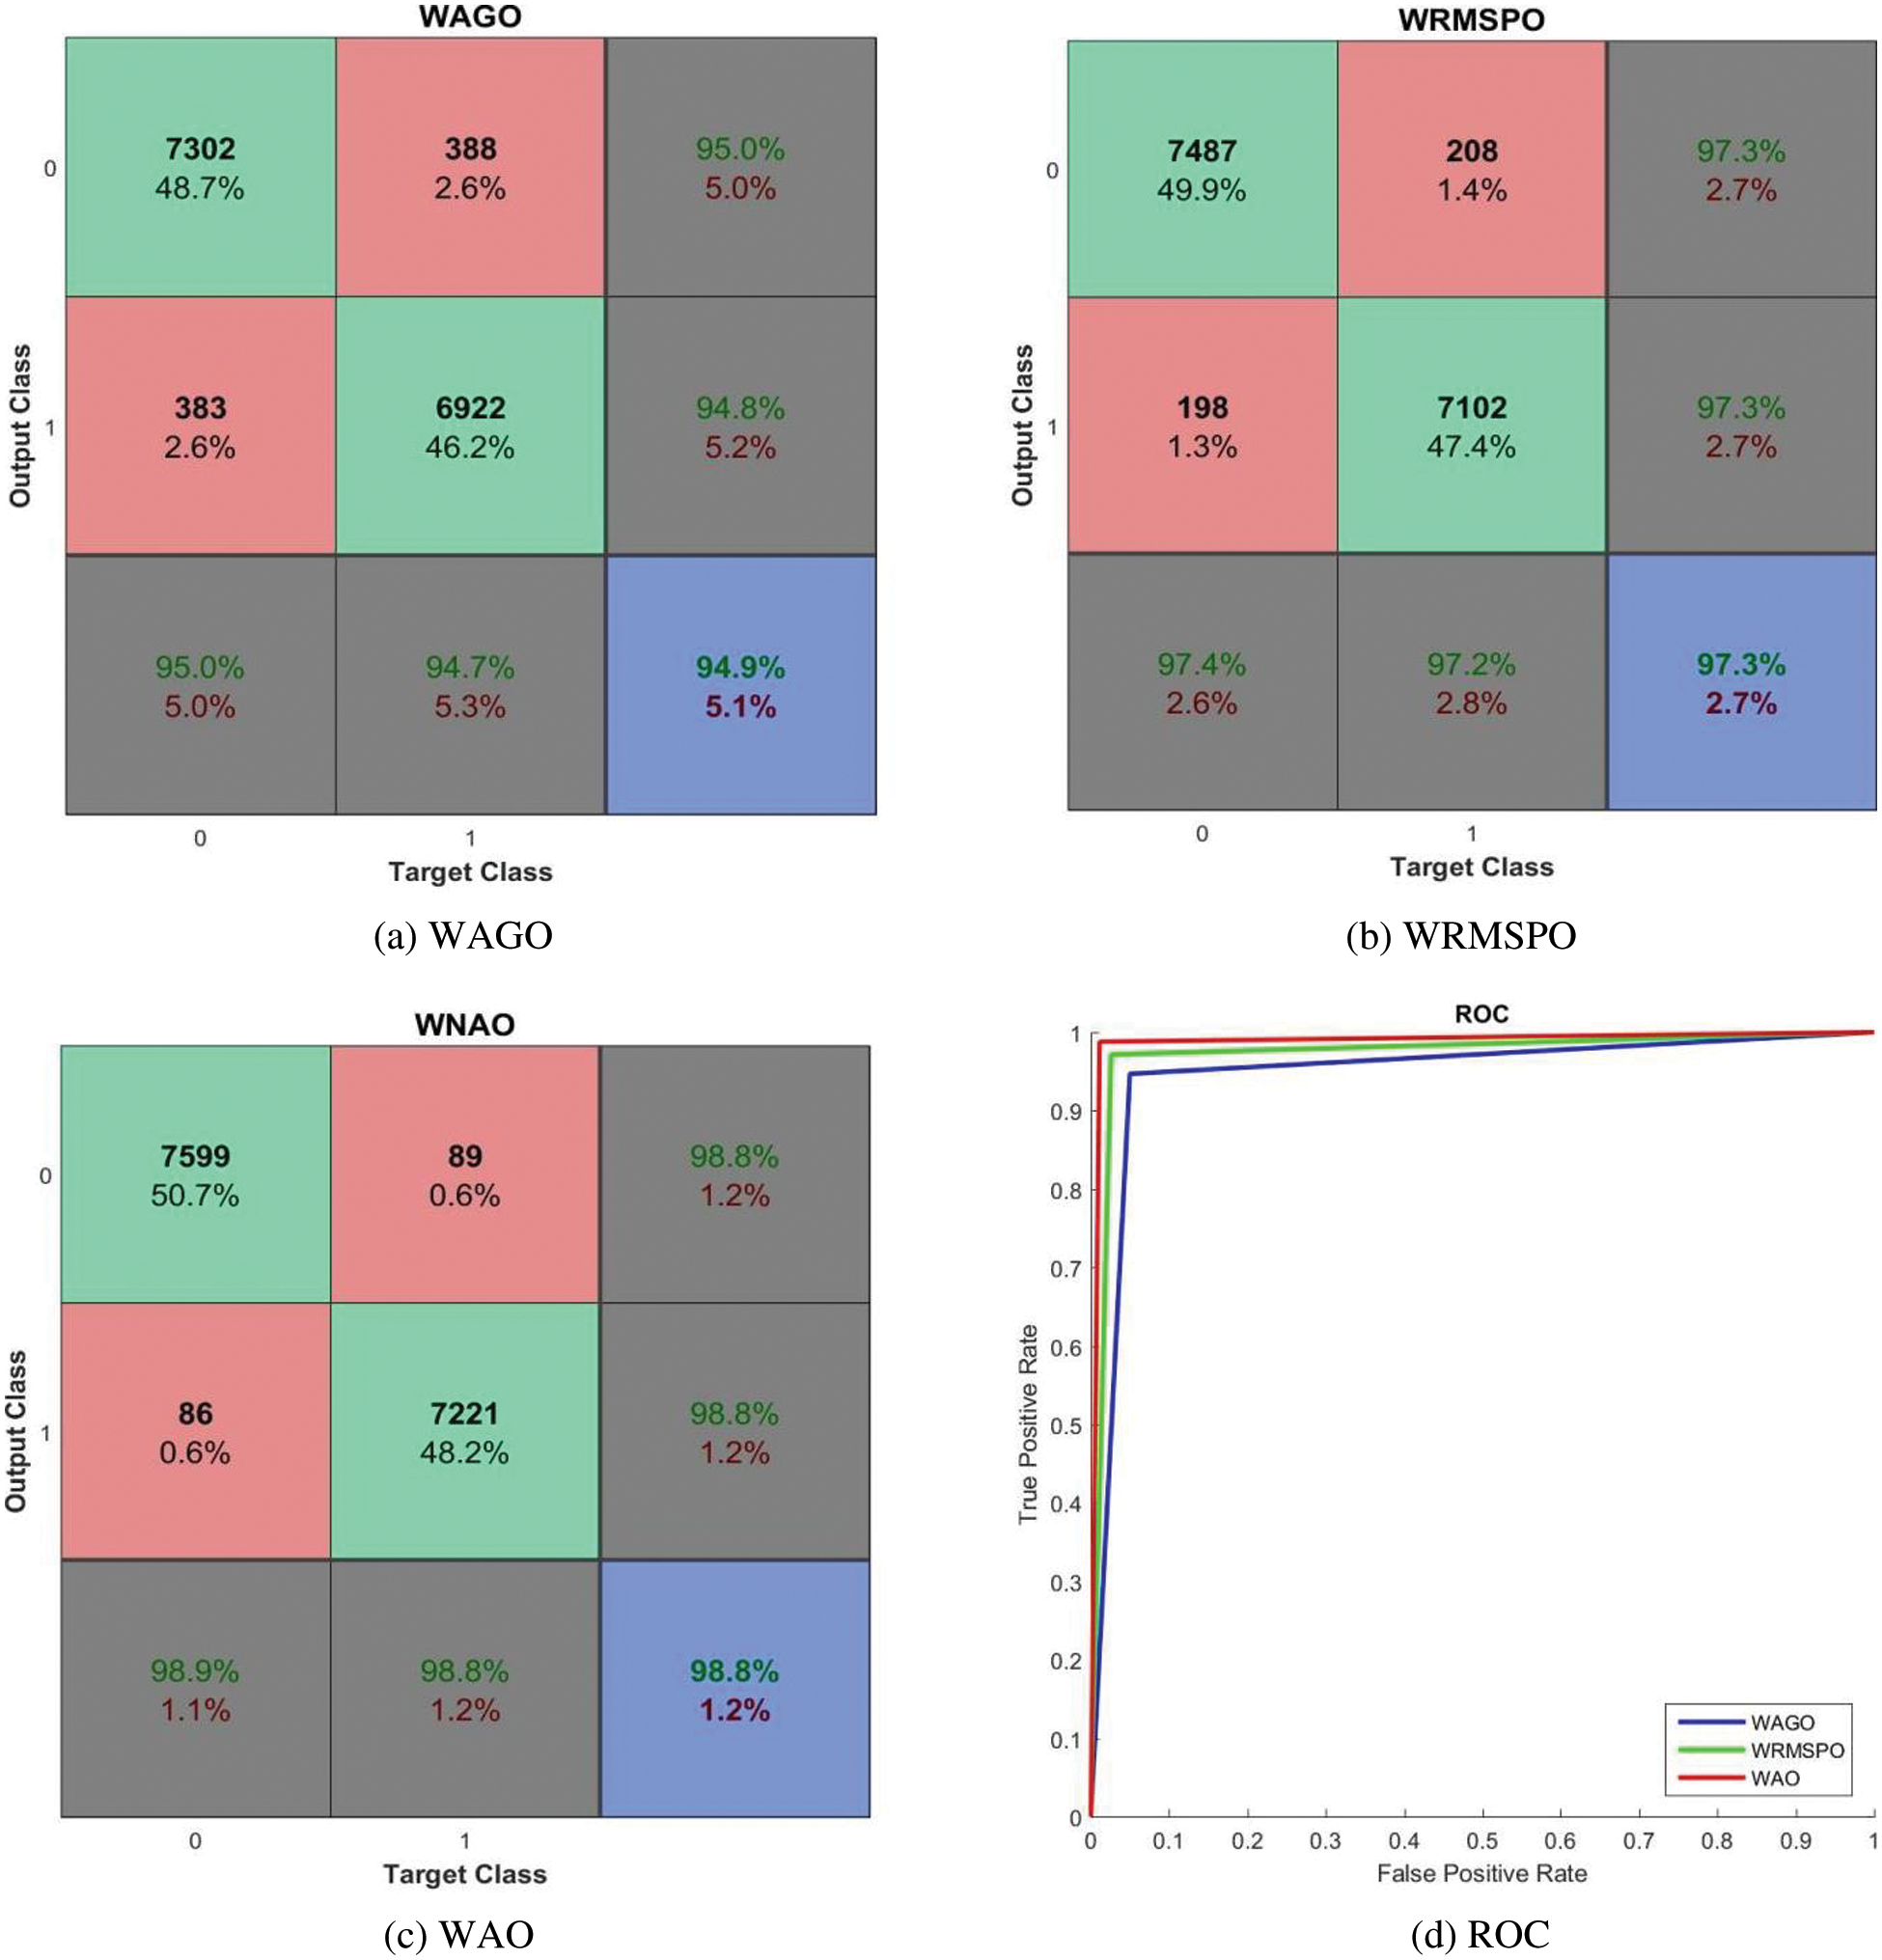
Figure 9: Performances of the AC-GAN-LCC system with Wiener filtered CT scans
It can be seen from Fig. 9 that the performance of the AC-GAN-LCC system is increased when using the Wiener filtered image. The system’s accuracy is 98.8% by the WAO approach, whereas it is 93.4% only by the NAO approach. The WAO approach correctly classified lung nodules with 98.9% (sensitivity), and the non-nodules are correctly classified with 98.8% (Specificity). The sensitivity of the WAGO and WRMSPO approach is 94.9% and 97.3%, respectively. Fig. 10 shows the separate combined ROCs to analyze the performances of AGO, RMSPO, and AO. The performances of the AC-GAN-LCC system are summarized in Table 3.
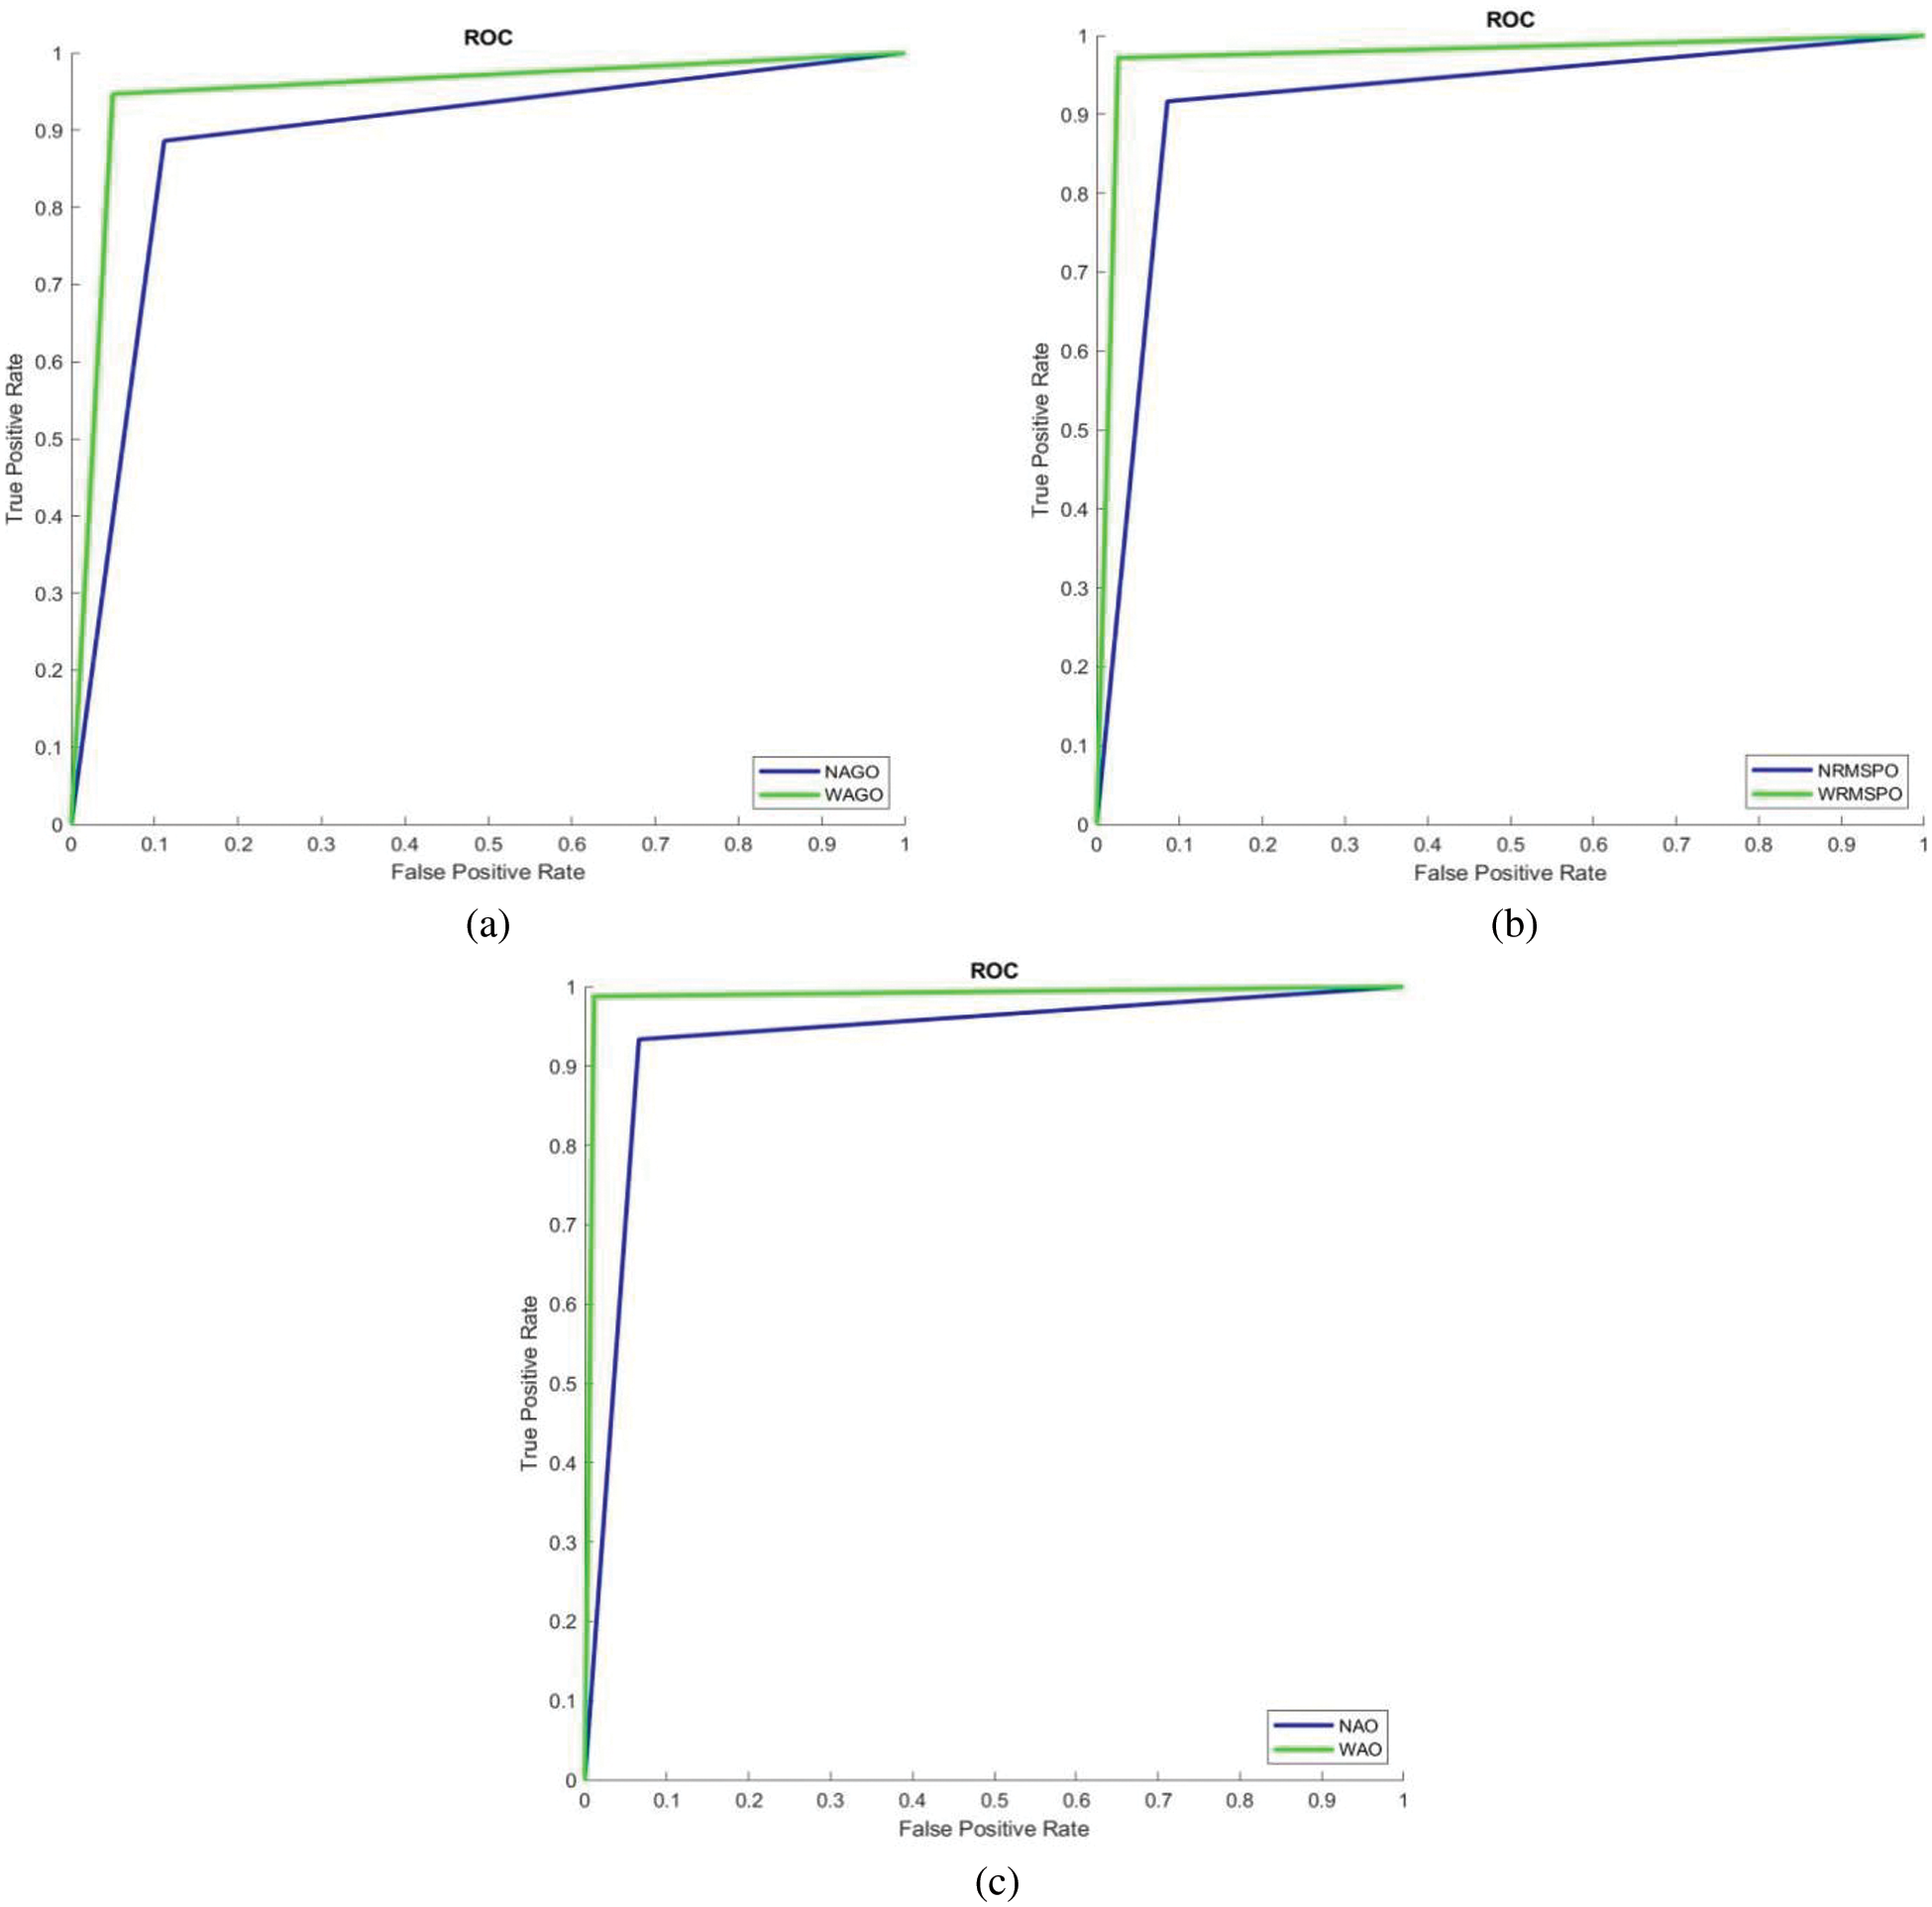
Figure 10: Combined ROCs (a) AGO (b) RMSPO and (c) AO
The AC-GAN architecture is designed for the LCC system using lung CT scans in this work. The highest priority of any diagnosis system must be the accuracy of the diagnosis. The proposed AC-GAN-LCC system is designed with three modules and has provided 98.8% classification accuracy and specificity with a sensitivity of 98.9%. The results showed that the obtained sensitivity, specificity, and accuracy by the WAO approach are superior to other combinations such as WAGO, NAGO, WRMSPO, NRMSPO, and NAO. For each combination, the AC-GAN classifier uses the same training and testing samples prepared by the 10-fold approach for its training and testing phases. The proposed AC-GAN-LCC system presented here is intended a stepping stone to developing a reliable classification method for characterizing lung CT scans.
Funding Statement: The authors received no specific funding for this study.
Conflicts of Interest: The authors declare that they have no conflicts of interest to report regarding the present study.
References
1. Cancer Today, International Agency for Research on Cancer (IARCLyon, France, 2022. [Online]. Available: https://gco.iarc.fr/today/home. [Google Scholar]
2. X. Liu, L. Ma, L. Song, Y. Zhao, X. Zhao et al., “Recognizing common CT imaging signs of lung diseases through a new feature selection method based on fisher criterion and genetic optimization,” IEEE Journal of Biomedical and Health Informatics, vol. 19, no. 2, pp. 635–647, 2015. [Google Scholar]
3. P. Zhai, Y. Tao, H. Chen, T. Cai and J. Li, “Multi-task learning for lung nodule classification on chest CT,” IEEE Access, vol. 8, pp. 180317–180327, 2020. [Google Scholar]
4. G. van Tulder and M. de Bruijne, “Combining generative and discriminative representation learning for lung ct analysis with convolutional restricted boltzmann machines,” IEEE Transactions on Medical Imaging, vol. 35, no. 5, pp. 1262–1272, 2016. [Google Scholar]
5. Y. Chen, Y. Wang, F. Hu, L. Feng, T. Zhou et al., “LDNNET: Towards robust classification of lung nodule and cancer using lung dense neural network,” IEEE Access, vol. 9, pp. 50301–50320, 2021. [Google Scholar]
6. M. Anthimopoulos, S. Christodoulidis, L. Ebner, A. Christe and S. Mougiakakou, “Lung pattern classification for interstitial lung diseases using a deep convolutional neural network,” IEEE Transactions on Medical Imaging, vol. 35, no. 5, pp. 1207–1216, 2016. [Google Scholar]
7. P. Sahu, D. Yu, M. Dasari, F. Hou and H. Qin, “A lightweight multi-section CNN for lung nodule classification and malignancy estimation,” IEEE Journal of Biomedical and Health Informatics, vol. 23, no. 3, pp. 960–968, 2019. [Google Scholar]
8. M. Al-Shabi, H. K. Lee and M. Tan, “Gated-dilated networks for lung nodule classification in CT scans,” IEEE Access, vol. 7, pp. 178827–178838, 2019. [Google Scholar]
9. H. Han, L. Li, F. Han, B. Song, W. Moore et al., “Fast and adaptive detection of pulmonary nodules in thoracic CT images using a hierarchical vector quantization scheme,” IEEE Journal of Biomedical and Health Informatics, vol. 19, no. 2, pp. 648–659, 2015. [Google Scholar]
10. S. Christodoulidis, M. Anthimopoulos, L. Ebner, A. Christe and S. Mougiakakou, “Multisource transfer learning with convolutional neural networks for lung pattern analysis,” IEEE Journal of Biomedical and Health Informatics, vol. 21, no. 1, pp. 76–84, 2017. [Google Scholar]
11. I. Ali, M. Muzammil, I. U. Haq, A. A. Khaliq and S. Abdullah, “Efficient lung nodule classification using transferable texture convolutional neural network,” IEEE Access, vol. 8, pp. 175859–175870, 2020. [Google Scholar]
12. H. Cao, H. Liu, E. Song, G. Ma, X. Xu et al., “A Two-stage convolutional neural networks for lung nodule detection,” IEEE Journal of Biomedical and Health Informatics, vol. 24, no. 7, pp. 2006–2015, 2020. [Google Scholar]
13. S. Pang, Y. Zhang, M. Ding, X. Wang and X. Xie, “A deep model for lung cancer type identification by densely connected convolutional networks and adaptive boosting,” IEEE Access, vol. 8, pp. 4799–4805, 2020. [Google Scholar]
14. S. Bekhet, M. H. Alkinani, R. Tabares-Soto and M. Hassaballah, “An efficient method for COVID-19 detection using light weight convolutional neural network,” Computers, Materials & Continua, vol. 69, no. 2, pp. 2475–2491, 2021. [Google Scholar]
15. M. Ragab, H. A. Abdushkour, A. F. Nahhas and W. H. Aljedaibi, “Deer hunting optimization with deep learning model for lung cancer classification,” Computers, Materials & Continua, vol. 73, no. 1, pp. 533–546, 2022. [Google Scholar]
16. S. Anitha and T. R. Ganeshbabu, “An efficient method for the detection of oblique fissures from computed tomography images of lungs,” Journal of Medical Systems, vol. 43, no. 8, pp. 1–13, 2019. [Google Scholar]
17. M. P. A. Devi, T. Latha and C. H. Sulochana, “Iterative thresholding based image segmentation using 2D improved Otsu algorithm,” Global Conf. on Communication Technologies, Thuckalay, India, pp. 145–149, 2015. [Google Scholar]
18. H. Alam and S. Mohanan, “An efficient quality control system by machine learning for surface defects,” International Journal of Advances in Signal and Image Sciences, vol. 7, no. 2, pp. 40–48, 2021. [Google Scholar]
19. K. G. Kannan and T. R. Ganeshbabu, “Semi supervised generative adversarial network for automated glaucoma diagnosis with stacked discriminator models,” Journal of Medical Imaging and Health Informatics, vol. 11, no. 5, pp. 1334–1340, 2021. [Google Scholar]
20. M. A. Ramitha and N. Mohanasundaram, “Classification of pneumonia by modified deeply supervised ResNet and senet using chest x-ray images,” International Journal of Advances in Signal and Image Sciences, vol. 7, no. 1, pp. 30–37, 2021. [Google Scholar]
21. K. Clark, B. Vendt, K. Smith, J. Freymann, J. Kirby et al., “The cancer imaging archive (TCIAMaintaining and operating a public information repository,” Journal of Digital Imaging, vol. 26, no. 6, pp. 1045–1057, 2013. [Google Scholar]
22. S. G. Armato, G. McLennan, L. Bidaut, M. F. Mcitt-Gray, C. R. Meyer et al., “The lung image database consortium (LIDC) and image database resource initiative (IDRIA completed reference database of lung nodules on CT scans,” Medical Physics, vol. 38, no. 2, pp. 915–931, 2011. [Google Scholar]
Cite This Article
 Copyright © 2023 The Author(s). Published by Tech Science Press.
This work is licensed under a Creative Commons Attribution 4.0 International License , which permits unrestricted use, distribution, and reproduction in any medium, provided the original work is properly cited.
 Downloads
 Citation Tools