
 Submit a Paper
 Propose a Special lssue
 Open Access
ARTICLE

Women Entrepreneurship Index Prediction Model with Automated Statistical Analysis
Department of Management Studies, Easwari Engineering College, Ramapuram, 600089, India
* Corresponding Author: V. Saikumari. Email:
Intelligent Automation & Soft Computing 2023, 36(2), 1797-1810. https://doi.org/10.32604/iasc.2023.034038
Received 05 July 2022; Accepted 27 August 2022; Issue published 05 January 2023
 View Full Text
 Download PDF
Abstract
Recently, gender equality and women’s entrepreneurship have gained considerable attention in global economic development. Prior to the design of any policy interventions to increase women’s entrepreneurship, it is significant to comprehend the factors motivating women to become entrepreneurs. The non-understanding of the factors can result in the endurance of low living standards and the design of expensive and ineffectual policies. But female involvement in entrepreneurship becomes higher in developing economies compared to developed economies. Women Entrepreneurship Index (WEI) plays a vital role in determining the factors that enable the flourishment of high potential female entrepreneurs which enhances economic welfare and contributes to the economic and social fabric of society. Therefore, it is needed to design an automated and accurate WEI prediction model to improve women’s entrepreneurship. In this view, this article develops an automated statistical analysis enabled WEI predictive (ASA-WEIP) model. The proposed ASA-WEIP technique aims to effectually determine the WEI. The proposed ASA-WEIP technique encompasses a series of sub-processes such as pre-processing, WEI prediction, and parameter optimization. For the prediction of WEI, the ASA-WEIP technique makes use of the Deep Belief Network (DBN) model, and the parameter optimization process takes place using Squirrel Search Algorithm (SSA). The performance validation of the ASA-WEIP technique was executed using the benchmark dataset from the Kaggle repository. The experimental outcomes stated the better outcomes of the ASA-WEIP technique over the other existing techniques.Keywords
Entrepreneur improves the economy and people’s lives by creating jobs, exchanging ideas globally, creating technology that improves efficiency, and developing new solutions to problems. Several conditions that help entrepreneurs also help the economy as a whole provide even broader gains from supportive entrepreneurship [1]. Women entrepreneurs might be determined as women or a set of women that operate, initiate, and organize a business enterprise. Women are likely to adopt, innovate, or imitate an economic activity to be named women entrepreneurs. Women entrepreneur plays a significant role in increasing their economy [2]. Once a country doesn’t accomplish its maximum potential, the economy suffers. Fewer ‘higher potential’ female entrepreneurs result in less innovation, fewer jobs created, less export potential, and fewer ideas being realized [3,4]. By using entrepreneurial activity, higher-potential female entrepreneur increases their economic welfare, and also enhance the social fabric and economy of a society with their innovative products, job creation, services, cross-border trade, and processes. Now, the role of women’s entrepreneurship was identified in the procedure of economic growth around the world; thus, it should be promoted. Beforehand developing any policy intervention for boosting women’s entrepreneurship [5], it is significant to understand the factor driving women to be an entrepreneur. Fig. 1 showcases the statistics of Woman Entrepreneurs.
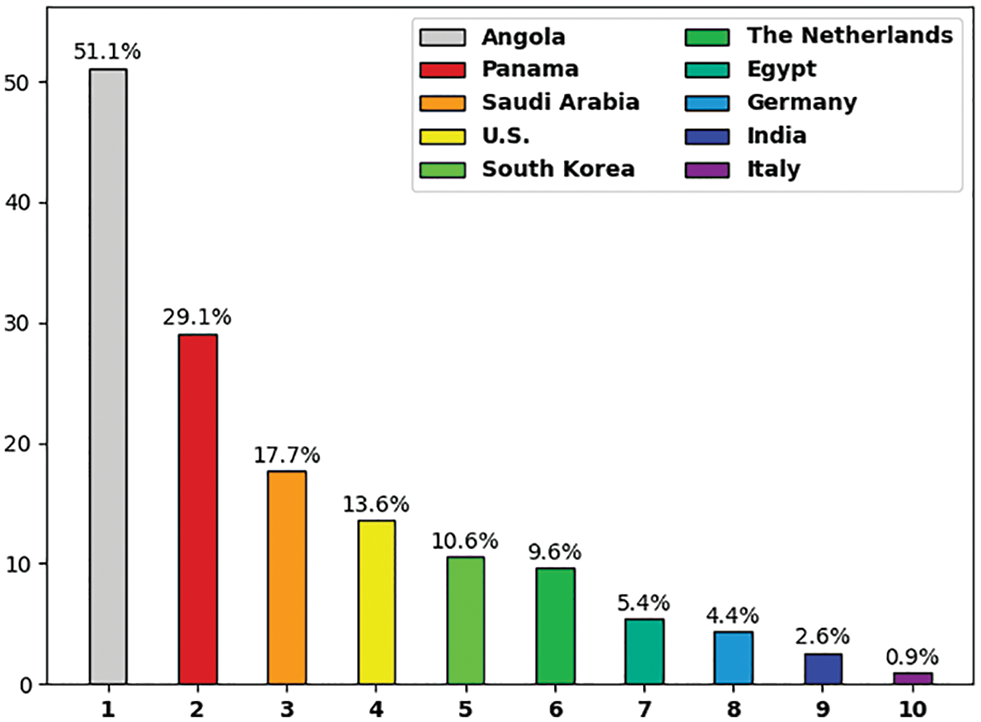
Figure 1: Statistics of Woman Entrepreneurs
The Female Entrepreneurship Index (FEI) searches for identifying the factor that enables the flourishing of higher potential female entrepreneurs—women who operate and own businesses that are export-oriented, innovative, and market expanding. With entrepreneurial activity, high-potential female entrepreneur improves their economic development and contributed to the social fabric and economy of society. A statistical test is utilized to make decisions. To implement analysis using the median, we must utilize a non-parametric test [6]. The non-parametric test is a distribution-independent test whereas the parametric test assumes that the data is a normal distribution. Parametric Test takes the mean into account whereas the Non-Parametric Test considered the median/rank to make a decision [7]. When the information doesn’t have the conventional Gaussian distribution, we should resort to the non-parametric version of the significance test. This test operates in the same way; however, they are distribution-free and require that real-valued data be initially converted into rank data beforehand the test is conducted [8]. The study presents well-developed economies, however, studies on female entrepreneurship in developing markets are scarce. Entrepreneurship is important to drive economic development, and also it is important to shedding light on the development of business by the female entrepreneur for highlighting the values that female entrepreneur brings to enhance further growth and global societies [9]. Particularly in developing economies, it is the major contributing factor to the economy and social progress, also it is an important driver for opportunities for employment and industrial competitiveness.
This article develops an automated statistical analysis-enabled WEI predictive (ASA-WEIP) model. The proposed ASA-WEIP technique mainly intends to determine the WEI. The proposed ASA-WEIP technique includes a sequence of sub-processes like pre-processing, WEI prediction, and parameter optimization. In order to predict WEI, the ASA-WEIP technique utilizes a deep belief network (DBN) model and the parameter optimization process is performed by a squirrel search algorithm (SSA). The performance validation of the ASA-WEIP technique is carried out using the benchmark dataset from the Kaggle repository.
In Etim et al. [10], an overall amount of fifty targeted female entrepreneurs in Uyo metropolis, Nigeria, have been purposefully sampled for taking part in our work. Inferential and Descriptive statistics have been adapted for interpreting the essential information. Agarwala et al. [11] highlight the current effort of governments toward presenting new financial systems to help entrepreneurship amongst women that empower them. MUDRA was the novel inventiveness towards offering financial support to women from India without some security.
Ribeiro et al. [12] explore that the entrepreneurship orientation (EO)- nexus is intermediated by the network firm established with resource acquisition, government suppliers, and agencies. Zhu et al. [13] compare women’s entrepreneurship in China and Vietnam by exploring the problem, motivation, and success factors associated with women-owned businesses.
Anggadwita et al. [14] analyze the effect of social perceptions, entrepreneurial orientation, and socio-cultural environment on women’s entrepreneurial intention. The structural equation modeling method is utilized as an analytical method including 400 women entrepreneurs in micro small and medium-sized enterprises (MSME) in Indonesia. The outcomes show that the social perceptions and socio-cultural environment have significant and positive effects on entrepreneurial orientation. Bouzari et al. [15] purposes for examining the effects of online social media on women’s entrepreneurship in comparative research. The statistical population of current research comprises women entrepreneurs active in the domain of online business in Iran and Hungary. ANOVA test has been utilized for examining the parameter of online social networks in distinct environments.
Ingalagi et al. [16] discuss the factors influencing and their impact on satisfaction and firm performance. The presented method and hypothesis were tested by the information collected from beauty parlors, boutiques, retail shops, and carpet manufacturers in Karnataka, India. Data analysis has been performed by bivariate, multivariate, and univariate technologies. In Structural Equation Modelling (SEM), paths have been made to evaluate the cause-and-effect relationships among distinct factors are psychological, social, resource factors, and financial and entrepreneurial satisfaction and performance. Wu et al. [17], proposed a competitive DBN for learning features with more discriminatory data from labeled and unlabeled samples. The presented method comprises four phases: a typical Restricted Boltzmann Machine (RBM) is pre-trained with a massive amount of unlabeled information for initializing its parameter; the hidden unit is grouped based on the category which offers a clustering method for competitive learning; back-propagation and competitive training approaches are utilized for updating the parameter to achieve the clustering task; and apply supervised fine-tuning and layer-wise training, a Deep Neural Networks (DNN) is constructed to attain feature.
In this study, a new ASA-WEIP approach was developed for the prediction of WEI. The proposed model follows a three-stage process. Initially, the input data is pre-processed for the conversion of original data into a useful format. Secondly, the DBN model is applied for the effectual prediction of WEI. Thirdly, the SSA has been utilized to fine-tune the hyperparameters of the DBN model. The detailed work of each module is offered in the succeeding sections.
Primarily, the input data is pre-processed to transform the actual input data into a useful format. The Z-score is computed utilizing the standard deviation (SD) and the arithmetic mean of provided WS data has often been utilized as a score normalization approach. It can be predicted that this normalized method is achieving well whether prior data on the average score and score differences of the matcher. The normalizing scores are provided as:
In which,
3.2 WEI Prediction Using DBN Model
At the time of WEI prediction, the DBN model receives the pre-processed data and thereby predicts the values of WEI. DBN is a multilayer probabilistic generation method that is learned for extracting a deep hierarchical depiction of trained data. The DBN is collected from many layers of RBM and classified additional to the topmost layer [18]. The RBM has an energy-based generative method which comprises a layer of visible nodes
As stated by the energy function
In which, Z refers to the partition function that is the sum of entire feasible pairs of hidden and visible layers.
The probability allocated to visible vector v has been provided by adding feasible binary hidden vector
When there are no direct links among the similar layers in RBM, this hidden unit is independently offered to the visible unit [19]. Thus, the visible vector v, the conditional likelihood of hidden vector h is represented as follows:
Likewise, in the hidden layer h, the conditional likelihood of visible layer v is represented as follows:
In the visible layer v, the activation state of all the hidden units is conditionally independent. Now,
Whereas
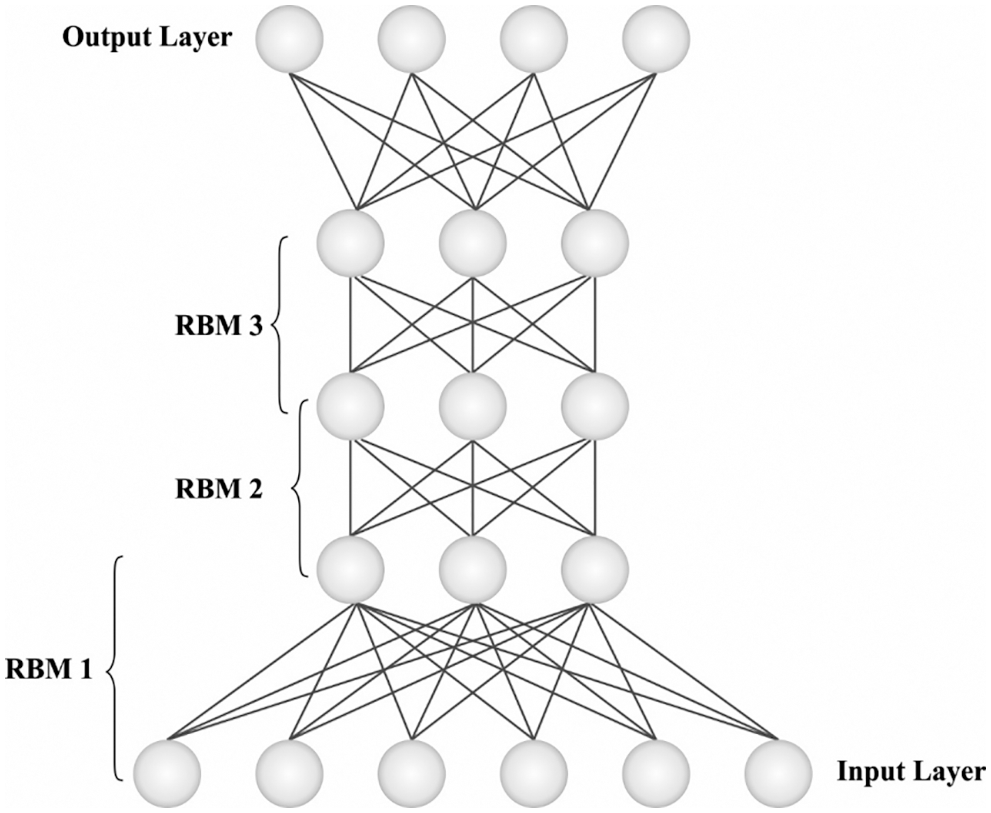
Figure 2: DBN structure
Therefore, the activation possibility of the visible layer is conditionally independent once given a hidden layer
When the RBM was trained, the network energy is reduced, and the possibility in Eq. (5) is maximized. For maximizing the
Whereas E represents the expectation operator. CD-k approach approximates the expectancy in Eq. (10) by constraint k (often
Afterward, an RBM was trained; another RBM is stacked on the topmost one. Hence, various layers of RBM are stacked for extracting distinct features that denote complicated structures in the information. Once the DBN has been trained, the network parameter
3.3 Parameter Optimization Using SSA
For boosting the predictive outcomes of the DBN technique, the SSA is utilized and thereby enhances the overall performance. The hunting process begins if flying squirrels start scavenging. Simultaneously, it can alter its regions and examine several areas of wood. While the climatic states are appropriately hot, it can meet its daily vitality requires further quickly on eating routine of oak seeds tree (OST) available from bounty and therefore, it is devouring OST rapidly afterward determining them. The ability of hickory nuts is for helping from maintaining its vitality prerequisites from harsh climates reduce the costly search excursion and enhance the probability of endurance [20–24]. Concerning the finishing of wintertime, squirrels again developed a dynamic. It can be a monotonous process and infrastructure for the establishment of SSA. Fig. 3 depicts the flowchart of SSA. The purpose of employing SSA in optimizing the parameter is its efficiency in determining solutions for the unimodal, multimodal optimization functions.
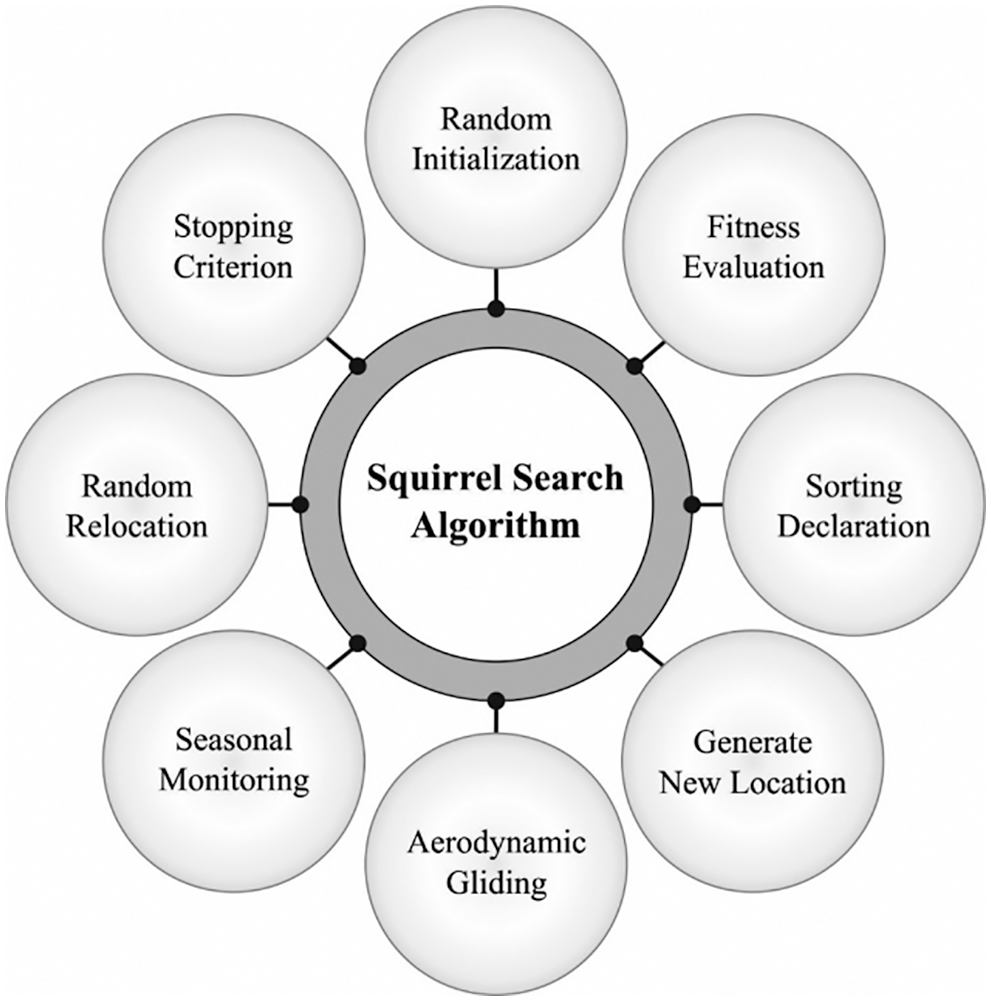
Figure 3: Flowchart of SSA
Considering the count of squirrels is N, and the upper as well as lower limits of detection space, are
In which
• Squirrels placed at HT
• Squirrels located in ordinary trees
• Squirrels located at OST
The squirrel refreshes its conditions by skimming to HT or OST as follows:
In which,
The drag power and lift power are evaluated as:
To start all generations, the SSA requires that the whole populace is in winter which represents that the places of every squirrel were upgraded [22–24]. At this point, once the squirrel is refreshed, anyway the season, altered has been decided by a subsequent equation:
If
The levy is the arbitrary walk method whose progression observes with Levy appropriation and is demonstrated as:
where
The proposed ASA-WEIP model is simulated using the benchmark Women Entrepreneurs Analysis dataset from the Kaggle repository [25]. The dataset holds four numeric variables such as WEI, entrepreneurship index, inflation ratio, and female labor force participation rate. Next, the list of categorical variables is country, level of development, European Union Membership, and Currency. Fig. 4 illustrates the correlation matrix of the ASA-WEIP technique.
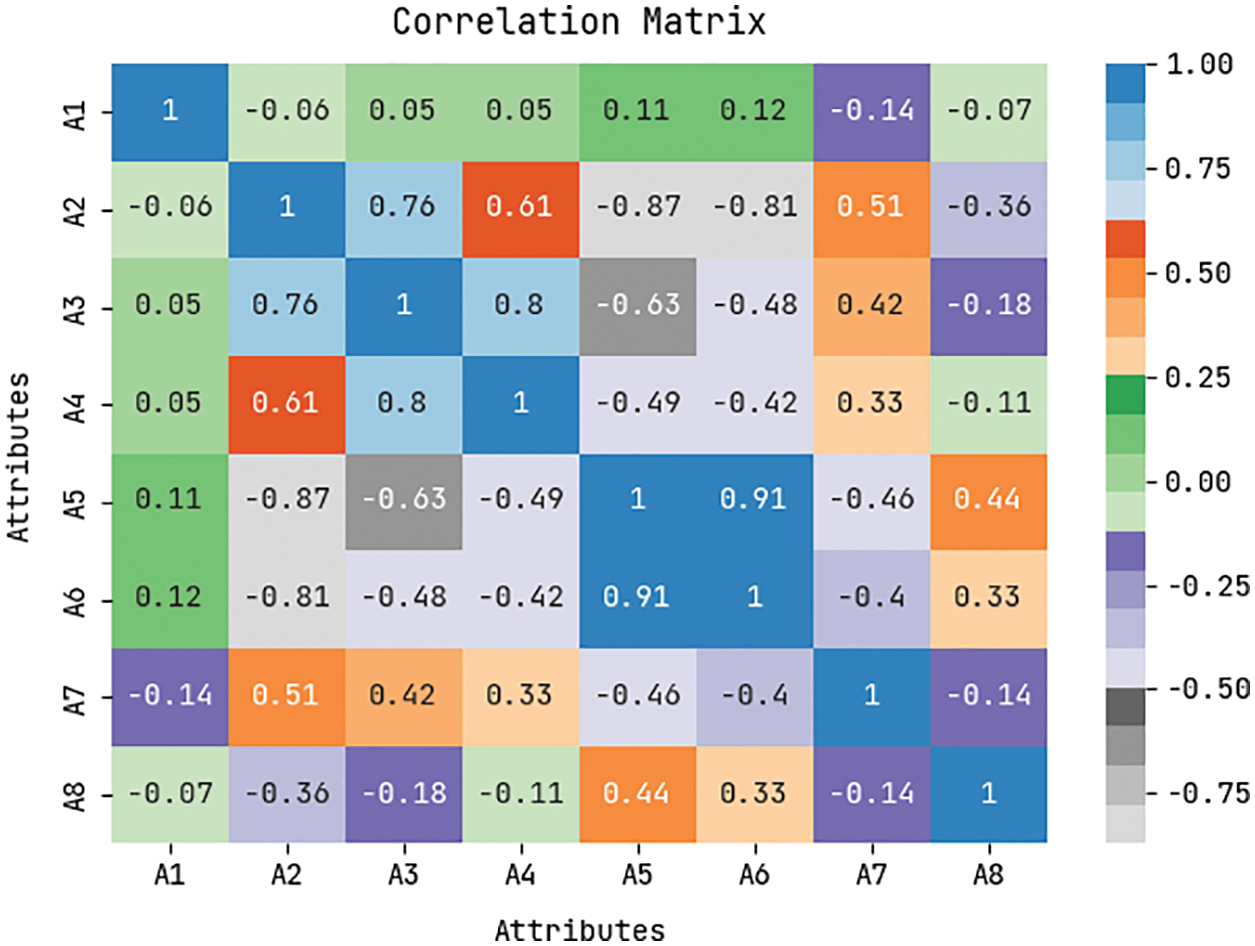
Figure 4: Correlation matrix of ASA-WEIP technique
Fig. 5 shows the actual and predicted WEI values of the ASA-WEIP model under run-1. The figure demonstrated that the ASA-WEIP model has resulted in effective outcomes with closer values of actual and predicted outcomes. Besides, it is noticed that the variance amongst the actual and predicted values is found to be minimal.
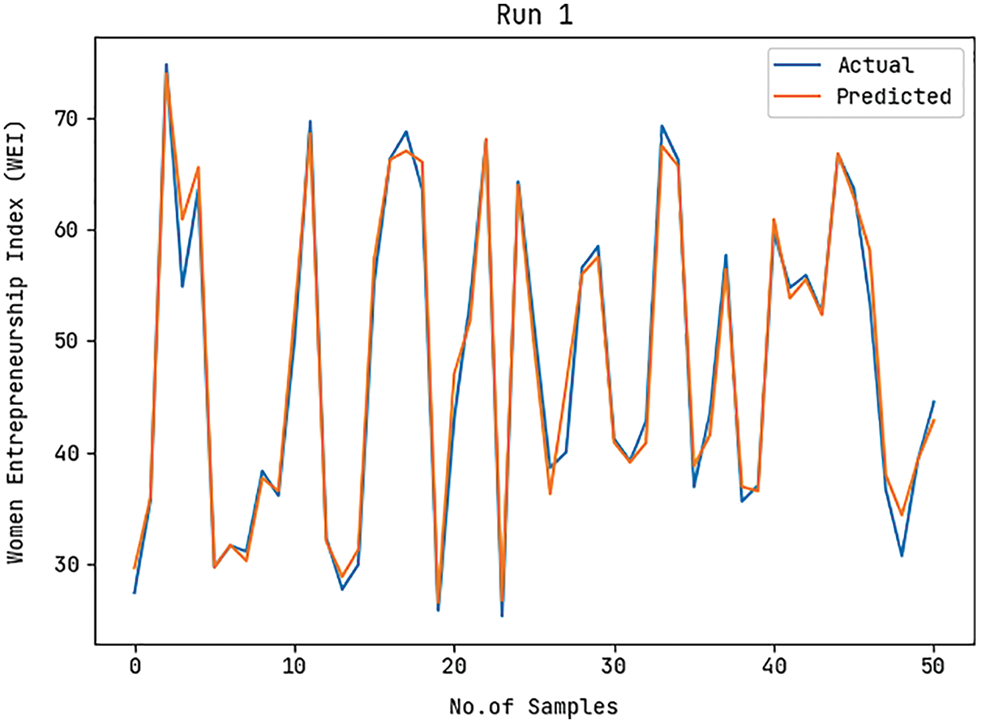
Figure 5: Actual and Prediction WEI analysis of ASA-WEIP model under run-1
Fig. 6 illustrates the actual and predicted WEI values of the ASA-WEIP approach under run-2. The figure demonstrated that the ASA-WEIP model has resulted in effective outcomes with closer values of actual and predicted outcomes. Moreover, it is noticed that the difference among the actual and predicted values is found to be lower.
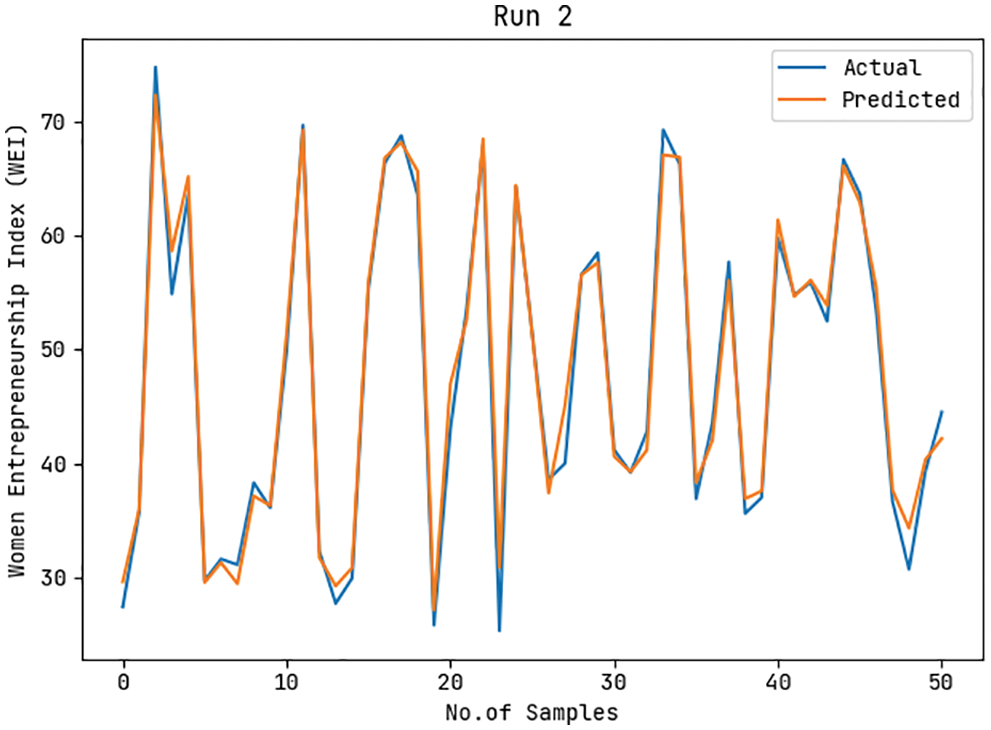
Figure 6: Actual and Prediction WEI analysis of ASA-WEIP model under run-2
Fig. 7 displays the actual and predicted WEI values of the ASA-WEIP method under run-3. The figure r that the ASA-WEIP model has resulted in effective outcomes with closer values of actual and predicted outcomes. In addition, it can be noticed that the difference between the actual and predicted values is found to be minimal.
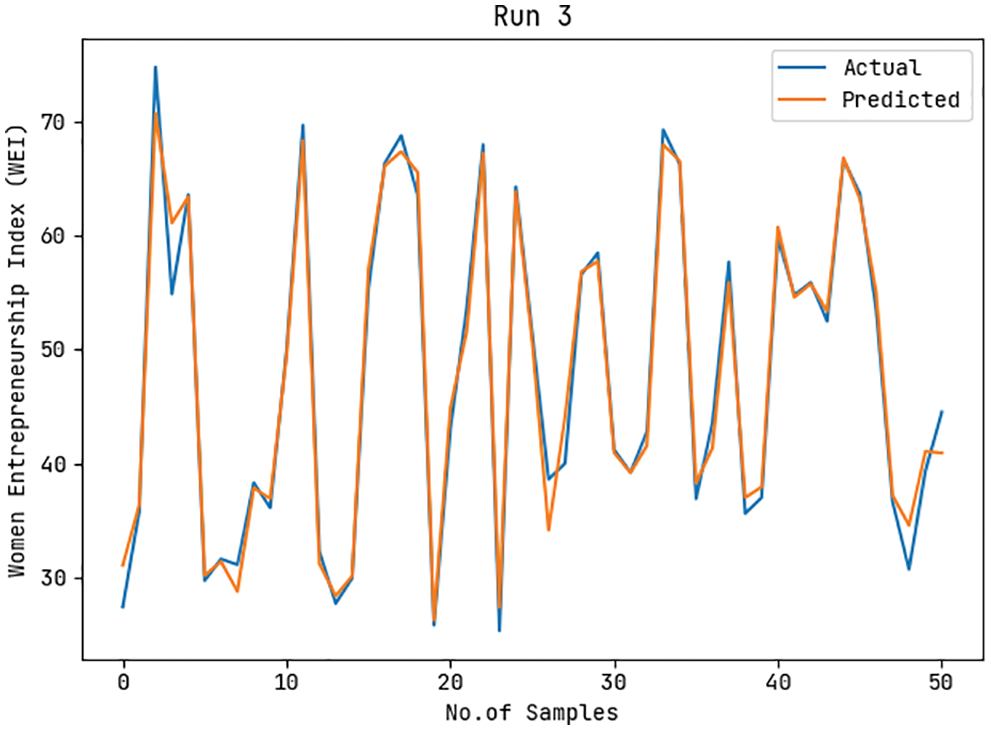
Figure 7: Actual and Prediction WEI analysis of ASA-WEIP model under run-3
Fig. 8 demonstrates the actual and predicted WEI values of the ASA-WEIP approach under run-4. The figure exposed that the ASA-WEIP model has resulted in effective outcomes with closer values of actual and predicted outcomes. Besides, it can be noticed that the difference amongst the actual and predicted values is found to be minimal.
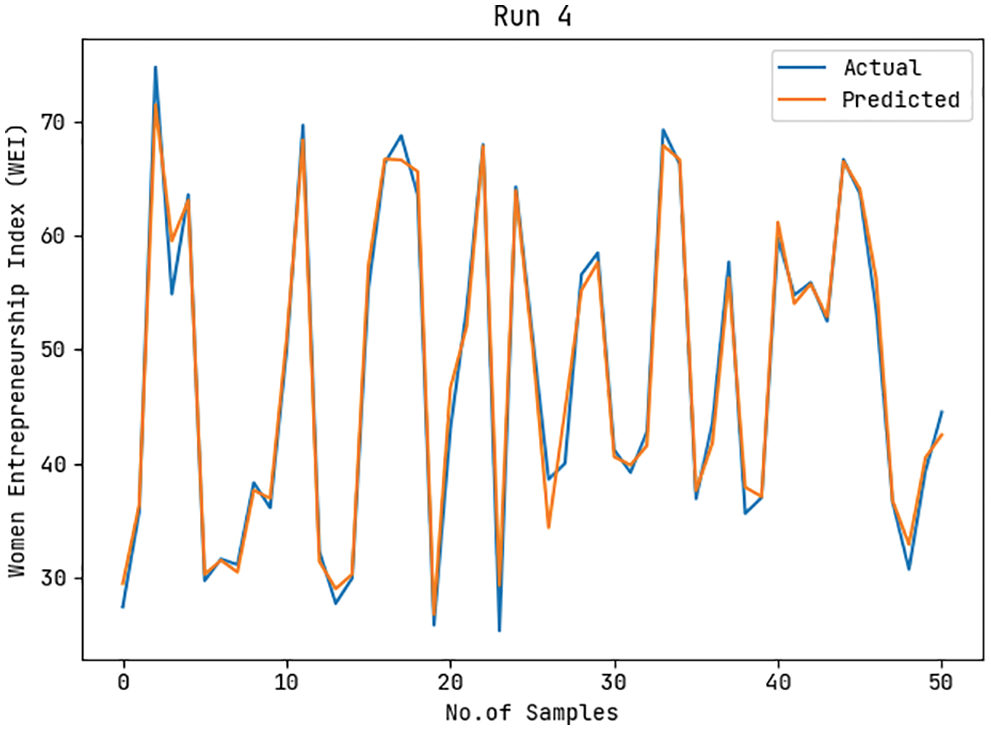
Figure 8: Actual and Prediction WEI analysis of ASA-WEIP model under run-4
Fig. 9 depicts the actual and predicted WEI values of the ASA-WEIP technique under run-5. The figure demonstrated that the ASA-WEIP model has resulted in effective outcomes with closer values of actual and predicted outcomes. Also, it can be noticed that the difference among the actual and predicted values is found that minimal.
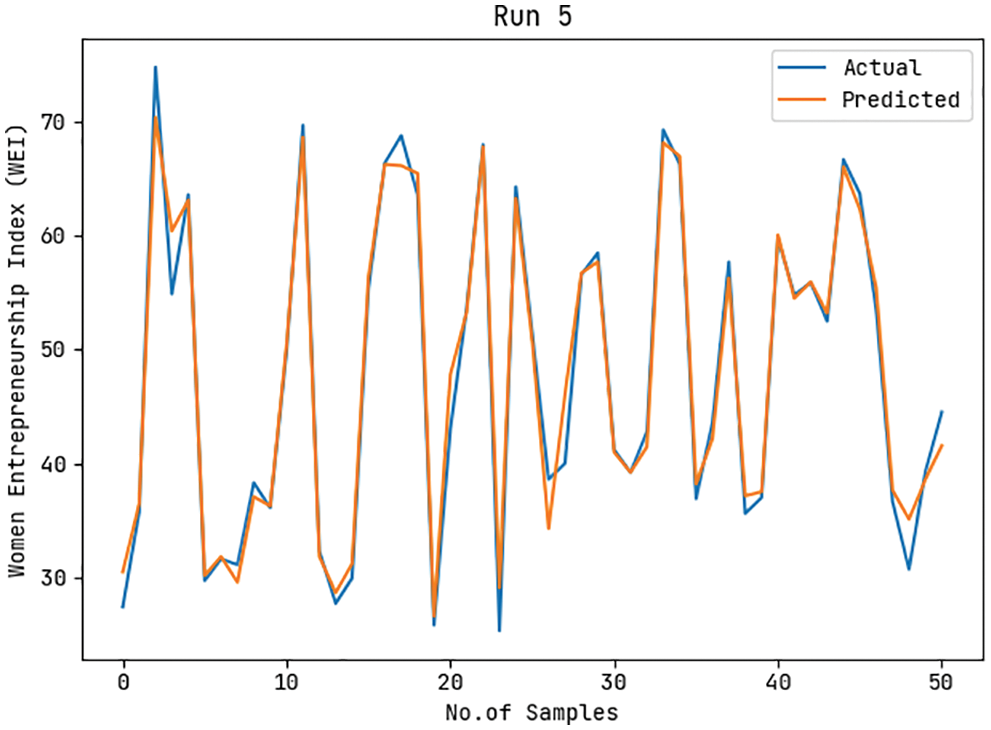
Figure 9: Actual and Prediction WEI analysis of ASA-WEIP model under run-5
Table 1 and Fig. 10 provide a brief comparative result analysis of the ASA-WEIP technique with existing algorithms under distinct runs. The experimental values represented that the ASA-WEIP technique has resulted in effectual results with minimal values of MSE and RMSE. For instance, with run-1, the ASA-WEIP system has provided decreased MSE of 1.09 whereas the LR, RR, SVM, and ELM models have accomplished increased MSE of 2.95, 2.41, 1.97, and 1.53 respectively. Also, with run-2, the ASA-WEIP technique has provided decreased MSE of 0.64 whereas the LR, RR, SVM, and ELM techniques have accomplished increased MSE of 2.58, 2.14, 1.60, and 1.17 correspondingly. Also, with run-3, the ASA-WEIP approach has provided decreased MSE of 0.74 whereas the LR, RR, SVM, and ELM approaches have accomplished increased MSE of 2.76, 2.26, 1.76, and 1.27 correspondingly. Moreover, with run-4, the ASA-WEIP technique has provided decreased MSE of 0.69 whereas the LR, RR, SVM, and ELM models have accomplished higher MSE of 2.75, 2.25, 1.66, and 1.25 respectively. Furthermore, with run-5, the ASA-WEIP technique has provided a reduced MSE of 0.69 whereas the LR, RR, SVM, and ELM methodologies have accomplished improved MSE of 2.86, 2.29, 1.76, and 1.23 correspondingly.
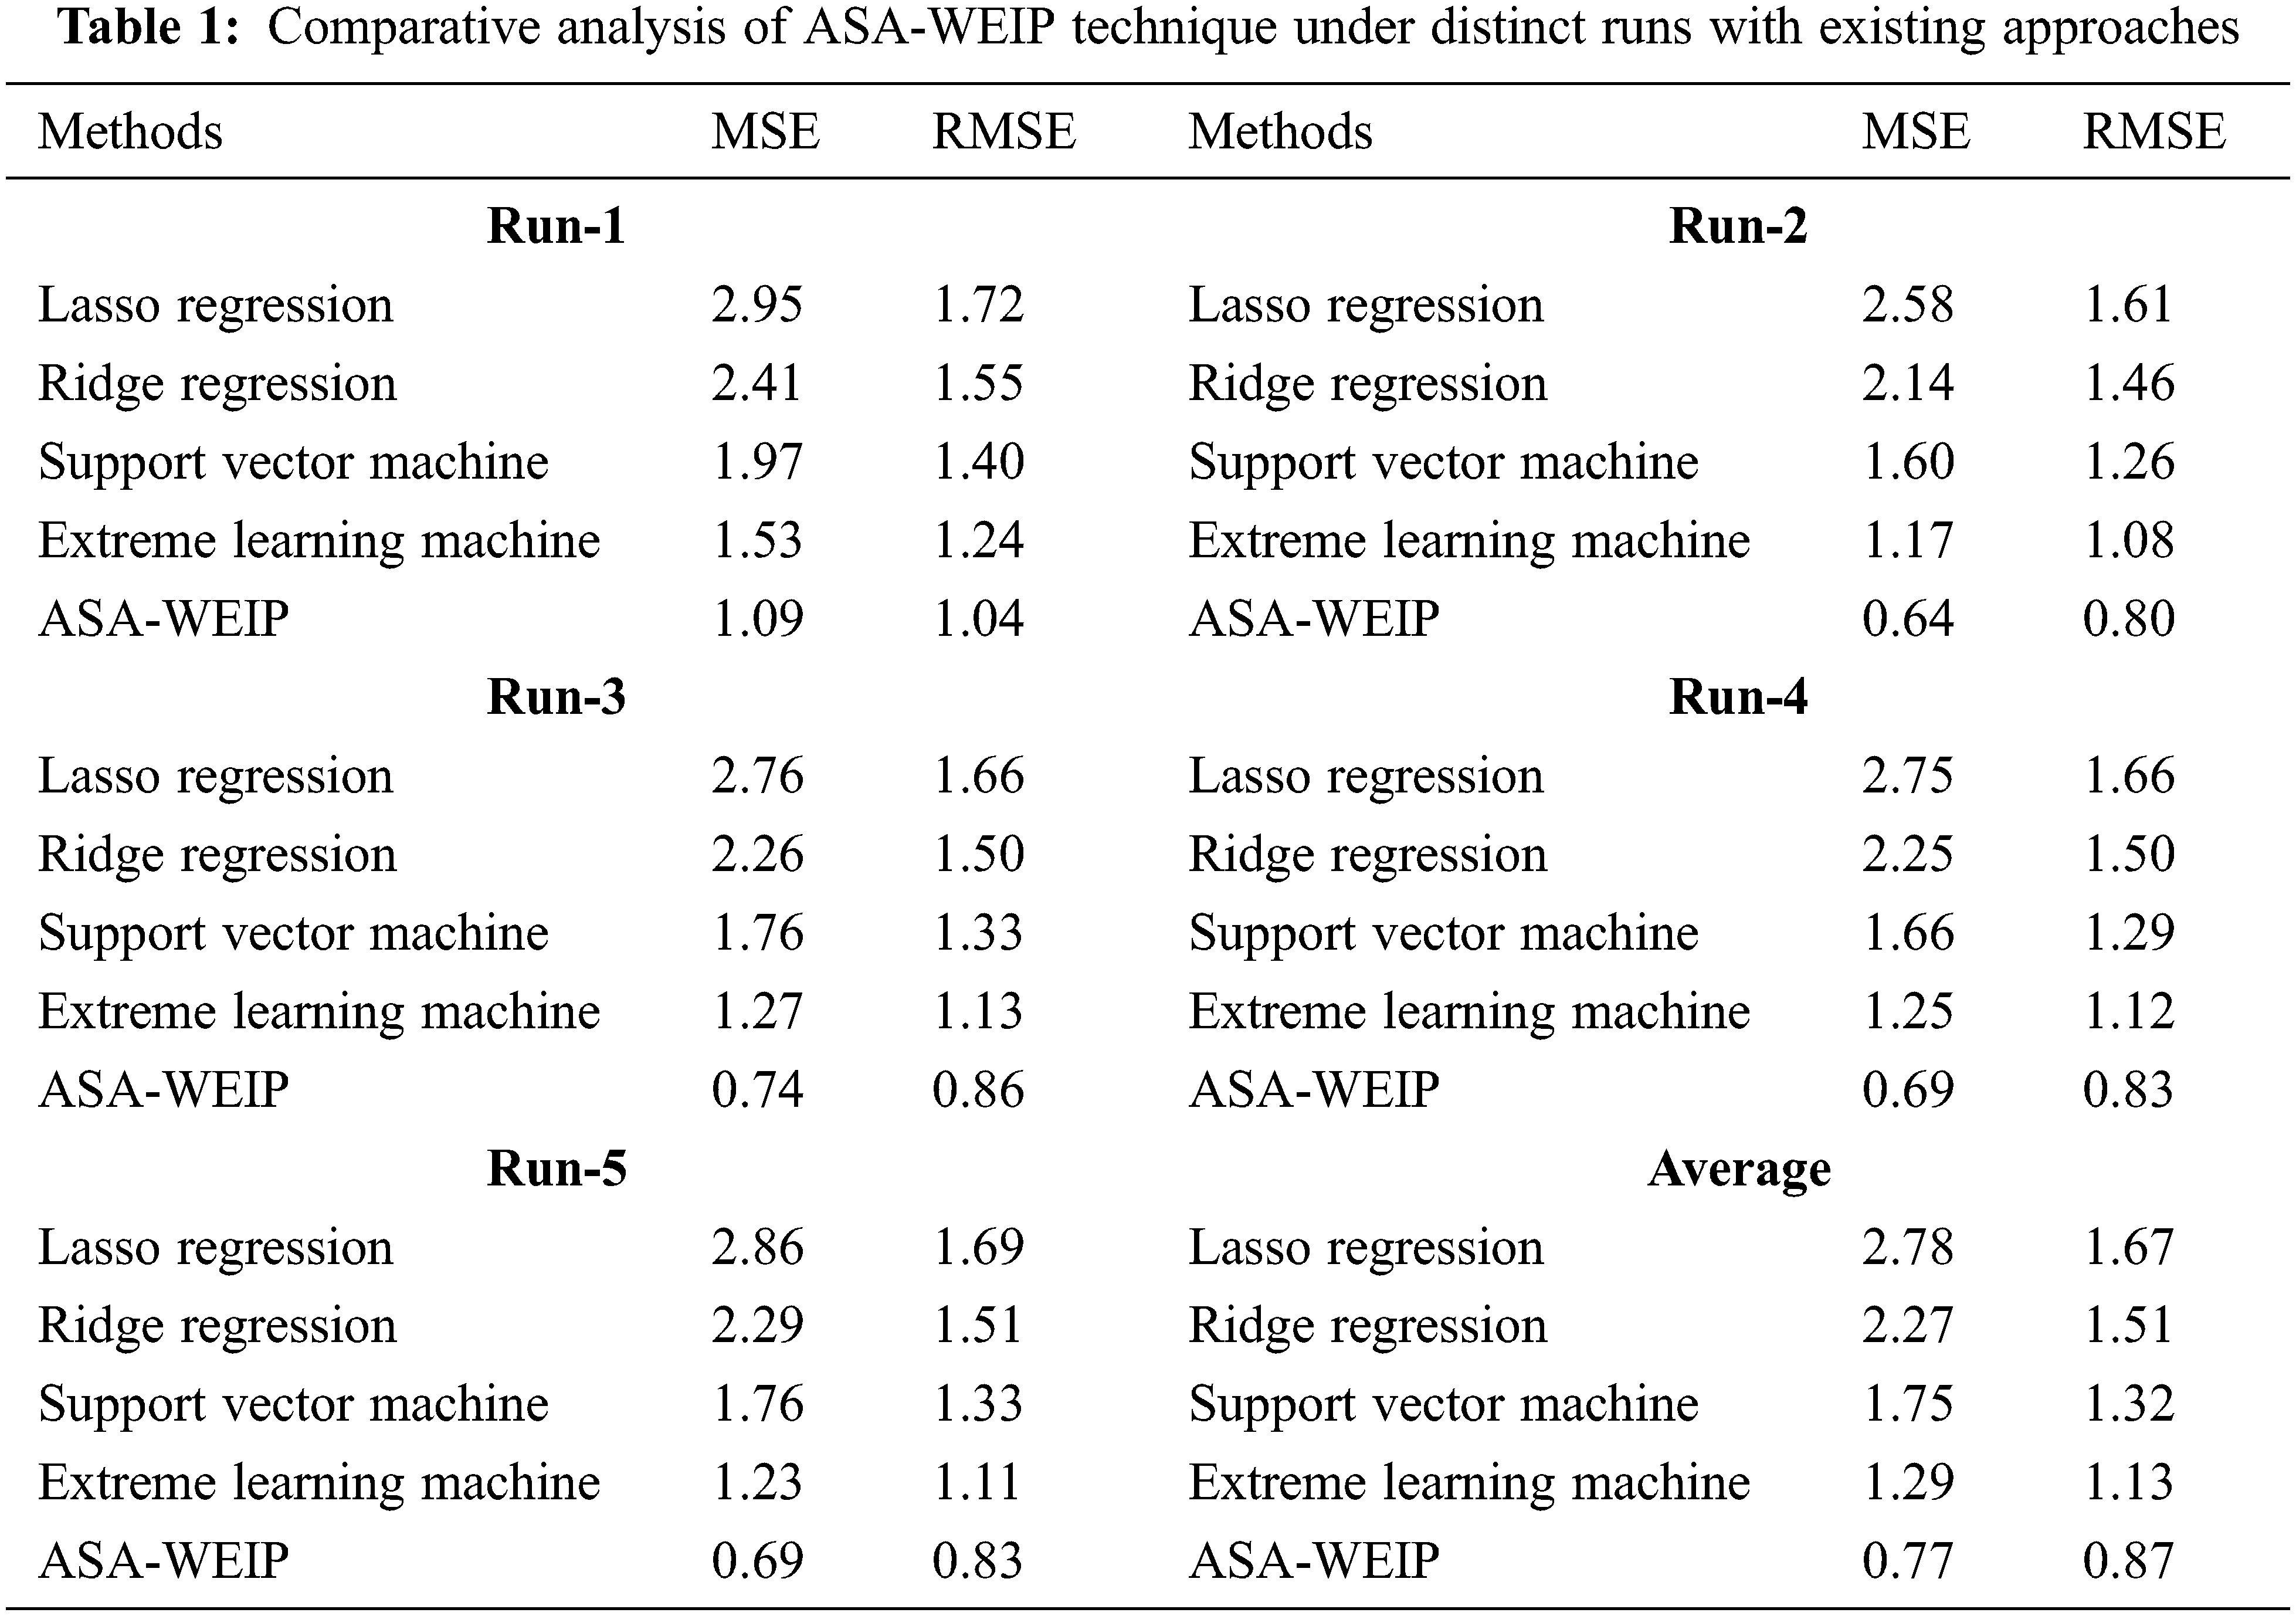
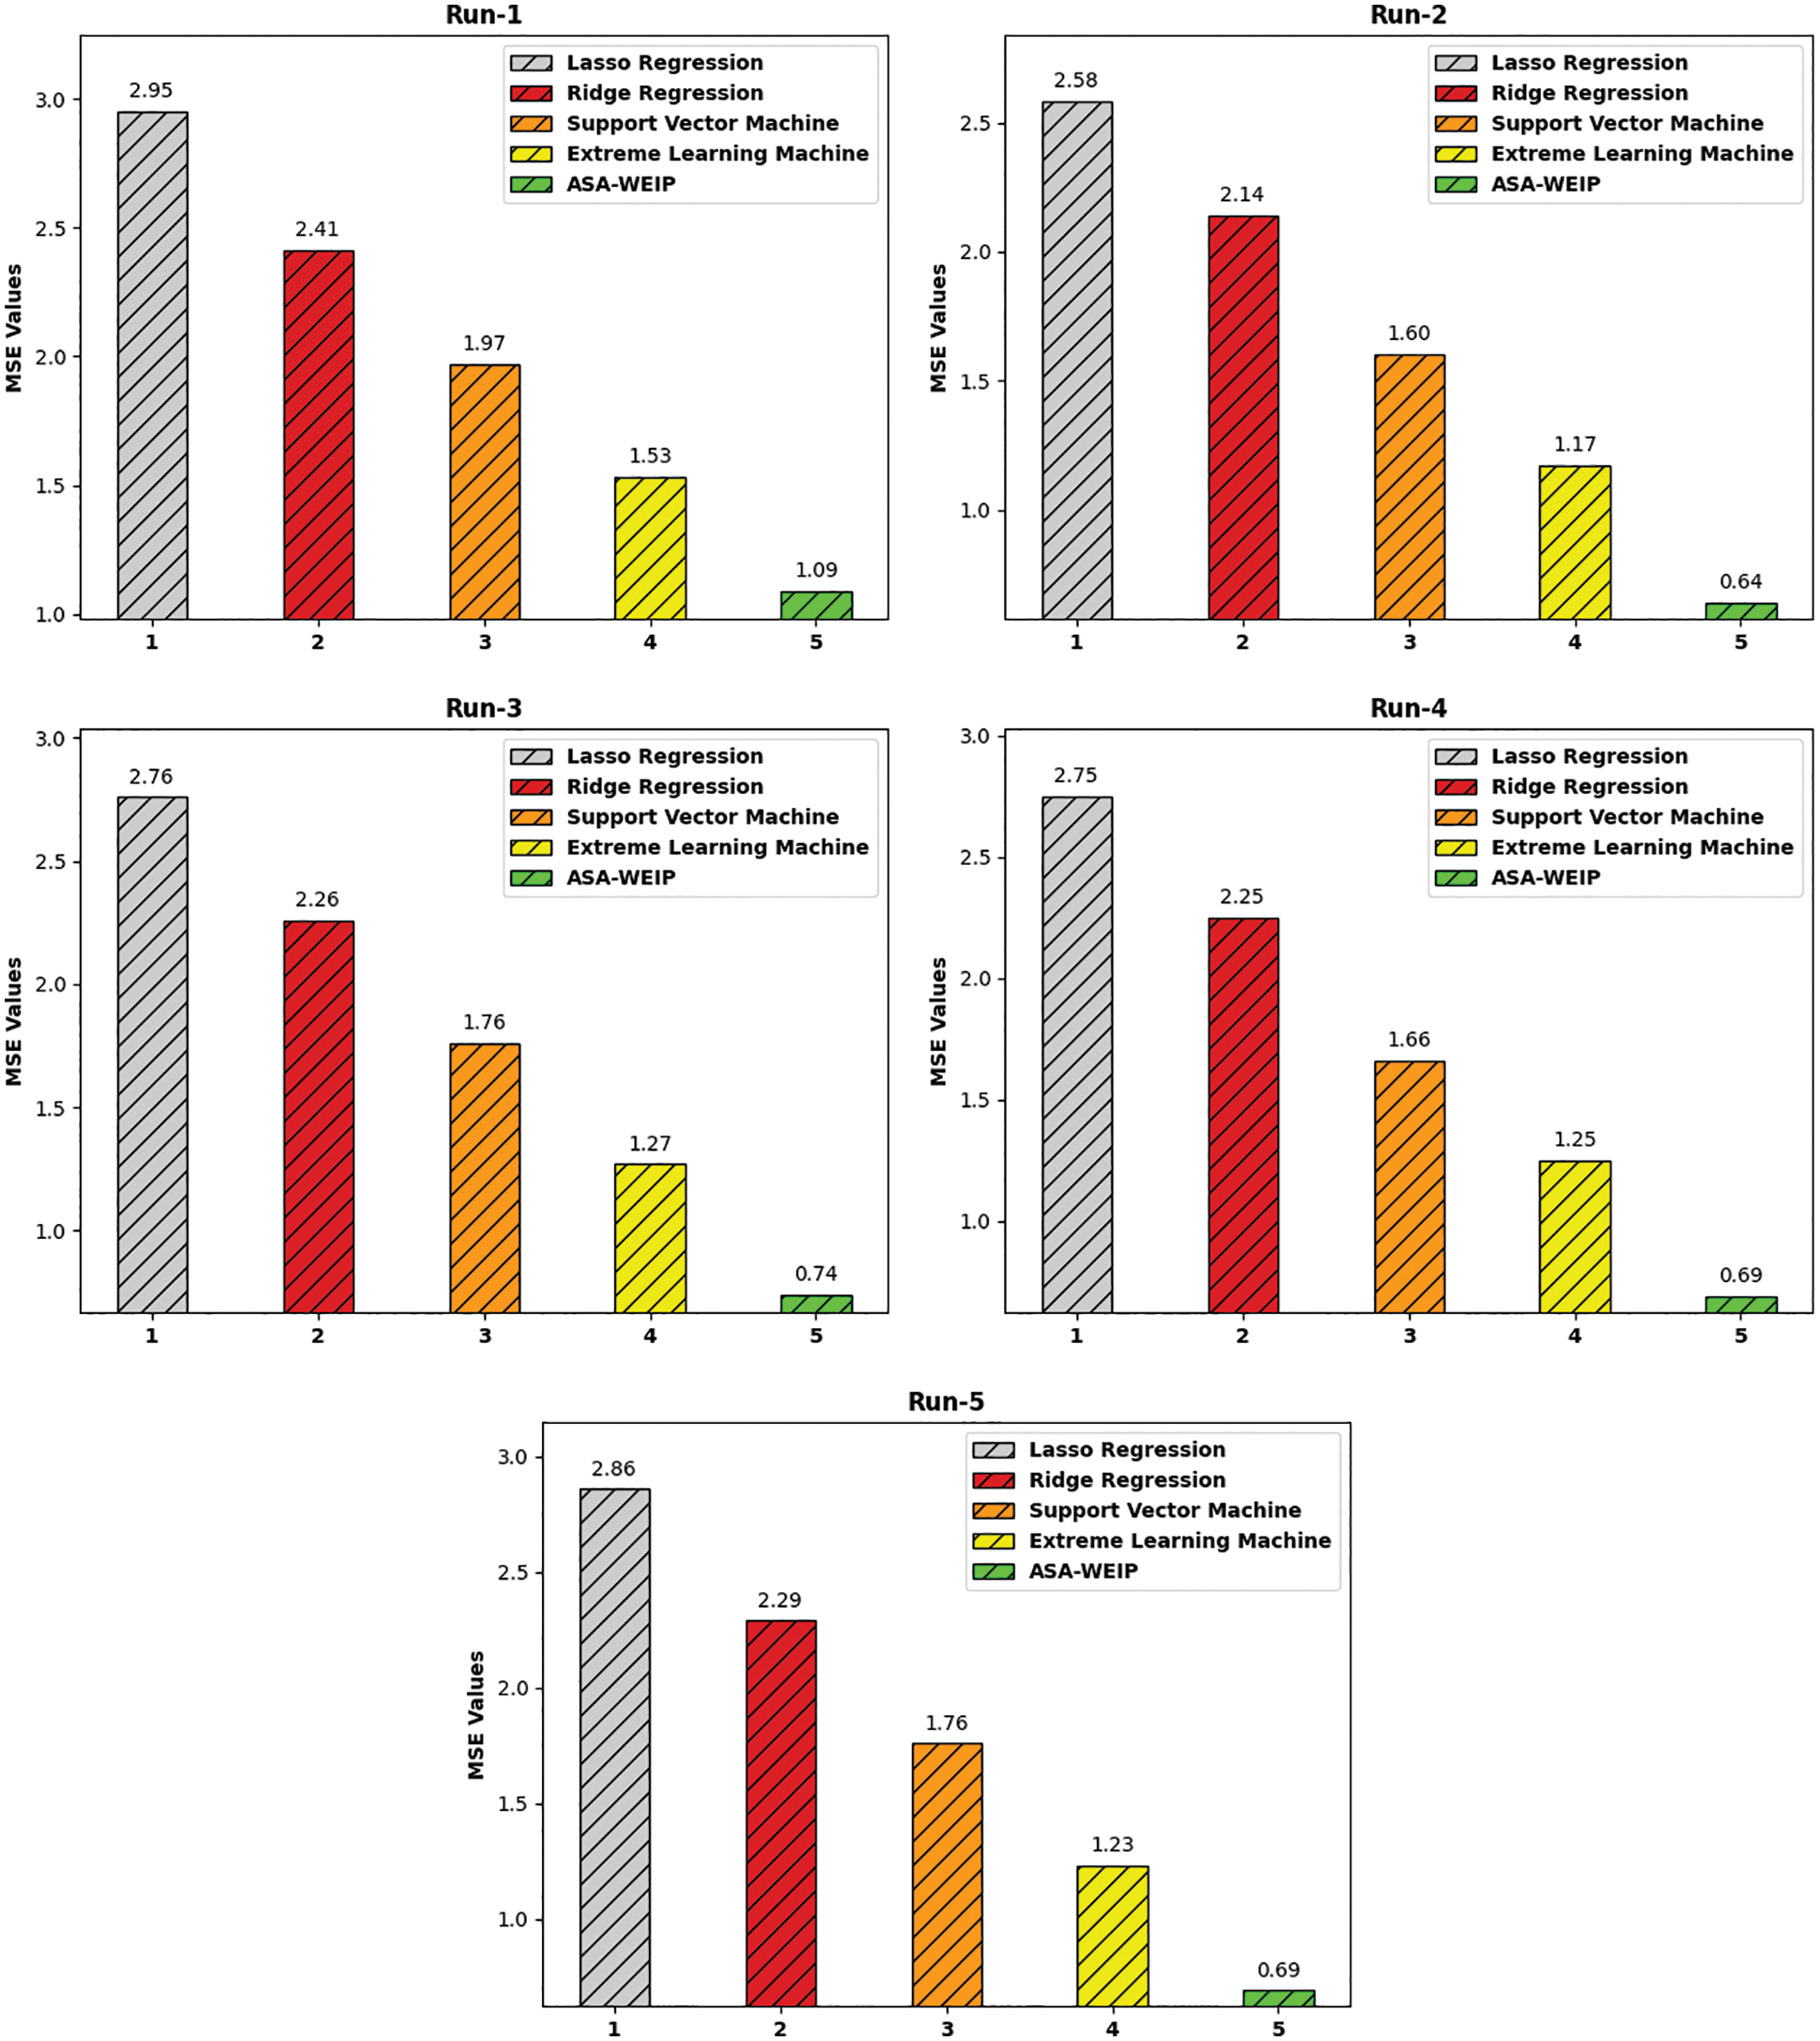
Figure 10: MSE analysis of ASA-WEIP technique with different runs
Fig. 11 demonstrates the average result analysis of the ASA-WEIP system with recent models. The figure shows that the ASA-WEIP technique has resulted in effective outcomes over the other methods. On measuring the results in terms of MSE, the ASA-WEIP technique has resulted in to lower MSE of 0.77 whereas the LR, RR, SVM, and ELM models have reached a higher MSE of 2.78, 2.27, 1.75, and 1.29 respectively.
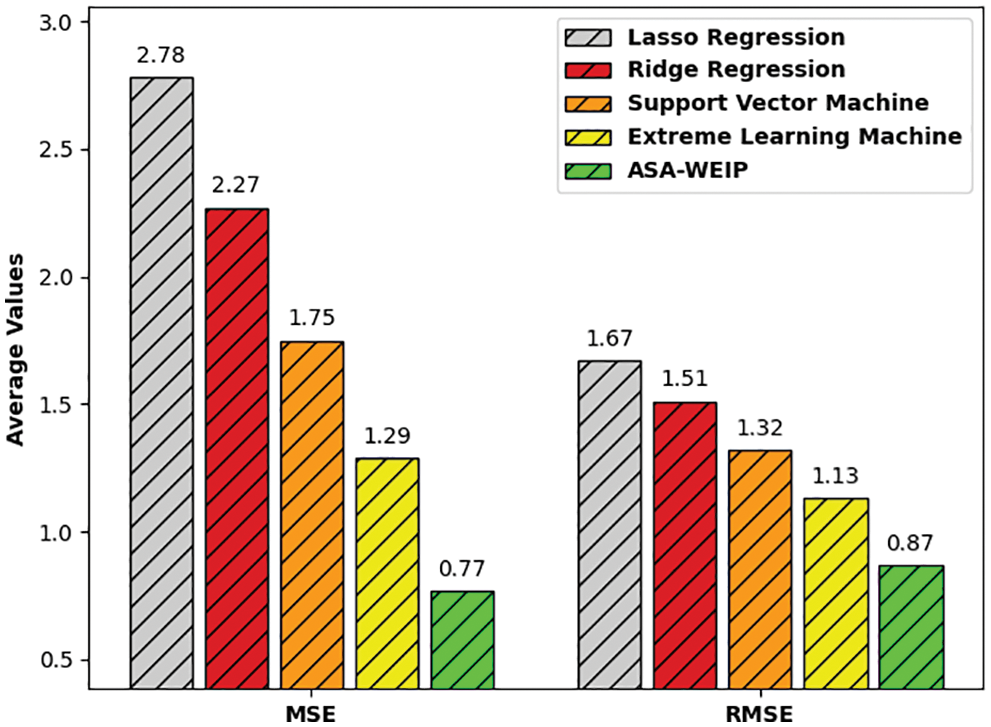
Figure 11: Average MSE and RMSE analysis ASA-WEIP technique with existing approaches
Moreover, in measuring the results with respect to RMSE, the ASA-WEIP technique has resulted in a minimum MSE of 0.87 whereas the LR, RR, SVM, and ELM methods have reached superior RMSE of 1.67, 1.51, 1.32, and 1.13 correspondingly. From the above-mentioned tables and figures, it is apparent that the ASA-WEIP technique has resulted in maximum performance over the other methods.
In this study, a novel ASA-WEIP technique was developed for the prediction of WEI. The proposed model follows a three-stage process. Initially, the input data is pre-processed for the conversion of original data into a useful format. The DBN model is applied for the effectual prediction of WEI. Next, the SSA has been utilized to fine-tune the hyperparameters of the DBN model. The performance validation of the ASA-WEIP technique was executed using the benchmark dataset from the Kaggle repository. The experimental outcomes stated the better outcomes of the ASA-WEIP technique over the other existing techniques. Therefore, the ASA-WEIP approach was employed as an effectual tool for managing gender equality and women entrepreneurship management. In the future, the proposed model was extended to the consumption of data from the real-time environment.
Funding Statement: The authors received no specific funding for this study.
Conflicts of Interest: The authors declare that they have no conflicts of interest to report regarding the present study.
References
1. S. Aparicio, D. Audretsch, M. Noguera and D. Urbano, “Can female entrepreneurs boost social mobility in developing countries? An institutional analysis,” Technological Forecasting and Social Change, vol. 175, pp. 121401, 2022. [Google Scholar]
2. D. Prabakaran and H. Sathyapriya, “A review on methodologies and performance analysis of device identity masking techniques,” International Journal of Scientific & Technology Research, vol. 8, no. 12, pp. 2018–2022, 2019. [Google Scholar]
3. M. Adamus, V. Čavojová and J. Šrol, “The impact of stereotyped perceptions of entrepreneurship and gender-role orientation on Slovak women’s entrepreneurial intentions,” Gender in Management: An International Journal, vol. 36, no. 6, pp. 745–761, 2021. [Google Scholar]
4. G. Baharuddin and A. Ab Rahman, “What is the most effective antecedent for developing entrepreneurial intention among Muslim youth in Indonesia?,” Entrepreneurial Business and Economics Review, vol. 9, no. 1, pp. 75–88, 2021. [Google Scholar]
5. B. Ziyae, H. Sadeghi, M. S. Nejad and M. Tajpour, “A framework of urban entrepreneurship for women breadwinners,” Foresight, vol. 23, no. 5, pp. 597–609, 2021. [Google Scholar]
6. S. C. Santos and X. Neumeyer, “Culture and gender in entrepreneurial teams: The effect on team processes and outcomes,” Small Business Economics, vol. 58, no. 2, pp. 1035–1050, 2022. [Google Scholar]
7. C. D. Osei and J. Zhuang, “Rural poverty alleviation strategies and social capital link: The mediation role of women entrepreneurship and social innovation,” Sage Open, vol. 10, no. 2, pp. 2158244020925504, 2020. [Google Scholar]
8. B. K. Sefer, “A Gender-and class-sensitive explanatory model for rural women entrepreneurship in Turkey,” International Journal of Gender and Entrepreneurship, vol. 12, no. 2, pp. 191–210, 2020. [Google Scholar]
9. D. Stefan, V. Vasile, A. Oltean, C. A. Comes, A. B. Stefan et al., “Women entrepreneurship and sustainable business development: Key findings from a SWOT–AHP analysis,” Sustainability, vol. 13, no. 9, pp. 5298, 2021. [Google Scholar]
10. E. S. Etim, R. Tengeh and C. G. Iwu, “Integration of information and communication technology into women entrepreneurship in Uyo, Nigeria,” Journal of Economics and Behavioral Studies, vol. 10, no. 1, pp. 118–134, 2018. [Google Scholar]
11. V. Agarwala, S. Maity and T. N. Sahu, “Female entrepreneurship, employability and empowerment: Impact of the mudra loan scheme,” Journal of Development Entrepreneurship, vol. 27, no. 1, pp. 121–134, 2022. [Google Scholar]
12. M. A. Ribeiro, I. Adam, A. N. Kimbu, E. Afenyo-Agbe, O. Adeola et al., “Women entrepreneurship orientation, networks and firm performance in the tourism industry in resource-scarce contexts,” Tourism Management, vol. 86, pp. 104343, 2021. [Google Scholar]
13. L. Zhu, O. Kara and X. Zhu, “A comparative study of women entrepreneurship in transitional economies: The case of China and Vietnam,” Journal of Entrepreneurship in Emerging Economies, vol. 11, no. 1, pp. 66–80, 2018. [Google Scholar]
14. G. Anggadwita, V. Ramadani, A. Permatasari and D. T. Alamanda, “Key determinants of women’s entrepreneurial intentions in encouraging social empowerment,” Service Business, vol. 15, no. 2, pp. 309–334, 2021. [Google Scholar]
15. P. Bouzari, A. Salamzadeh, M. Soleimani and P. Ebrahimi, “Online social networks and women’s entrepreneurship: A comparative study between Iran and Hungary,” Jwee, vol. 3, no. 4, pp. 61–75, 2021. [Google Scholar]
16. S. S. Ingalagi, N. Nawaz, H. U. Rahiman, A. Hariharasudan and V. Hundekar, “Unveiling the crucial factors of women entrepreneurship in the 21st century,” Social Sciences, vol. 10, no. 5, pp. 153, 2021. [Google Scholar]
17. D. Wu, L. Pigou, P. J. Kindermans, N. D. H. Le, L. Shao et al., “Deep dynamic neural networks for multimodal gesture segmentation and recognition,” IEEE Transactions on Pattern Analysis and Machine Intelligence, vol. 38, no. 8, pp. 1583–1597, 2016. [Google Scholar]
18. G. E. Hinton, S. Osindero and Y. W. Teh, “A fast learning algorithm for deep belief nets,” Neural Comput, vol. 18, pp. 1527–1554, 2006. [Google Scholar]
19. Y. Yang, K. Zheng, C. Wu, X. Niu and Y. Yang, “Building an effective intrusion detection system using the modified density peak clustering algorithm and deep belief networks,” Applied Sciences, vol. 9, no. 2, pp. 238, 2019. [Google Scholar]
20. M. Jain, V. Singh and A. Rani, “A novel nature-inspired algorithm for optimization: Squirrel search algorithm,” Swarm and Evolutionary Computation, vol. 44, no. 2, pp. 148–175, 2019. [Google Scholar]
21. V. P. Sakthivel and P. D. Sathya, “Single and multi-area multi-fuel economic dispatch using a fuzzified squirrel search algorithm,” Protection and Control of Modern Power Systems, vol. 6, no. 1, pp. 1–13, 2021. [Google Scholar]
22. H. Sun and R. Grishman, “Lexicalized dependency paths based supervised learning for relation extraction,” Computer Systems Science and Engineering, vol. 43, no. 3, pp. 861–870, 2022. [Google Scholar]
23. H. Sun and R. Grishman, “Employing lexicalized dependency paths for active learning of relation extraction,” Intelligent Automation & Soft Computing, vol. 34, no. 3, pp. 1415–1423, 2022. [Google Scholar]
24. A. Chillar, Women Entrepreneurs Analysis, 2022. [online]. Available: https://www.kaggle.com/arushchillar/women-entrepreneurs-analysis. [Google Scholar]
Cite This Article
 Copyright © 2023 The Author(s). Published by Tech Science Press.
This work is licensed under a Creative Commons Attribution 4.0 International License , which permits unrestricted use, distribution, and reproduction in any medium, provided the original work is properly cited.
 Downloads
 Citation Tools