
 Submit a Paper
 Propose a Special lssue
 Open Access
ARTICLE

Meta-Heuristic Optimized Hybrid Wavelet Features for Arrhythmia Classification
1 Sathyabama Institute of Science and Technology, Chennai, Tamil Nadu, 600119, India
2 School of EEE, Sathyabama Institute of Science and Technology, Chennai, Tamil Nadu, 600119, India
3 Department of EEE, BITS Pilani, Dubai Campus, Dubai International Academic City, P.O Box No. 345055, Dubai, UAE
* Corresponding Author: M. Subramoniam. Email:
Intelligent Automation & Soft Computing 2023, 37(1), 745-761. https://doi.org/10.32604/iasc.2023.034211
Received 09 July 2022; Accepted 07 November 2022; Issue published 29 April 2023
 View Full Text
 Download PDF
Abstract
The non-invasive evaluation of the heart through EectroCardioGraphy (ECG) has played a key role in detecting heart disease. The analysis of ECG signals requires years of learning and experience to interpret and extract useful information from them. Thus, a computerized system is needed to classify ECG signals with more accurate results effectively. Abnormal heart rhythms are called arrhythmias and cause sudden cardiac deaths. In this work, a Computerized Abnormal Heart Rhythms Detection (CAHRD) system is developed using ECG signals. It consists of four stages; preprocessing, feature extraction, feature optimization and classifier. At first, Pan and Tompkins algorithm is employed to detect the envelope of Q, R and S waves in the preprocessing stage. It uses a recursive filter to eliminate muscle noise, T-wave interference and baseline wander. As the analysis of ECG signal in the spatial domain does not provide a complete description of the signal, the feature extraction involves using frequency contents obtained from multiple wavelet filters; bi-orthogonal, Symlet and Daubechies at different resolution levels in the feature extraction stage. Then, Black Widow Optimization (BWO) is applied to optimize the hybrid wavelet features in the feature optimization stage. Finally, a kernel based Support Vector Machine (SVM) is employed to classify heartbeats into five classes. In SVM, Radial Basis Function (RBF), polynomial and linear kernels are used. A total of ∼15000 ECG signals are obtained from the Massachusetts Institute of Technology-Beth Israel Hospital (MIT-BIH) arrhythmia database for performance evaluation of the proposed CAHRD system. Results show that the proposed CAHRD system proved to be a powerful tool for ECG analysis. It correctly classifies five classes of heartbeats with 99.91% accuracy using an RBF kernel with 2nd level wavelet coefficients. The CAHRD system achieves an improvement of ∼6% over random projections with the ensemble SVM approach and ∼2% over morphological and ECG segment based features with the RBF classifier.Keywords
An abnormal heart rhythm is called an arrhythmia and is due to a disturbance in the heart’s system. The heart rhythm is measured by EectroCardioGraphy (ECG) from the human body surface. The most common symptoms are tiredness, dizziness, loss of consciousness, breathlessness and palpitations in the chest region. A rapid and effective assessment of ECG signal is required to avoid sudden cardiac death due to arrhythmia. A fast machine learning model is described in [1] for arrhythmia classification. Before feature extraction, a series of preprocessing steps, re-sampling, filtering, heartbeat detection, and two successive R (RR) waves calculation are performed. The logarithm of the raw RR interval is fed to a combination of ensembles for the classification using an echo state network.
A simple and efficient approach using statistical features for ECG signal classification is described in [2]. From the de-noised ECG signal, statistical features such as mean, skewness, variance and standard deviation are extracted and given to the Support Vector Machine (SVM) for normal/abnormal classification. The entire ECG signal is used for the classification. A Generalized Discriminant Analysis (GDA) based feature reduction is applied in [3] for arrhythmia classification. After preprocessing, fifteen linear and non-linear features are extracted from the interval of RR waves. These features are optimized using GDA, and an SVM classifier is used for the classification.
Wavelet transform based features are discussed in [4] for arrhythmia classification. The extracted wavelet features from the preprocessed signals are reduced by linear discriminant analysis and an SVM classifier is employed for the classification. Probabilistic Neural Network (PNN) based heartbeat classification is discussed in [5]. Features such as the power of the original and wavelet decomposed signals; coherence and morphological characteristics of each wavelet sub-band are extracted from the 2nd level wavelet decomposition. The extracted features are normalized before classification by PNN. The Independent Component Analysis (ICA) is integrated with the Back Propagation Neural Network (BPNN) for heartbeat classification in [6]. The combination of RR interval and ICA is used as features, with classifiers such as BPNN and PNN for classifying heartbeats in ECG signals.
A knowledge representation system is designed in [7] for arrhythmia classification. It encodes the ECG signal with two knowledge parts; hand encoding and machine encoding by an autoencoder, and then a Convolution Neural Network (CNN) is employed for the classification. The ECG signals are normalized by min-max normalization before encoding. A combination of morphological and ECG segment based features is utilized in [8] for arrhythmia classification. The morphological features such as amplitude, duration, heartbeat interval and ECG segment features from dynamic time wrapping and principal component analysis are extracted and an SVM classifier is used as a classifier.
A combination of CNN and Long Term Short Memory (LSTM) for arrhythmia classification is discussed in [9]. It has three convolution layers coupled with a max pooling layer to extract the features. The last layer is LSTM and a fully connected layer is employed for the classification. An ensemble SVM system is described in [10] for heartbeat classification. Before feature extraction, the segmented heartbeats are normalized. It uses RR intervals and random projections for the classification. Incremental broad learning is discussed in [11] for arrhythmia classification using the biased dropout technique. First, the ECG signals are de-noised and then morphological rhythm features are extracted.
Visual pattern features and morphological features are utilized for arrhythmia classification in [12]. A clustering based approach is used to extract the visual pattern features. Three different classification algorithms, SVM, BPNN and K-Nearest Neighbour (KNN) classifier, are employed for the classification. A kernelized fuzzy rough set is employed in [13] for heartbeat classification in a multi-label classification approach. The different heartbeats are mapped with the ECG features and optimized using a multi-objective optimization model. Log-linear and neural network models demand a lot of training data and effort, restricting their transfer to new interactions and domains.
Different frequency domain representations and their applications in the medical domain have been studied well recently. Though the frequency domain representation captures more information than the spatial domain, it also provides redundant information. Most systems directly use the information with the redundant data from the representation systems affecting the system’s performance. To overcome this drawback, feature optimization is employed and hybridization is performed to increase efficiency. This paper provides hybrid wavelet features for arrhythmia classification using ECG signals. The primary goal of this work is to provide a high degree of accuracy between different heartbeats. The secondary goal is to combine spectral features other different wavelet filters to improve the discriminating power.
The rest of the paper is organized as follows: Section 2 provides details of the pattern recognition system; the CAHRD system applied to ECG signal classification. The clinical data used in this work are obtained from the Massachusetts Institute of Technology-Beth Israel Hospital (MIT-BIH) database [14–16] and the CAHRD system’s performance in this database is discussed in Section 3. Finally, a conclusion about using the CAHRD system for arrhythmia classification is provided in Section 4.
An ECG signal may be represented by the feature set
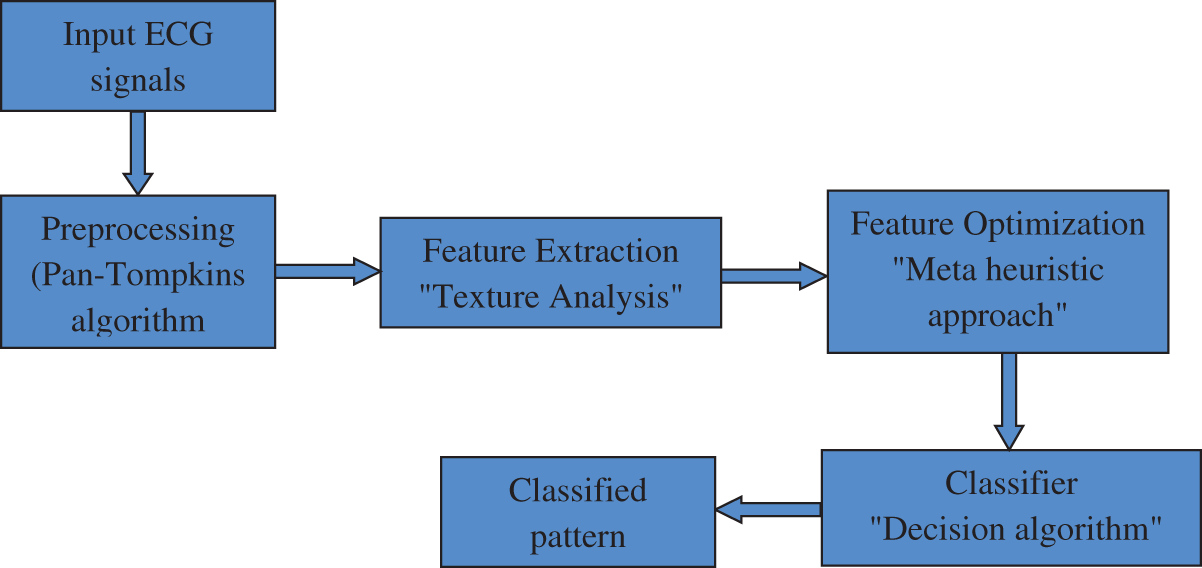
Figure 1: Stages of the CAHRD system
To make the classification more accurate, the raw ECG signals obtained in a clinical environment need to be de-noised as they are mixed with much interference, such as baseline drift, power frequency and electromyography. The CAHRD system uses the well-known Q-wave, R-wave and S-wave (QRS) detection algorithm by Pan et al. [17]. At first, ECG signal’s interference noises (60 Hz) are removed by a band pass filter algorithm composed of cascaded low and high pass filters. It is a recursive filter that eliminates muscle noise, removes T-wave interference and baseline wander. The transfer functions of the low-pass (Eq. (1)) and high pass (Eq. (2)) filters are defined in [17]
After filtration, the QRS slope information is obtained from the differentiated filtered signal. The transfer function [17] used for this purpose is
In order to get nonlinear amplification of the derivative filter’s output from Eq. (3), the signal is squared. It is defined by [17]
To obtain the waveform feature information and R wave’s slope, moving window integration is performed on the squared signal. Finally, the QRS signal is identified by adjusting the thresholds and RR interval limits. More information about the preprocessing steps can be obtained from [17]. Fig. 2 shows the preprocessing outputs from a sample ECG signal.

Figure 2: Preprocessing outputs of CAHRD system
It is noted that all diagnostic information’s available around the ECG signal’s R peak. Thus, a portion of the signal before and after the R point is cropped for processing. The total length of the cropped signal is 200 points with 0.556 s. The cropped signal is then normalized to reduce the possibility of false decisions. The normalized ECG segment has a unit standard deviation and zero mean. The unit norm normalization for a signal (S) is defined as
where
This stage facilitates the combination of spectral features from different wavelet families. The raw ECG signal is a temporal signal consisting of many frequency components. To get these components, the temporal ECG signal will be converted into a frequency domain via wavelets. A wavelet is viewed as a high and low pass filter that gives a low and high pass detail image [18]. What makes the wavelet unique from other spectral techniques is the aspect ratio of the window (support) which changes while the area under the window remains constant. Additionally, the wavelet is computationally inexpensive and less complex than other wavelet forms. The relation of a wavelet is [18]:
where
The scaling factor v in
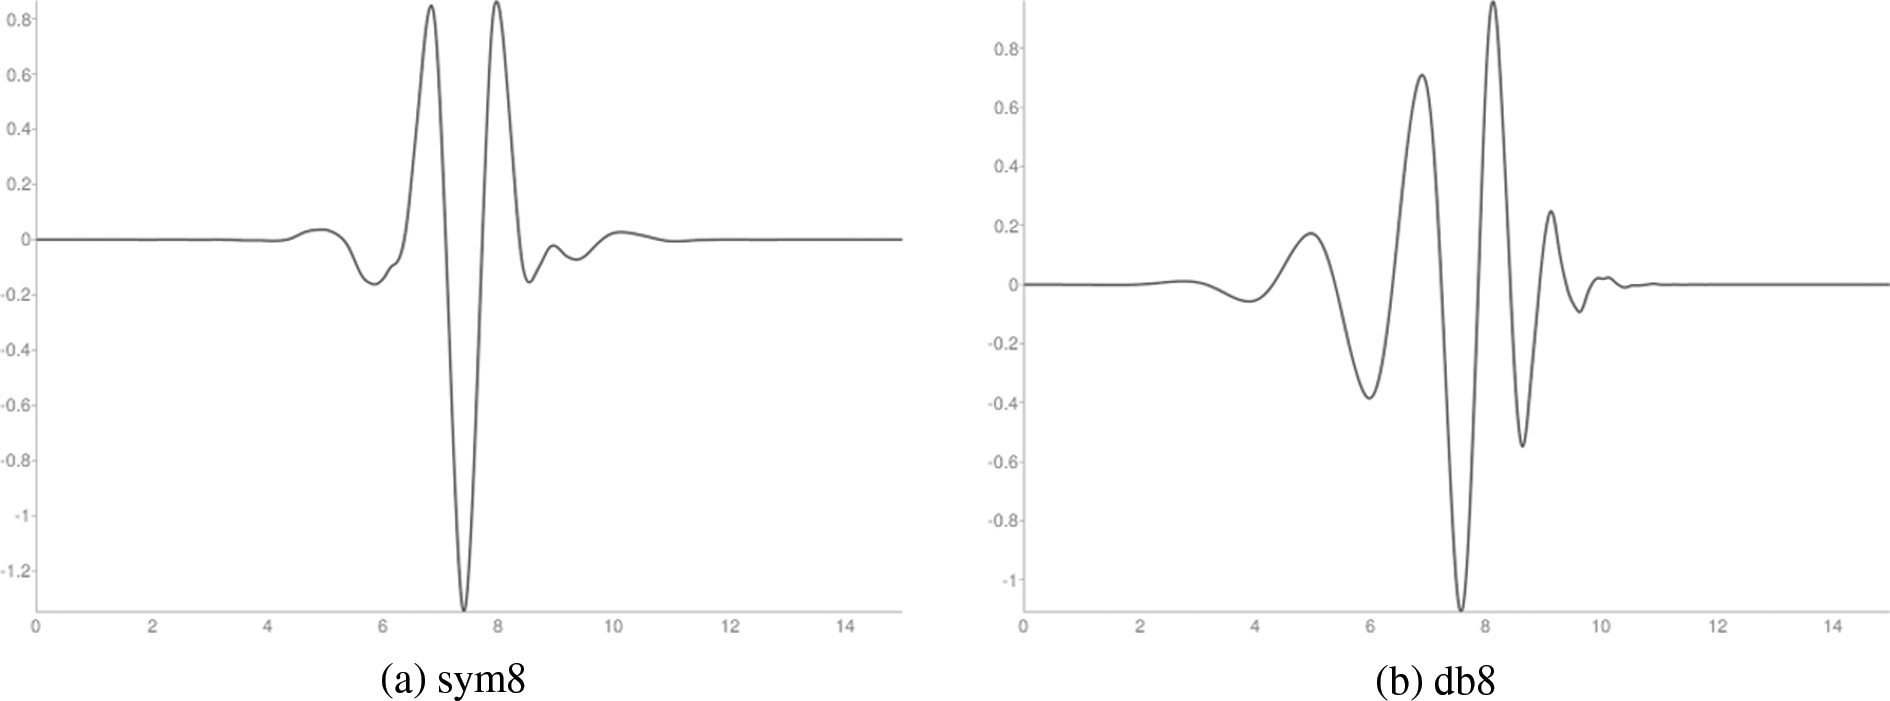
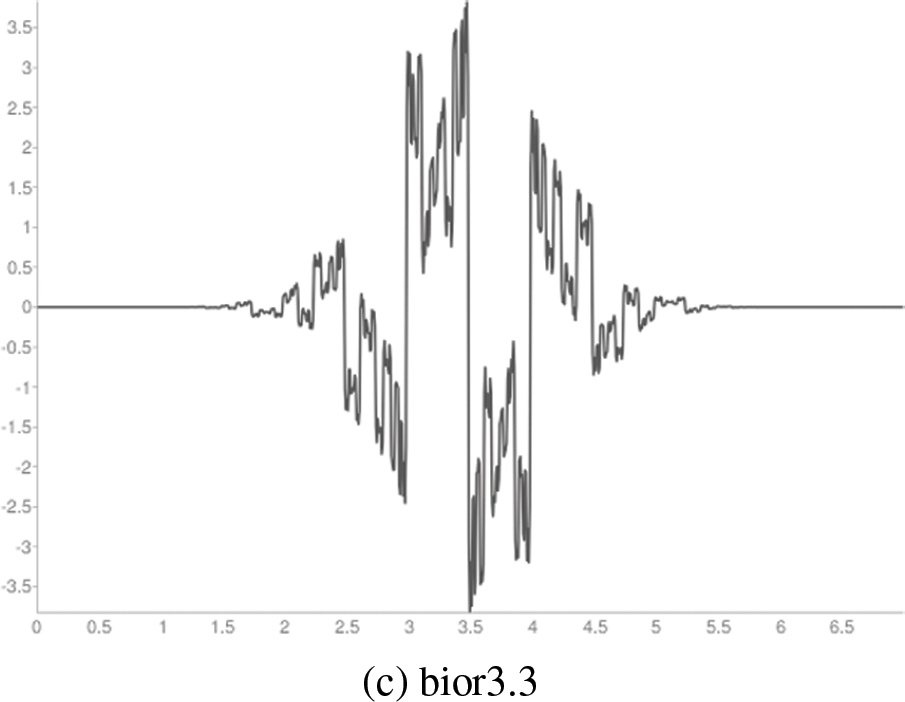
Figure 3: Wavelet functions
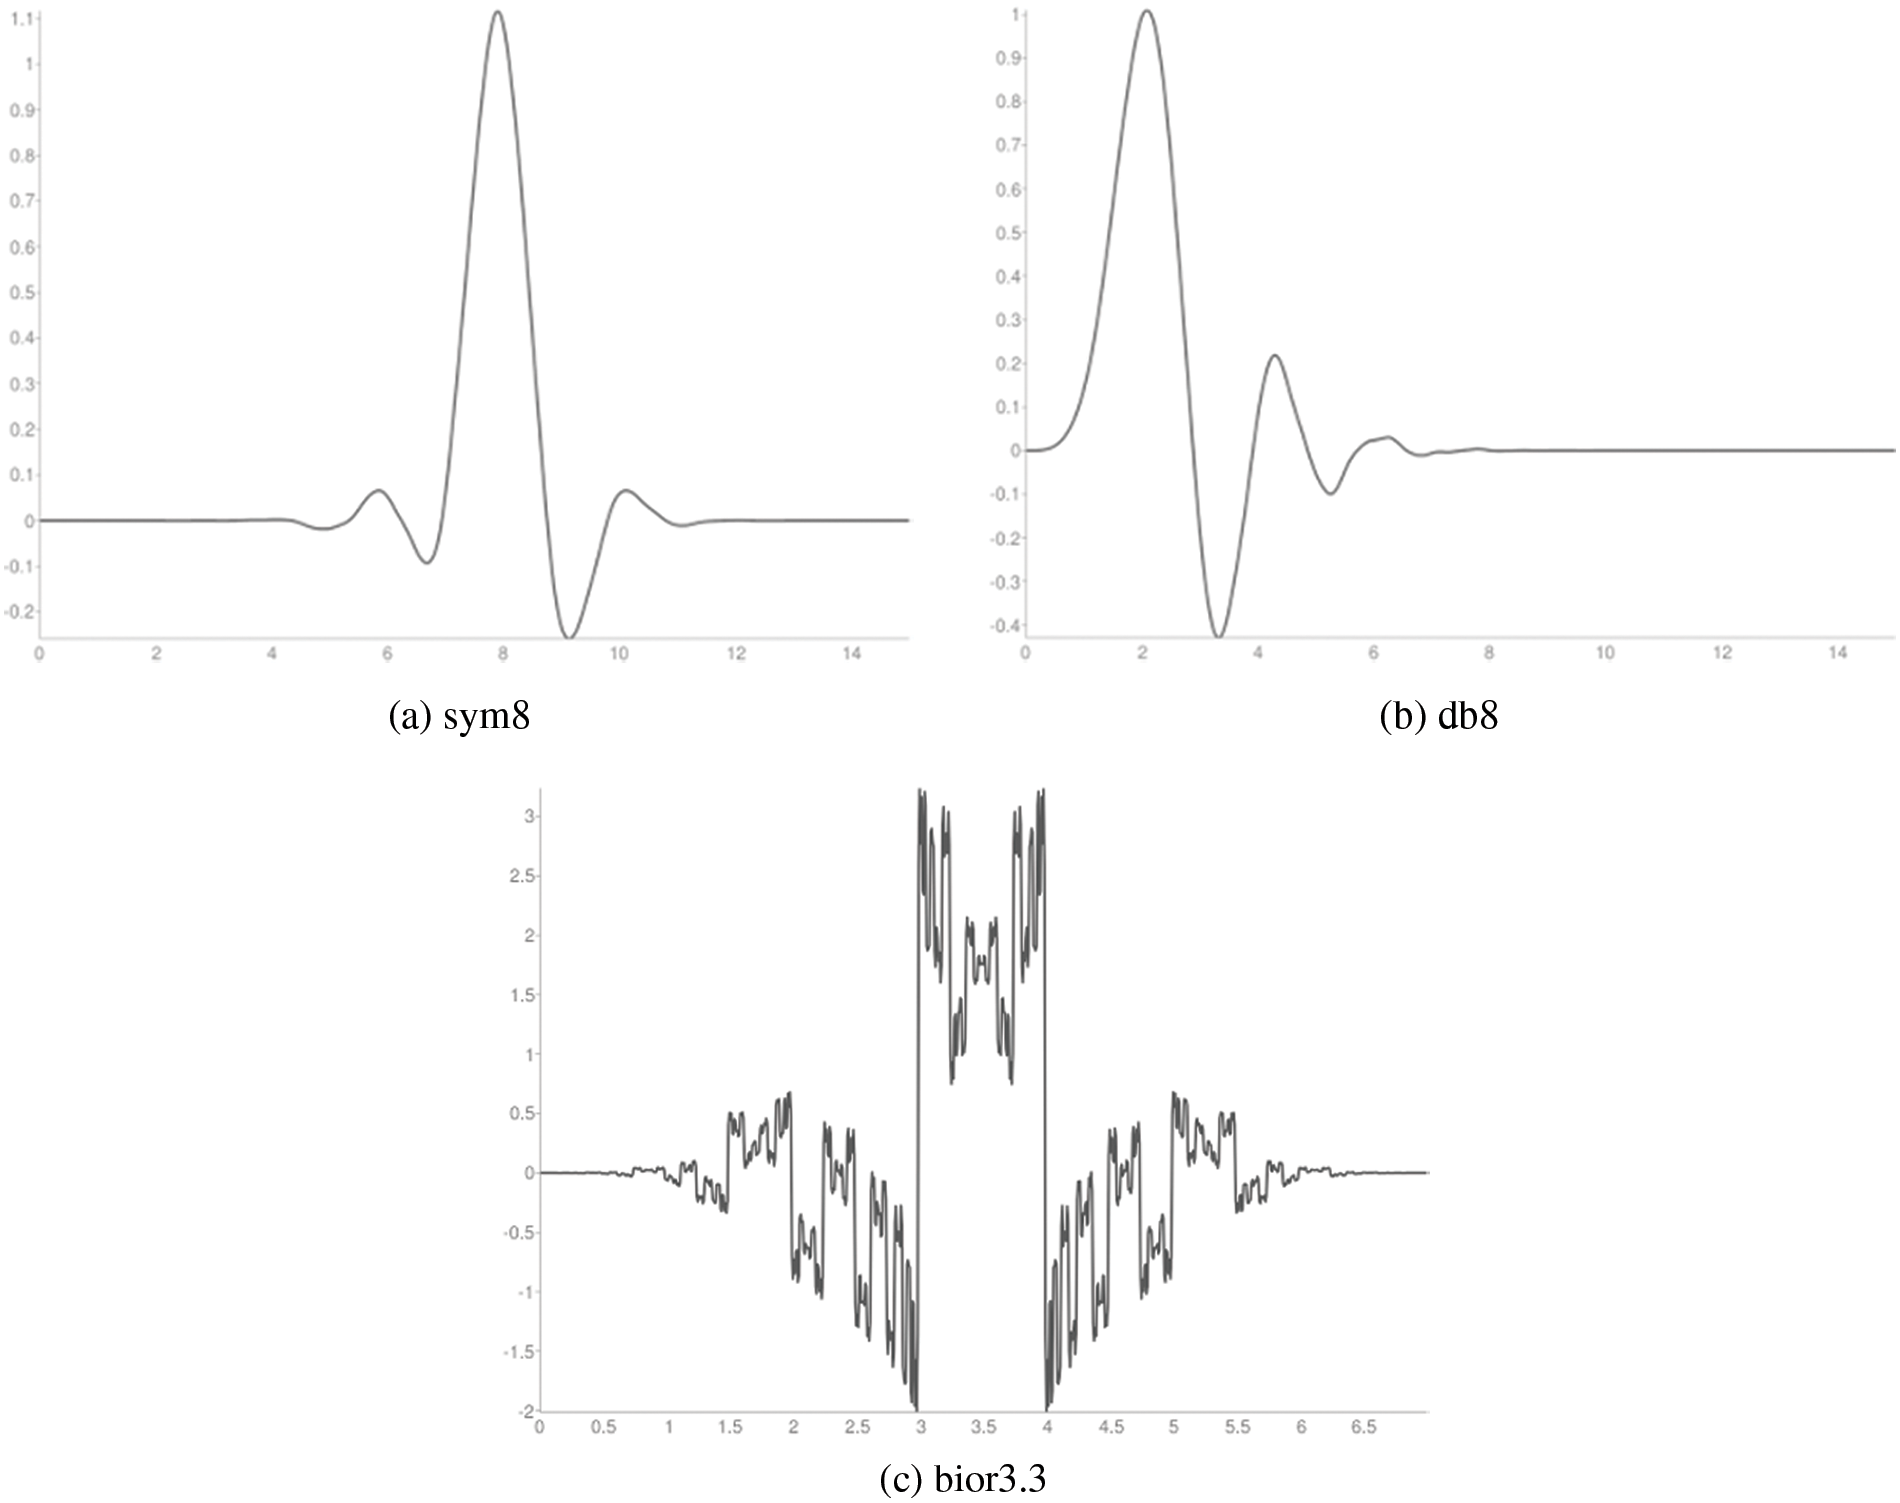
Figure 4: Scaling functions
The hybrid wavelet features contain hundreds of wavelet coefficients. The excessively large feature vectors degrade the system’s performance. Thus, feature optimization is required. The goal of feature optimization applied to the CAHRD system is to select the best features that maximize the prediction accuracy of the classified ECG signals. In this work, the hybrid features are optimized using Black Widow Optimization (BWO) [20]. Fig. 5 shows the BWO procedure to optimize hybrid wavelet features.
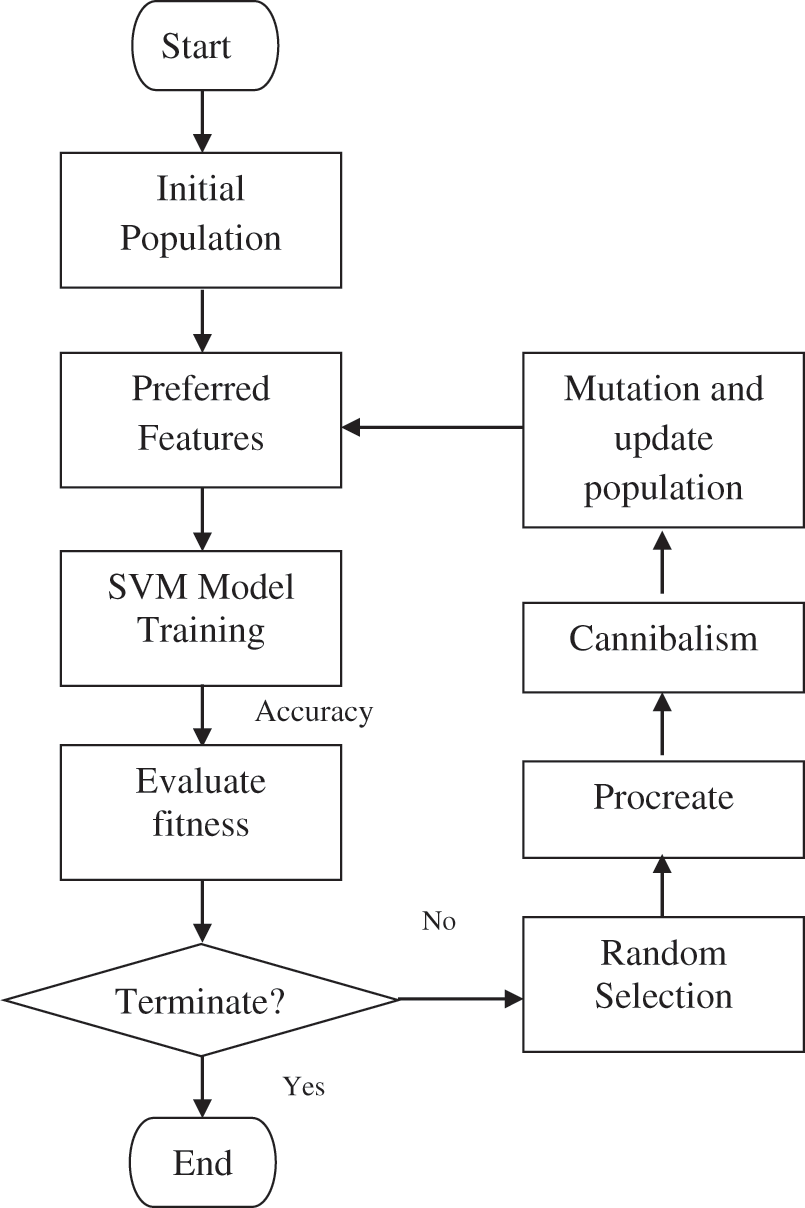
Figure 5: BWO procedure to optimize hybrid wavelet features
In BWO, the structure of the solution of selecting features is called as widow. It is defined as
where
where the number of features in the subset is
where the accuracy of
The CAHRD classifier system uses the training samples labeled by their actual rhythms. These labels are then used to guide the classifier during the learning process. Several methodologies have been developed for carrying out ECG classification based on the optimized features. Though there are many existing classifiers, KNN, BPNN, and PNN, SVM is the best choice for ECG classification due to its good generalization performance, robustness in high dimensions and computation efficiency [21].
Let us consider the acquired l observations (optimized wavelet features)
where C is a factor controlling the cost of misclassification, w is the weight vector, and ξi is the positive slack variable in the constraints [22],
where
The proposed CAHRD system uses kernel SVMs to identify normalized ECG signal patterns using the optimized feature space. It uses linear (Eq. (14)), polynomial (Eq. (15)) and radial basis function (Eq. (16)) kernels defined in [22]
where d and
This section evaluates the major components of the CAHRD systems which have been applied to classify the ECG signals. Also, the evaluation of the CAHRD system using the concept of sensitivity and specificity is provided.
The proposed CAHRD system is evaluated using a benchmark database; MIT-BIH arrhythmia [14–16]. The digitized (11-bit resolution) ECG signals in MIT-BIH have been sampled at 360 Hz and a total of 48 half-hours of records are available. Fig. 6 shows the sample ECG signal in the LightWAVE Plot. The normal beats ‘N’ are represented by blue coloured dots. Table 1 shows the annotations of the MIT-BIH database and the available samples in the entire database.
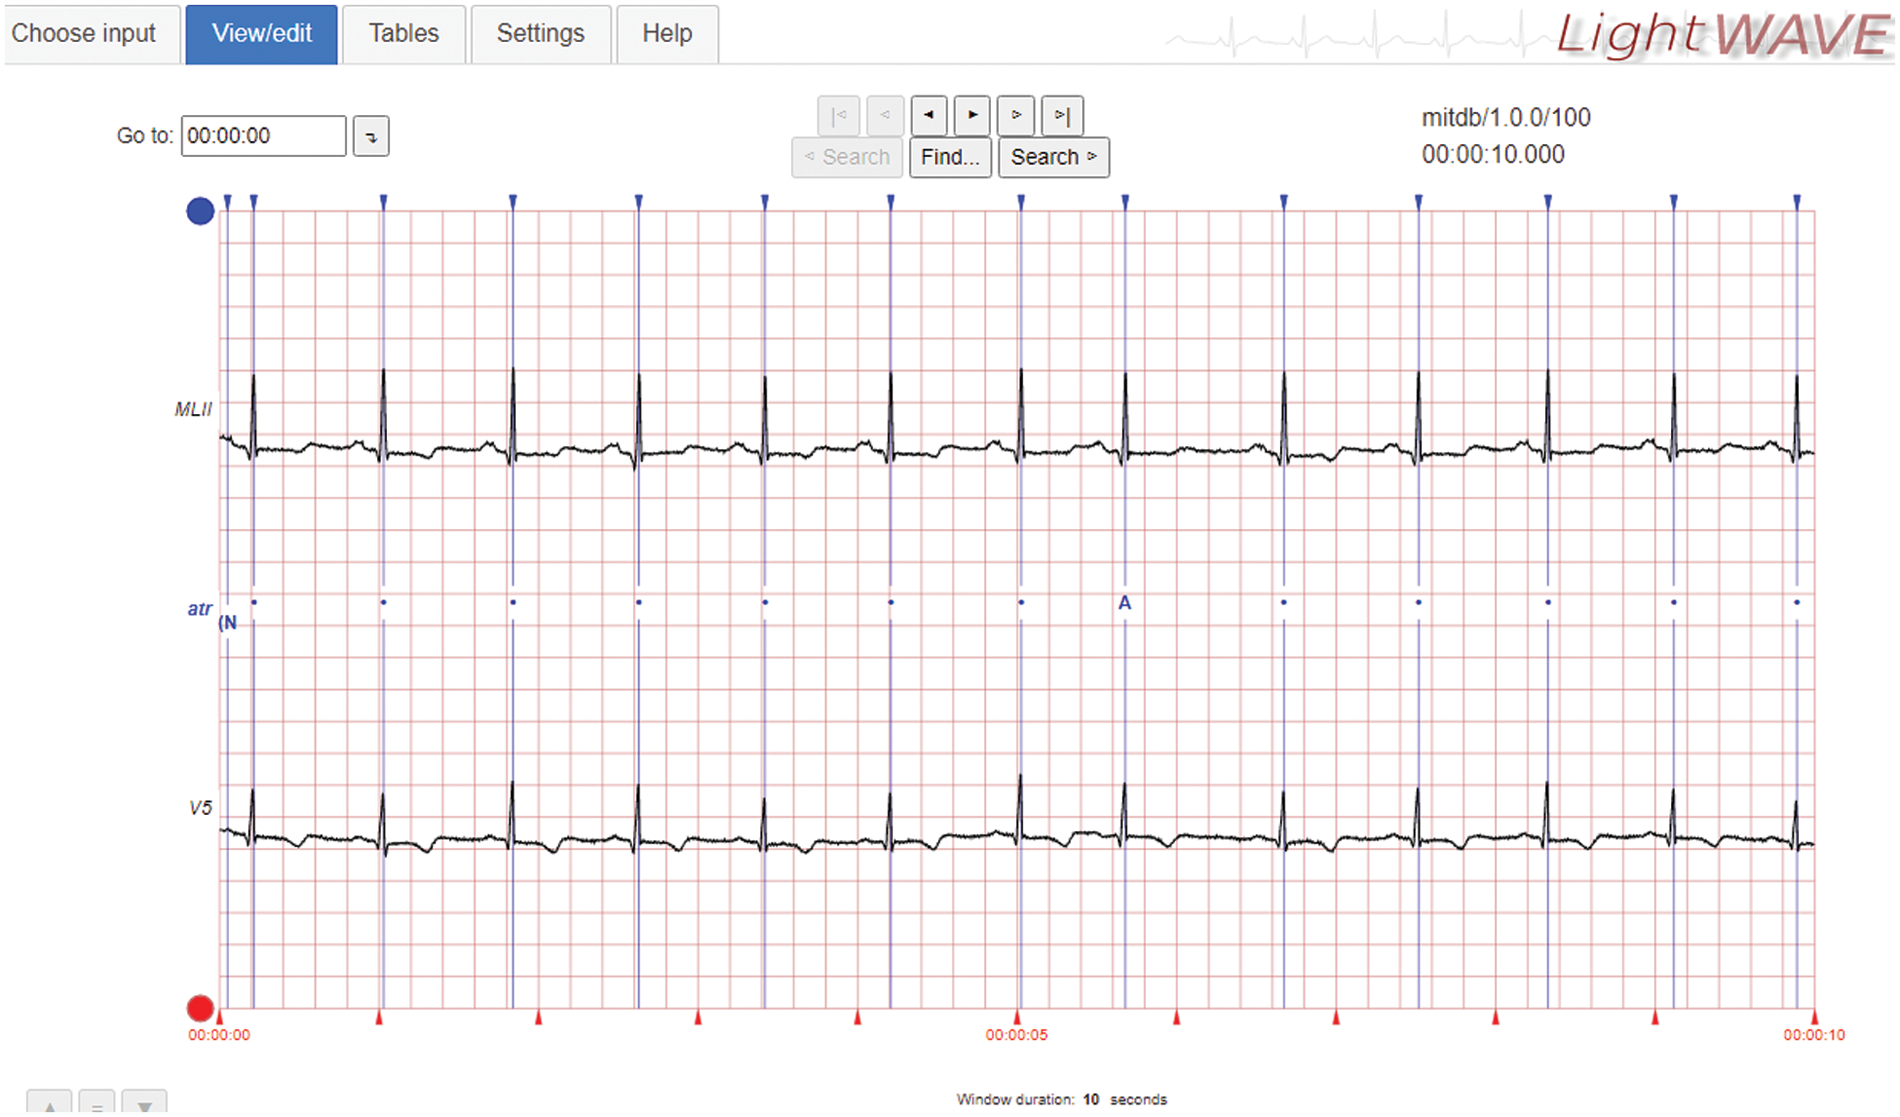
Figure 6: Sample ECG signal in the MIT-BIH database
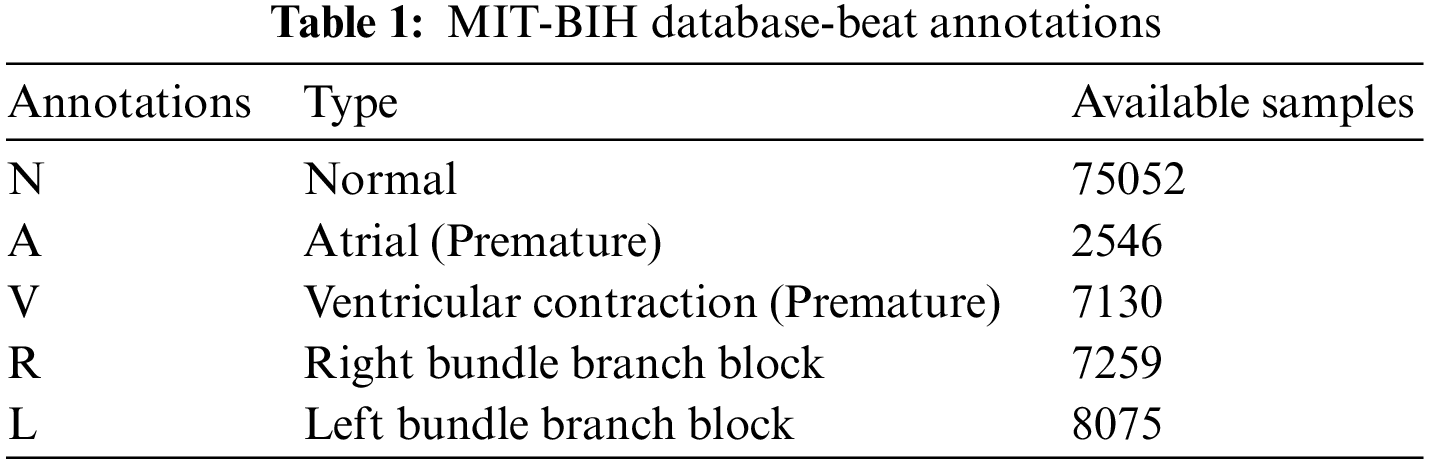
It can be seen from Table 1 that there is a significant imbalance in the dataset. Though many approaches are available to overcome the class imbalance problem and to avoid computational complexity, stratification (stratified sampling) is employed in this study. In conventional k-fold cross-validation, the training samples are randomly partitioned. Hence, it has a uniform probability distribution which is inappropriate for the imbalanced database. To fix this problem, the same class distribution is maintained in each subset. Also, approximately ten times more samples are available for normal beats; only 10000 normal beats are randomly selected from the entire samples and all samples from other beats are used for performance evaluation.
The classifier’s parameters are optimized in any pattern recognition system based on the training data. Therefore, an independent test set is required to make a reliable estimation of the classifier’s applicability to new data. When no such test data is available, k-fold cross-validation (10-fold) is performed to measure the generalization performance of the CAHRD system. At first, the data is partitioned into k subsets randomly. Each subset is used once for testing and the results from each subset are averaged to get the overall result. Fig. 7 shows the cross-validation approach.
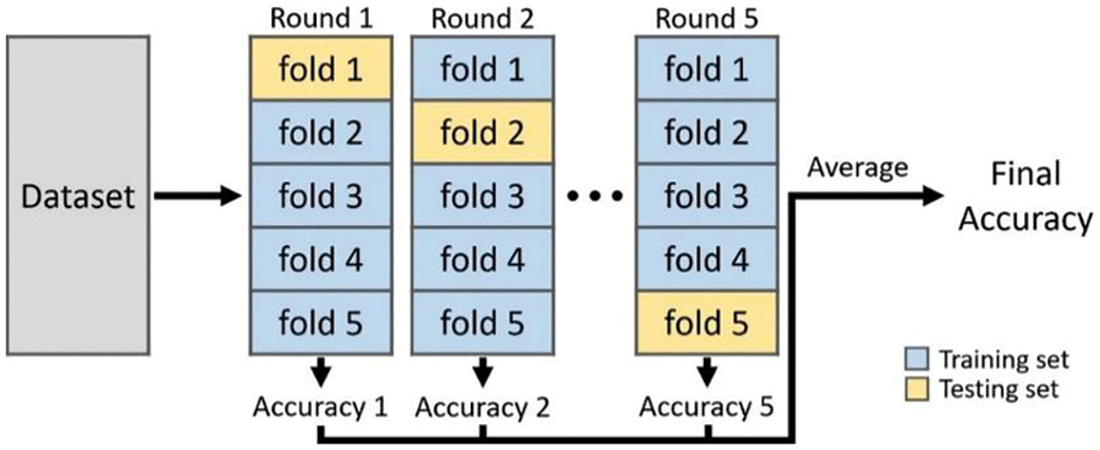
Figure 7: Procedure to measure CAHRD system’s performance
The two main quantitative measures for a screening test to identify people who have or do not have a specific disease are sensitivity and specificity. The former measure shows the system’s ability to identify people who have the disease or the probability that a person has the disease when they have it. The later measure is an ability to correctly identify people who do not have a specific condition or the probability that a person does not have the disease when they are disease free. For binary classification, a table (Table 2) can be formulated based on the test outcomes and the ground truth data.
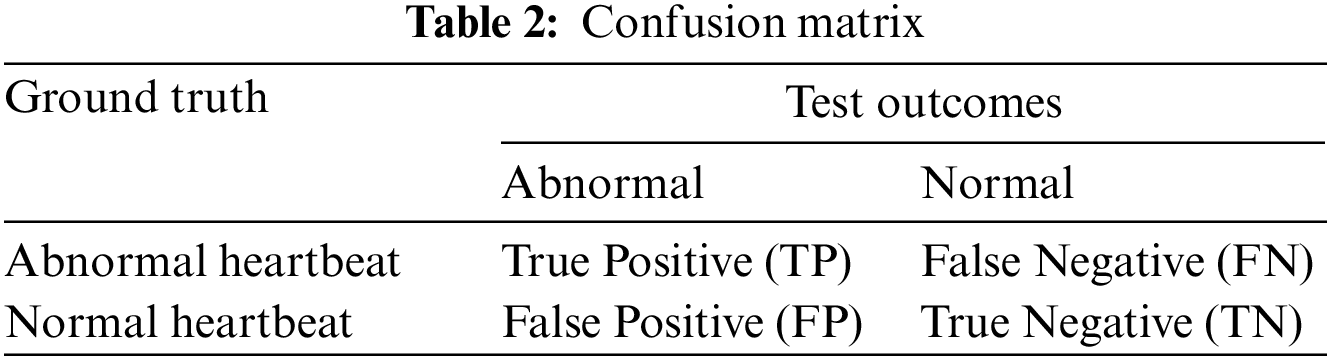
From the Table 2, Sensitivity and Specificity are defined as follows:
The overall accuracy of CAHRD system is defined as
In this work, the multi-class classification problem with five conditions is studied. The above quantitative measures can also be computed for multi-class classification problems.
The performance of the CAHRD system in classifying the samples using the optimized features is discussed. Table 3 shows the performance of the CAHRD system with 1st level hybrid wavelet features using kernel SVMs.
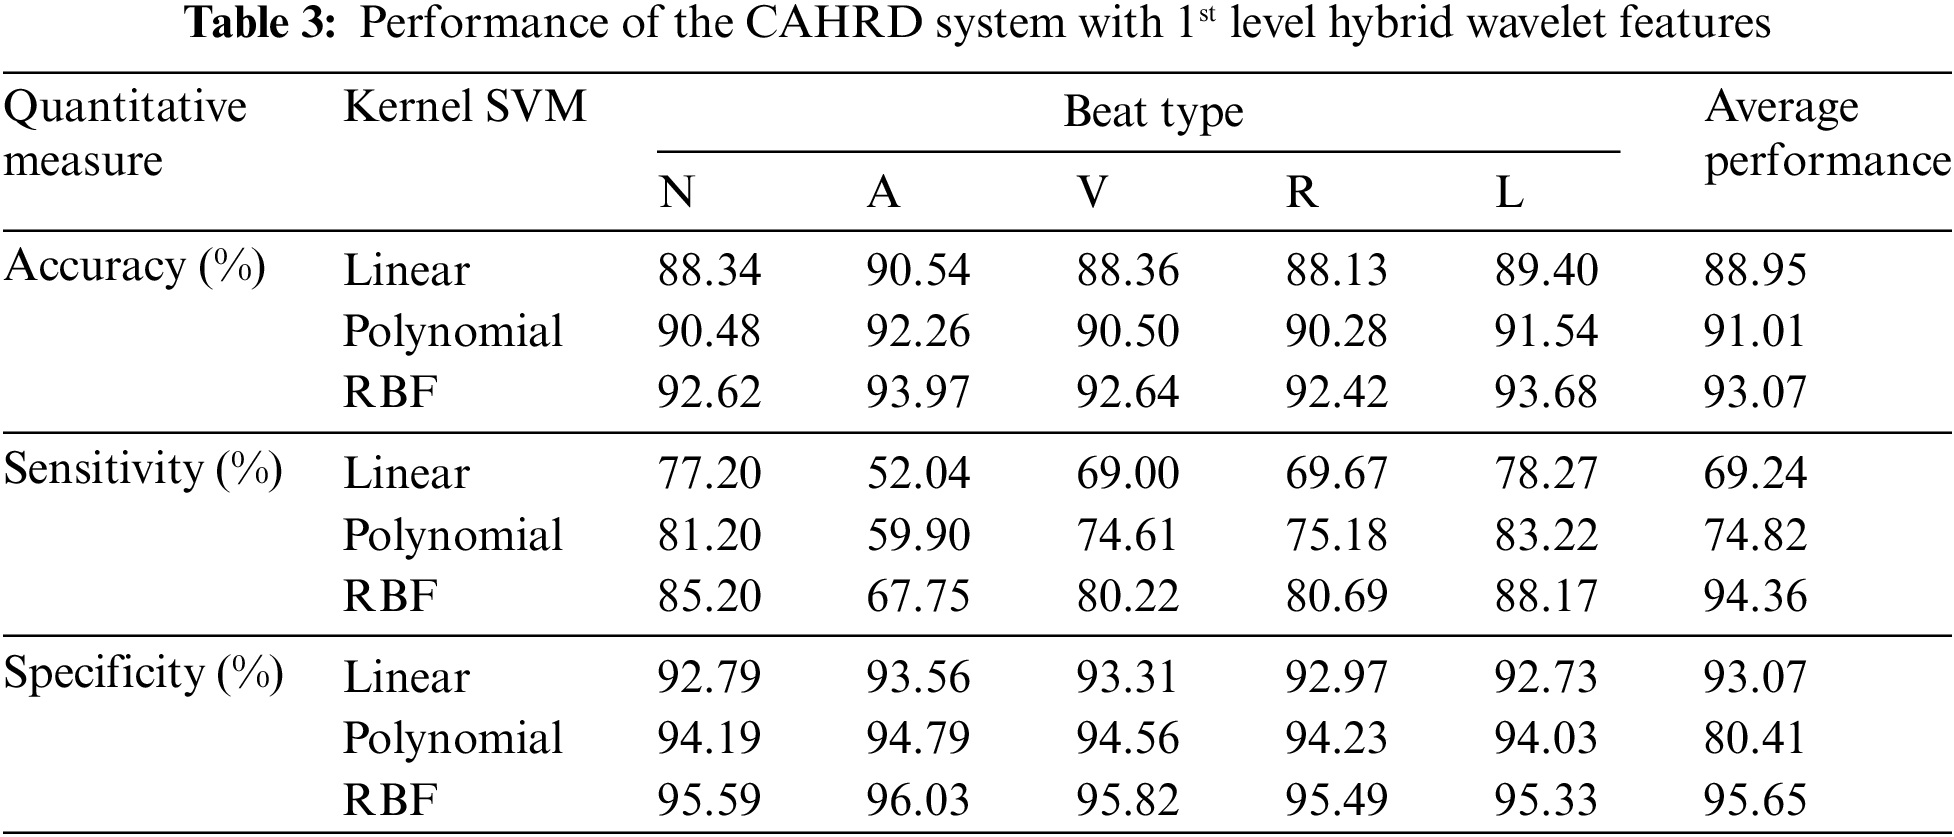
It can be seen from Table 3 that the RBF kernel based CAHRD system provides ∼92% classification accuracy for all heartbeats. Though the CAHRD system by 1st level hybrid wavelet features has good classification accuracy and specificity, the system’s sensitivity (67.75% to 85.20%) is very poor. For a good system, both quantitative measures should be at their maximum. Further analysis is performed on the same dataset by extracting hybrid features from the 2nd level of decomposition. Table 4 shows the performance of the CAHRD system with 2nd level hybrid wavelet features using kernel SVMs.
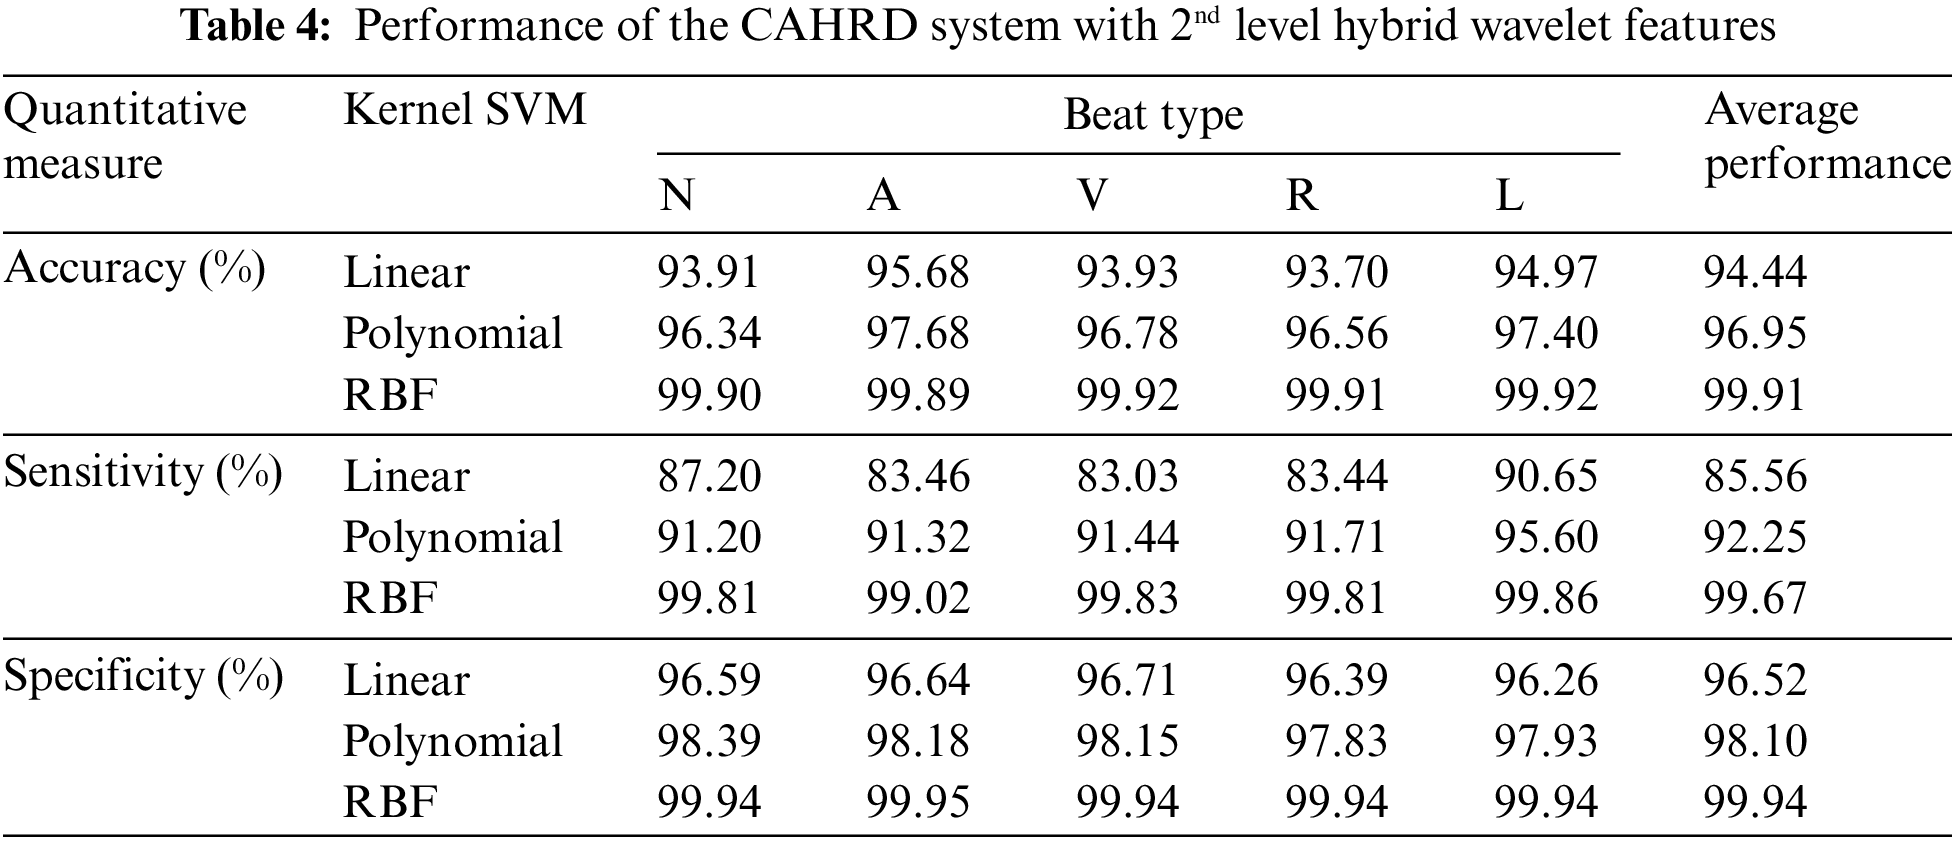
It can be seen from Table 4 that the CAHRD system shows encouraging results with ∼99.9% classification accuracy for all heartbeat classes. The average increase in classification accuracy from 1st level hybrid features to 2nd level hybrid features is ∼7% by the RBF classification whereas it is ∼5% for linear and polynomial kernel based classification respectively. To further analyze how the proposed CAHRD system performs at a higher level of decomposition, 3rd level features are analyzed. Table 5 shows the performance of the CAHRD system with 3rd level hybrid wavelet features using kernel SVMs.
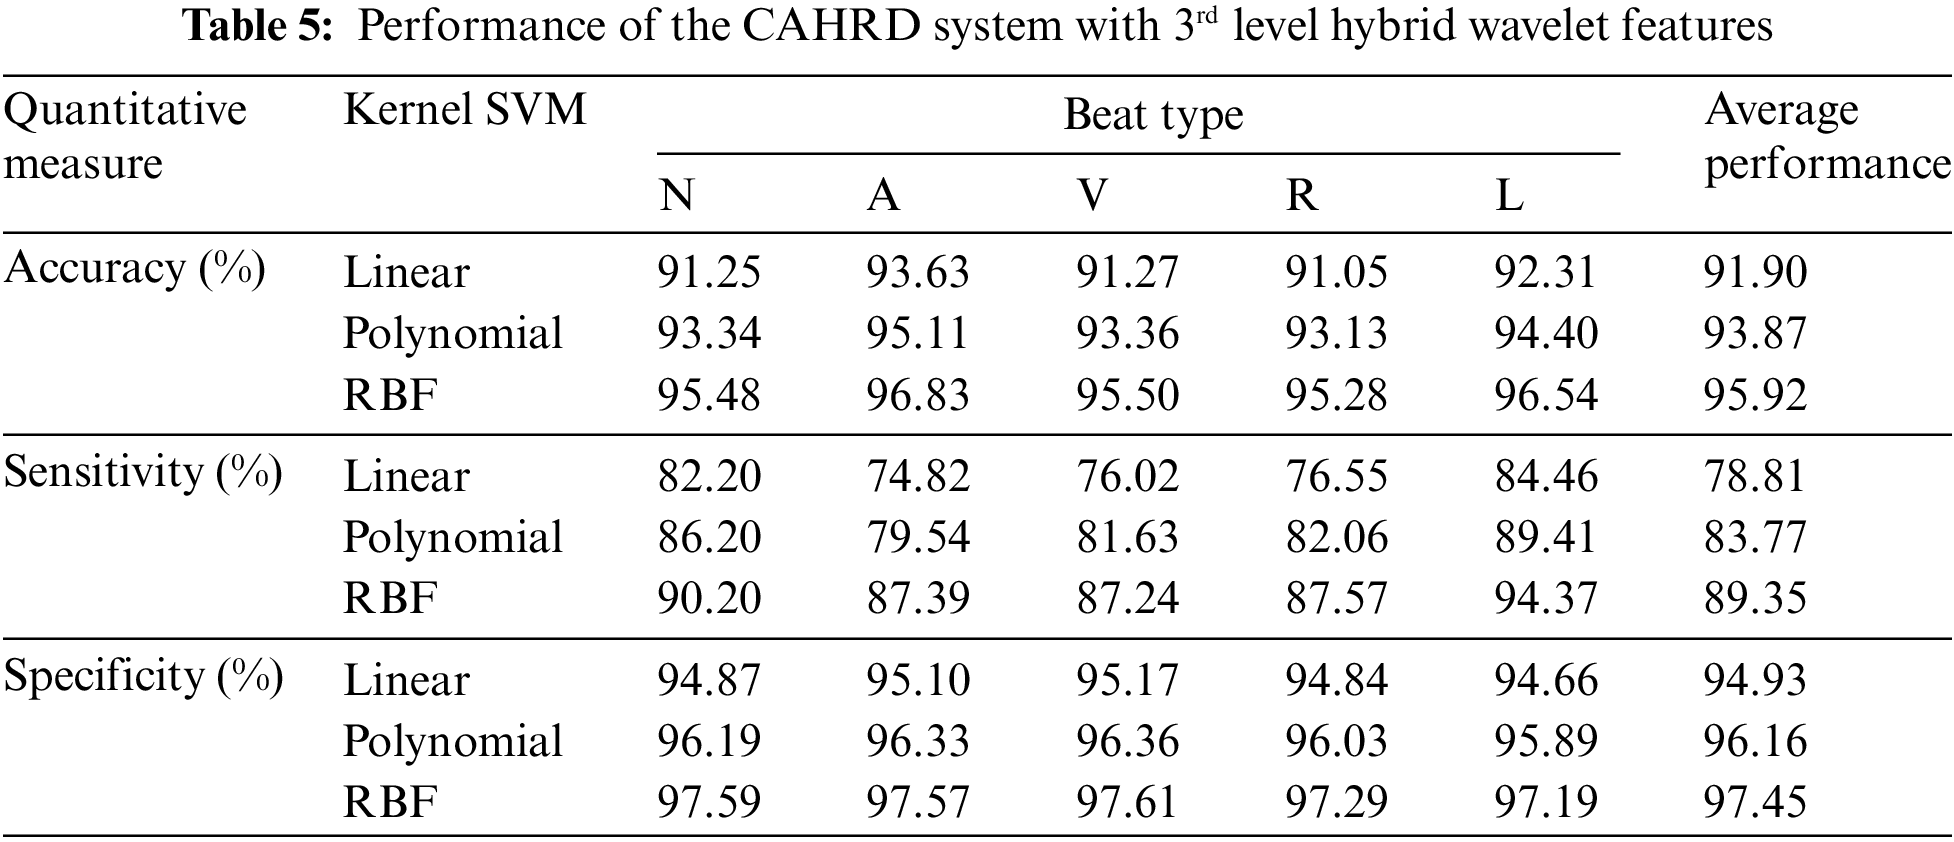
It is observed from Tables 4 and 5 that the CAHRD’s performance while using 3rd level hybrid wavelet features is less accurate than 2nd level hybrid features for all kernel SVMs. This performance degradation may be due to the redundant data being formed at a higher level of decomposition. Thus, the average performance of the CAHRD system is reduced from 99.91% (2nd level) to 95.92% (3rd level) when using the RBF kernel for classification. In order to show the effectiveness of the hybrid wavelet features, the performances of 2nd level features from individual wavelet filters (‘db8’, ‘sym8’ and ‘bior3.3’) using the RBF classifier are shown in Table 6.
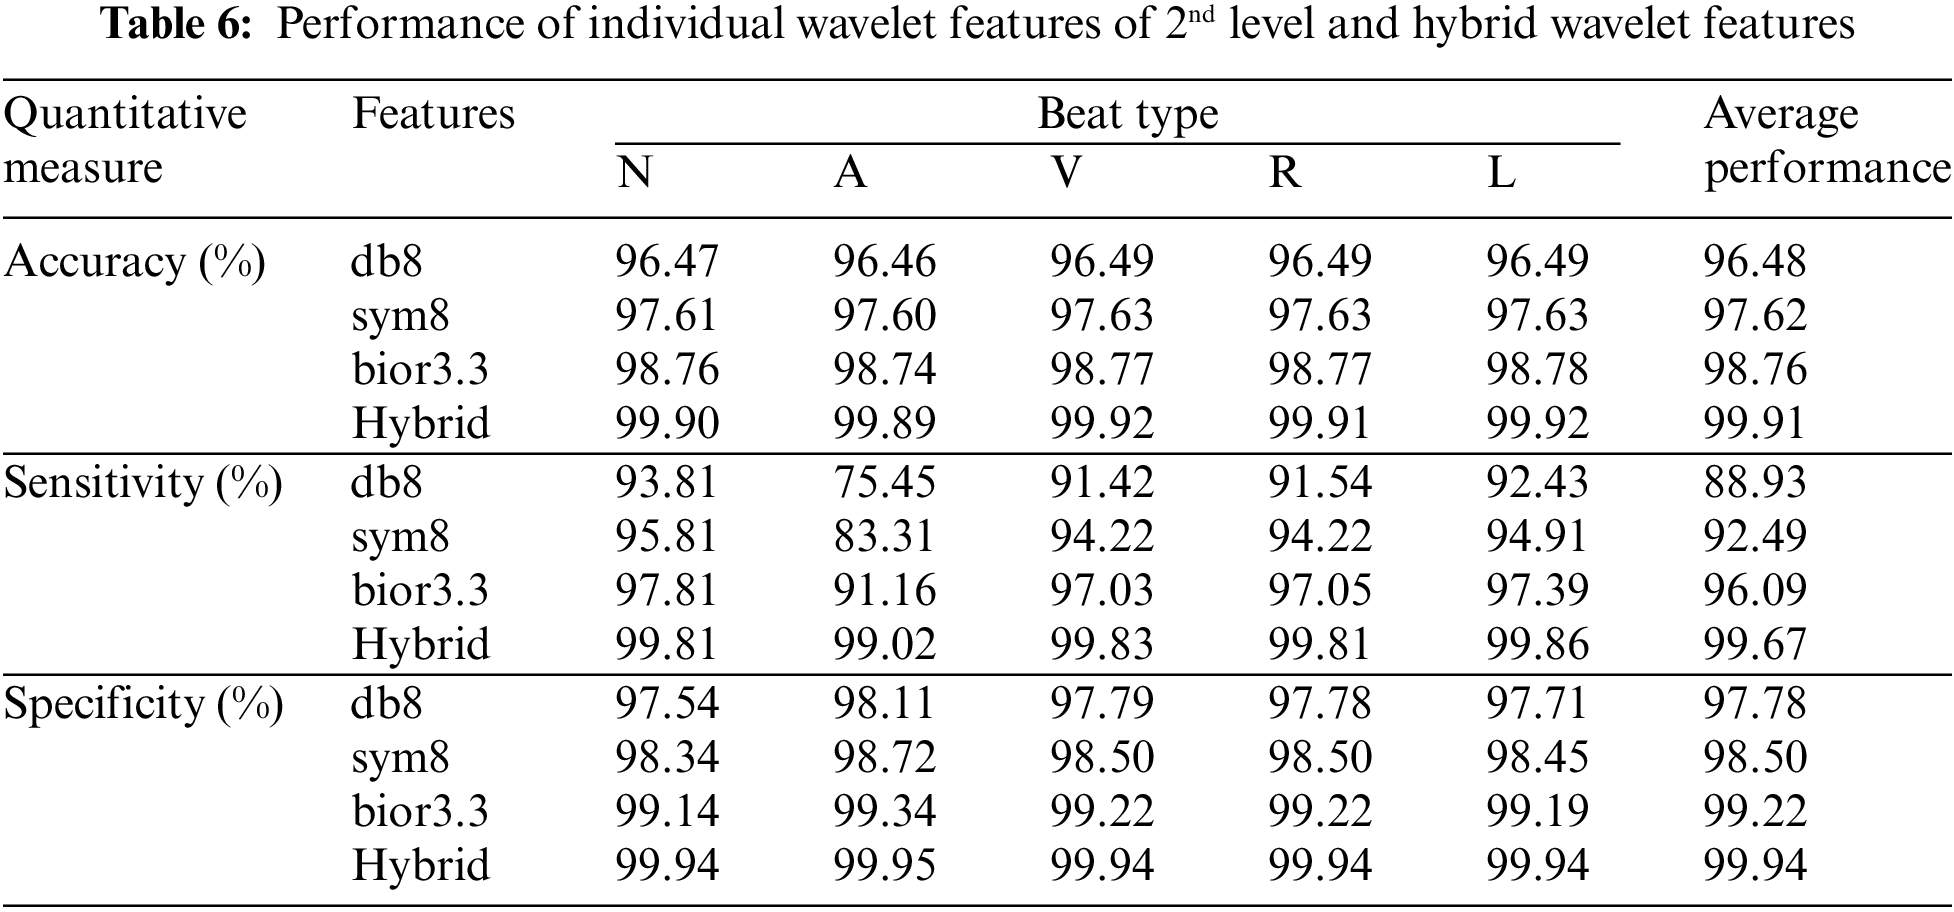
It can be seen from Table 6 that the hybrid wavelet features increase the CAHRD system’s performance more than their corresponding wavelet features such as ‘db8’, ‘sym8’ and ‘bior3.3’. Among the wavelet filters, ‘bior3.3’ provides better performance than ‘db8’, and ‘sym8’ with an average accuracy of 98.76% with 96.09% of sensitivity and 99.22% of specificity. It is concluded from Tables 3 to 6 that 2nd level hybrid wavelet features with RBK kernel SVM provide better results in terms of accuracy (99.91%), sensitivity (99.67%) and specificity (99.94%). The effect of changing the variables
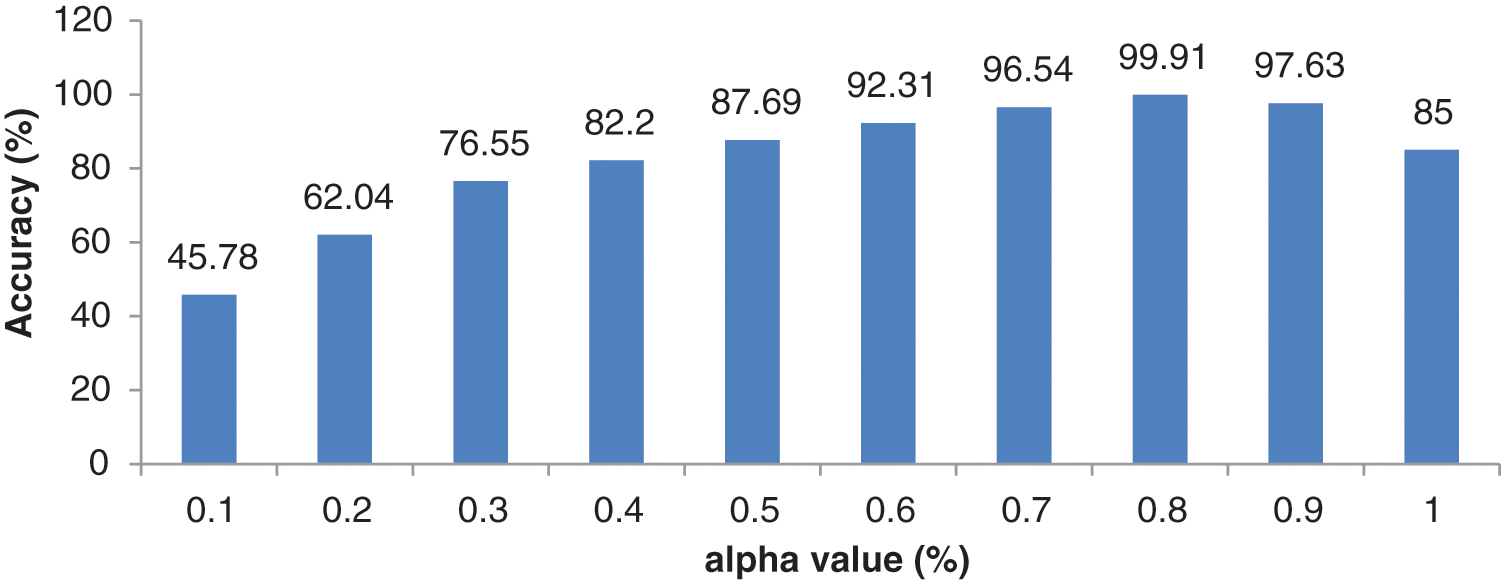
Figure 8: Performance of 2nd level wavelet features with different
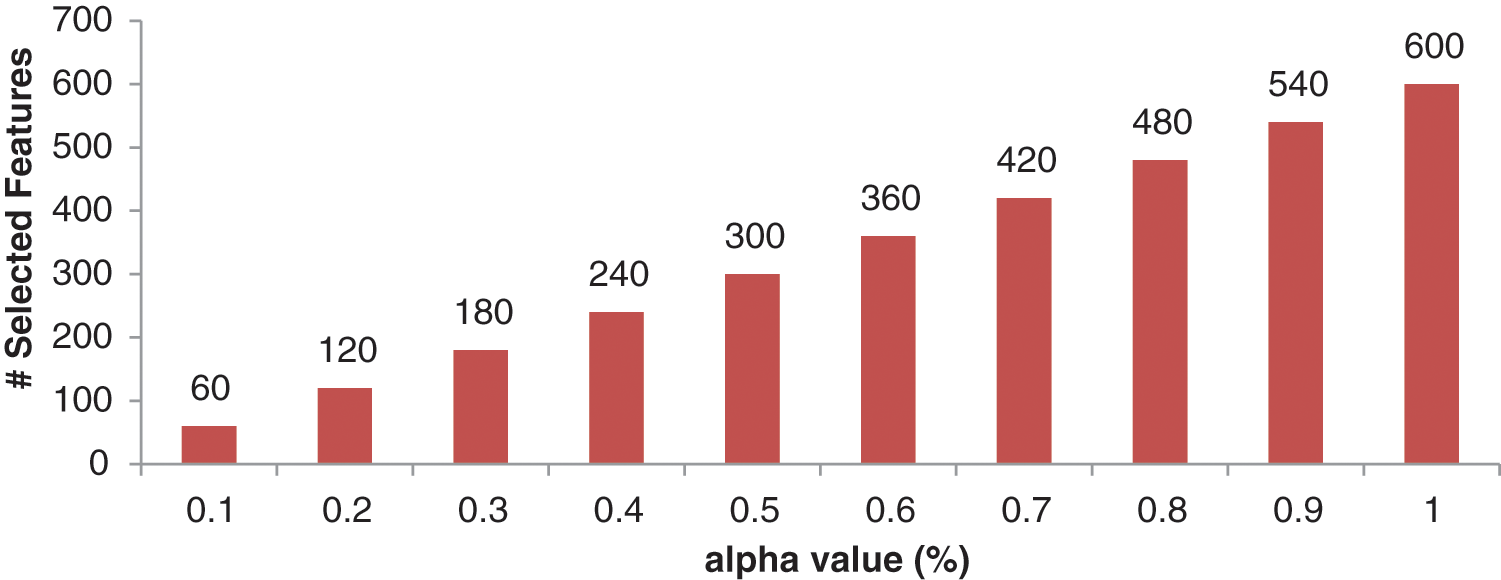
Figure 9: Number of optimized features for different
It can be observed from Fig. 8 that the best combination of (0.8, 0.2) corresponding to (
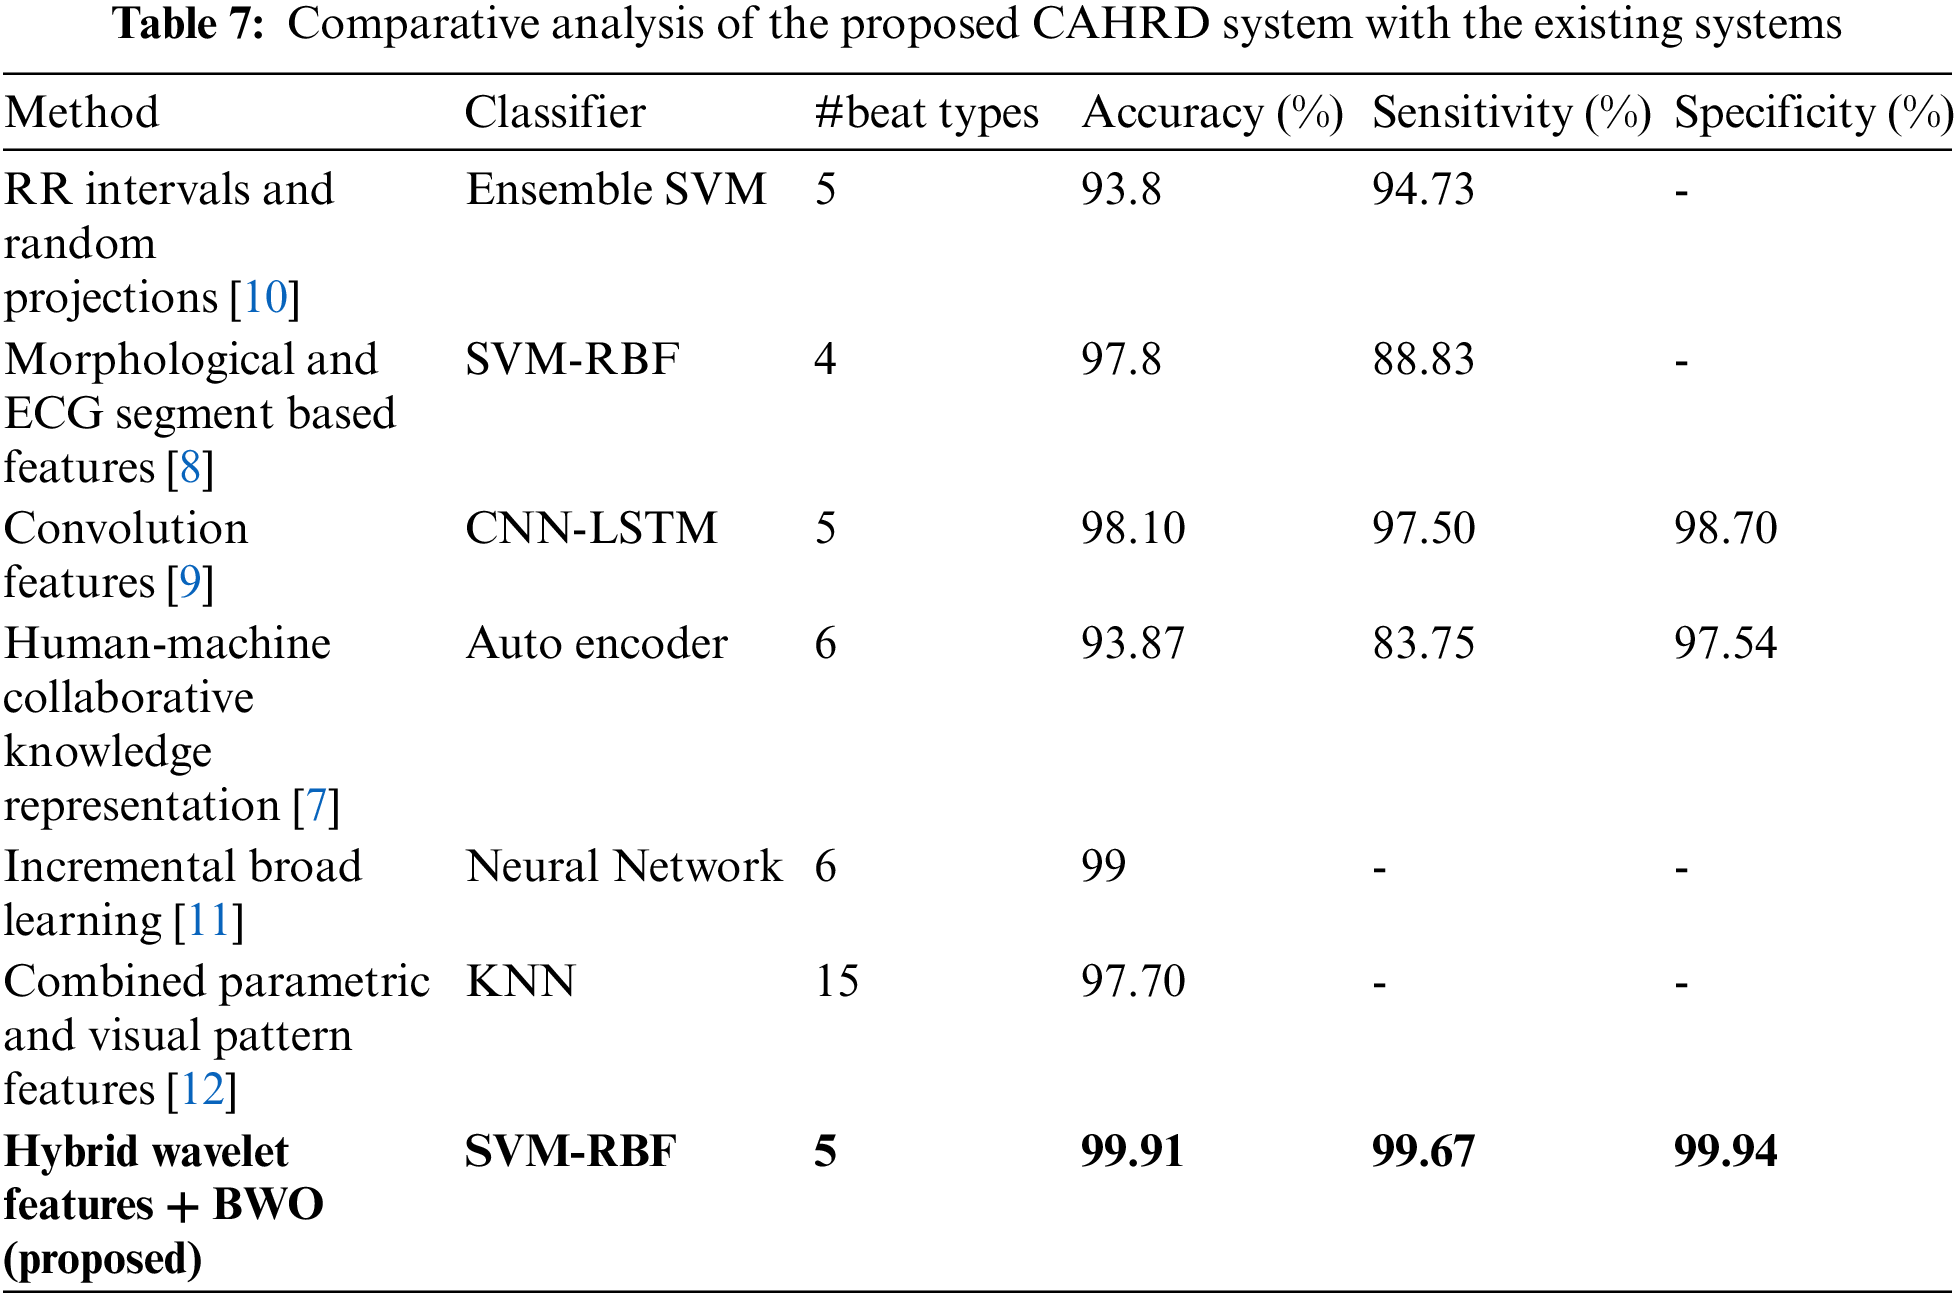
The proposed CAHRD system designed in this paper is a classification system, that aims to use ECG signals to determine whether a newly presenting patient has any abnormal heartbeats. After preprocessing the ECG signal, each ECG segment is described using a feature vector consisting of hybrid wavelet coefficients at a predefined decomposition level. The hybrid features are optimized using BWO techniques and kernel SVMs such as linear, polynomial and RBF are employed for the classification. The MIT-BIH provides an ideal dataset for arrhythmia classification due to its diversity and large size. This study utilizes the entire database for performance evaluation. The proposed CAHRD system reports average accuracy of 99% for discriminating between 5 different heartbeat rhythms using 2nd level hybrid wavelet features with RBF kernel based SVM. Automated ECG signal classification could provide an additional diagnostic support along with the traditional diagnostic systems for clinicians. The proposed CAHRD system uses BWO as an optimization technique and the main limitation of this work is that the Atrial (Premature) samples used in this study is very few compared to other types of abnormal heartbeats. The proposed system can be adopted in the future with different optimization techniques such as self organizing migrating algorithm and memetic algorithms for feature selection and a more balanced database can be used to achieve a near-perfect classification system.
Funding Statement: The authors received no specific funding for this study.
Conflicts of Interest: The authors declare that they have no conflicts of interest to report regarding the present study.
References
1. M. Alfaras, M. C. Soriano and S. Ortín, “A fast machine learning model for ECG-based heartbeat classification and arrhythmia detection,” Frontiers in Physics, vol. 7, pp. 103–112, 2019. [Google Scholar]
2. R. Vijaya Arjunan, “ECG signal classification based on statistical features with SVM classification,” International Journal of Advances in Signal and Image Sciences, vol. 2, no. 1, pp. 5–10, 2016. [Google Scholar]
3. B. M. Asl, S. K. Setarehdan and M. Mohebbi, “Support vector machine-based arrhythmia classification using reduced features of heart rate variability signal,” Artificial Intelligence in Medicine, vol. 44, no. 1, pp. 51–64, 2008. [Google Scholar] [PubMed]
4. M. H. Song, J. Lee, S. P. Cho, K. J. Lee and S. K. Yoo, “Support vector machine based arrhythmia classification using reduced features,” International Journal of Control, Automation, and Systems, vol. 3, no. 4, pp. 571–579, 2005. [Google Scholar]
5. S. N. Yu and Y. H. Chen, “Electrocardiogram beat classification based on wavelet transformation and probabilistic neural network,” Pattern Recognition Letters, vol. 28, no. 10, pp. 1142–1150, 2007. [Google Scholar]
6. S. N. Yu and K. T. Chou, “Integration of independent component analysis and neural networks for ECG beat classification,” Expert Systems with Applications, vol. 34, no. 4, pp. 2841–2846, 2008. [Google Scholar]
7. J. Wang, R. Li, R. Li, B. Fu, C. Xiao et al., “Towards interpretable arrhythmia classification with human-machine collaborative knowledge representation,” IEEE Transactions on Biomedical Engineering, vol. 68, no. 7, pp. 2098–2109, 2021. [Google Scholar] [PubMed]
8. W. Zhu, X. Chen, Y. Wang and L. Wang, “Arrhythmia recognition and classification using ECG morphology and segment feature analysis,” IEEE/ACM Transactions on Computational Biology and Bioinformatics, vol. 16, no. 1, pp. 131–138, 2019. [Google Scholar] [PubMed]
9. S. L. Oh, E. Y. Ng, R. San Tan and U. R. Acharya, “Automated diagnosis of arrhythmia using combination of CNN and LSTM techniques with variable length heart beats,” Computers in Biology and Medicine, vol. 102, pp. 278–287, 2018. [Google Scholar] [PubMed]
10. H. Huang, J. Liu, Q. Zhu, R. Wang and G. Hu, “A new hierarchical method for inter-patient heartbeat classification using random projections and RR intervals,” Biomedical Engineering Online, vol. 13, no. 1, pp. 90–98, 2014. [Google Scholar] [PubMed]
11. J. Li, Y. Zhang, L. Gao and X. Li, “Arrhythmia classification using biased dropout and morphology-rhythm feature with incremental broad learning,” IEEE Access, vol. 9, pp. 66132–66140, 2021. [Google Scholar]
12. H. Yang and Z. Wei, “Arrhythmia recognition and classification using combined parametric and visual pattern features of ECG morphology,” IEEE Access, vol. 8, pp. 47103–47117, 2020. [Google Scholar]
13. Y. Li, Z. Zhang, F. Zhou, Y. Xing, J. Li et al., “Multi-label classification of arrhythmia for long-term electrocardiogram signals with feature learning,” IEEE Transactions on Instrumentation and Measurement, vol. 70, pp. 1–11, 2021. [Google Scholar]
14. G. B. Moody and R. G. Mark, “The impact of the MIT-BIH arrhythmia database,” IEEE Engineering in Medicine and Biology Magazine, vol. 20, pp. 45–50, 2001. [Google Scholar] [PubMed]
15. G. B. Moody and R. G. Mark, “MIT-BIH database,” [Online]. Available: http://www.physionet.org/physiobank/database/mitdb/ [Google Scholar]
16. A. L. Goldberger, L. A. Amaral, L. Glass, J. M. Hausdorff, P. C. Ivanov et al., “PhysioBank, PhysioToolkit, and PhysioNet: Components of a new research resource for complex physiologic signals,” Circulation, vol. 101, no. 23, pp. e215–220, 2000. [Google Scholar] [PubMed]
17. J. Pan and W. J. Tompkins, “A real-time QRS detection algorithm,” IEEE Transactions on Biomedical Engineering, vol. BME-32, no. 3, pp. 230–236, 1985. [Google Scholar]
18. S. Mallat, A Wavelet Tour of Signal Processing. Cambridge, Massachusetts, United States: Elsevier, 1999. [Google Scholar]
19. A. R. Venmathi, E. N. Ganesh and N. Kumaratharan, “Hybrid wavelet features for the classification of microcalcification clusters in digital mammograms,” Journal of Computational and Theoretical Nanoscience, vol. 14, no. 4, pp. 1714–1723, 2017. [Google Scholar]
20. V. Hayyolalam and A. A. Kazem, “Black widow optimization algorithm: A novel meta-heuristic approach for solving engineering optimization problems,” Engineering Applications of Artificial Intelligence, vol. 87, pp. 1–17, 2020. [Google Scholar]
21. Y. B. Bakare and M. Kumarawsamy, “Histopathological image analysis for oral cancer classification by support vector machine,” International Journal of Advances in Signal and Image Sciences, vol. 2, no. 1, pp. 5–10, 2016. [Google Scholar]
22. G. Jayandhi, J. Leena Jasmine and S. Mary Joans, “Mammogram learning system for breast cancer diagnosis using deep learning svm,” Computer Systems Science and Engineering, vol. 40, no. 2, pp. 491–503, 2022. [Google Scholar]
Cite This Article
 Copyright © 2023 The Author(s). Published by Tech Science Press.
This work is licensed under a Creative Commons Attribution 4.0 International License , which permits unrestricted use, distribution, and reproduction in any medium, provided the original work is properly cited.
 Downloads
 Citation Tools