
 Submit a Paper
 Propose a Special lssue
 Open Access
ARTICLE

Analysis of Tourism Demand Difference Based on Data Mining and Intelligent Analysis
1 Economic Management Department, Maoming Polytechnic, Maoming, 525000, China
2 School of Hospitality and Tourism, Taylor’s University, Selangor, 47500, Malaysia
* Corresponding Author: Peng Cheng. Email:
Journal on Big Data 2023, 5, 69-84. https://doi.org/10.32604/jbd.2023.046294
Received 01 September 2023; Accepted 04 October 2023; Issue published 24 November 2023
 View Full Text
 Download PDF
Abstract
To serve as a reference for future foreign tourism study, relevant tourist sectors have done in-depth investigations on foreign tourism both domestically and internationally. A study of outbound tourism activities from the viewpoint of tourists can examine its development law and create successful marketing tactics based on the rise in the number of foreign tourists. Based on this, this study suggests a data mining technique to examine the variations in travel needs and marketing tactics among various consumer groups. The combined example analysis demonstrates how logical and useful our data mining analysis is. Our data tests demonstrate that the tourism strategy outlined in this paper can enhance the number of tourists by piquing their interest based on the rise in the number of international travellers travelling overseas.Keywords
In the past decade, GDP has been growing, and the contribution of the tertiary industry to GDP has also shown an upward trend. In 2016–2019, the proportion has basically stabilized at 60%, occupying “half of the GDP”. Among them, tourism had the highest added value, reaching 375.01 billion yuan, accounting for 90.4% of the growth value of tourism and related industries. Looking at the tourism industry in detail, the highest value added is tourism shopping, accounting for 31.4% of the proportion of tourism and related industries; followed by tourism travel, accounting for 26.9%; and then tourism catering, accounting for 13.6% [1,2].
The word “tourism” is becoming more and more popular, from “the world is so big that I want to see”, to “Where to play this weekend”, whether it is a trip abroad, long-distance travel, the city around the range of attractions have become a tourist destination [3]. However, the current systematic research on foreign tourism is still shallow, and the systematic and integrated research on foreign tourism at home and abroad is still in the initial stage [4]. Secondly, previous domestic and international studies have been conducted from the perspectives of traveler behavior, foreign tourism marketing, and Sino-foreign relations, which are longitudinal comparisons between respondent groups, but lack horizontal comparisons and differences between cluster groups, and the research perspective has certain limitations [5].
Big data technology is now being widely used in a variety of industries as technology advances. Big data technology, which has become one of the primary techniques of data processing, can extract the information that humans need to utilise from a massive amount of data information thanks to its strong intelligent analysis and data mining skills. Focus should be placed on advancing the study of big data intelligent analysis and data mining by the appropriate individuals.
Nowadays, technicians mostly employ social computing, data analysis, deep learning data pre-processing, etc., as big data mining techniques. The fields of computer vision and natural language processing are the two most common applications for deep learning in big data mining. Data pre-processing can quickly eliminate data about unusual issues, format data, and apply association rules. The link between things and items can be examined using big data mining techniques, While outlier group big data mining is frequently used in the disciplines of intelligent transportation management and biomedicine, big data outlier mining is typically utilised in meteorological analysis and user privacy protection. Technicians have used new large data mining technologies, which properly extract critical information from massive amounts of data and process data mining more efficiently.
Therefore, this study combines motivation theory and conducts a comprehensive analysis from the research perspective of both supply and demand, focusing on both the restrictive factors that influence travelers’ decision to travel abroad, with particular attention to the impact of fluctuations in Sino-foreign relations on travel abroad, while providing corresponding marketing advice to different perceived groups from a marketing perspective [6]. Secondly, this study selects community residents in East and West China as the research object, and clusters them according to their perceptions of restrictive factors, Sino-foreign relations, and marketing strategies for traveling abroad, and analyzes the differences between community residents with different dimensions according to the demographic characteristics between different clustered groups, which can effectively understand the new requirements of domestic community residents for traveling abroad [7]. Meanwhile, this study draws on the proven analytical methods in the field of data mining to model the needs of tourism groups in order to obtain more accurate and efficient marketing strategy planning and make a strong contribution to the tourism industry [8].
They conducted a descriptive study in [9] on the phenomenon of Chinese tourists going abroad to make explosive purchases, and used in-depth interviews to investigate the reasons for Chinese tourists going abroad to make explosive purchases by using foreign duty-free store managers, foreign teachers and duty-free store clerks. Reference [10] taking the impact of crisis event occurrence on tourists’ perceived image as the research content, we borrowed the 3–11 earthquake in foreign countries as the research case event, so as to compile the factors affecting the change of tourism perceived image and the main measures to enhance tourism perceived image after the earthquake, and make suggestions on crisis event initiatives in terms of information transparency, preferential initiatives and media effects. Reference [11] taking inbound tourism flow as the focus of the study, the empirical study analyzes the diffusion path of tourism flow from three dimensions: source, transit, and destination, and analyzes the inbound tourism flow driving model from the perspective of source, transit, and destination at three levels: individual tourist, tourism industry supply, and city macro, respectively, and concludes that tourism flow is influenced by three-dimensional forces as well as destination city preference, city question tightness, two-way flow imbalance, diffusion path ways and other related research findings. Foreign countries on the number and growth rate of tourists from mainland China to foreign countries from 2005 to 2015 [12], and the comparative study analyzed that the changes in the number of tourists studied showed characteristics such as large scale, high proportion, heavy status and fluctuation and accordingly, it is divided into three development periods such as stable growth, fluctuating growth, and blowout growth. Using content information mining from travel blogs [13], the study focuses on three topics: foreign region identification, tourist attraction identification, and keyword detection. Research conclusions are drawn about the most popular tourist destinations and the most frequently occurring keywords for various country groups using methods such as morphological analysis and word frequency-inverse document frequency analysis. A study on the impact of crisis events on tourism image was conducted to investigate the change in Taiwanese tourists' intention and behaviour in travelling abroad for outbound tourism in the case of the Fukushima nuclear disaster that broke out abroad on March 11, 2011, by setting four influencing factors [14], i.e., concern about going abroad, health consciousness, concern about the disaster, and anxiety about information gathering, a study was conducted on the issue of the impact of crisis events on tourism image to explore the change of Taiwanese tourists’ intention and behavior in going abroad for outbound tourism in the case of the Fukushima nuclear disaster that broke out abroad on March 11, 2011. Reference [15] using the Shiretoko Peninsula in Northeastern Hokkaido, a foreign country as the scope of study, we used multivariate logical analysis as the key point of study to dig deeper into the demographic characteristics and expectations of tourists in ecotourism destinations, motivation and actual dissatisfaction and loyalty behavior generated. Reference [16] used foreign inbound Korean tourists as the research object and focused on the issue of the role played by tourism prices in attracting inbound tourism consumption factors, and developed inbound demand models for six price indicators and predicted the most effective price indicators for outbound tourism demand in terms of economic indices such as relative prices, proxy exchange rates, fuel price transportation costs, jet fuel costs, effective relative prices, and real exchange rates, respectively.
An innovative overview of Sino-foreign relations in different periods and the dominant players in Sino-foreign relations in the context of different periods is provided by this study, which combines historical research, documentary research, and comparative research to focus on the development and trends of Sino-foreign relations [17]. In turn, basic judgments are given on the future trends between China and foreign countries, i.e., no war between the two countries, stable economic development, political ups and downs, and increased cultural exchanges between people. Reference [18] taking the new changes in Sino-foreign relations triggered by the “purchase” of the Diaoyu Islands by a foreign government as the introduction to the study, the study started with the intensification of exchanges between China and foreign countries over territorial disputes, maritime rights and interests, and historical legacy perceptions, the continuous “warming” of Sino-foreign economic and trade relations, and the continuous “cooling” of Sino-foreign trade relations. Reference [19] analyzed the trade between China and foreign countries from the perspective of RMB exchange rate, and explored the price transmission of exchange rate on import and export trade from both direct and indirect perspectives, and sorted out the development of RMB exchange rate system and Sino-foreign trade development in four periods since the establishment of China, and established a model to investigate the positive and negative effects from the aspects of elasticity, national income and Sino-foreign trade linkage, and RMB real exchange rate and Sino-foreign trade linkage. The study is conducted in the following way [20] in addition to the basic explanation of the geographical location, economic value and military strategic position of the Diaoyu Islands, the study also describes the historical background of the Diaoyu Islands by China, the United States and Japan, respectively, and analyzes the three countries objectively according to their strategic motives, so as to conclude that the Sino-foreign relations are not optimistic, the Asia-Pacific relations are reorganized and the war will not be triggered in the short term.
3 Analytical Model Based on Data Mining
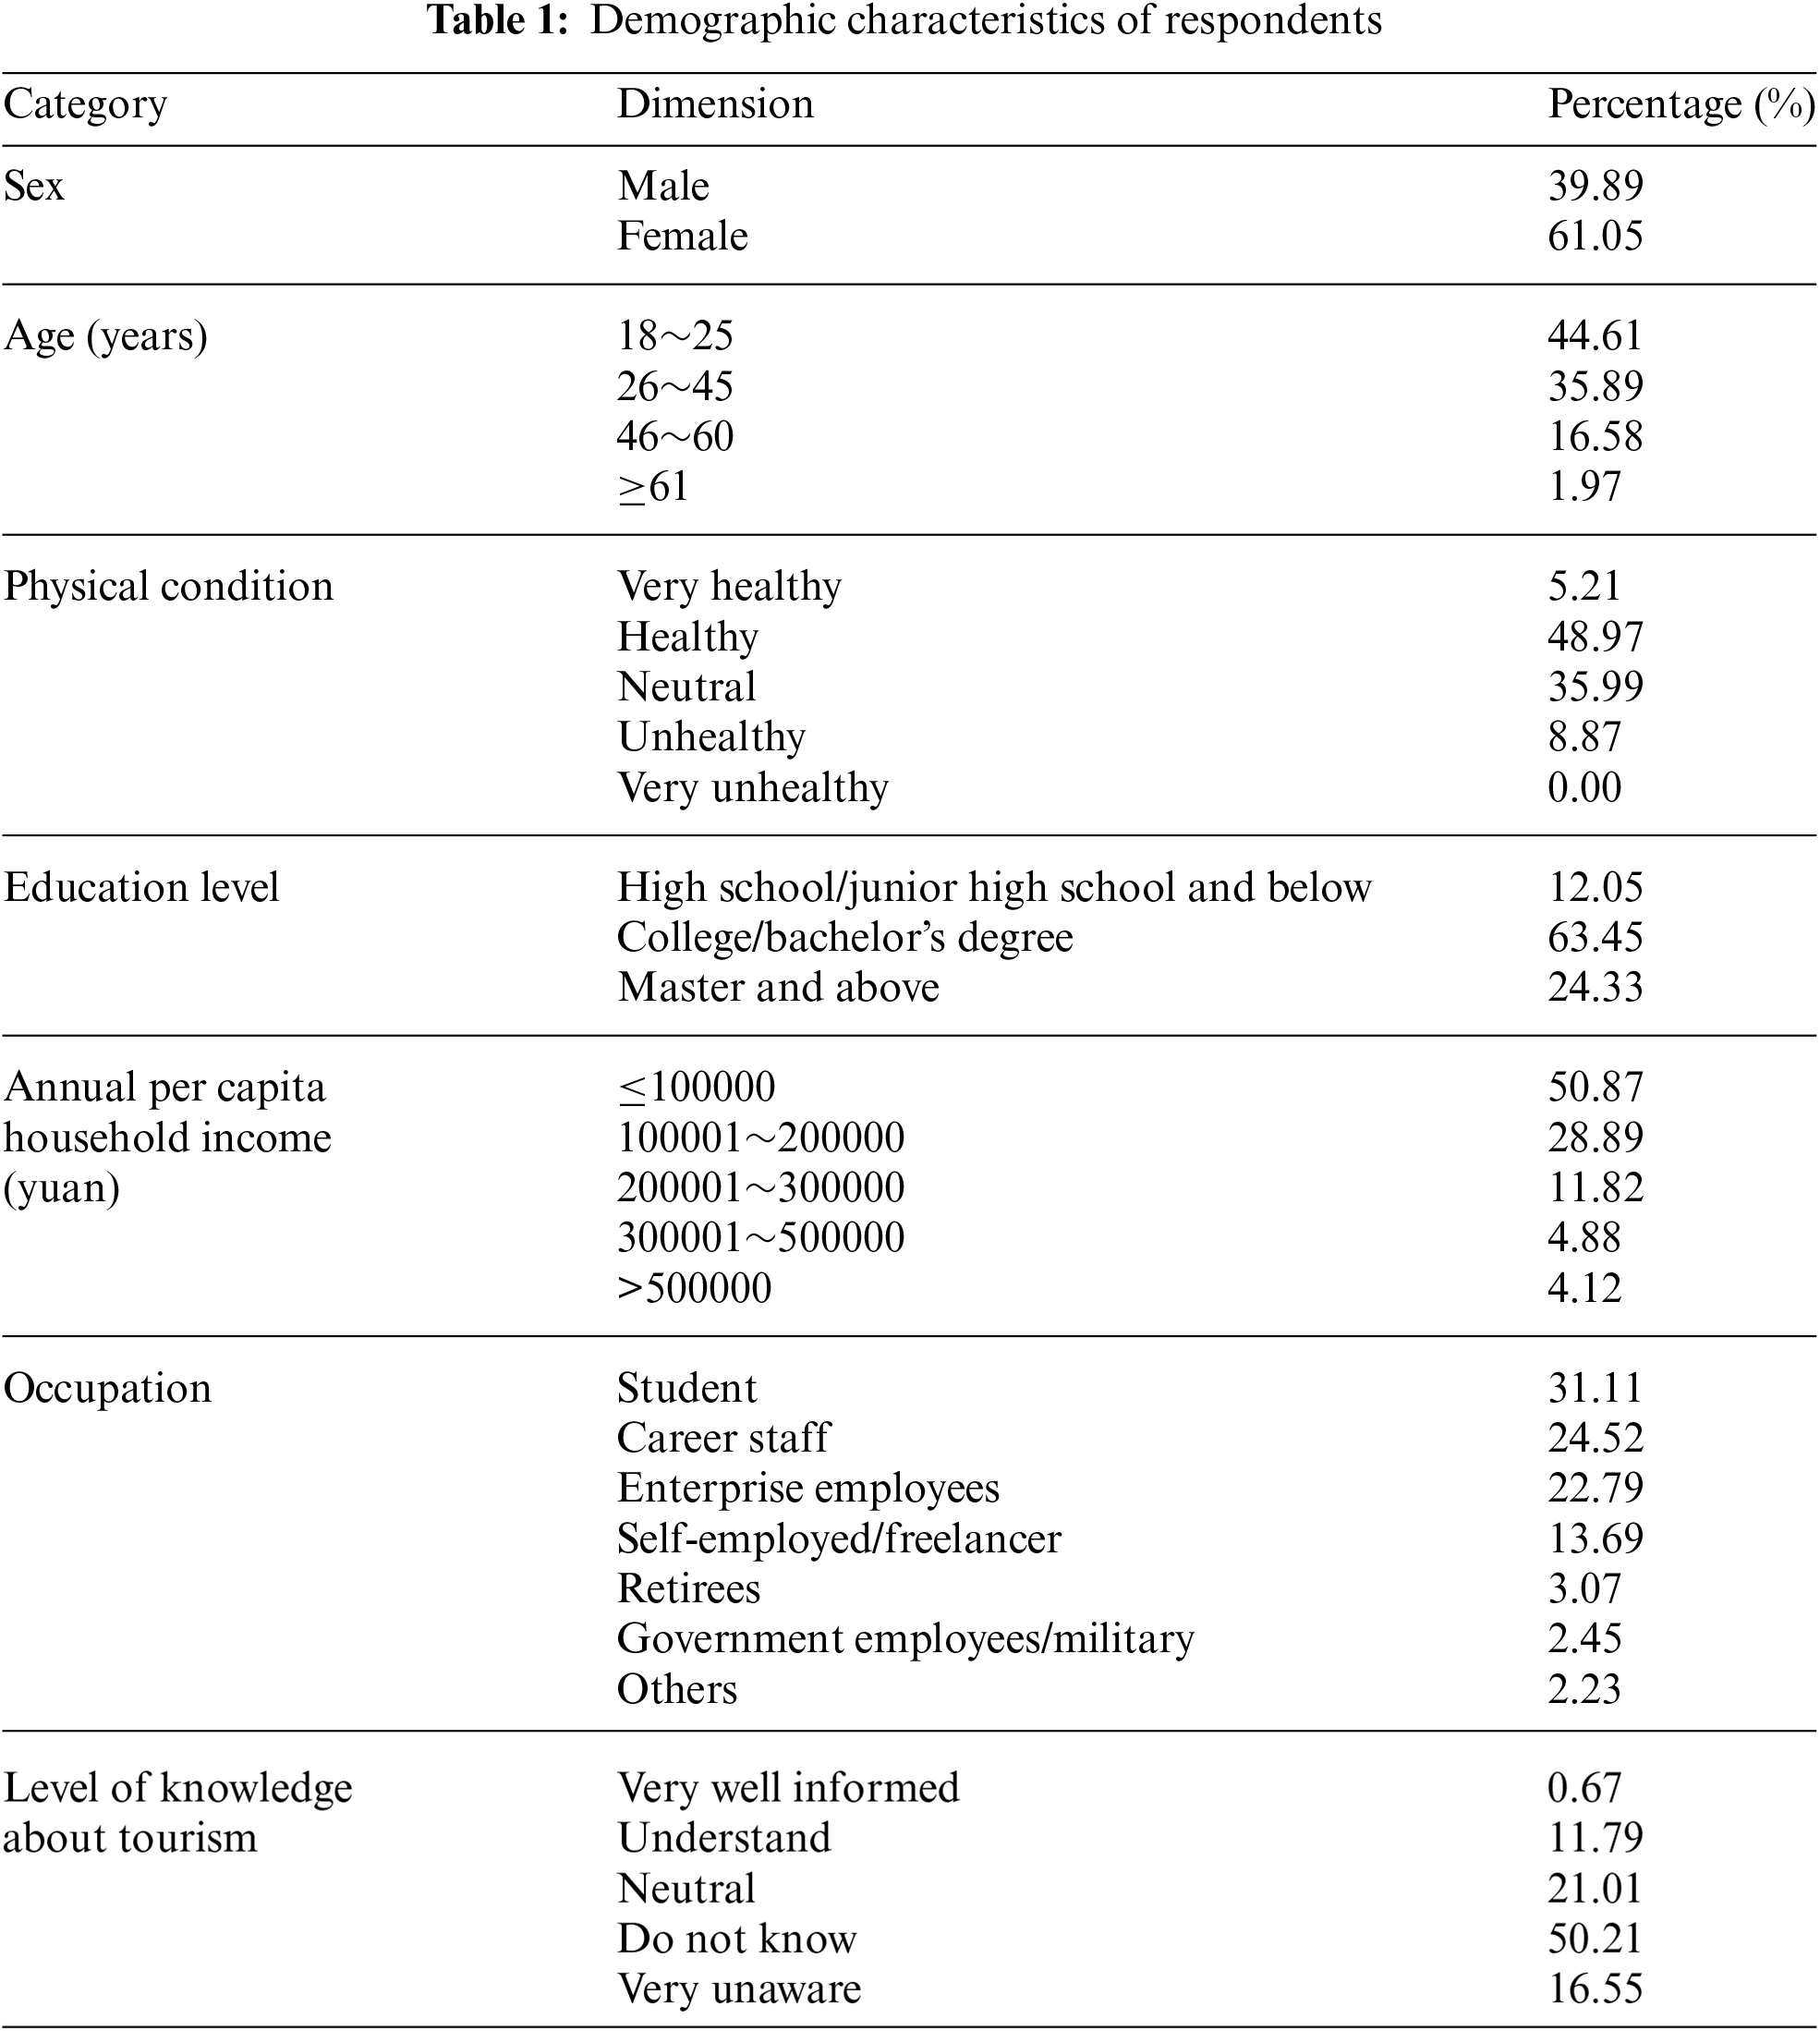
First, we collected and obtained information about the respondents by taking the form of a questionnaire. Specifically, we analyzed the following categories of characteristic information.
3.1 Demographic Characteristics
The 906 valid questionnaires were analyzed in Table 1.
3.2 Analysis of Respondents’ Outbound Travel Needs
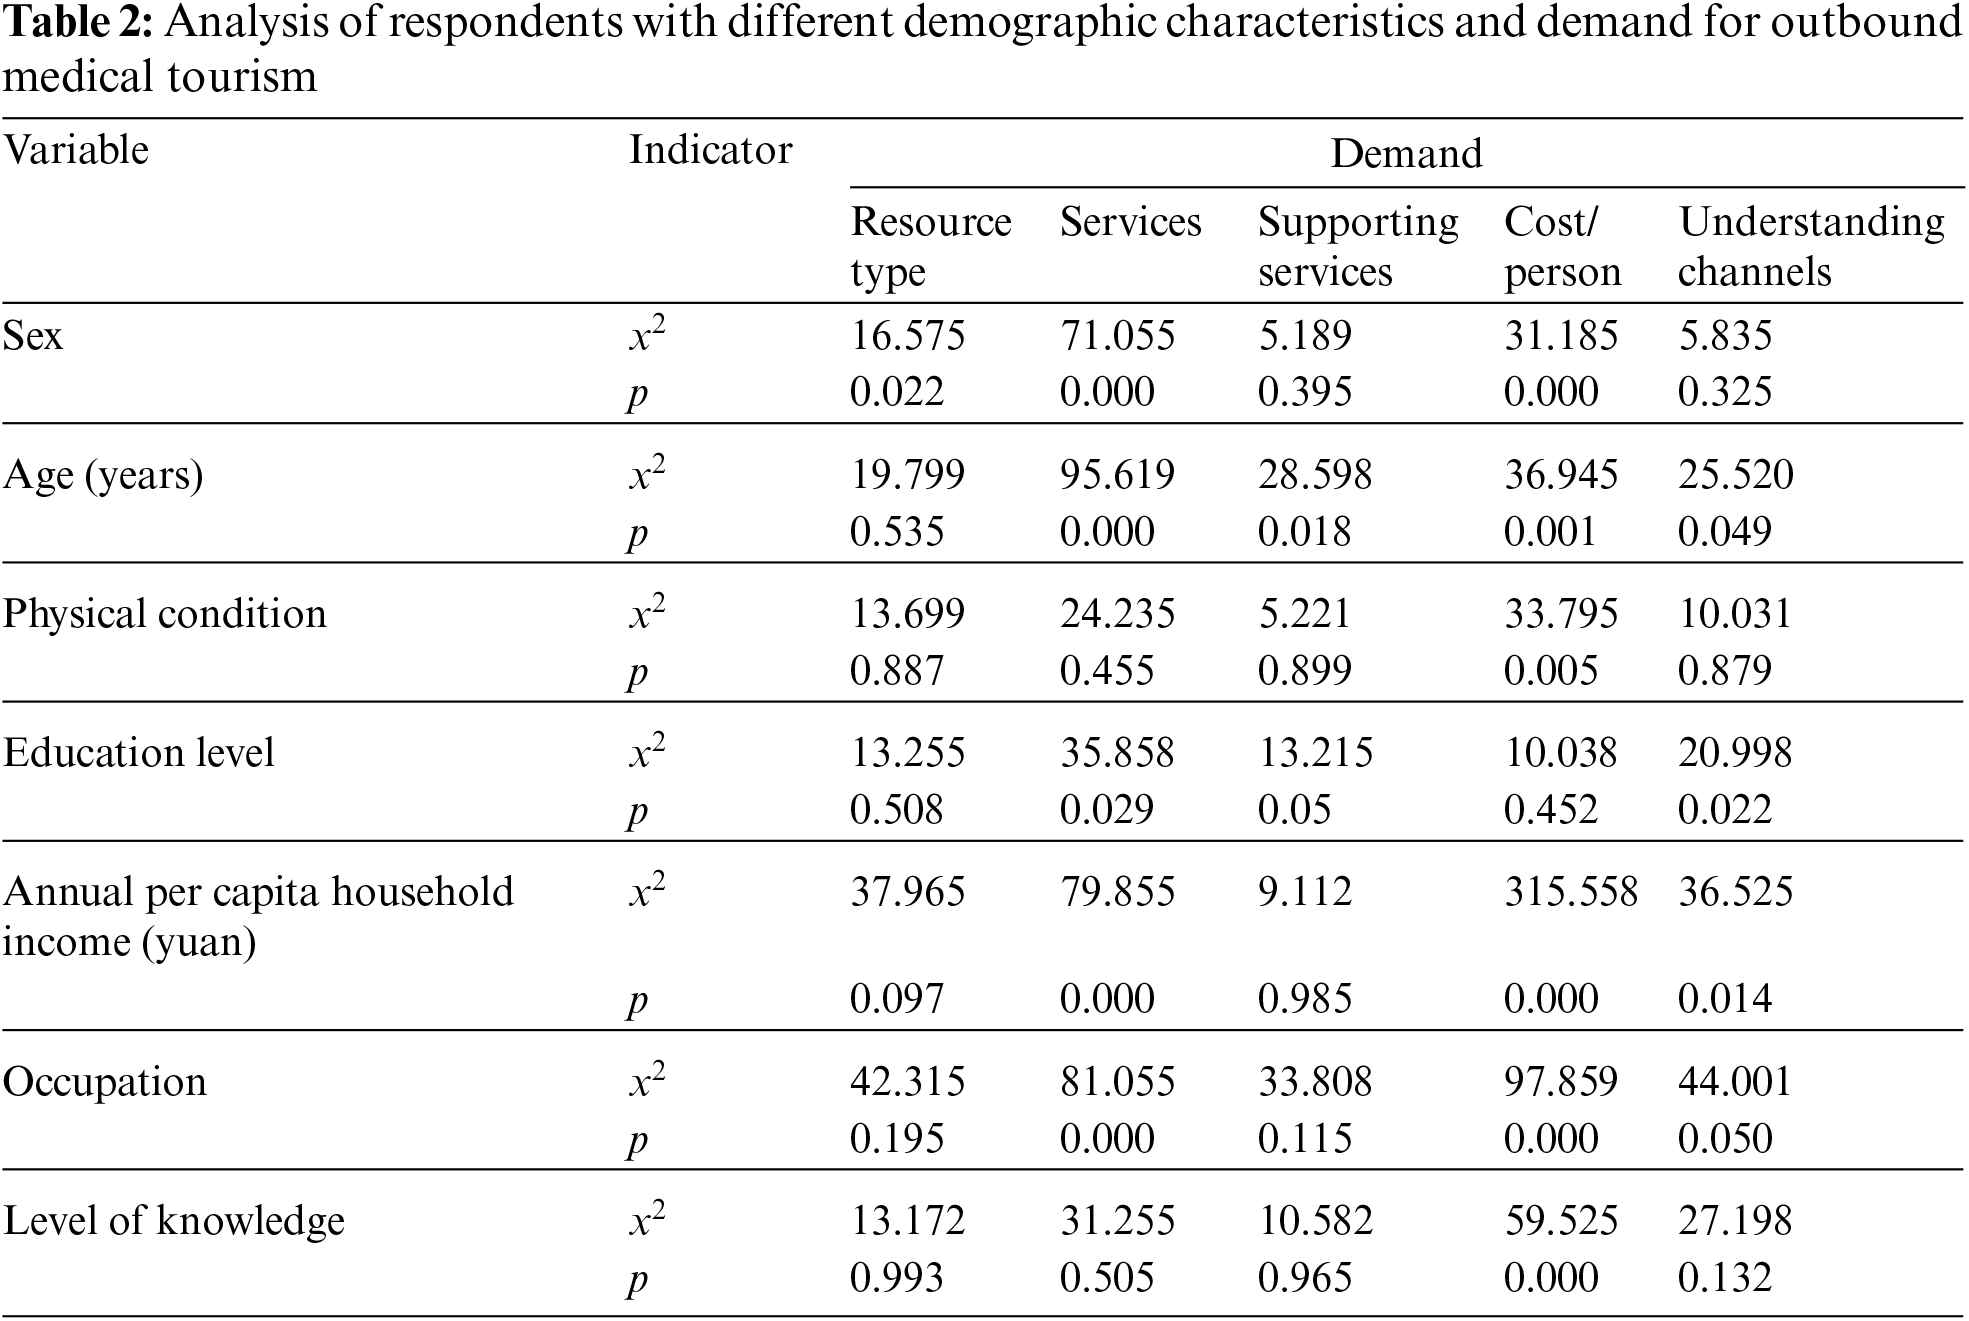
The questions related to tourism demand in this research questionnaire were multiple responses, so the types of overseas tourism resources, expected service items, expected supporting services, single-time per capita cost and channels to learn about overseas tourism information were tested separately with the demographic characteristics of the respondents by chi-square test, and it was found that there were differences in the choices of respondents with different demographic characteristics and the differences were statistically significant (Table 2). Further demand variance analysis was done on the aforementioned contributing factors and demand categories based on statistical significance.
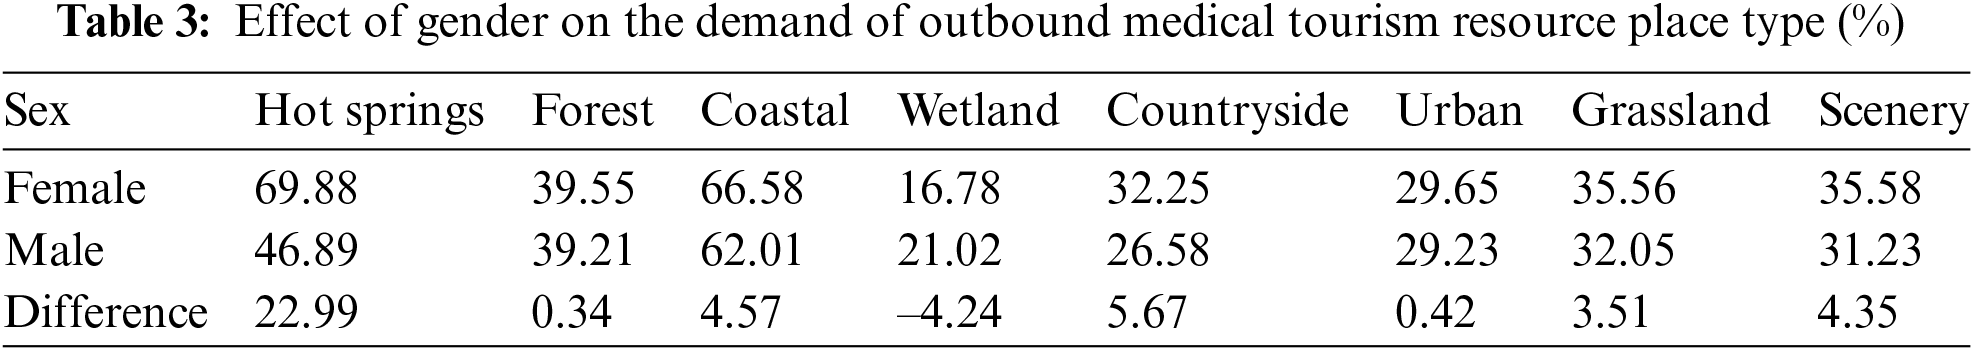
There were differences in the demand for the types of tourism resource places among the respondents of different genders. Frequency analysis of the data shows that the proportion of women choosing hot springs (69.85%) is significantly higher than that of men (46.96%), which is consistent with the data published by the China Hot Spring Tourism Network. Women chose wetlands at a slightly lower rate than men did, but they preferred coastal, rural, grassland, and scenic places at a somewhat higher rate than men did; there was no significant difference between men and women for the choice of forests and cities (Table 3).
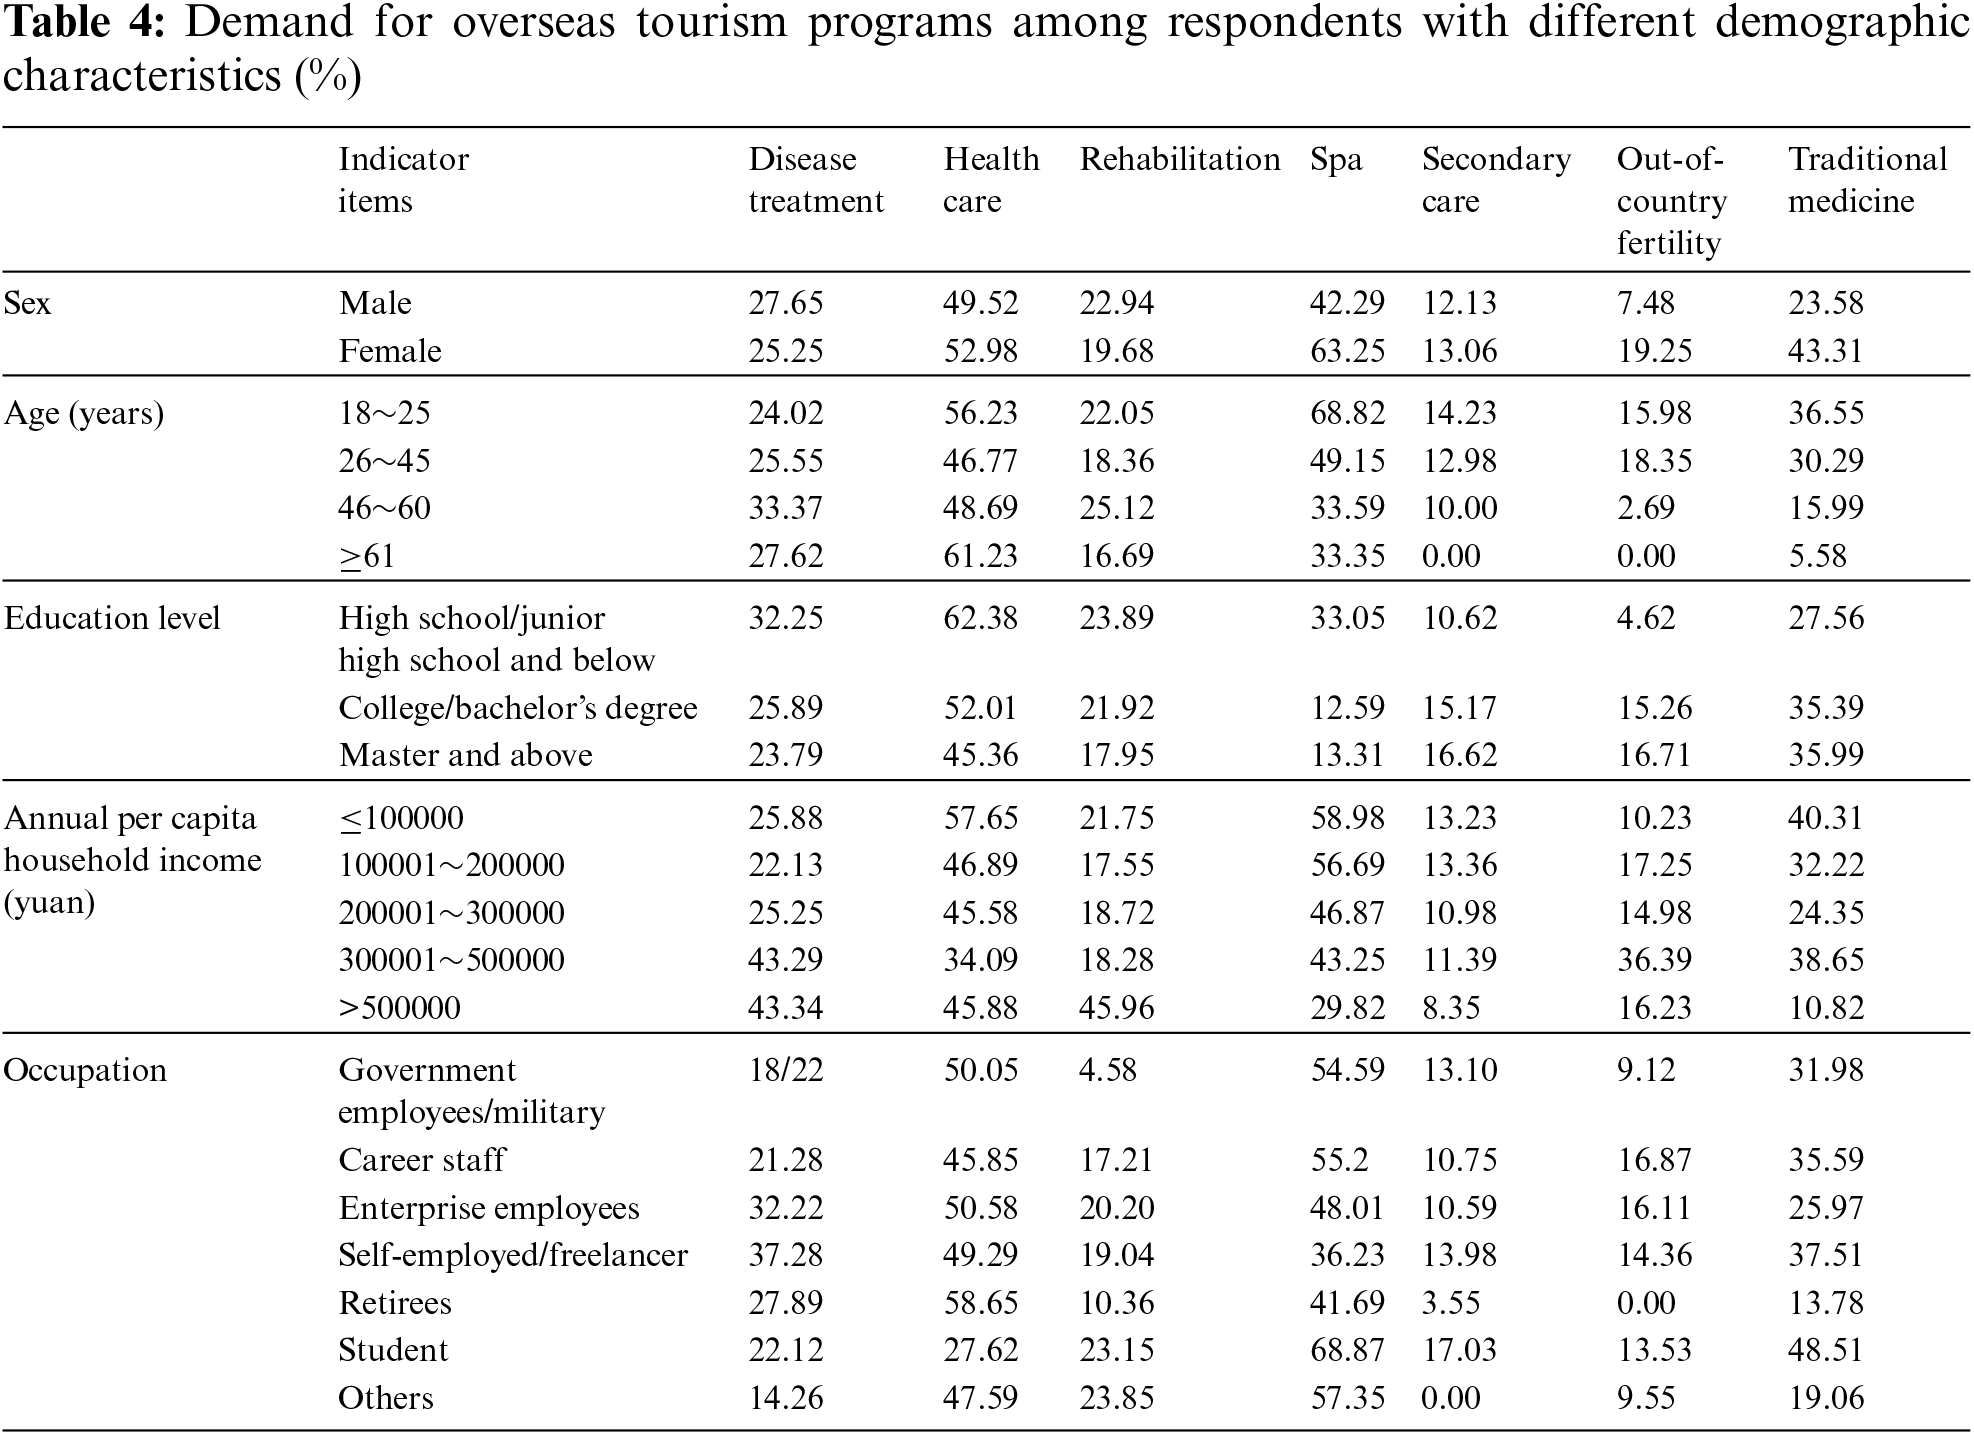
There were differences in the demand for tourism service items among respondents with different demographic characteristics. Respondents’ choice of outbound travel item categories differed by gender, age, education level, per capita annual household income and occupation, with the top three items with the highest proportions being health care, spa and health checkup in that order. The top three outbound trip categories were spa, health checkup, and health & wellness. Age-wise, respondents aged 46 and older opted for health and wellness programmes in greater proportion than other age groups, especially those in the 61+ age bracket. In terms of education level, horizontally, the top 3 items chosen by respondents with high school/junior high school and below and college/bachelor’s degree are health care, health checkup and spa, while those with master’s degree and above are spa, health care and traditional, and the proportion of respondents with high school/junior high school education and below choose health care items is much higher than other items; vertically In the longitudinal perspective, respondents with college/bachelor’s degree and master’s degree and above have a much higher proportion of respondents choosing cosmetic surgery, spa and out-of-state fertility programs than those with high school/junior high school and below. Respondents with an annual per capita household income of $100,000 to $300,000 chose health care, health checkups and hot spring spas as the top three travel items, while respondents with an annual per capita household income of $300,000 or more chose disease treatment items at a significantly higher rate than respondents at other income levels [21,22]. Respondents with an annual per capita household income of RMB 300,000 to 500,000 yuan chose cosmetic surgery and childbirth abroad significantly more than other income groups; no significant differences were found in other items. In terms of occupation, the proportion of government employees/military, institution employees and students choosing health and wellness programs was lower than that of spa spa, while the proportion of people in other occupations choosing health and wellness programs was higher than that of spa spa; the proportion of retired people choosing health and wellness programs was much higher than that of other tourism programs, and the proportion of students choosing both spa and traditional programs was significantly higher than that of other occupational groups (Table 4).
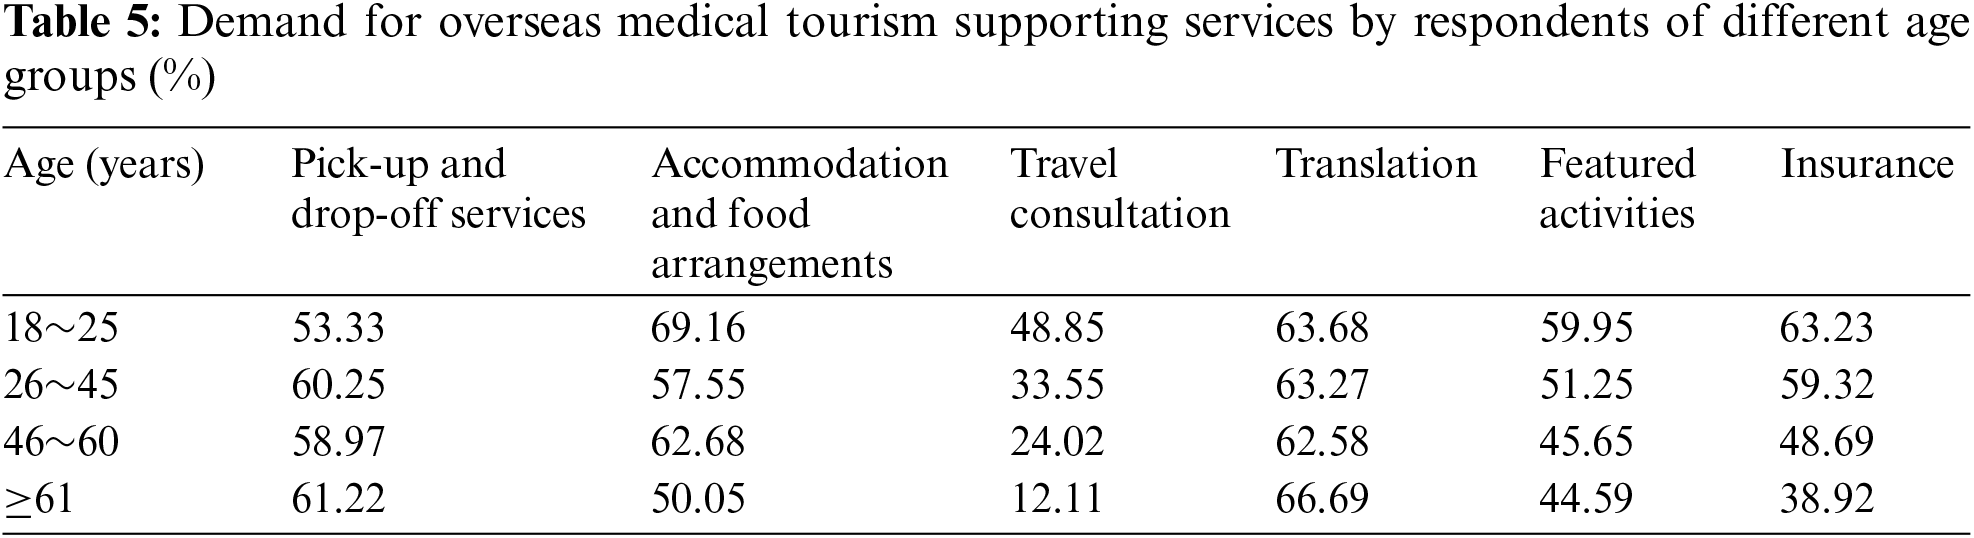
Respondents of different ages have different needs for complementary services. The top three items with the highest proportion of demand for overseas travel support services by age group were translation, accommodation arrangement and transfer services, with translation services ranking among the top three items with the highest proportion of demand by age group and accounting for more than 60% of the total, while travel consultation accounted for the lowest proportion. There are differences in the demand for overseas travel support services among respondents of different age groups, but the overall differences are not significant (Table 5).
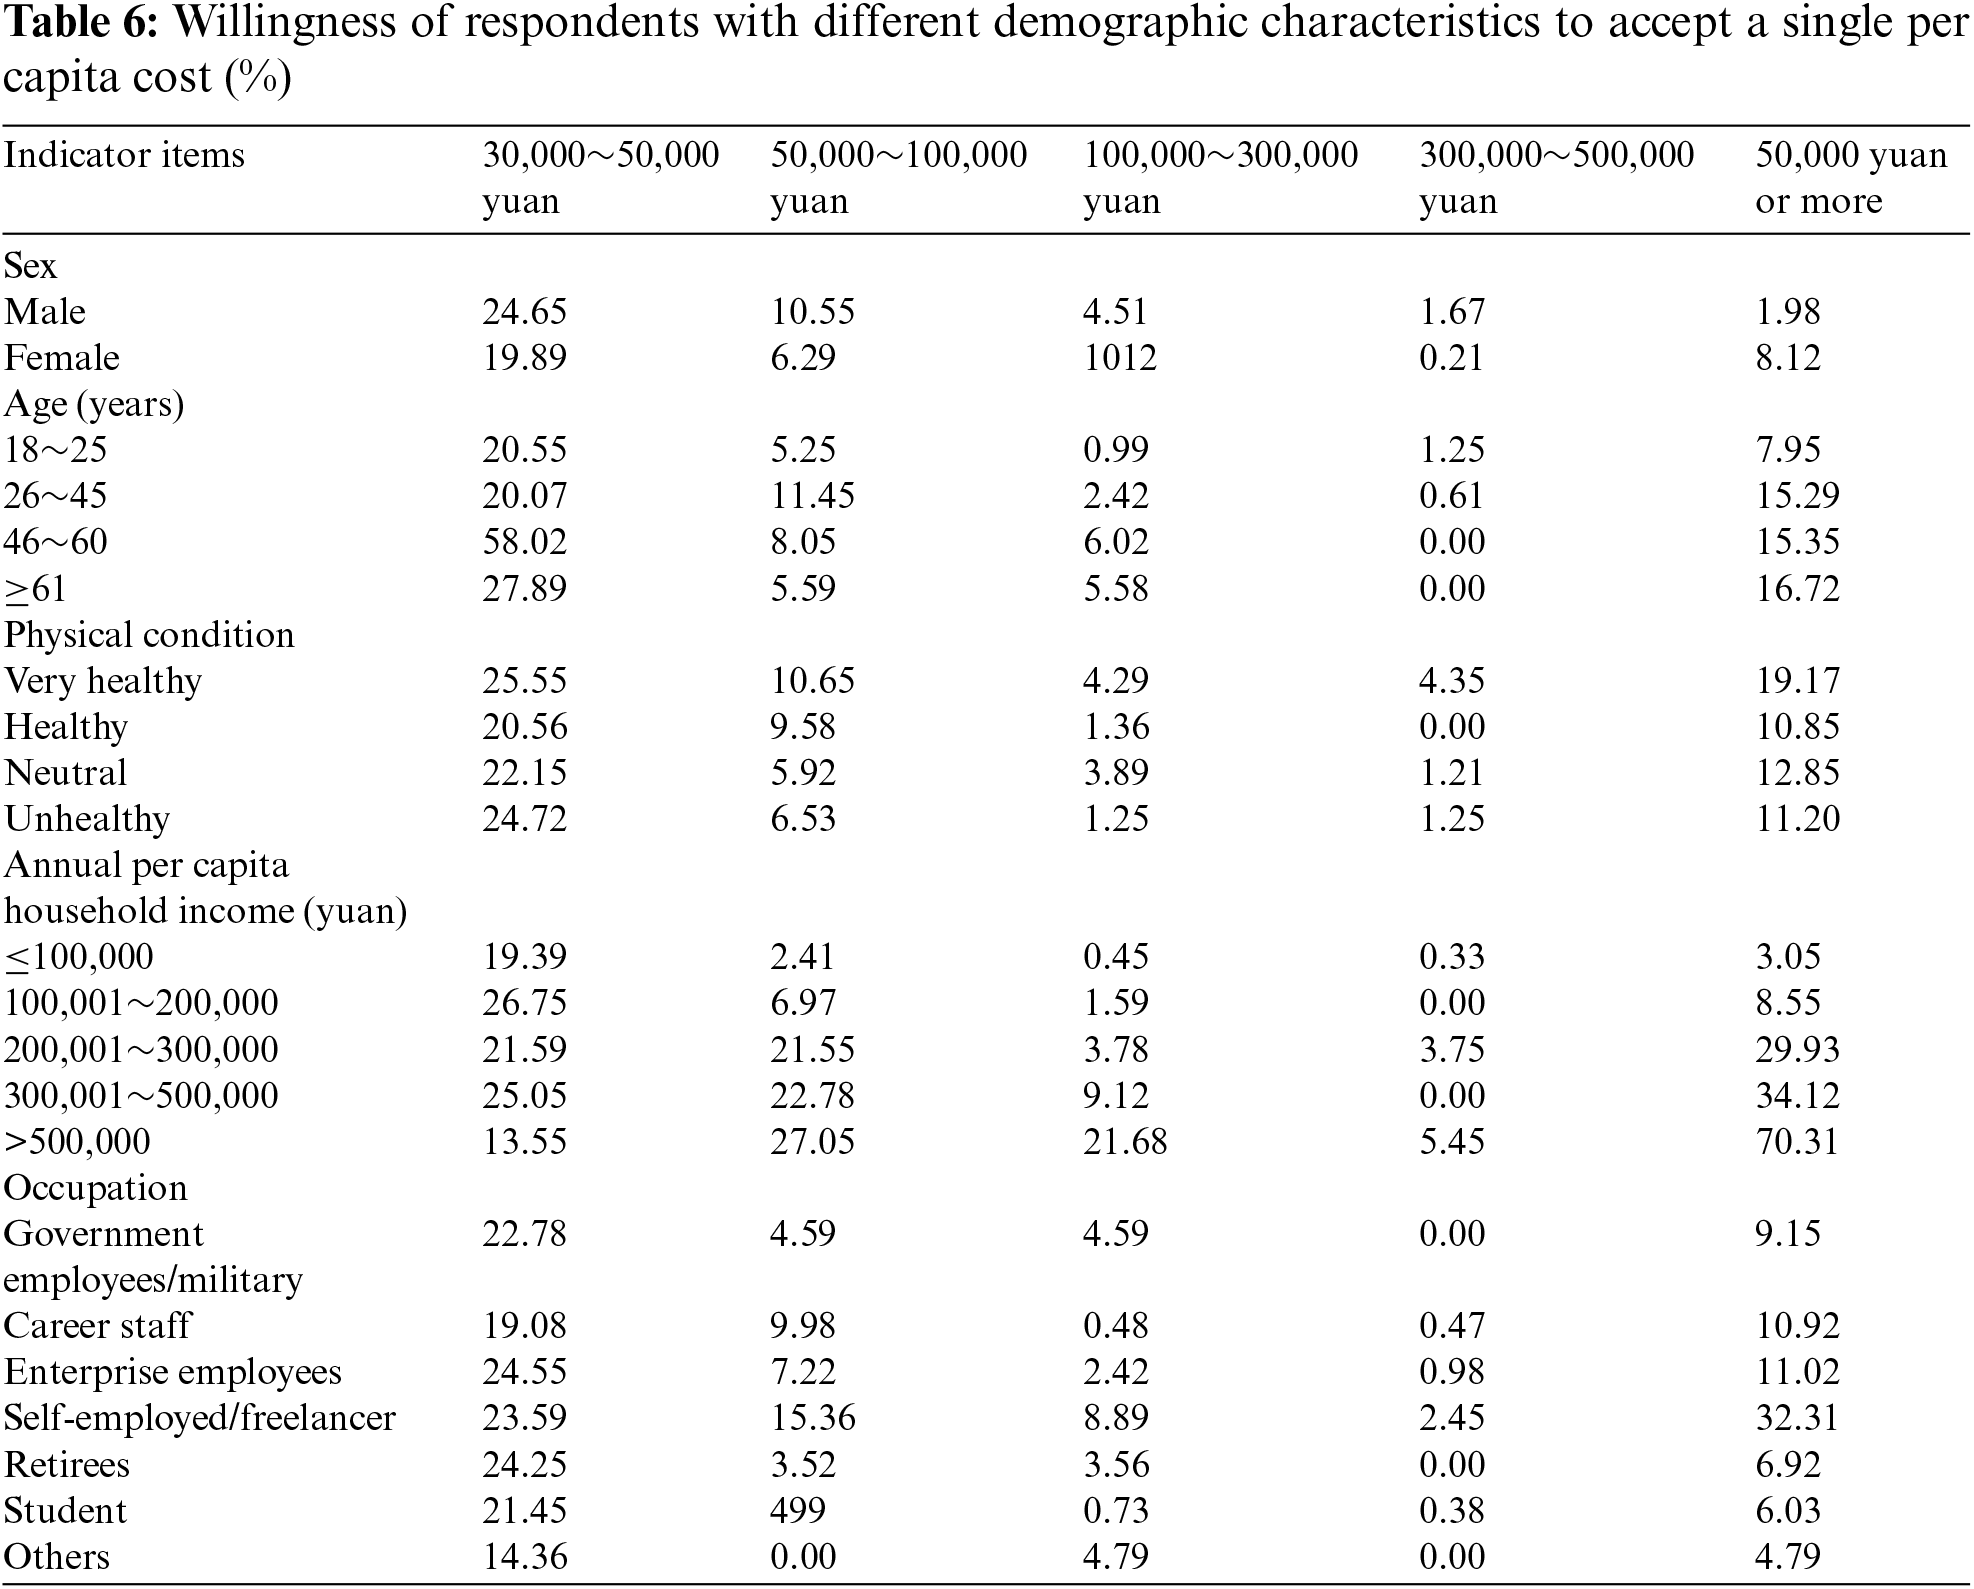
There are differences in the single per capita cost of overseas travel that respondents with different demographic characteristics are willing to accept. There are differences in the single per capita cost of an overseas trip that respondents of different gender, age, physical condition, annual per capita household income and occupation are willing to accept. Except for respondents with an annual per capita household income of 500,000 yuan or more, the proportion of respondents with different demographic characteristics choosing a single trip costing less than 30,000 yuan is significantly higher, and the proportion tends to decrease as the single trip cost increases. Based on demographic characteristics, the proportion of those willing to accept single per capita cost above 50,000 yuan was summarized and found that the proportion of men accepting single per capita cost above 50,000 yuan was significantly higher than that of women; as age and income increased [4], the proportion of those willing to accept single per capita cost above 50,000 yuan increased, and the trend was more obvious in terms of income; in terms of occupation, the proportion of those willing to accept single per capita cost above 50,000 yuan was significantly higher than that of women. In terms of occupation, the top 3 highest proportions were self-employed, employees of enterprises and employees of institutions in order, with the proportion of self-employed choosing much larger than the latter two (Table 6).
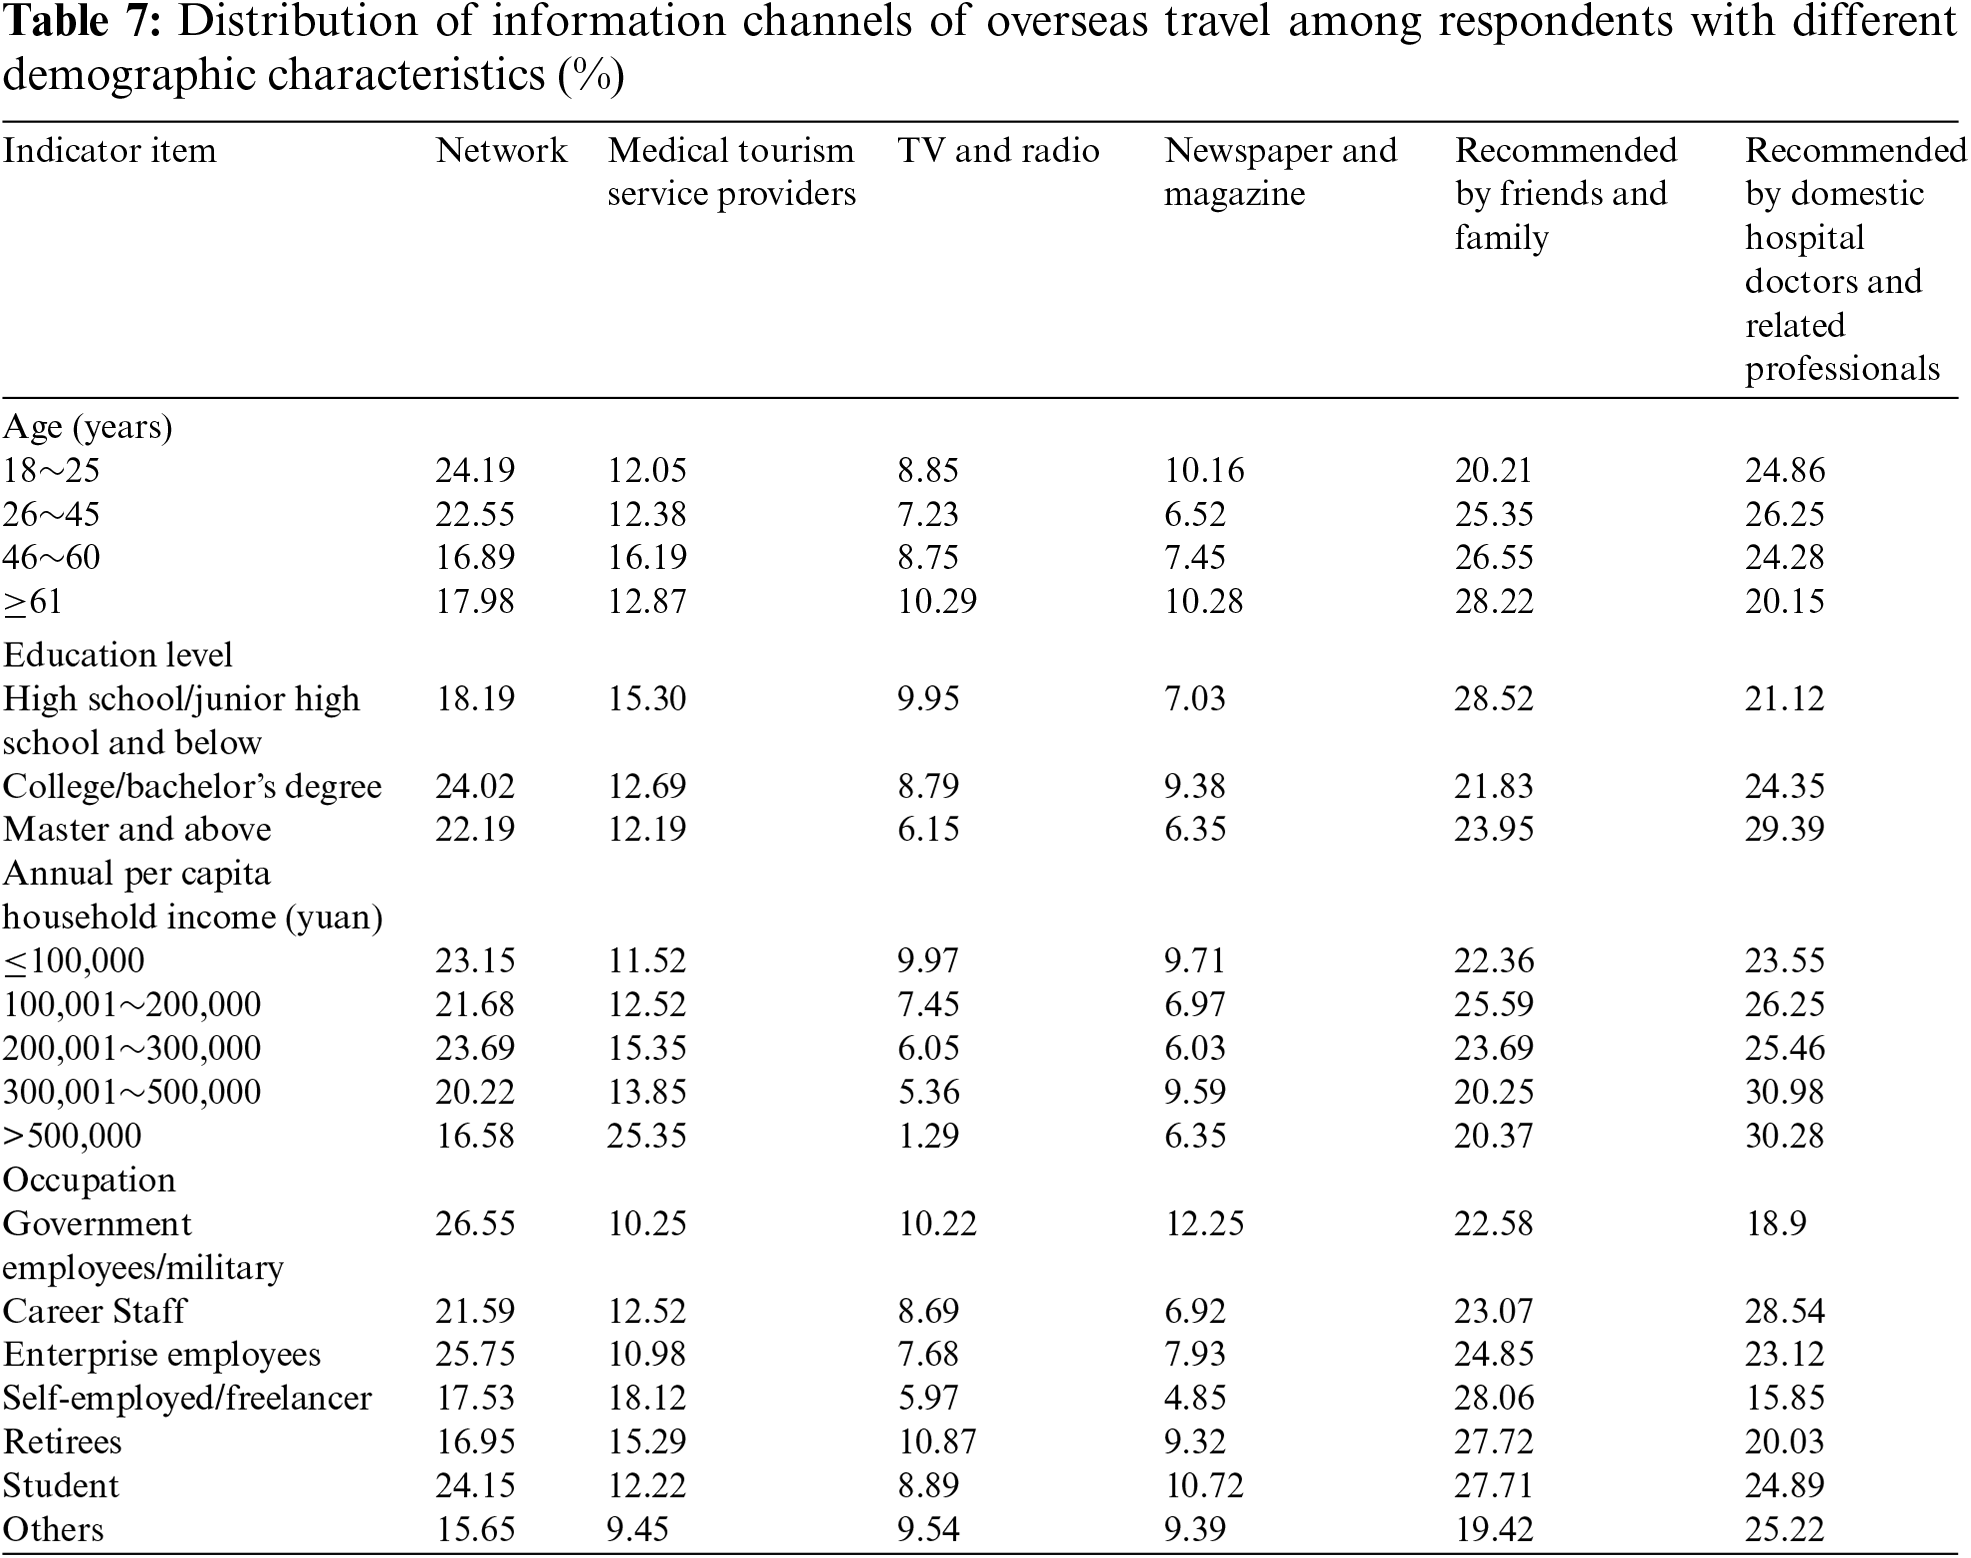
Respondents with different demographic characteristics have different needs for information understanding channels. In terms of information channels for overseas travel, the top three groups with an annual per capita household income of 500,000 RMB or more and those who are self-employed are travel service agencies, recommendations from friends and family, and recommendations from doctors and related professionals in domestic hospitals. The top 3 choices for other demographic characteristics were the Internet, recommendation from friends and family, and recommendation from domestic hospitals and doctors and related professionals, which shows that these 3 channels are currently the main channels for people to learn about overseas travel information, and the 4th place is travel service agencies, while the proportion of respondents choosing traditional TV and radio, newspapers and magazines is low. The proportion of respondents aged 18–25 who learned about overseas travel through the Internet was higher than that of other age groups; the proportion of those who chose to learn about travel through friends and family recommendations also increased as their age increased. In terms of education level, the proportion of respondents with high school/junior high school and below who learned about overseas travel through recommendations from friends and family was higher than that of college/graduate and postgraduate students, while the proportion of those who learned about overseas travel through the Internet and recommendations from doctors and related professionals in domestic hospitals was smaller than that of college/graduate and postgraduate students; the respondents learned about overseas travel through travel service agencies, TV and radio, and newspapers and magazines. Respondents with an annual per capita household income of more than 500,000 RMB were significantly more likely to learn about the information through travel service agencies than those with an annual per capita household income of less than 500,000 RMB, while no significant differences were found among the other channels. Analyzing the top three channels of information and the emerging channels of travel service agencies, the proportion of government employees/military, employees of corporate units and students getting travel information through the Internet is higher than that of other occupations, and the proportion of self-employed, retired and institutional employees getting relevant information through travel service agencies is higher than that of other occupations, and the proportion of self-employed, retired and corporate unit employees getting relevant information through travel service agencies is higher than that of other occupations. Compared to other occupational groups, a higher percentage of students, self-employed people, and retired people get information through recommendations from friends and family and a higher percentage of business unit employees, self-employed people, and retired people get information through recommendations from doctors and other related professionals in domestic hospitals (Table 7).
4.1 Cluster Analysis of Different Consumer Groups’ Perceptions of Restrictive Factors for Traveling Abroad
There is a degree of variation in the perceptions of community resident respondents regarding the limiting factors of travel abroad. In order to determine the segmentation of community residents, this study used cluster analysis to further investigate the reasons for the differences in the perceptions of community resident respondents regarding the limiting factors of travel abroad. The study chose a cluster number value of 3 to classify three types of cluster groups: negative perception type, positive perception type, and neutral perception type [3]. The clustering of the community resident respondents in the three types is shown in Table 8 and Fig. 1.
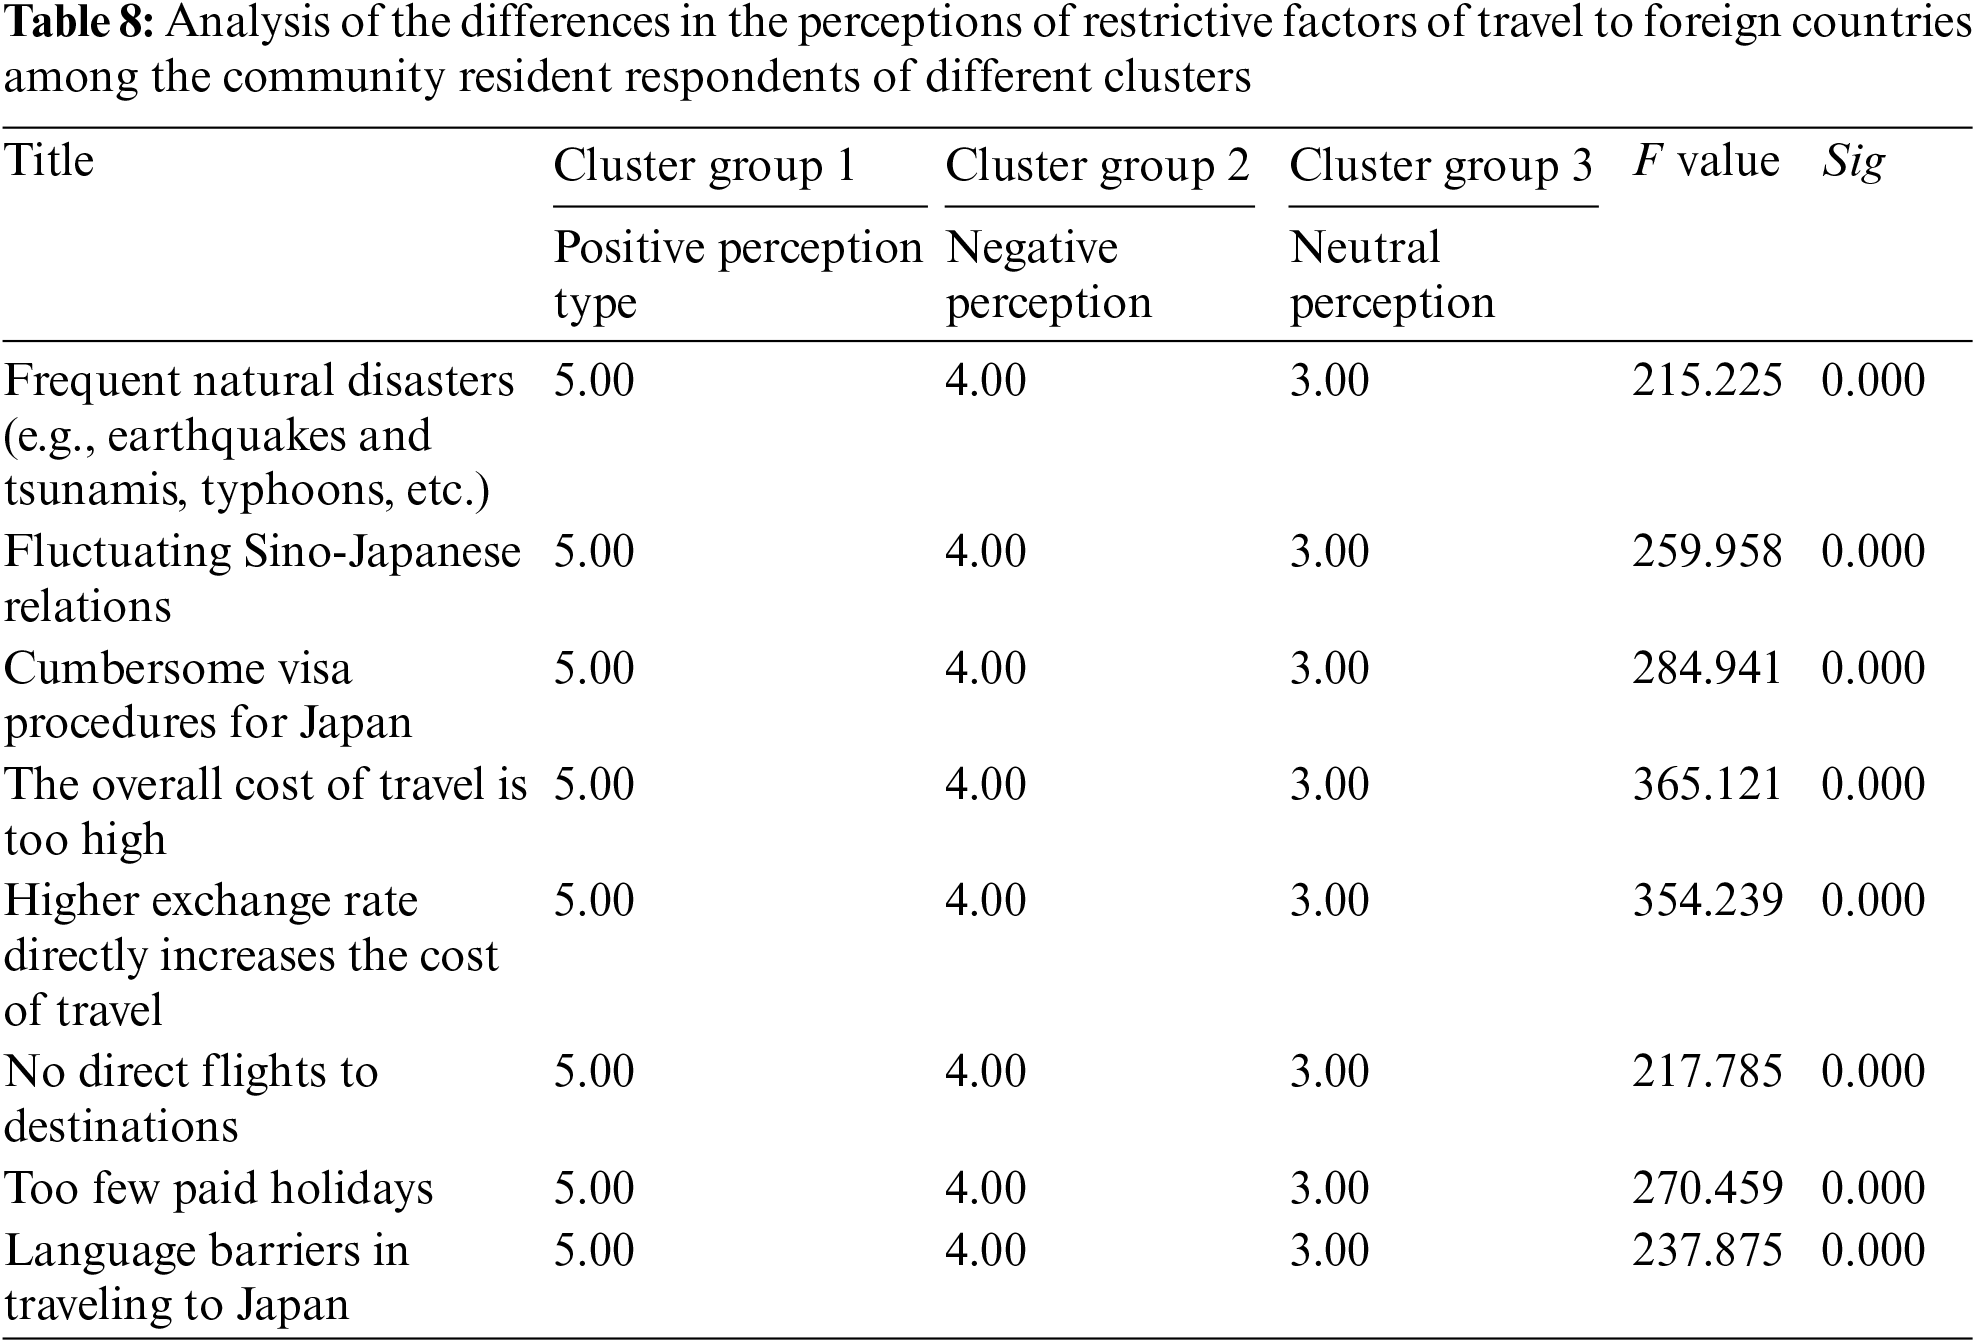
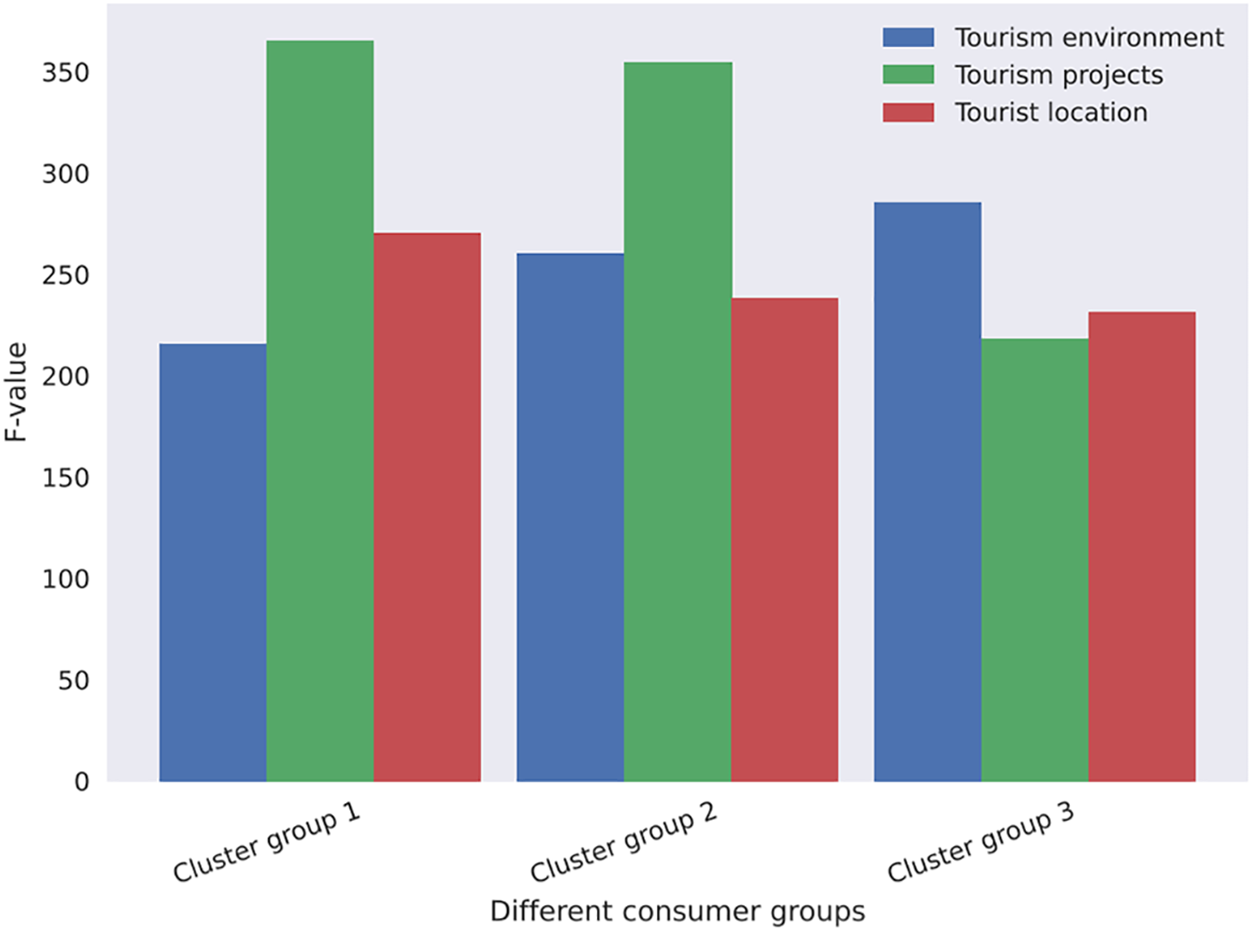
Figure 1: Influence of different tourism factors on F value
Among all the community residents interviewed, the number of negative perception clusters was 261, the number of positive perception clusters was 109, and the number of neutral perception clusters was 342. The group with the largest proportion of respondents was 342, accounting for 47% of the total number of respondents. The variance analysis shows that “frequent natural disasters,” “fluctuating Sino-foreign relations,” “cumbersome foreign visa procedures,” “high overall travel costs” “higher exchange rates” “destinations without direct flights” “too few paid holidays” “The presence of communication barriers” and other limiting factors of travel abroad
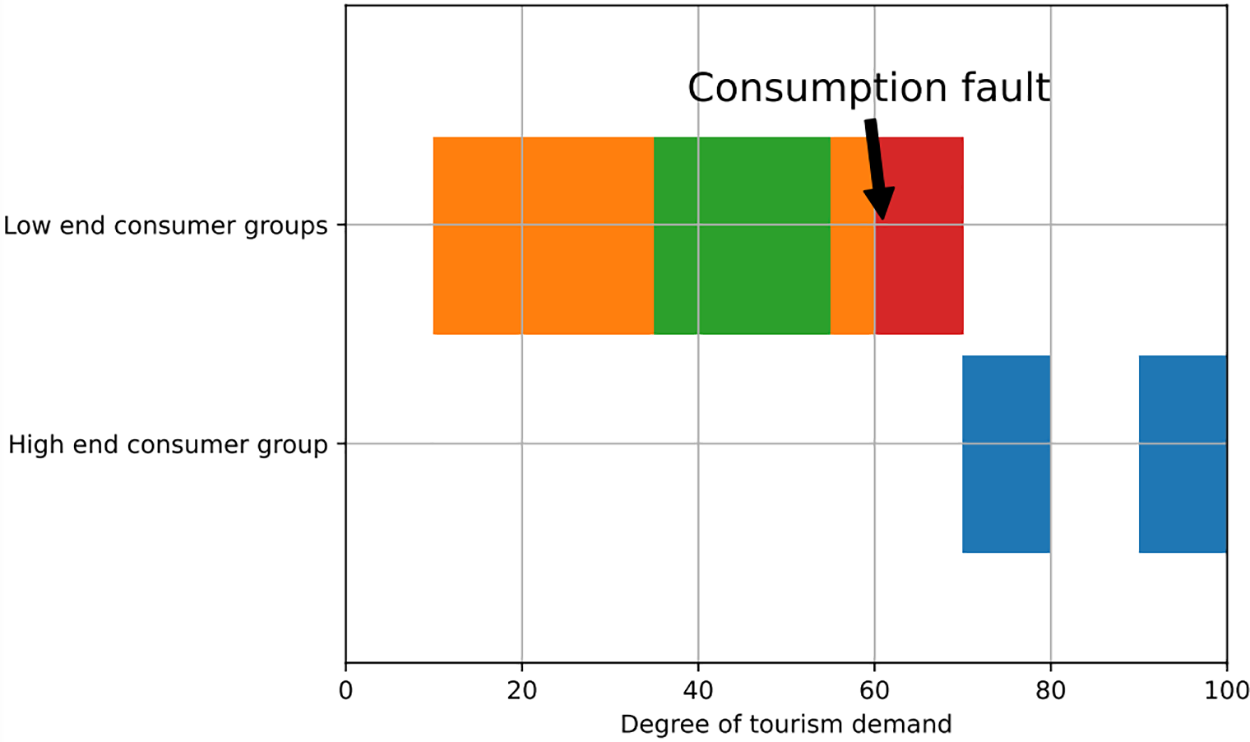
Figure 2: Different consumer groups’ demand for tourism
4.2 Cluster Analysis of Community Residents’ Perceptions of the Impediments of Sino-Foreign Relations to Travel Planning Abroad
As can be seen from Table 9 and Fig. 3, there are very significant differences in community residents’ perceptions of the impediments of Sino-foreign relations to travel plans abroad across different clustering groups. In order to determine the subgroups of this study regarding community residents, this study used cluster analysis to further investigate the reasons for the differences in community residents’ preferences. The study chose a cluster number value of 3 to classify three types of cluster groups: negative perceptions of Sino-foreign relations, positive perceptions of Sino-foreign relations, and neutral perceptions of Sino-foreign relations. The clustering of the respondents of the three types of community residents is shown in Table 9.
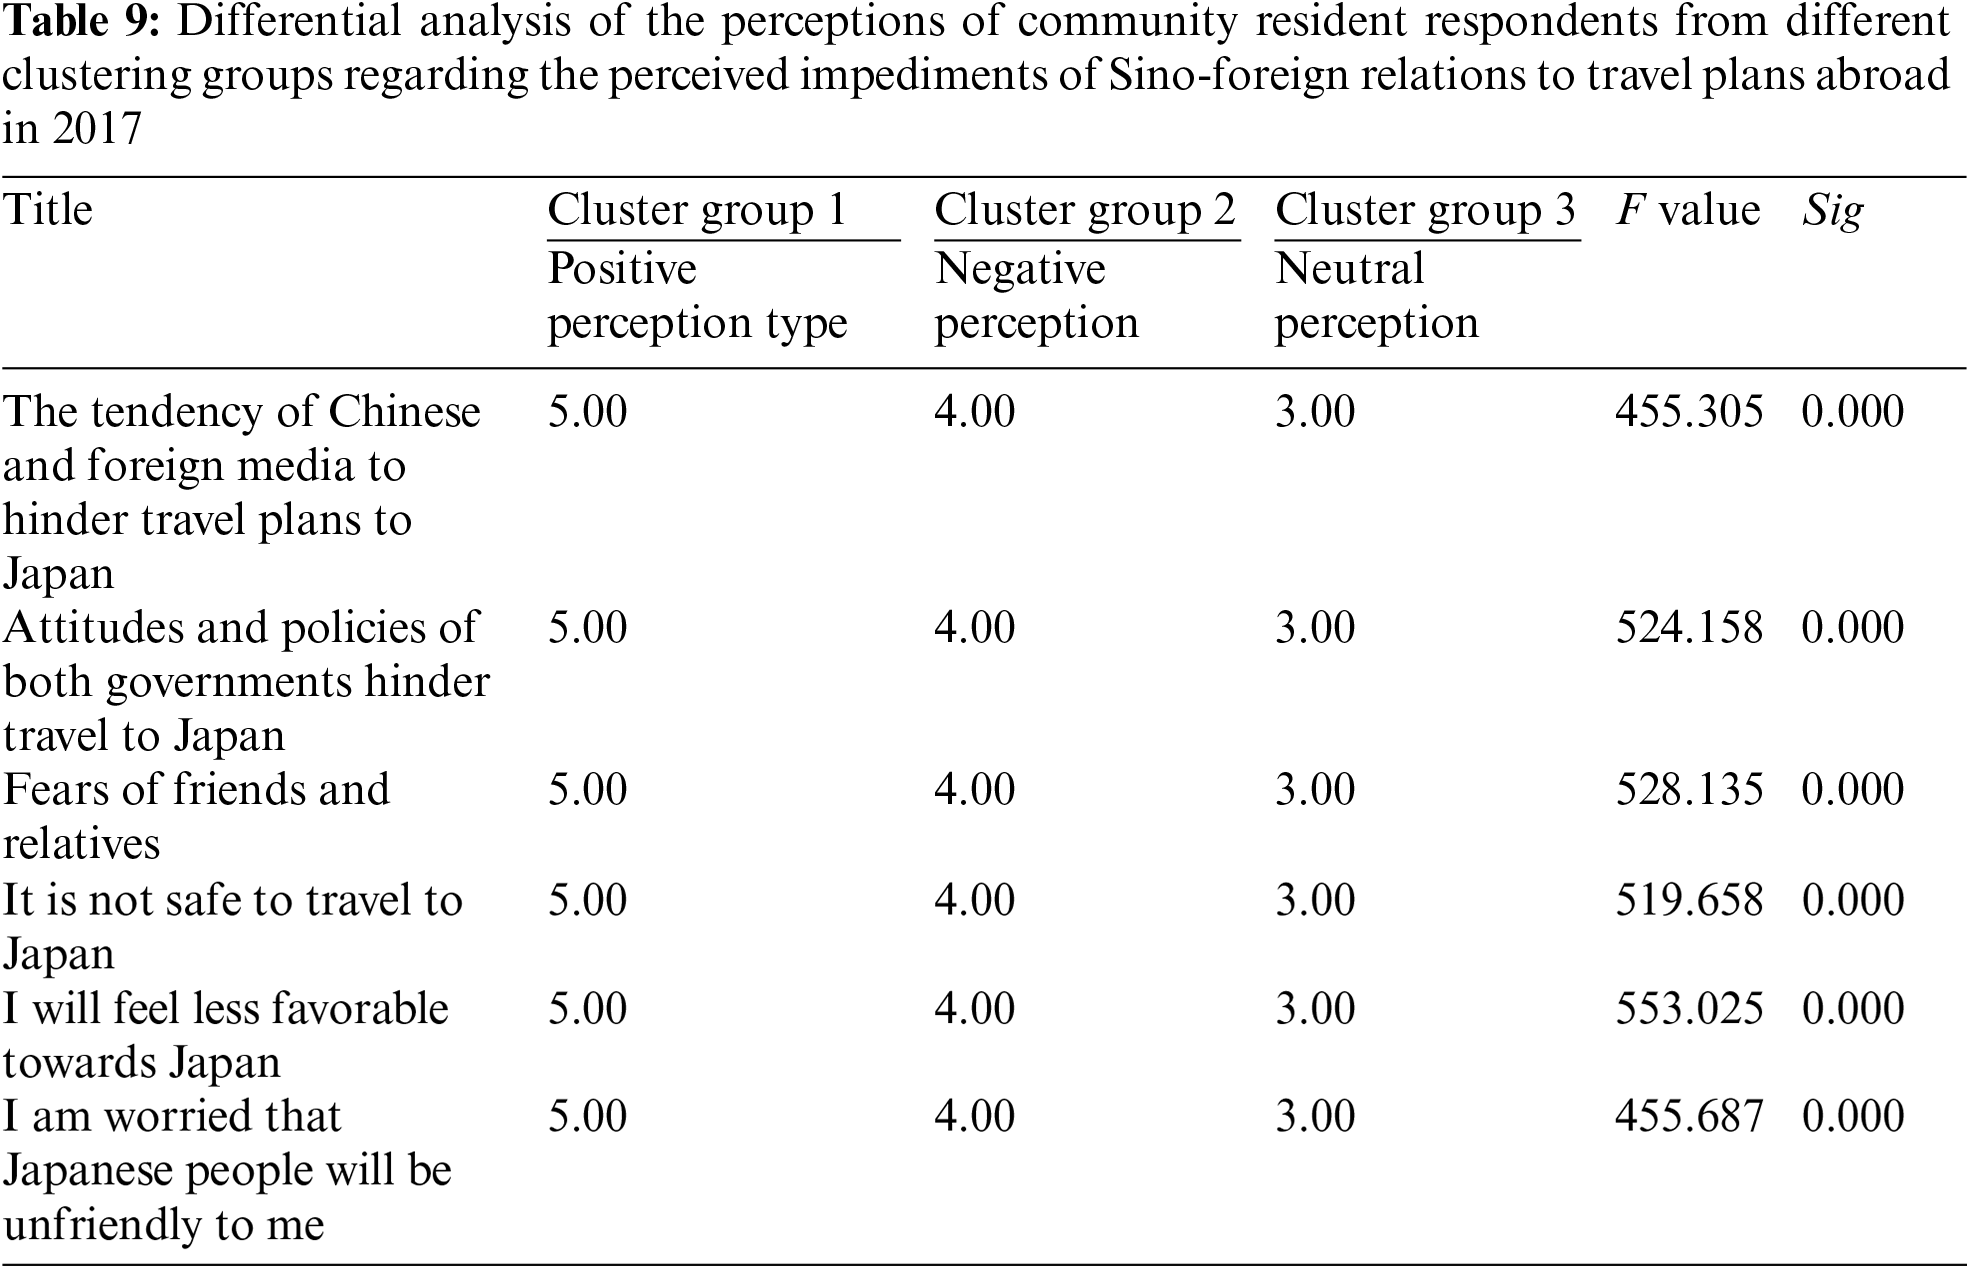
Figure 3: Consideration of human environment in tourism demand
Among all the community residents, the number of negative perceptions of Sino-foreign relations was 270, the number of positive perceptions of Sino-foreign relations was 130, and the number of neutral perceptions of Sino-foreign relations was 316, accounting for 44.1% of the total number of respondents. The analysis of variance shows that the probability of the F-statistics of the six questions are all less than 0.001, indicating that the differences among the three clusters are extremely significant.
4.3 Cluster Analysis of Community Residents’ Perceptions of the Impact of Recent Tourism Promotions to Foreign Countries
As can be seen from Table 10 and Fig. 4, there is a degree of variation in the community residents’ respondents’ perceptions of the impact of recent travel promotions abroad. In this study, community inhabitants were divided into segments to identify the segmentation, and cluster analysis was used to further explore the causes of the variations in community people’ opinions of the effects of outbound tourism advertising. A cluster number value of 2 was chosen for the study to delineate two types of cluster groups: promotion-independent and promotion-dominant. The clustering of community resident respondents of both types is shown in Table 10.
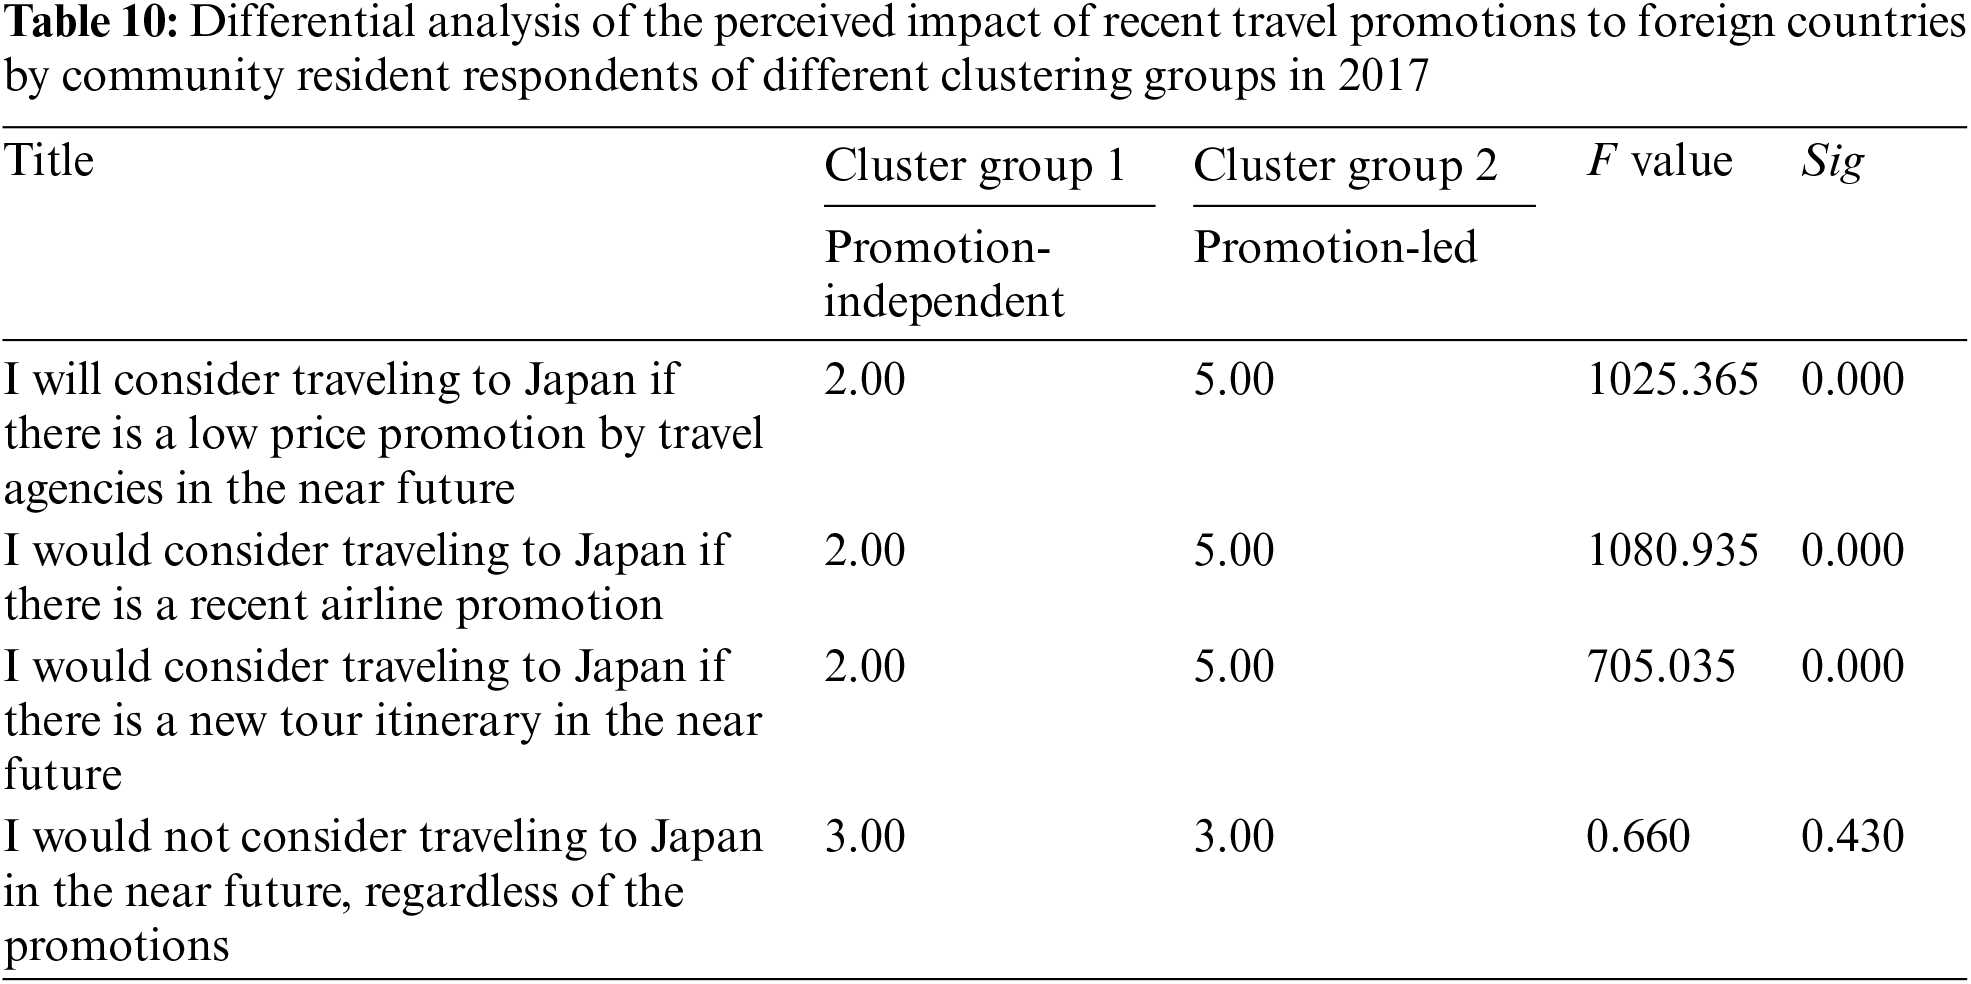
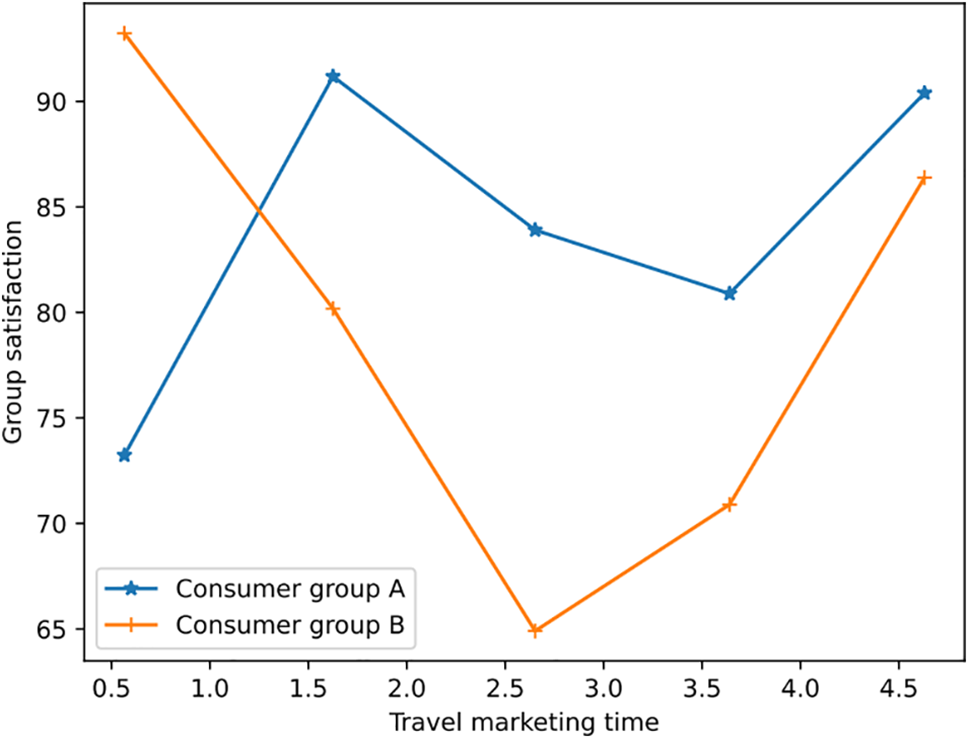
Figure 4: Changes in consumer satisfaction with marketing
Among all the community respondents, the number of cluster group 1 (promotion-independent) was 361, the number of cluster group 2 (promotion-led) was 352. The analysis of variance shows that the F-statistics of the first three items (I would consider traveling abroad if there is a recent low price promotion by travel agencies; I would consider traveling abroad if there is a recent airline promotion; I would consider traveling abroad if there is a recent new travel route) are less than 0.001, indicating that the difference between the promotion-independent and promotion-dominant types is significant.
According to the results of the study, the data to be processed will involve more data types that are either more complex or have a more unique structure. In order to deal with these complex data, some new and better methods of analysis and modeling will be needed, and will also involve some tools and software for the time-consuming and complex data preparation done to deal with these complex or unique data. We found that effective marketing strategies can be designed in at least five areas: developing a portfolio of tourism services, establishing reasonable price gradients, making full use of the Internet and travel assistance agencies for marketing, improving tourism-related ancillary services, word-of-mouth marketing and improving service quality through training and motivating staff, and combining our proposed demand forecasting model, we were able to effectively predict the travel demand of different consumer groups’ travel demand and thus make targeted tourism marketing suggestions to improve users’ travel experience, tourism service quality and service attitude, thus influencing consumer experience and satisfaction. We will conduct in-depth research in the future, when the technology is mature, to meet people’s high quality of life.
Acknowledgement: None.
Funding Statement: This work was sponsored in part by 2021 Youth Innovation Talents Project of Universities in Guangdong Province “Cause Analysis and Countermeasure Research on the Difference of Tourism Resources Development and Marketing Weakening in Underdeveloped Regions of Western Guangdong” (Project No. 2021WQNCX241).
Author Contributions: The author confirms contribution to the paper as follows: study conception and design: Peng Cheng; data collection, analysis and interpretation of results: Peng Cheng; draft manuscript preparation: Peng Cheng. All authors reviewed the results and approved the final version of the manuscript.
Availability of Data and Materials: The experimental data used to support the findings of this study are available from the corresponding author upon request.
Conflicts of Interest: The author declared that they have no conflicts of interest regarding the present study.
References
1. X. Shi, “Tourism culture and demand forecasting based on BP neural network mining algorithms,” Personal and Ubiquitous Computing, vol. 24, no. 2, pp. 299–308, 2020. [Google Scholar]
2. T. van Nguyen, L. Zhou, A. Y. L. Chong, B. Li and X. Pu, “Predicting customer demand for remanufactured products: A data-mining approach,” European Journal of Operational Research, vol. 281, no. 3, pp. 543–558, 2020. [Google Scholar]
3. X. Zhuang, X. Hou, Z. Feng, Z. Lin and J. Li, “Subjective norms, attitudes, and intentions of AR technology use in tourism experience: The moderating effect of millennials,” Leisure Studies, vol. 40, no. 3, pp. 392–406, 2021. [Google Scholar]
4. Y. Yusmalina, T. Tegor, F. Haqiqi, R. E. Rosady and N. Azura, “Comparative analysis of staretegi traditional market and modern markets of consumer valuation,” International Journal of Multicultural and Multireligious Understanding, vol. 8, no. 11, pp. 18–25, 2021. [Google Scholar]
5. N. Daries, E. Cristobal-Fransi and B. Ferrer-Rosell, “Implementation of website marketing strategies in sports tourism: Analysis of the online presence and E-commerce of golf courses,” Journal of Theoretical and Applied Electronic Commerce Research, vol. 16, no. 3, pp. 542–561, 2020. [Google Scholar]
6. V. Mathew and M. Soliman, “Does digital content marketing affect tourism consumer behavior? An extension of technology acceptance model,” Journal of Consumer Behaviour, vol. 20, no. 1, pp. 61–75, 2021. [Google Scholar]
7. M. Sotiriadis, “Tourism destination marketing: Academic knowledge,” Encyclopedia, vol. 1, no. 1, pp. 42–56, 2020. [Google Scholar]
8. R. Dodds and M. R. Holmes, “Preferences at city and rural beaches: Are the tourists different?,” Journal of Coastal Research, vol. 36, no. 2, pp. 393–402, 2020. [Google Scholar]
9. S. M. Rasoolimanesh, C. Khoo-Lattimore, S. Md Noor, M. Jaafar and R. Konar, “Tourist engagement and loyalty: Gender matters?” Current Issues in Tourism, vol. 24, no. 6, pp. 871–885, 2021. [Google Scholar]
10. R. IJspeert and G. Hernandez-Maskivker, “Active sport tourists: Millennials vs baby boomers,” Journal of Tourism, Heritage & Services Marketing (JTHSM), vol. 6, no. 2, pp. 12–20, 2020. [Google Scholar]
11. J. Pelegrín-Borondo, C. Olarte-Pascual and G. Oruezabala, “Wine tourism and purchase intention: A measure of emotions according to the PANAS scale,” Journal of Wine Research, vol. 31, no. 2, pp. 101–123, 2020. [Google Scholar]
12. C. S. Liao and H. K. Chuang, “Tourist preferences for package tour attributes in tourism destination design and development,” Journal of Vacation Marketing, vol. 26, no. 2, pp. 230–246, 2020. [Google Scholar]
13. L. Hu and M. Olivieri, “Social media management in the traveller's customer journey: An analysis of the hospitality sector,” Current Issues in Tourism, vol. 24, no. 12, pp. 1768–1779, 2021. [Google Scholar]
14. D. Karagöz and M. Uysal, “Tourists’ need for uniqueness as a representation of differentiated identity,” Journal of Travel Research, vol. 61, no. 1, pp. 76–92, 2022. [Google Scholar]
15. I. Önder, U. Gunter and S. Gindl, “Utilizing facebook statistics in tourism demand modeling and destination marketing,” Journal of Travel Research, vol. 59, no. 2, pp. 195–208, 2020. [Google Scholar]
16. R. A. Rather, “Customer experience and engagement in tourism destinations: The experiential marketing perspective,” Journal of Travel & Tourism Marketing, vol. 37, no. 1, pp. 15–32, 2020. [Google Scholar]
17. B. Zuo and Z. Lai, “The effect of housing wealth on tourism consumption in China: Age and generation cohort comparisons,” Tourism Economics, vol. 26, no. 2, pp. 211–232, 2020. [Google Scholar]
18. C. Y. Jeon and H. W. Yang, “The structural changes of a local tourism network: Comparison of before and after COVID-19,” Current Issues in Tourism, vol. 24, no. 23, pp. 3324–3338, 2021. [Google Scholar]
19. E. Ketter and E. Avraham, “#StayHome today so we can #TravelTomorrow: Tourism destinations’ digital marketing strategies during the COVID-19 pandemic,” Journal of Travel & Tourism Marketing, vol. 38, no. 8, pp. 819–832, 2021. [Google Scholar]
20. A. Liu, D. X. Fan and R. T. Qiu, “Does culture affect tourism demand? A global perspective,” Journal of Hospitality & Tourism Research, vol. 45, no. 1, pp. 192–214, 2021. [Google Scholar]
21. S. Cankurt and A. Subasi, “Tourism demand modelling and forecasting using data mining techniques in multivariate time series: A case study in Turkey,” Turkish Journal of Electrical Engineering and Computer Sciences, vol. 24, no. 5, pp. 3388–3404, 2016. [Google Scholar]
22. Q. Li, S. Li, S. Zhang, J. Hu and J. Hu, “A review of text corpus-based tourism big data mining,” Applied Sciences, vol. 9, no. 16, pp. 3300, 2019. [Google Scholar]
Cite This Article
 Copyright © 2023 The Author(s). Published by Tech Science Press.
This work is licensed under a Creative Commons Attribution 4.0 International License , which permits unrestricted use, distribution, and reproduction in any medium, provided the original work is properly cited.
 Downloads
 Citation Tools