
 Submit a Paper
 Propose a Special lssue
 Open Access
ARTICLE
Optimization of Electric Vehicle Charging Station Layout Based on Point of Interest Data and Location Entropy Evaluation
1 School of Communication Engineering, Tongda College of Nanjing University of Posts and Telecommunications, Yangzhou, 225127, China
2 School of Electrical and Electronic Engineering, Northumbria University, Newcastle, NE1 8ST, UK
3 School of Information and Communication Engineering, Nanjing Institute of Technology, Nanjing, 211167, China
* Corresponding Authors: Jiawei Zhang. Email: ; Haojie Yang. Email:
Journal on Big Data 2024, 6, 21-41. https://doi.org/10.32604/jbd.2024.057612
Received 22 August 2024; Accepted 27 November 2024; Issue published 31 December 2024
 View Full Text
 Download PDF
Abstract
This study introduces an electric vehicle charging station layout optimization method utilizing Point of Interest (POI) data, addressing traditional design limitations. It details the acquisition and visualization of POI data for Yancheng’s key locations and charging stations. Employing a hybrid K-Means and Density-Based Spatial Clustering of Applications with Noise (DBSCAN) clustering algorithm, the study determines areas requiring optimization through location entropy and overlap analysis. The research shows that the integrated clustering approach can efficiently guide the fair distribution of charging stations, enhancing service quality and supporting the sustainable growth of the electric vehicle sector.Keywords
The growing global environmental crisis has heightened the focus on sustainable development and environmental protection. In this context, electric vehicles (EVs) have rapidly emerged as a key driver of the green transition in the transportation sector, thanks to their clean and efficient characteristics. Compared to traditional internal combustion engine (ICE) vehicles, EVs offer significant advantages in reducing carbon emissions and minimizing environmental pollution. Additionally, EVs are powered by electricity, which is typically less expensive than fuel, providing users with economic savings. The reduced noise generated during EV operation also delivers a quieter, more comfortable driving experience.
Despite these benefits, the widespread adoption and growth of EVs still face several challenges. One of the main obstacles is the development and distribution of charging infrastructure. As the number of EV users continues to increase, imbalances between the supply of and demand for charging stations have become more apparent. In some areas, demand exceeds supply, resulting in long wait times and difficulties finding available chargers, which intensifies users’ “range anxiety”—the fear of depleting battery power without access to charging. On the other hand, certain regions experience an oversupply of charging stations, leading to resource inefficiency and reduced operational effectiveness. This mismatch between supply and demand not only impacts the user experience but also hinders the sustainable growth of the EV industry.
To address this issue, optimizing the layout of EV charging stations has become crucial. In recent years, researchers have turned to analyzing EV charging demand data to optimize the distribution of charging infrastructure. However, traditional methods have limitations when dealing with the dynamic and complex nature of vehicle usage. Charging demand is influenced by various factors such as time, location, and user behavior, which adds complexity to the planning of charging station layouts. Relying solely on conventional methods makes it difficult to adapt to these dynamic changes and spatial variability.
This paper aims to explore a new approach to optimizing charging station layouts through the analysis and visualization of Points of Interest (POI) data. By using clustering algorithms to analyze key urban locations, this study identifies areas with high concentrations of pedestrian and vehicle traffic, allowing for more strategic planning and distribution of charging stations in those regions. This method helps alleviate users’ range anxiety, improves the EV driving experience, and better satisfies charging needs. Through an in-depth analysis of Yancheng City in Jiangsu Province, this study provides a fresh perspective on charging station layout optimization and offers both theoretical and practical support for the sustainable development of the EV industry.
The main contributions of this article include the following:
• An electric vehicle charging station layout optimization method based on POI data is proposed. Combining the K-Means algorithm and the DBSCAN (Density-Based Spatial Clustering of Applications with Noise) algorithm effectively overcomes the limitations of the K-Means algorithm in the selection of initial clustering centers and avoids falling into the local minimum, the problem of optimal solution.
• The location entropy method is innovatively introduced to quantitatively evaluate the social equity of charging station layout. This method provides a new perspective and quantitative tool for the uniformity of distribution of charging station services in different regions.
• By evaluating the fairness of charging station layout in different regions, this paper identifies the main POI types that affect charging station utilization, and further determines the important impact of these POI types on charging station layout optimization through sensitivity analysis, providing guidance for charging station layout decisions. Data support is provided.
The rest of the paper is organized as follows. Section 2 analyses the related work. Section 3 presents the questions raised and the research ideas. Section 4 introduces an electric vehicle charging station layout optimization algorithm that combines the K-Means algorithm and the DBSCAN algorithm. Section 5 provides the experimental results. Section 6 compares different models. Finally, Section 7 concludes the paper with a summary.
Optimizing the layout of electric vehicle charging stations is one of the core issues in current electric transportation system planning, which is directly related to the efficiency of the charging network, construction and operating costs, and the user’s charging experience. With the rapid growth of electric vehicles, how to arrange charging stations scientifically and rationally has become a hot research topic. Different researchers have used a variety of optimization algorithms and data-driven technologies to optimize resource allocation and improve economic benefits while meeting users’ charging needs. Existing literature shows that optimization methods based on genetic algorithms, improved heuristic algorithms and meta-heuristic algorithms have made significant progress. At the same time, the introduction of data-driven models also provides new perspectives and methods for optimization problems.
First, optimization methods based on genetic algorithms have been widely used in charging station layout research. Literature [1] proposed a multi-agent system based on a genetic algorithm, which comprehensively utilizes social network dynamic data and mobility data to accurately predict the charging demand of electric vehicles in the city and determine the optimal layout of charging stations. This method effectively integrates multi-source data and achieves more reasonable charging station distribution planning through collaboration between agents. Literature [2] also used a genetic algorithm to optimize the layout of electric vehicle charging stations in Ireland based on the total social cost model, aiming to minimize the construction and operating costs of charging stations. Through sensitivity analysis of key parameters, this study demonstrates the superiority of genetic algorithms in solving such complex optimization problems.
Secondly, improvements in classic heuristic algorithms also show strong adaptability and computational efficiency in optimizing charging station layout. Literature [3] proposed an improved NSGA-II algorithm, which significantly improved the algorithm’s search capability and convergence performance by introducing chaotic initialization and arithmetic crossover operators. This method not only optimizes the layout and scale of charging stations but also effectively improves the coverage efficiency of the charging network and reduces operators’ costs and users’ charging fees. Similarly, literature [4] established an objective function model by improving the particle swarm optimization algorithm to minimize the construction and operation costs of charging stations, successfully optimized the layout of charging stations in Beijing, and solved the problem of uneven resource distribution. This type of research shows that the improved heuristic algorithm can provide better solution results in multi-objective optimization problems and has strong practicability.
In addition, data-driven methods provide new research perspectives and tools for charging station optimization. Literature [5] developed a data-driven optimization model through large-scale electric taxi GPS trajectory data to accurately capture the charging behavior in urban areas to determine the optimal location and scale of charging stations. This study designed a heuristic algorithm and verified it in a real case in Shenzhen, showing the strong application potential of data-driven methods in charging station layout optimization. Literature [6] further expanded the scope of data application, using mobile phone signal data combined with trip reconstruction technology to propose a two-stage optimization model for charging station location selection. This type of research provides more accurate and feasible solutions for charging station planning by integrating big data and optimization algorithms.
The application of metaheuristic algorithms also opens up new research directions for charging station layout optimization. Literature [7] proposed a charging station layout method based on an improved whale optimization algorithm. This method particularly considers dynamic charging requirements and optimizes under different constraints through an improved metaheuristic algorithm, successfully solving the problem of charging station—layout issues. Literature [8] further explores the integration of wind energy, photovoltaic, and energy storage systems into the multi-objective optimization design of charging stations, and uses a hybrid optimization algorithm to determine the optimal capacity configuration and power dispatch strategy. This study verified the effectiveness of the model through cases and demonstrated the broad applicability of metaheuristic algorithms in multi-objective optimization problems.
Optimization methods that combine actual data and case studies have gradually become an important research direction in this field. Literature [9] proposed a charging station layout optimization method through an optimization model based on actual driving data, which maximizes the coverage of charging services while minimizing costs. Literature [10] proposed a set of optimized layout plans for electric vehicle charging infrastructure in the central area of Chongqing. Through an in-depth analysis of regional characteristics and charging needs, it provides new energy vehicle users with a more reasonable distribution of charging stations. This type of research further enhances the operability and practical application value of research results by combining real-world data to verify the optimization model.
Important progress has also been made in multi-algorithm fusion research for different optimization problems and scenarios. Literature [11] proposed a charging station location selection method based on hybrid particle swarm optimization and tabu search algorithm (HPSO-TS). By combining the advantages of the two algorithms, the search efficiency and global optimization capabilities of the algorithm are effectively improved. Literature [12] proposed a comprehensive framework covering the planning and demand forecasting of electric vehicle charging stations, aiming to provide a scientific basis for the rational configuration of infrastructure. In addition, literature [13] discussed the application of particle swarm optimization, Salp swarm algorithm (SSA), and arithmetic optimization algorithm (AOA) in the design of fast charging stations. Through the comparison and combination of three meta-heuristic algorithms, the optimization is further improved. Model robustness and economic efficiency.
Although many scholars have conducted extensive research on the layout optimization of electric vehicle charging stations, the data required for most studies are too difficult to obtain, which limits the use of these studies in other cities and has low generalization. Therefore, this paper proposes a charging station layout optimization method based on POI data. First, POI data including shopping malls, office buildings, residential areas, transportation hubs, etc., as well as traffic flow data and population density data are collected and prepossessed. Secondly, hot spot analysis, spatial clustering, and path analysis are performed to identify high-demand areas and charging hot spots. Then, a coverage model and an optimization model are constructed, and heuristic algorithms and mixed integer programming methods are used to solve the optimal layout plan. Finally, the effectiveness of the optimization scheme is evaluated through simulation experiments and actual verification.
3 Questions Raised and Research Ideas
3.1 Description of the Problem
This study focuses on solving the planning and optimization problems of electric vehicle charging infrastructure. With the rapid expansion of the electric vehicle market, the demand for charging stations is increasing. However, the current layout of charging stations is often difficult to cope with charging demand during peak periods, causing users to wait for long periods of time and reducing satisfaction. At the same time, unreasonable distribution of charging stations also leads to low resource utilization. In order to deal with these problems, this article uses scientific data analysis and optimization models to explore how to rationally layout and optimize electric vehicle charging stations to improve the service efficiency and user experience of the charging network.
The research framework of this article revolves around the two core contents of layout optimization and analysis of electric vehicle charging stations, as shown in Fig. 1, which is divided into the following two parts:
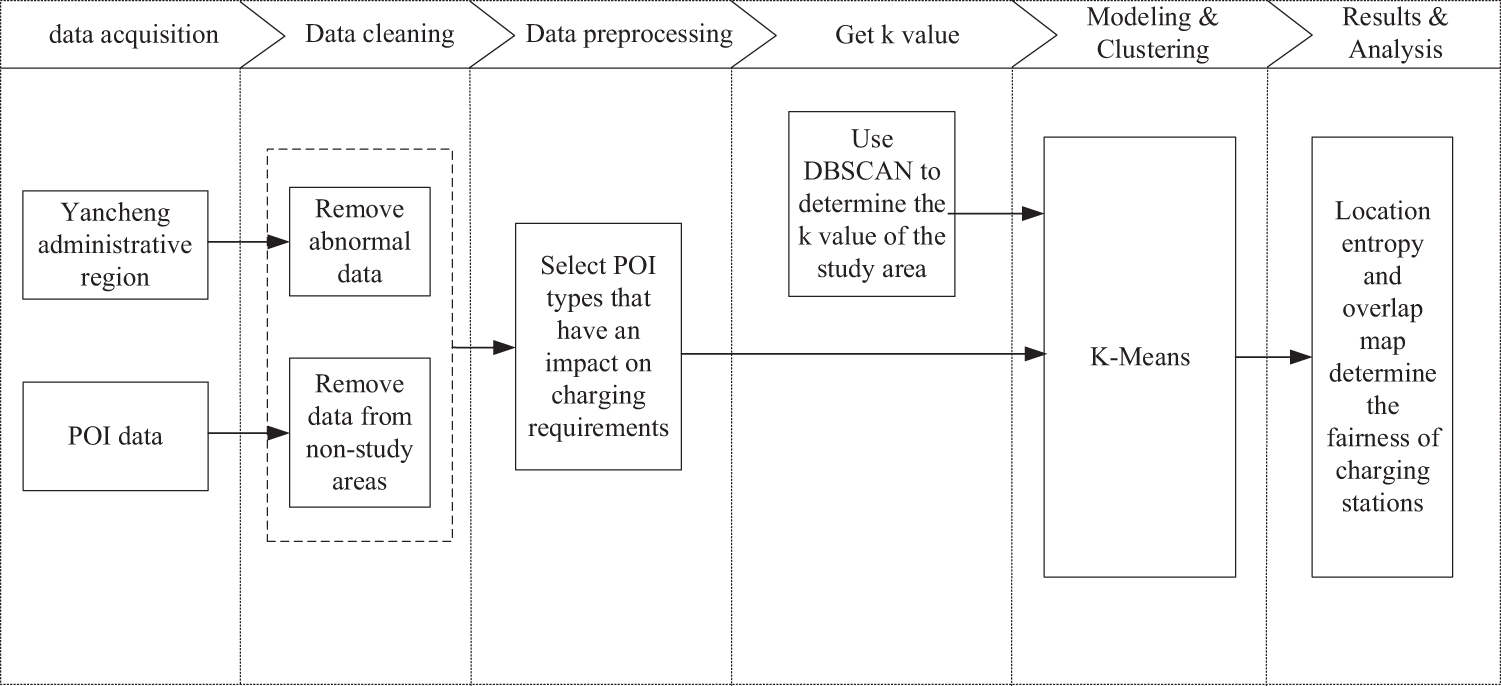
Figure 1: Research framework
Layout optimization: In layout optimization, POI data and geographic information system (GIS) technology were used to accurately identify potential areas with high charging demand. By implementing a cluster analysis approach, we aim to determine the optimal layout locations of electric vehicle charging stations to achieve effective coverage of demand hot spots.
Layout analysis: In the layout analysis, the location entropy method is used to determine the fairness of the layout of electric vehicle charging stations.
4 Electric Vehicle Charging Station Layout Optimization Algorithm Combining K-Means Algorithm and DBSCAN Algorithm
4.1 Preliminary Screening of POI Types
In this study, POI [14] is used as the database, which refers to geographic locations that have a specific function or arouse interest in a Geographic Information System (GIS). These locations usually include places such as restaurants, stores, hospitals, schools, parks, transportation hubs, etc. POI data are widely used in the fields of urban planning, navigation systems, and business location analysis to help researchers better understand the spatial structure of the city and the distribution of functional areas through the geographic coordinates, names, categories, and other attribute information they contain. Because POI data can accurately reflect the functional places and their distribution in reality, it occupies a crucial position in urban research.
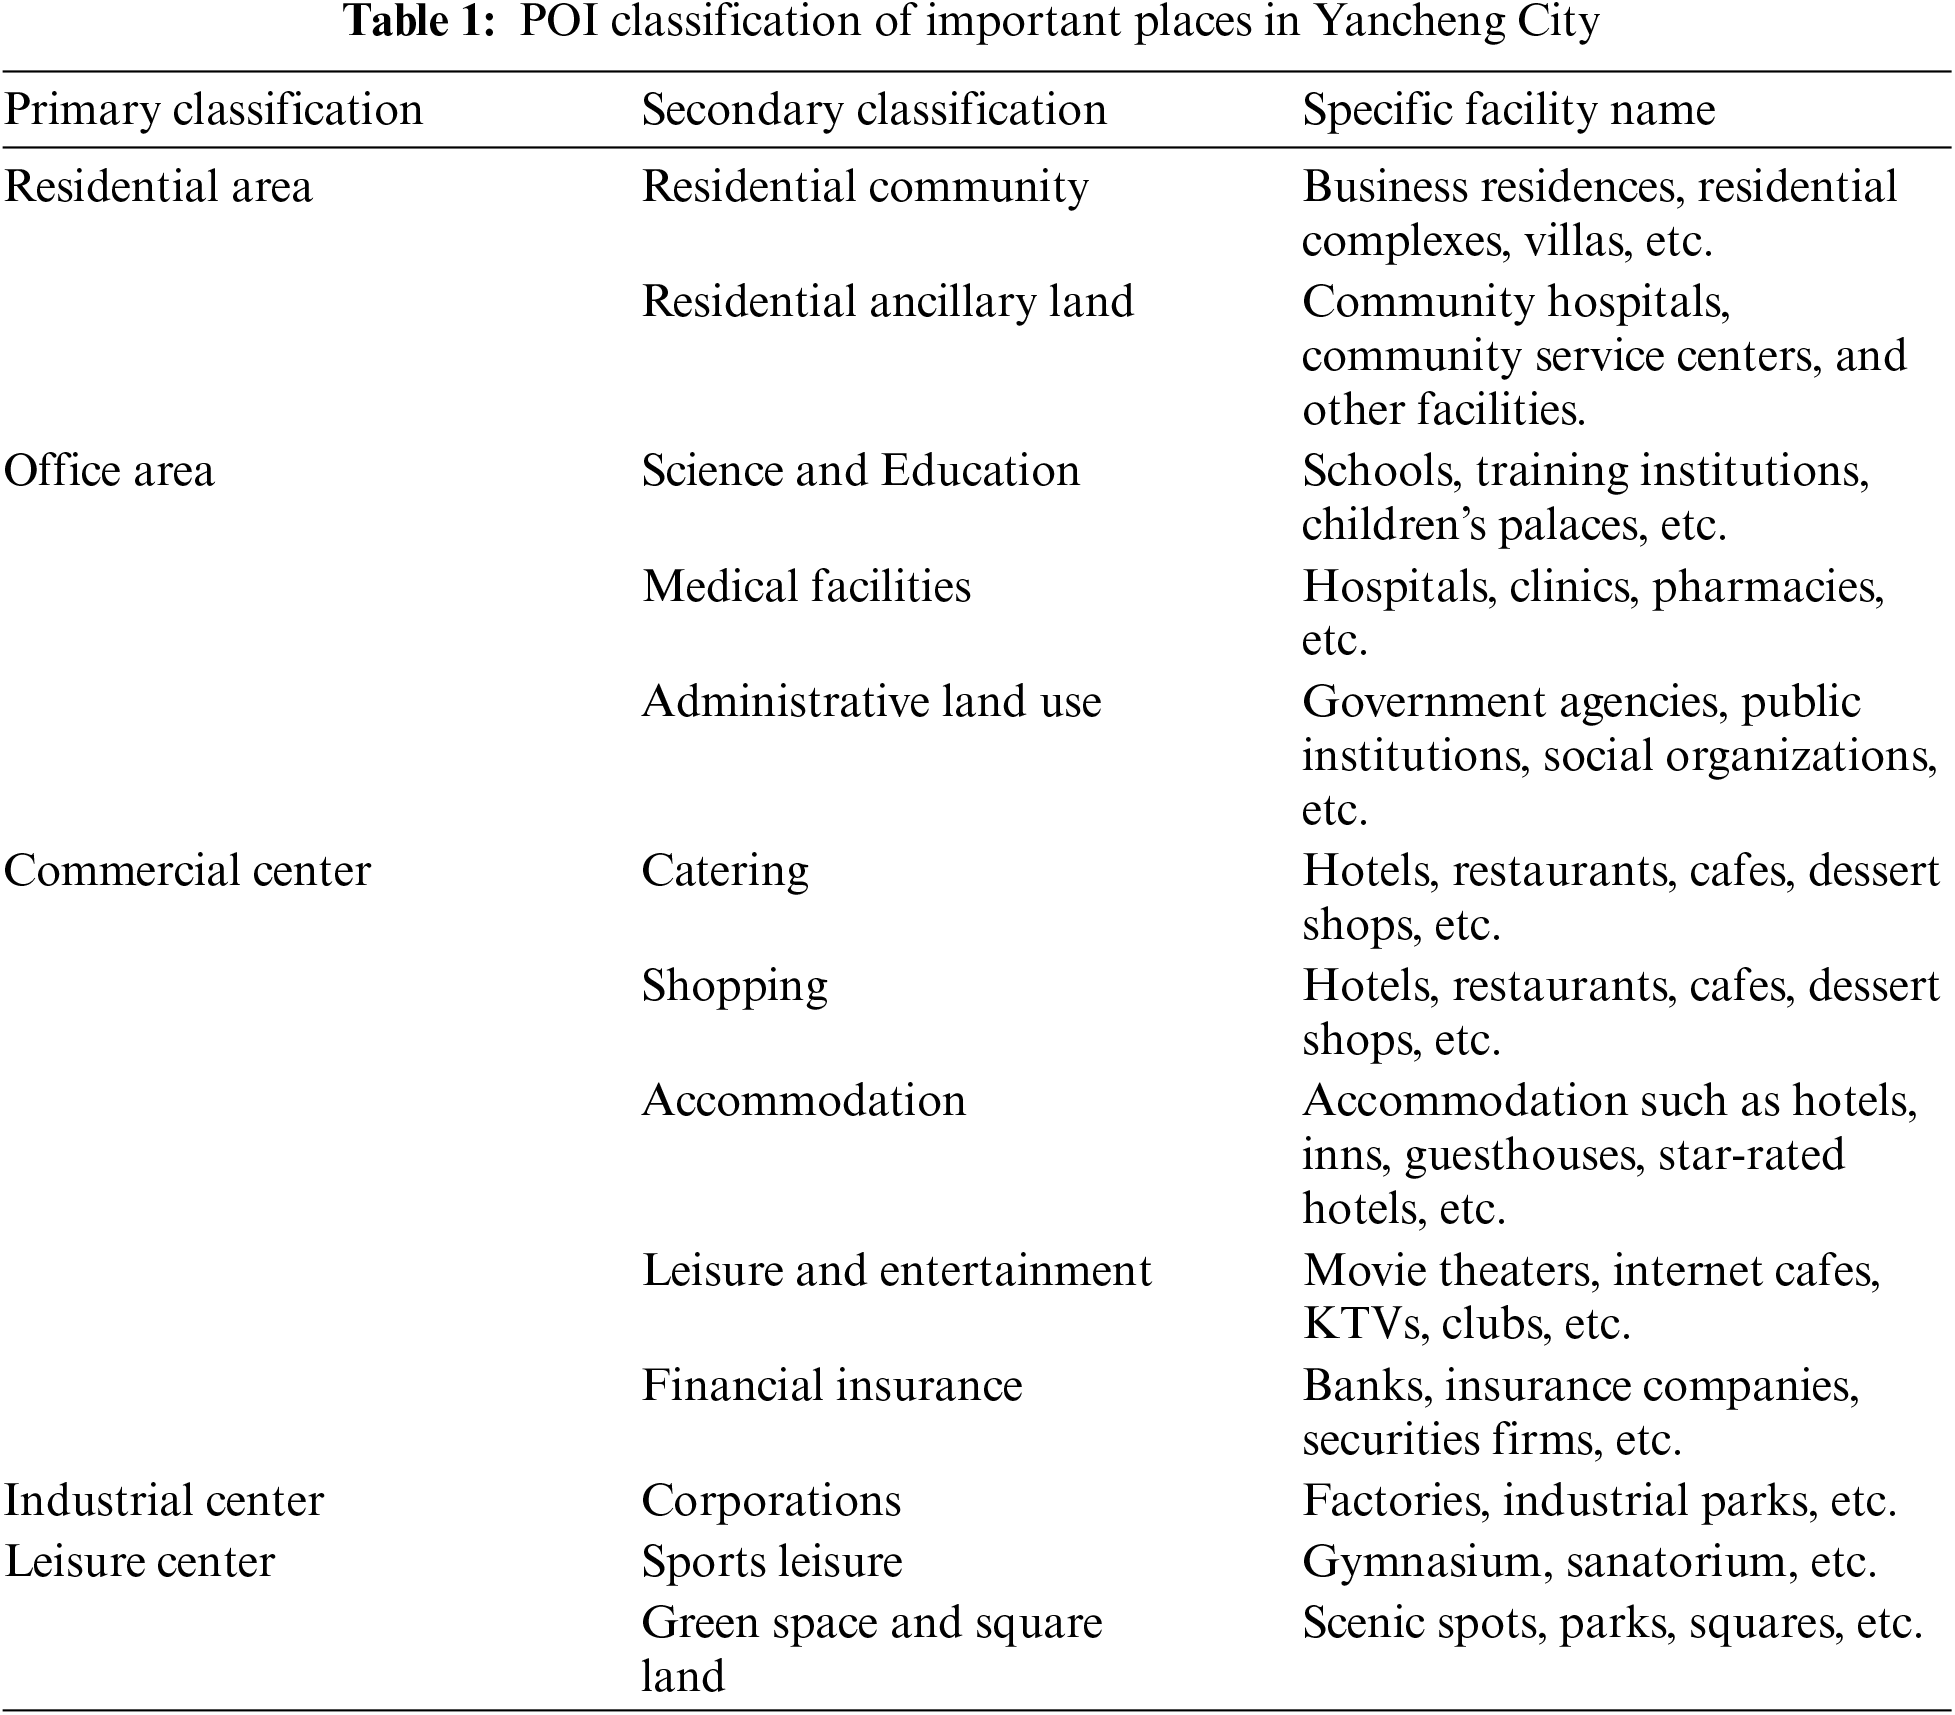
In order to improve the convenience of data acquisition and enhance the generalizability of the proposed methodology, POI data from a single source is chosen as the basis of analysis in this study. Based on the geographic characteristics of important locations in the study area, a classification strategy of two districts and three centers was adopted to carefully divide the POI data. Specifically, POI data are divided into primary and secondary classifications through the hierarchical structure of the system, and this function-based classification can more clearly show the spatial distribution characteristics of different types of locations. In this way, the study can not only accurately identify the important functional areas in the city, but also effectively analyze the spatial aggregation patterns of different categories of POIs. Table 1 shows the specific POI classification results, which further supports the study’s fine analysis of the spatial structure of Yancheng City.
4.2 Combining K-Means Algorithm and DBSCAN Algorithm
Since the K-Means algorithm has difficulty in determining the number of clusters (K value) and is very sensitive to the selection of the initial cluster center, which may lead to unsatisfactory clustering results, this article proposes an algorithm that combines K-Means and DBSCAN Cluster analysis of methods to optimize charging station layout. The DBSCAN algorithm does not need to preset the number of clusters, can automatically discover clusters of any shape, and has good robustness to noise and outliers. By first using the DBSCAN algorithm to identify high-density areas in the data, and then using these areas as the initial clustering centers of the K-Means algorithm, it can effectively prevent the K-Means algorithm from falling into local optimality, further improve the clustering effect, and ensure charging stations, accuracy and rationality of layout optimization.
The model in this article uses the DBSCAN algorithm to determine the K value of the study area. The DBSCAN algorithm is a density-based spatial clustering algorithm proposed by Ester et al. in 1996 [15]. It is particularly suitable for discovering clusters of arbitrary shapes and handles noisy data well.
For the DBSCAN algorithm, all points in the data set are first traversed and each point is marked as “unvisited”. Select an unvisited point, mark it as visited, and check its ε-neighborhood. The ε-neighborhood is defined by Eq. (1):
where is the distance between and (usually Euclidean distance is used). If it is a core point, create a new cluster and add all points in its ε-neighborhood (including boundary points and core points) to the cluster.
If it is not a core point and the number of points in its ε-neighborhood is less than MinPts, it is marked as a noise point. If a point:
The ε-neighborhood contains at least MinPts points (including itself), then is a core point. As defined by Eq. (2):
If the number of points in the ε-neighborhood of a point is less than MinPts, but there are points in the ε-neighborhood of a core point, it is a boundary point. If a point is neither a core point nor a boundary point, it is called a noise point.
For each core point in a cluster, its ε-neighborhood is examined. If some points in the ε-neighborhood are also core points, their ε-neighborhood is added to the current cluster. The K value can be determined according to the above steps.
According to the K value of K-Means determined in the previous stage, the cluster center of each region is initialized, where is the number of clusters.
The goal of K-Means is to minimize the objective function, as shown in Eq. (3):
Among them, x is the data point,
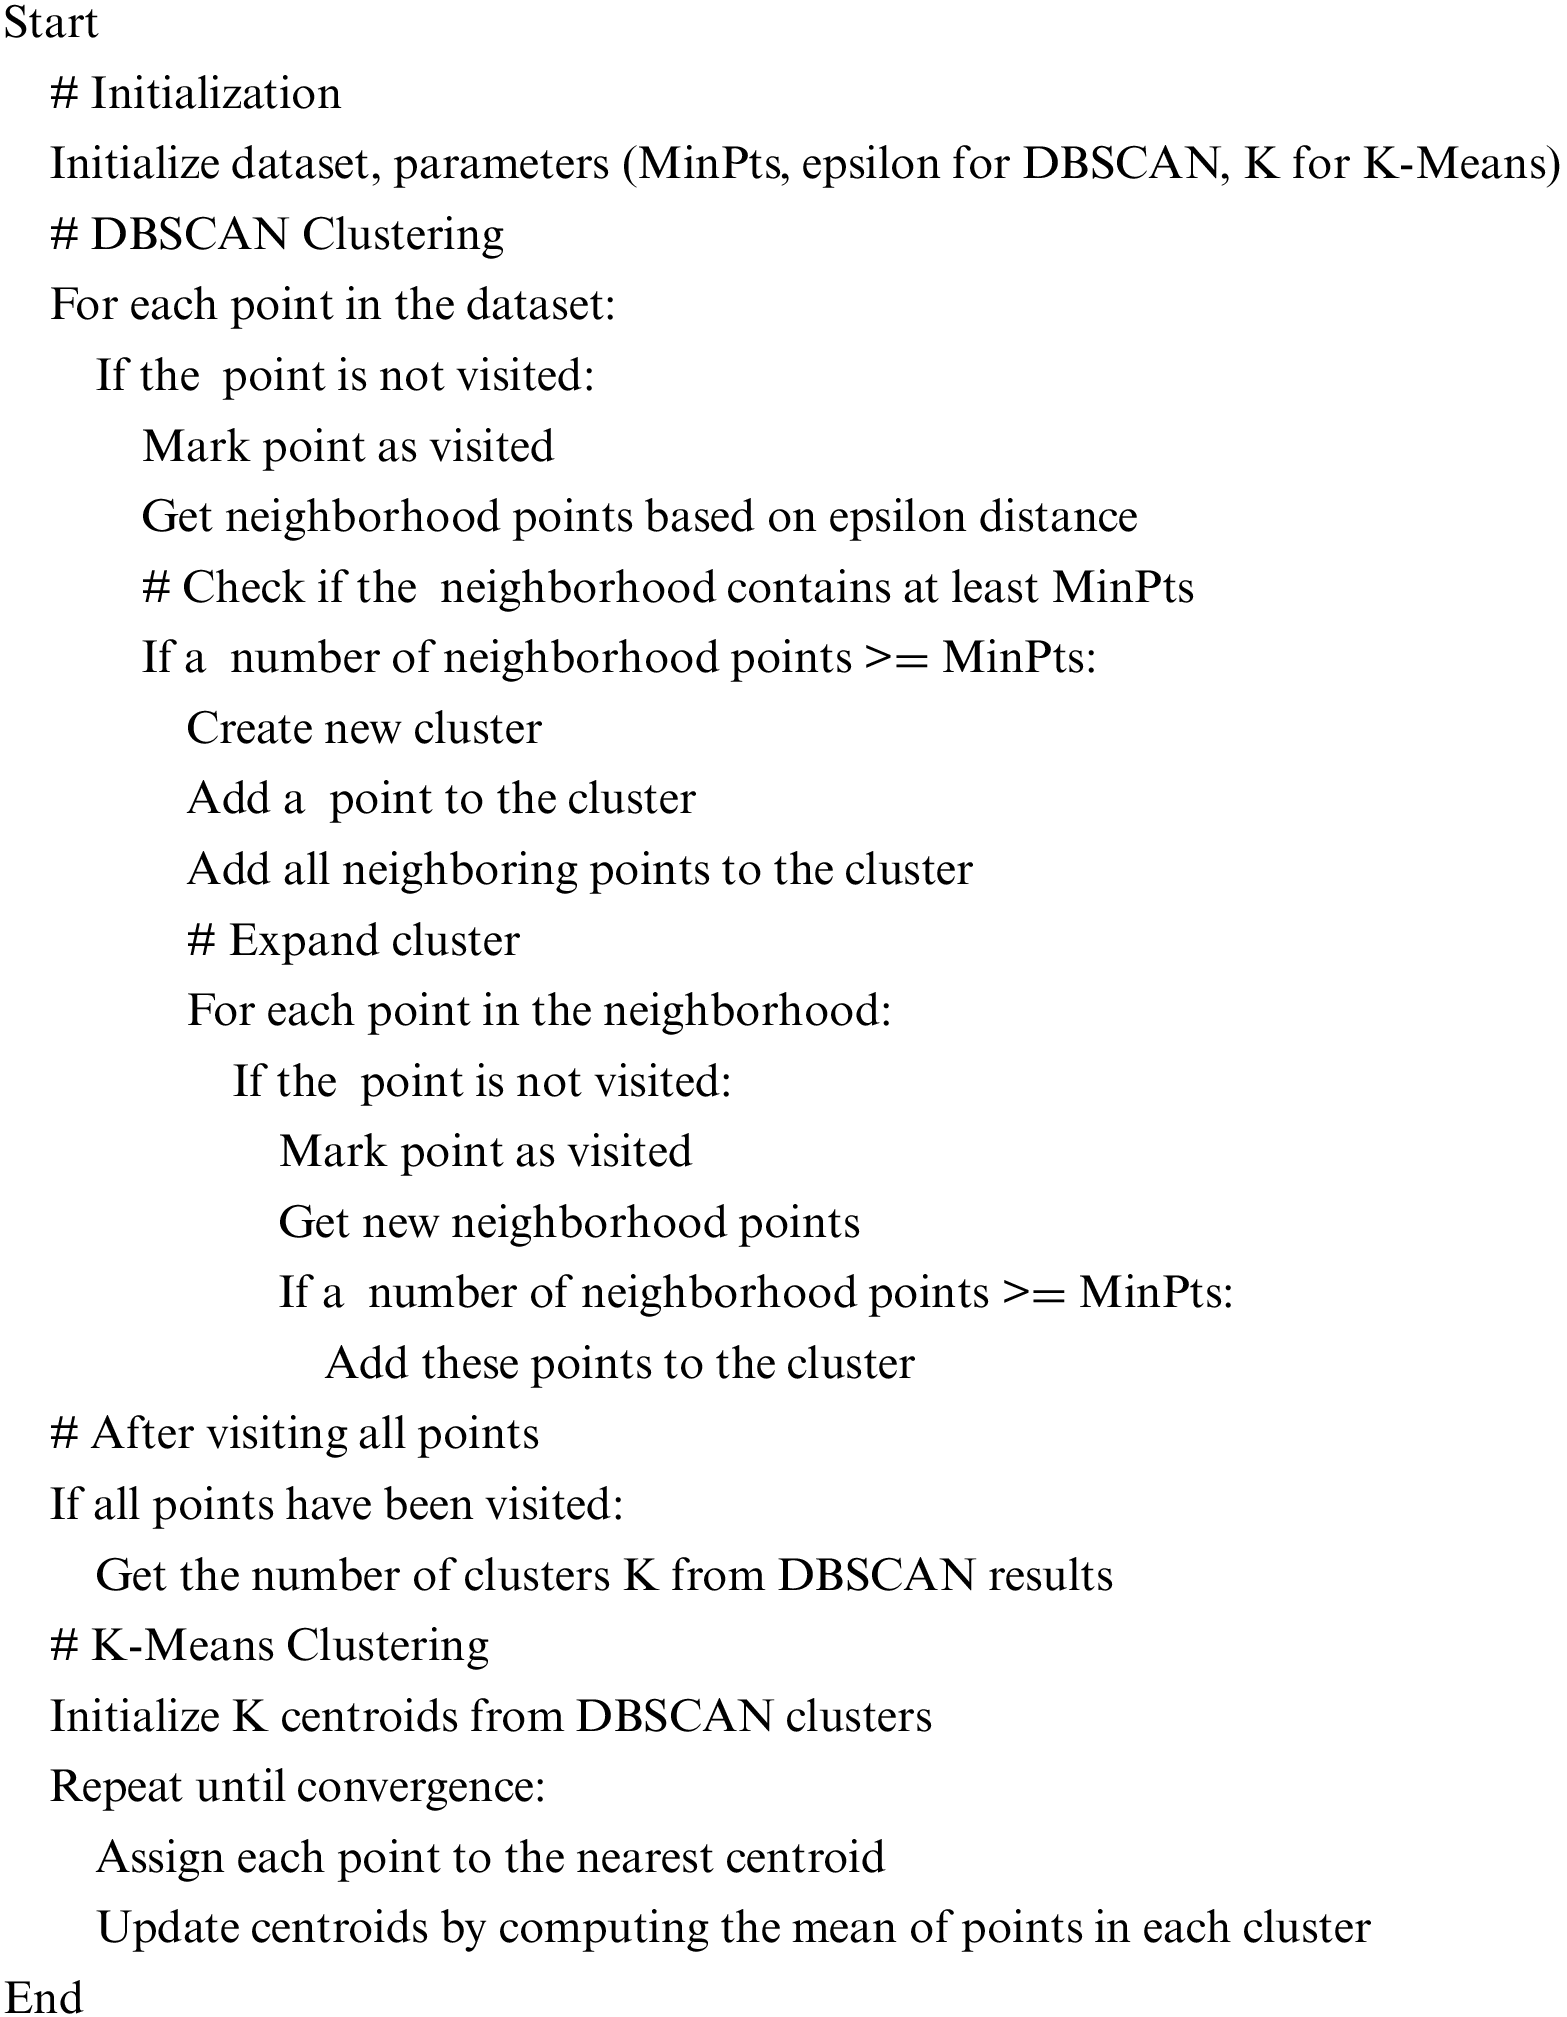
Based on the pseudo-code above, the complexity of the algorithm can be analyzed in detail, involving two main parts: the DBSCAN clustering and the K-Means clustering.
First is the DBSCAN clustering part. DBSCAN determines the attribution of clusters by traversing each data point and looking for points in its neighborhood. The specific process is that for each unvisited point, the algorithm checks its neighborhood, i.e., it finds all the points whose distances are within epsilon, an operation that requires traversing the entire dataset and therefore has a complexity of O(n). Next, the algorithm checks whether the number of points in the neighborhood is greater than or equal to MinPts, and if the condition is satisfied, the current point is added to the new cluster, and all the points in the neighborhood are also added to the cluster. If the points in the neighborhood are not accessed, the algorithm recursively checks the neighborhoods of those points and continues to expand the cluster. In the worst case, each point may be visited multiple times, especially in data-dense regions where the neighborhoods of all points may overlap. As a result, the overall time complexity of DBSCAN is O(n²) because, for each point, it is possible that all other points may need to be traversed to determine the neighborhood.
After the DBSCAN clustering is complete, the algorithm then proceeds to further optimize the clusters using K-Means. DBSCAN outputs a number of clusters and the centers of these clusters are used as the initial centers of mass for the K-Means. K-Means optimizes the location of these centers by iterating until convergence. In each iteration, K-Means first assigns each point to its nearest center of mass, which requires K distance calculations for each point with a complexity of O(K * n). Subsequently, K-Means recalculates the location of the center of mass for each cluster by taking the mean of all the points in each cluster, an operation that is also O(K * n). K-Means usually require multiple iterations, and assuming that the number of iterations is T, the overall complexity of K-Means is O(T * K * n).
Overall, the total complexity of the entire algorithm is the sum of the complexity of DBSCAN and K-Means. the complexity of the DBSCAN part is O(n²), while the complexity of the K-Means part is O(T * K * n). Thus, the overall complexity of the algorithm is O(n2 + T * K * n). Of these, the complexity of DBSCAN will dominate when dealing with large-scale datasets, especially in dense data regions, which makes it computationally expensive in some cases. However, DBSCAN has the advantage of being able to capture arbitrarily shaped clusters, while K-Means further optimizes the allocation of clusters, which accelerates convergence and improves clustering quality. Overall, the algorithm combines the advantages of DBSCAN and K-Means, which can effectively handle clusters with complex shapes while optimizing the clustering results.
5.1 Experiment Purpose, Principle, and Process
In this paper, we construct an electric vehicle charging station layout optimization model that comprehensively utilizes POI data and geographic information system (GIS) technology. In order to solve the limitations of the traditional K-Means algorithm in selecting cluster centers, this paper proposes a clustering method that combines the K-Means algorithm and the DBSCAN algorithm, aiming to balance the distribution of charging stations and improve charging stations through layout optimization, utilization and service quality. In the cluster analysis stage, this paper uses the DBSCAN algorithm to automatically identify high-density areas in the data, which may represent areas with higher charging demand. The advantage of the DBSCAN algorithm is that it does not need to specify the number of clusters in advance and has good robustness to noisy data. Then, the K-Means algorithm is combined to determine the cluster centers of these high-density areas as candidate charging station locations. In order to further improve the optimization effect of the model, the location entropy method is used to evaluate the social equity of charging station layout, ensuring that the distribution of charging stations not only meets high-demand areas but also takes into account the service balance between different regions. In addition, through overlap analysis, the locations of existing charging stations are compared with potential locations derived from cluster analysis to identify areas that require optimization.
This experiment was completed using Python programming in the PyCharm 2023 environment, and the running platform was a computer equipped with a 12th generation Intel® Core™ i5-12500H processor and 32 GB of memory. The Yancheng point of interest (POI) data required for the experiment comes from the Amap API, while the vector data of the Yancheng administrative area is obtained through the “OpenStreetMap” platform. All geographic data uses the WGS84 geographic coordinate system.
In order to ensure the accuracy of the geographical location of electric vehicle charging stations obtained after single-source POI data clustering, abnormal and erroneous data were removed from the collected POI data and classified according to Table 1. The processing results are shown in Fig. 2.
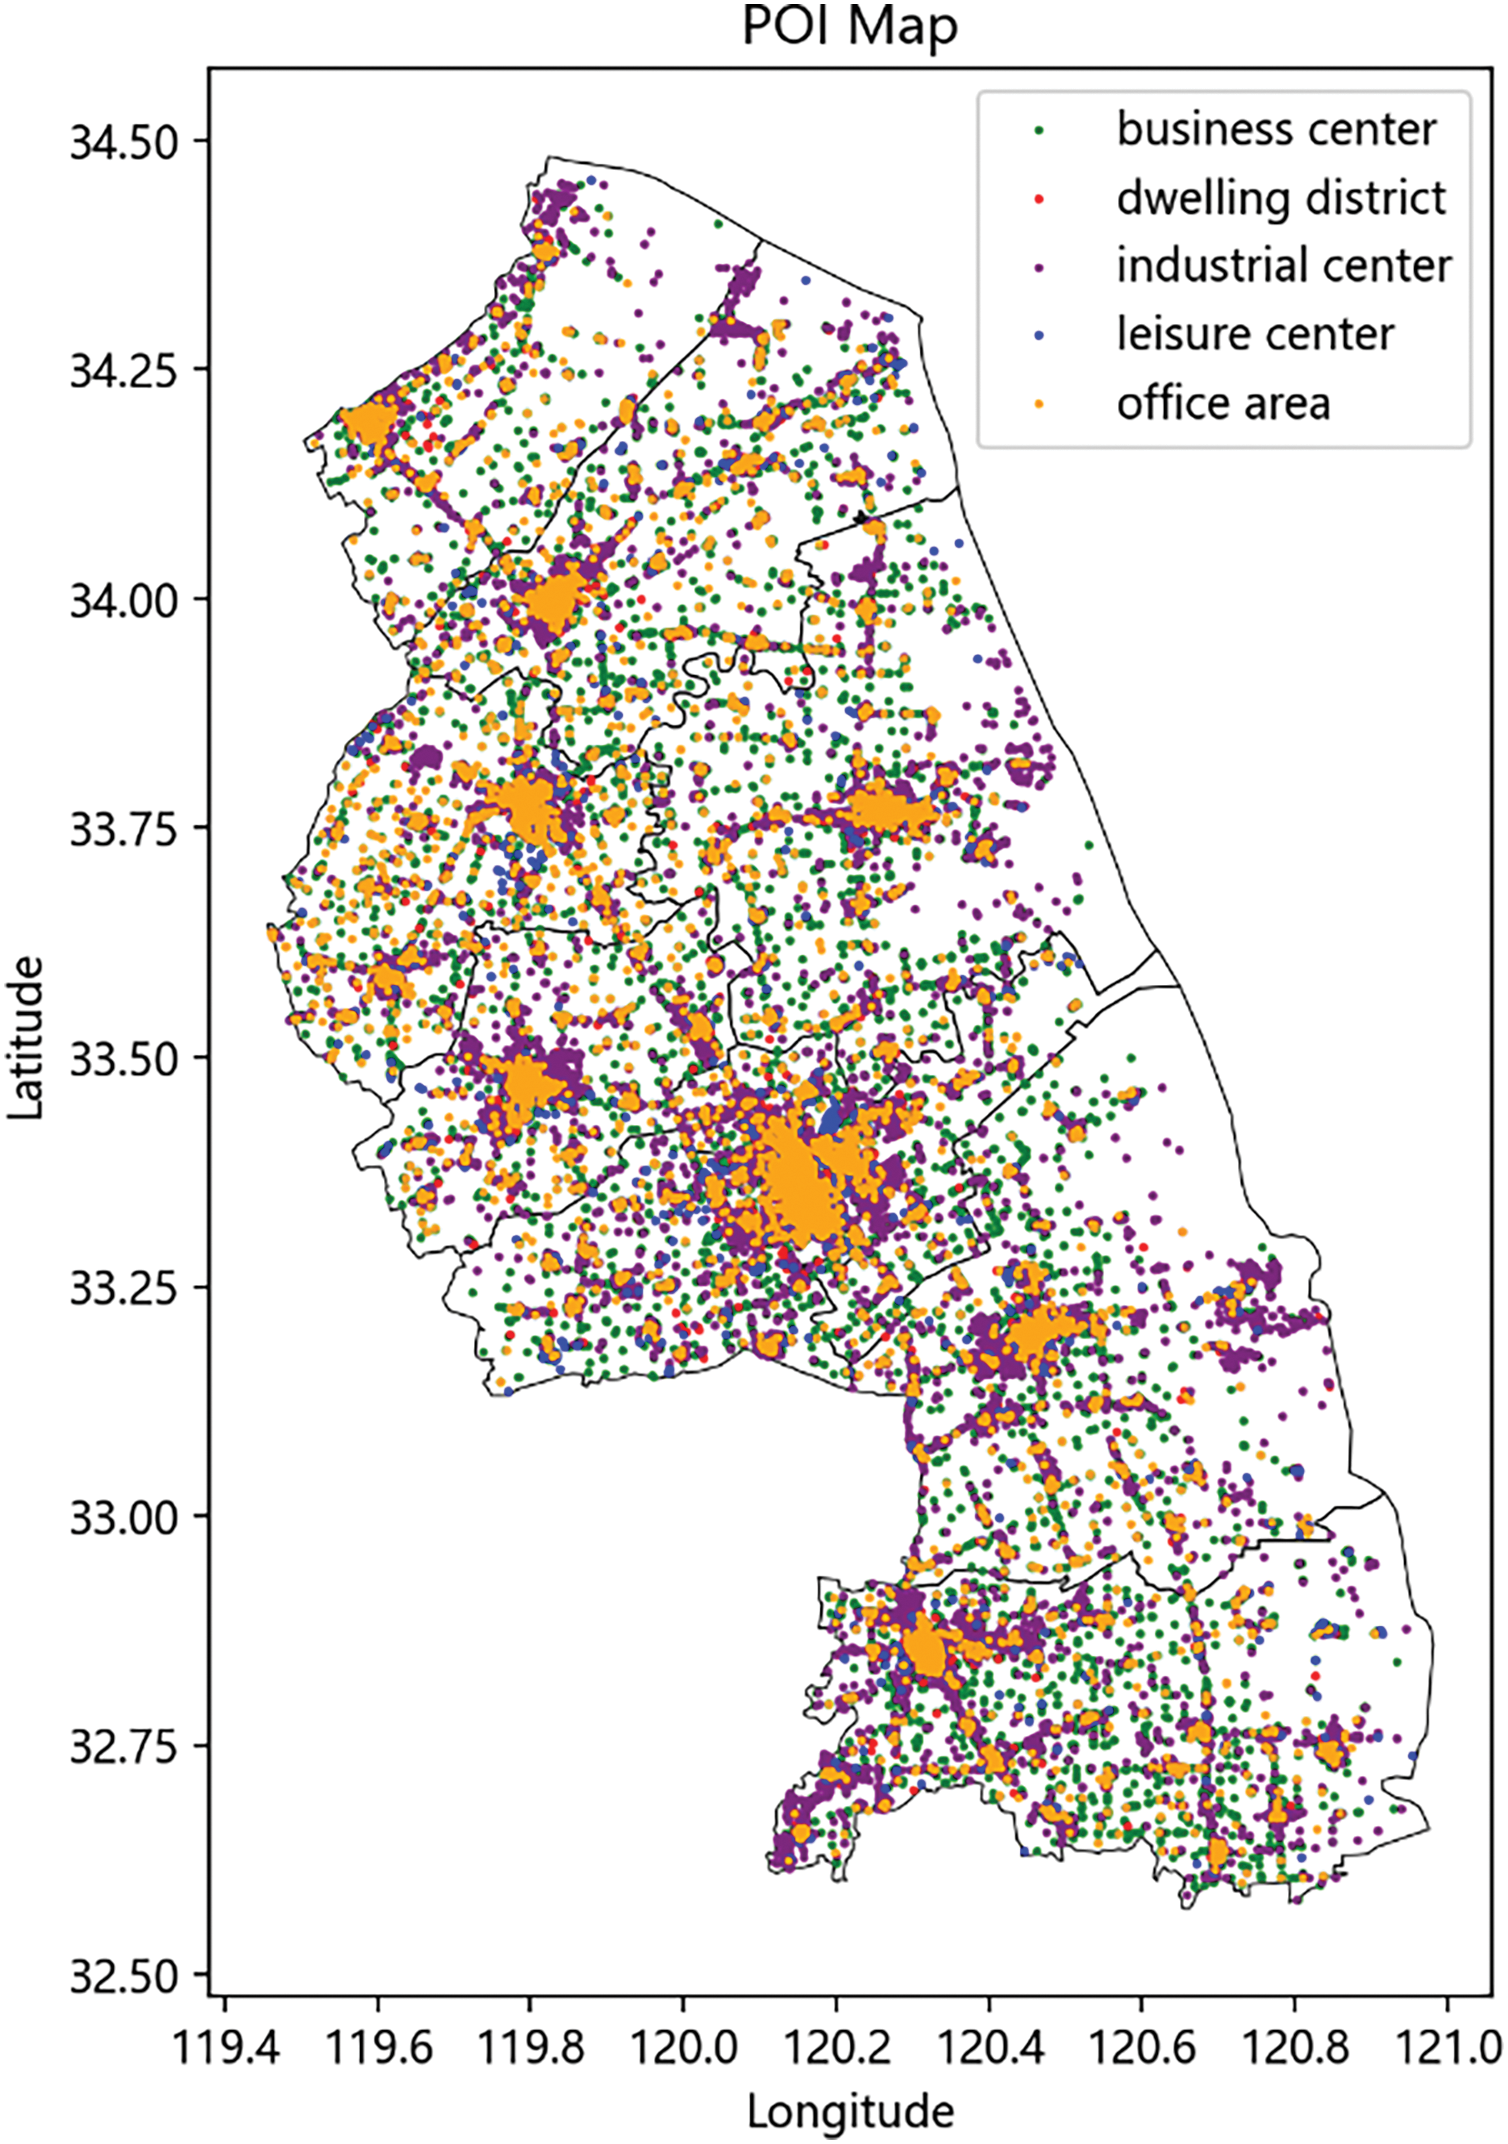
Figure 2: Yancheng City POI scatter plot
5.4 Electric Vehicle Charging Station Layout Optimization Model Combining K-Means Algorithm and DBSCAN Algorithm
The core of this paper is to combine the advantages of two clustering algorithms, K-Means, and DBSCAN, to analyze the POIs of important locations in Yancheng City in order to reveal the spatial distribution patterns of these locations. The research object of the experiment is a number of representative POIs in Yancheng city, which include locations with landmark significance such as commercial centers, tourist attractions, and transportation hubs. By clustering these POIs, it is expected to better understand the functional areas of Yancheng City and the spatial structure of the city.
First, the experiment chooses the DBSCAN algorithm for preliminary clustering analysis. DBSCAN is a density-based clustering algorithm that can recognize clusters of arbitrary shapes, which is especially suitable for dealing with complex spatial data like POIs. In this experiment, the two key parameters of DBSCAN are the neighborhood radius Eps = 1 km and the minimum number of points MinPts = 10.
The choice of Eps of 1 km is based on the spatial distribution characteristics at the urban scale that defines the neighborhood range of a point, i.e., centered on a certain POI point, all points within its radius are considered as the neighbors of that point. In city-level spatial data analysis, a distance of 1 km usually reflects the closeness of urban functional areas well. In Yancheng City, for example, the 1 km scale is sufficient to cover the relatively concentrated POI points within functional areas such as commercial districts, residential districts, and transportation hubs, which in reality are usually located within 1 km of each other. By setting the Eps of 1 km, DBSCAN is able to group those closely neighboring POIs in the city into the same cluster, effectively capturing the dense features within the area. If the Eps value is set too small (e.g., a few hundred meters), it may lead to certain closely distributed POIs being mistaken as belonging to different clusters, thus failing to completely reflect the spatial extent of a certain functional area; whereas if the Eps value is too large, POIs distributed farther away may be mistaken as neighboring, leading to the overexpansion of clusters. Therefore, a neighborhood radius of 1 km is a reasonable choice that can balance the density differences of different areas in the city.
The choice of MinPts = 10 reflects the requirement of POI density. The MinPts parameter determines whether a POI point can be a core point, i.e., there must be at least 10 other points in the neighborhood around the point to form the core of a cluster. The threshold of 10 neighbors is chosen based on the observation of POI data distribution within the city. In general, high-density areas such as commercial districts and transportation hubs in Salt Lake City usually have a larger number of POIs concentrated in a smaller area, which often contain multiple neighboring stores, office buildings, or public facilities. Therefore, the requirement of at least 10 POIs within a point’s neighborhood can ensure the identification of these truly dense functional areas. In contrast, in less dense areas (e.g., some residential or suburban areas), where POIs are more dispersed, points with fewer than 10 neighbors may be identified as noise or boundary points, and thus will not form an effective cluster.
In this way, the combination of Eps and MinPts ensures that DBSCAN can flexibly identify high-density areas and filter out sparsely distributed or isolated noise points based on the density characteristics of different functional areas in Salt Lake City. Setting Eps = 1 km and MinPts = 10 captures the tight clustering in the city center area and avoids excessive clustering in the lower-density areas, thus obtaining a more reasonable delineation of the city’s functional areas. The reasonableness of this parameter setting is that it adapts to the spatial density differences of different areas within Yancheng City, and also can effectively balance the accuracy and robustness of the clustering results.
With these parameters, DBSCAN is able to effectively distinguish high-density areas and noise points and successfully cluster the POIs of Yancheng City into 380 clusters.
After the DBSCAN clustering, the K-Means algorithm is further used to optimize the clustering results. A significant advantage of DBSCAN is that it can automatically determine the number of clusters, and the number of clusters obtained by DBSCAN in the experiments is 380, and this number of clusters is also used as the K value in the K-Means algorithm. When performing K-Means, the POI data after DBSCAN clustering is fed into K-Means with K = 380. This means that the K-Means algorithm divides all the data points into 380 clusters and iteratively optimizes the position of the center of mass of each cluster. The clustering process of K-Means aims to minimize the variance between the data points within the clusters by continuously adjusting the center of mass of the clusters. Variance between data points within a cluster by continuously adjusting the center of mass position of the clusters, thus obtaining more accurate clustering results.
The simulation environment of the experiment used Python programming language and combined it with scientific computing libraries such as Scikit-learn to implement the clustering algorithm. In order to improve the computational efficiency, spatial indexing structures such as KD trees were also utilized in the experiments to speed up the neighborhood search process of the DBSCAN algorithm. The iterative optimization of K-Means was also carried out in a high-performance computational environment, and the experimental computers were equipped with a multi-core processor and sufficient memory in order to efficiently process a large amount of POI data. Eventually, the clustering results were used to generate scatter plots by visualization tools such as Matplotlib and Seaborn, demonstrating the spatial distribution of different functional areas in Yancheng City.
In the visualization process, the 380 cluster centers obtained from K-Means clustering are presented in the form of scattered points, as shown in Fig. 3. Each point represents the center of mass of a cluster, and the location of the center of mass reflects the spatial concentration of POIs in the region. By observing the distribution of these centers of mass, it is possible to visually analyze the regional division of Yancheng City and identify the distribution of commercial centers, residential areas, and other functional areas. The experimental results show that this clustering method, which combines DBSCAN and K-Means, is not only able to discover the complex spatial distribution of POIs in Yancheng City but also improves the accuracy of the clustering results by optimizing the location of cluster centers.
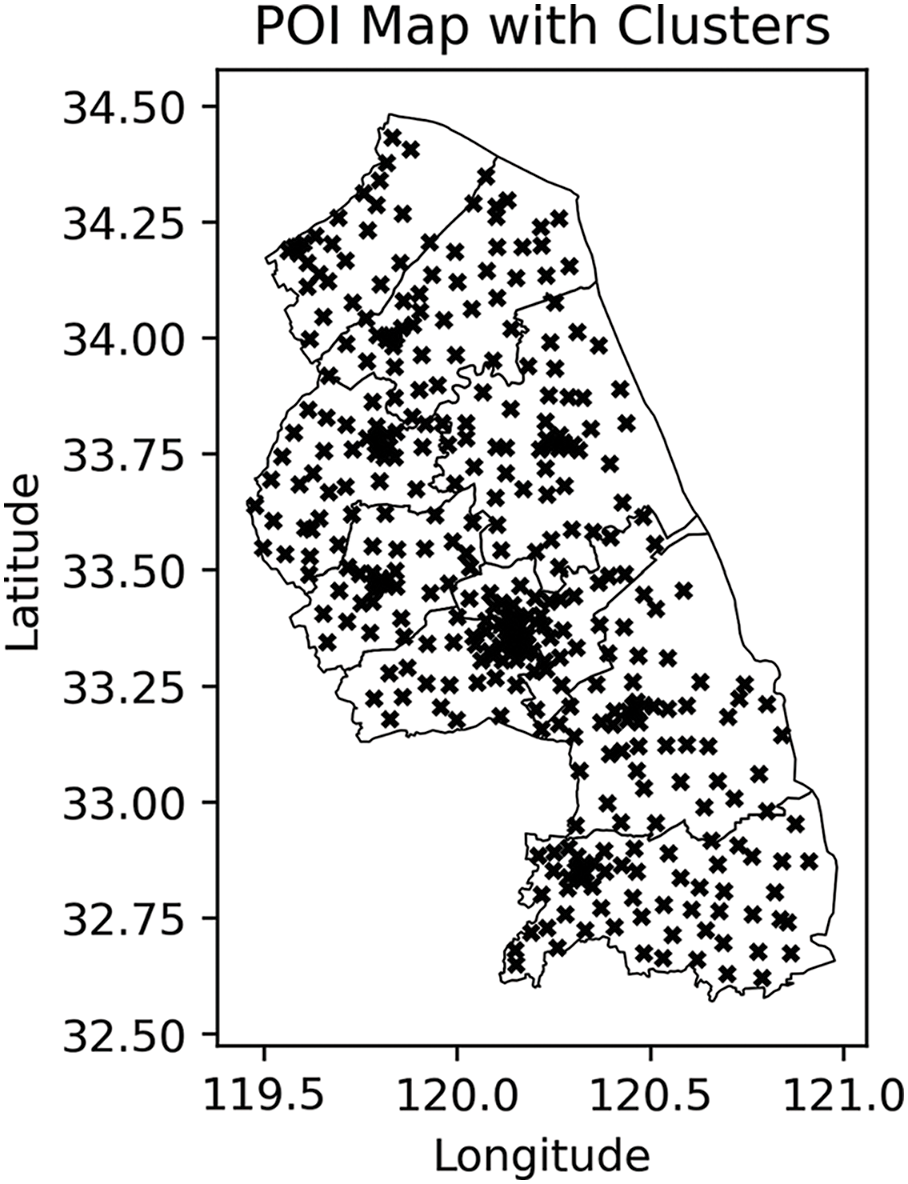
Figure 3: Yancheng City POI cluster map
5.5 Cluster Analysis and Location Entropy Improvement of Charging Station Layout
The fairness of electric vehicle charging facilities is an important issue to measure whether social groups can fairly enjoy charging station services. If the social equity of electric vehicle charging facilities is not enough, people in some areas will not be able to enjoy the services of charging stations, which will limit the promotion and development of charging stations. If you want to know whether the distribution of charging stations in a certain area is fair, the location entropy method [9] is a method to evaluate whether the spatial distribution of charging stations is uniform. Specifically, it is shown in the following Eq. (4):
Among them, the study area is divided into
According to the seventh national census data of Yancheng City, the total permanent population of Yancheng City and the permanent population of each region can be obtained, see Table 2:
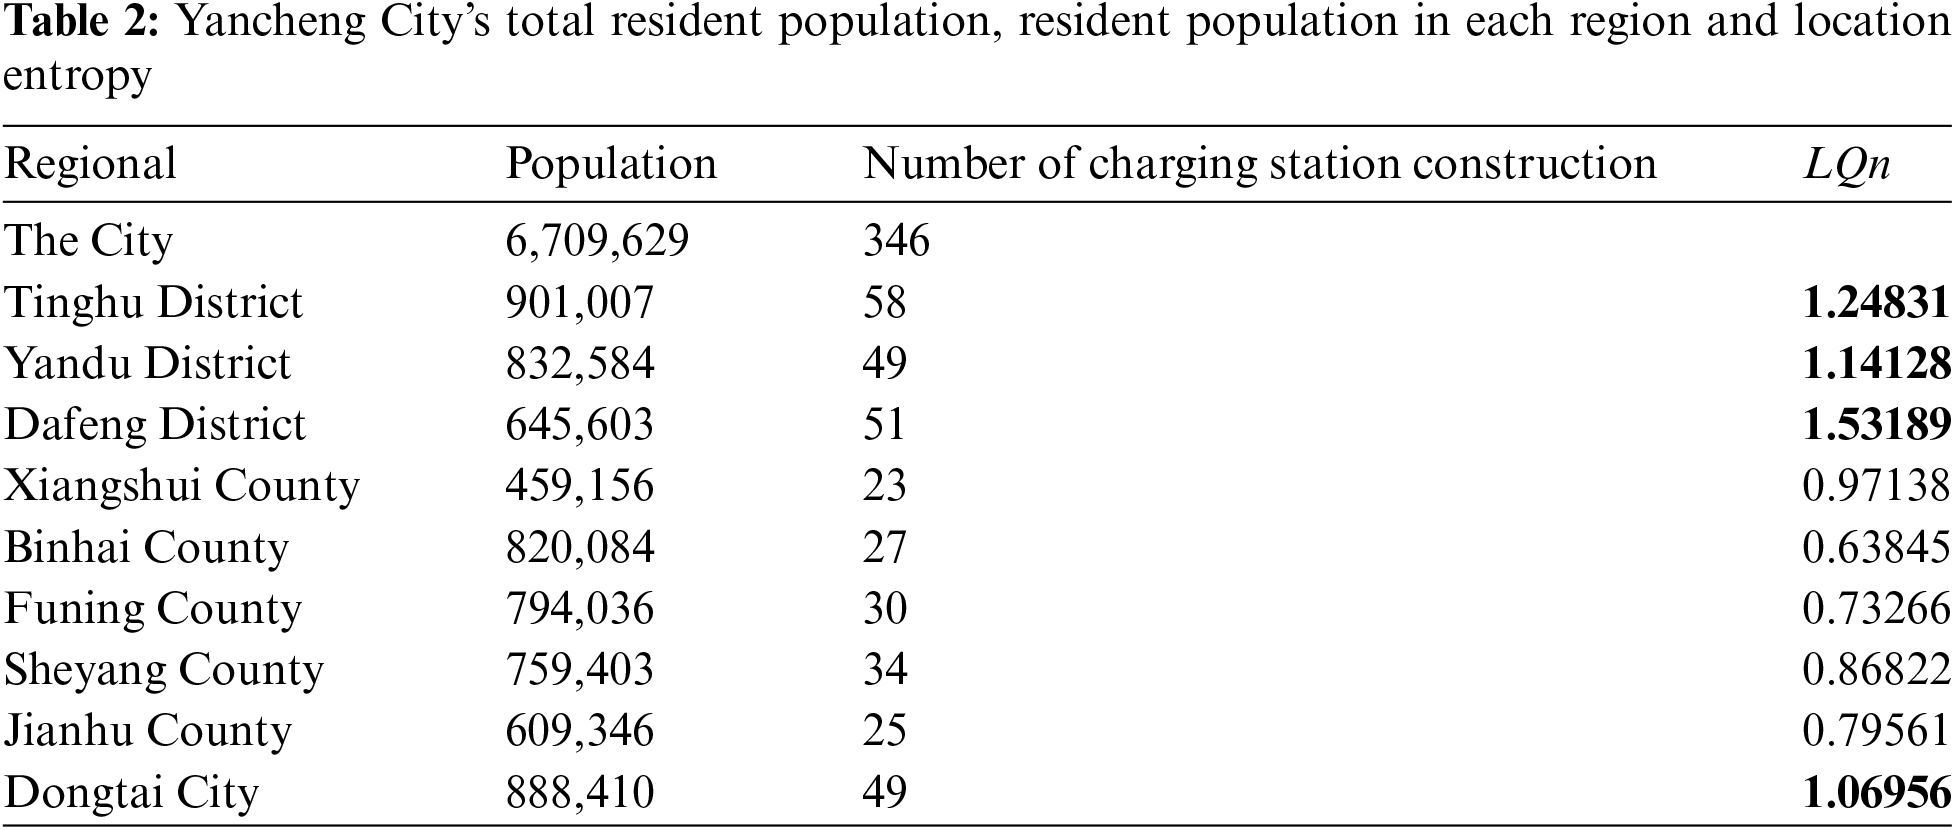
According to the above data, the fairness of Tinghu District, Yandu District, Dafeng District, and Dongtai City is excellent, the fairness of Xiangshui County is good, the fairness of Sheyang County is medium, and the fairness of Funing County and Jianhu County is to qualify, Binhai County has poorer fairness. We must first strengthen the construction of Binhai County, followed by the construction of Funing County and Jianhu County.
In this paper, by performing a GIS spatial overlay on the locations of existing charging stations and potential charging station locations obtained through a clustering algorithm, the spatial relationship between the two is intuitively revealed, and service gaps and areas of over-service are identified. The optimization of the charging station layout provides decision support, ensures a more reasonable distribution of charging facilities, effectively meets the charging needs of electric vehicle users, and thereby improves the utilization rate and service quality of charging stations.
Import SHP format maps through QGIS for overlap analysis. The overlay diagram is shown in Fig. 4 below, where the red dot represents the original charging point and the green dot represents the cluster center point.
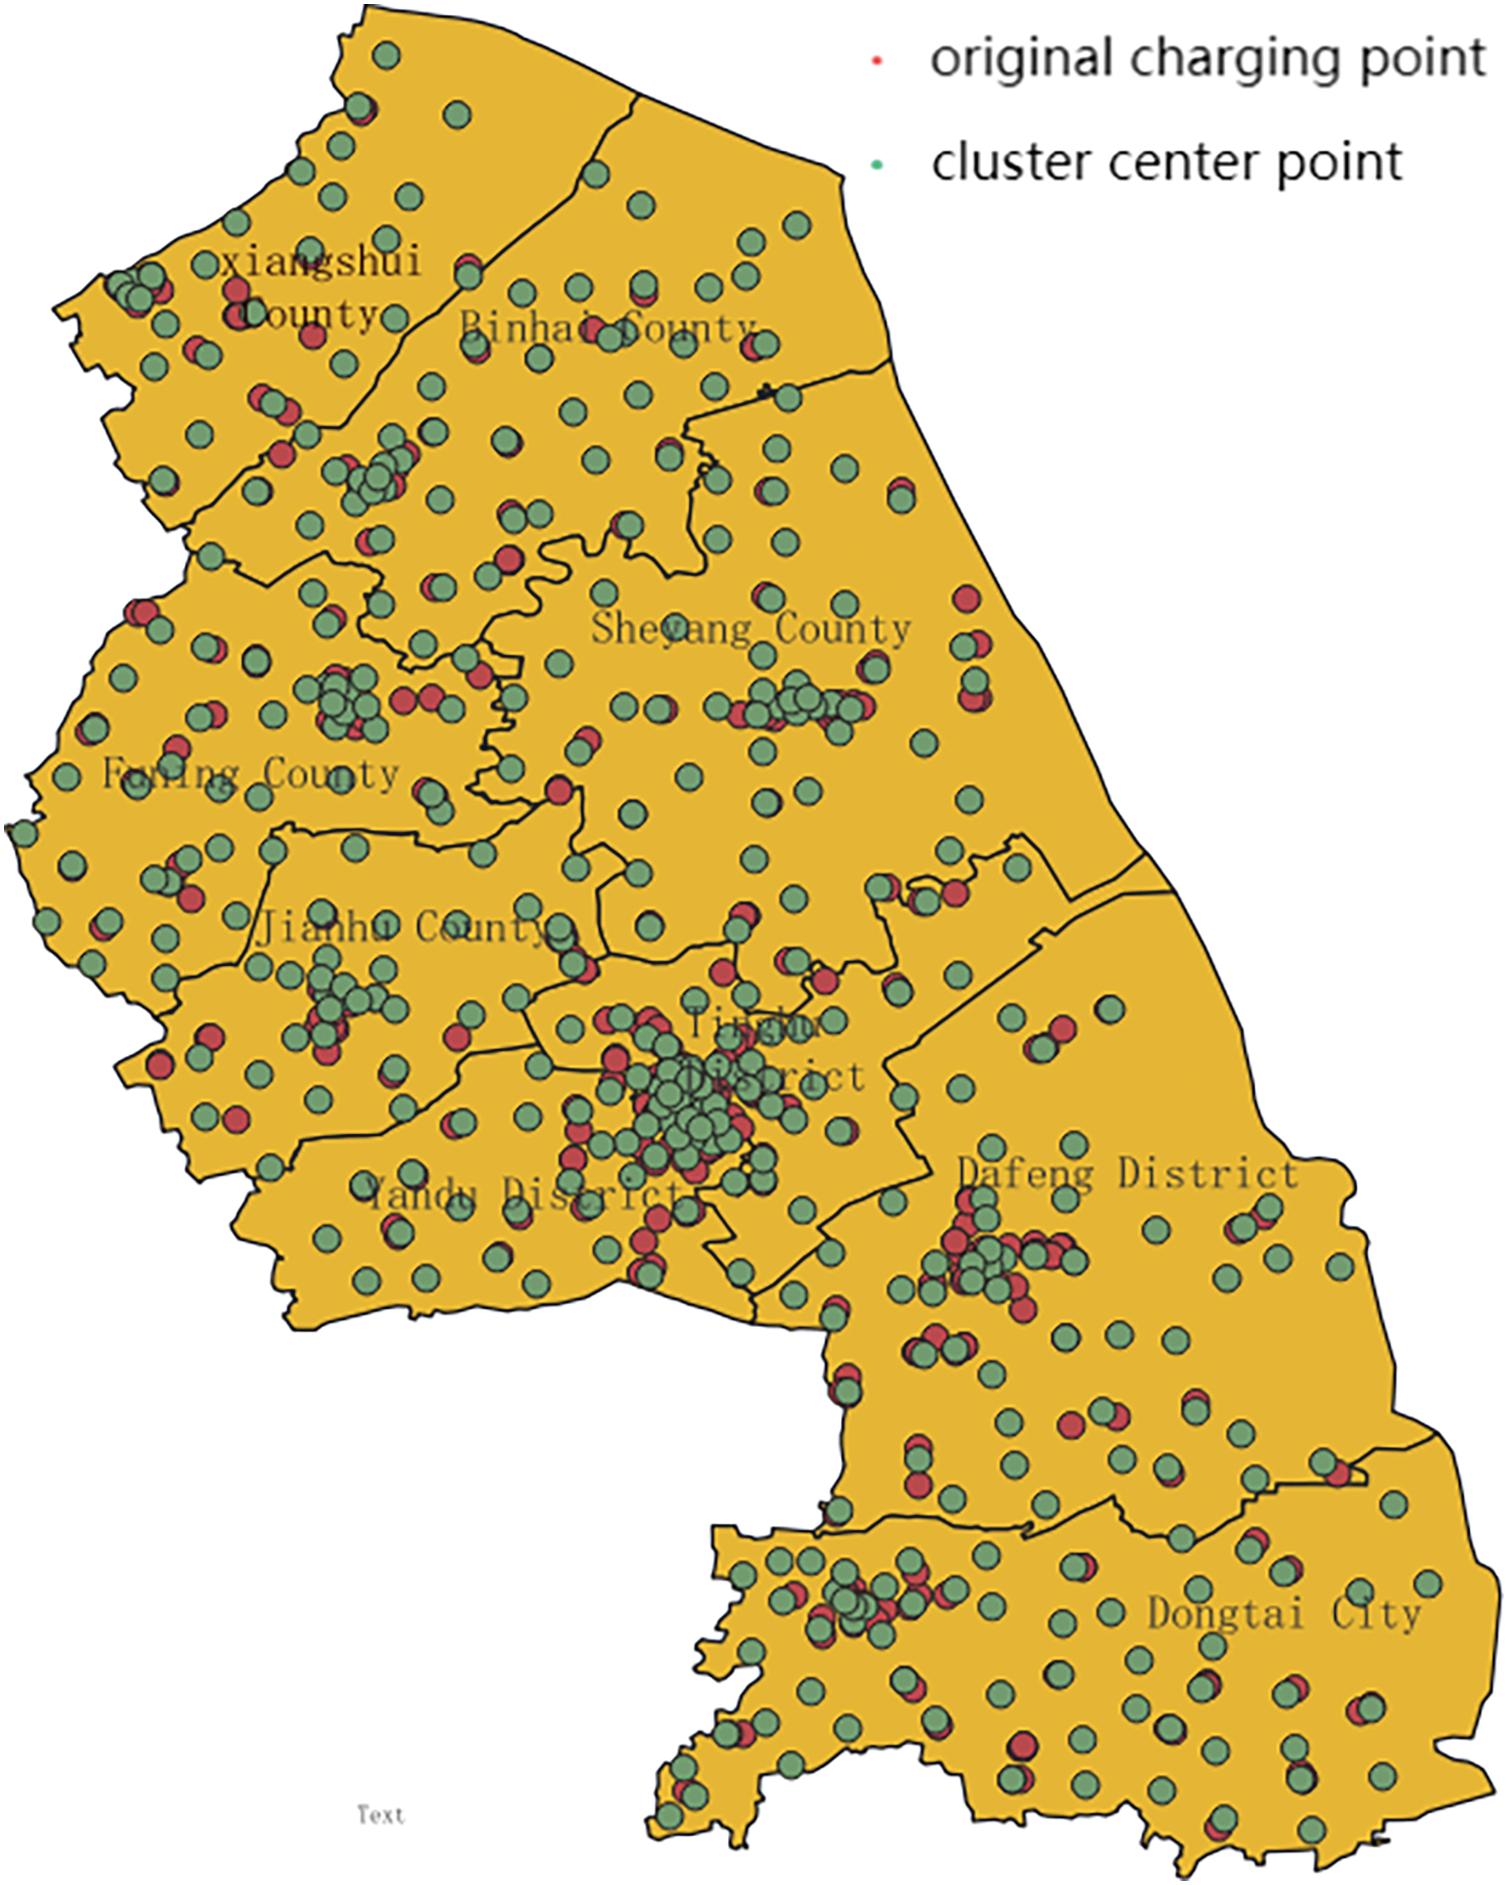
Figure 4: Overlay image
Compare the POI scatter plots of important locations in Yancheng City with the overlay plots, as shown in Fig. 5 below.
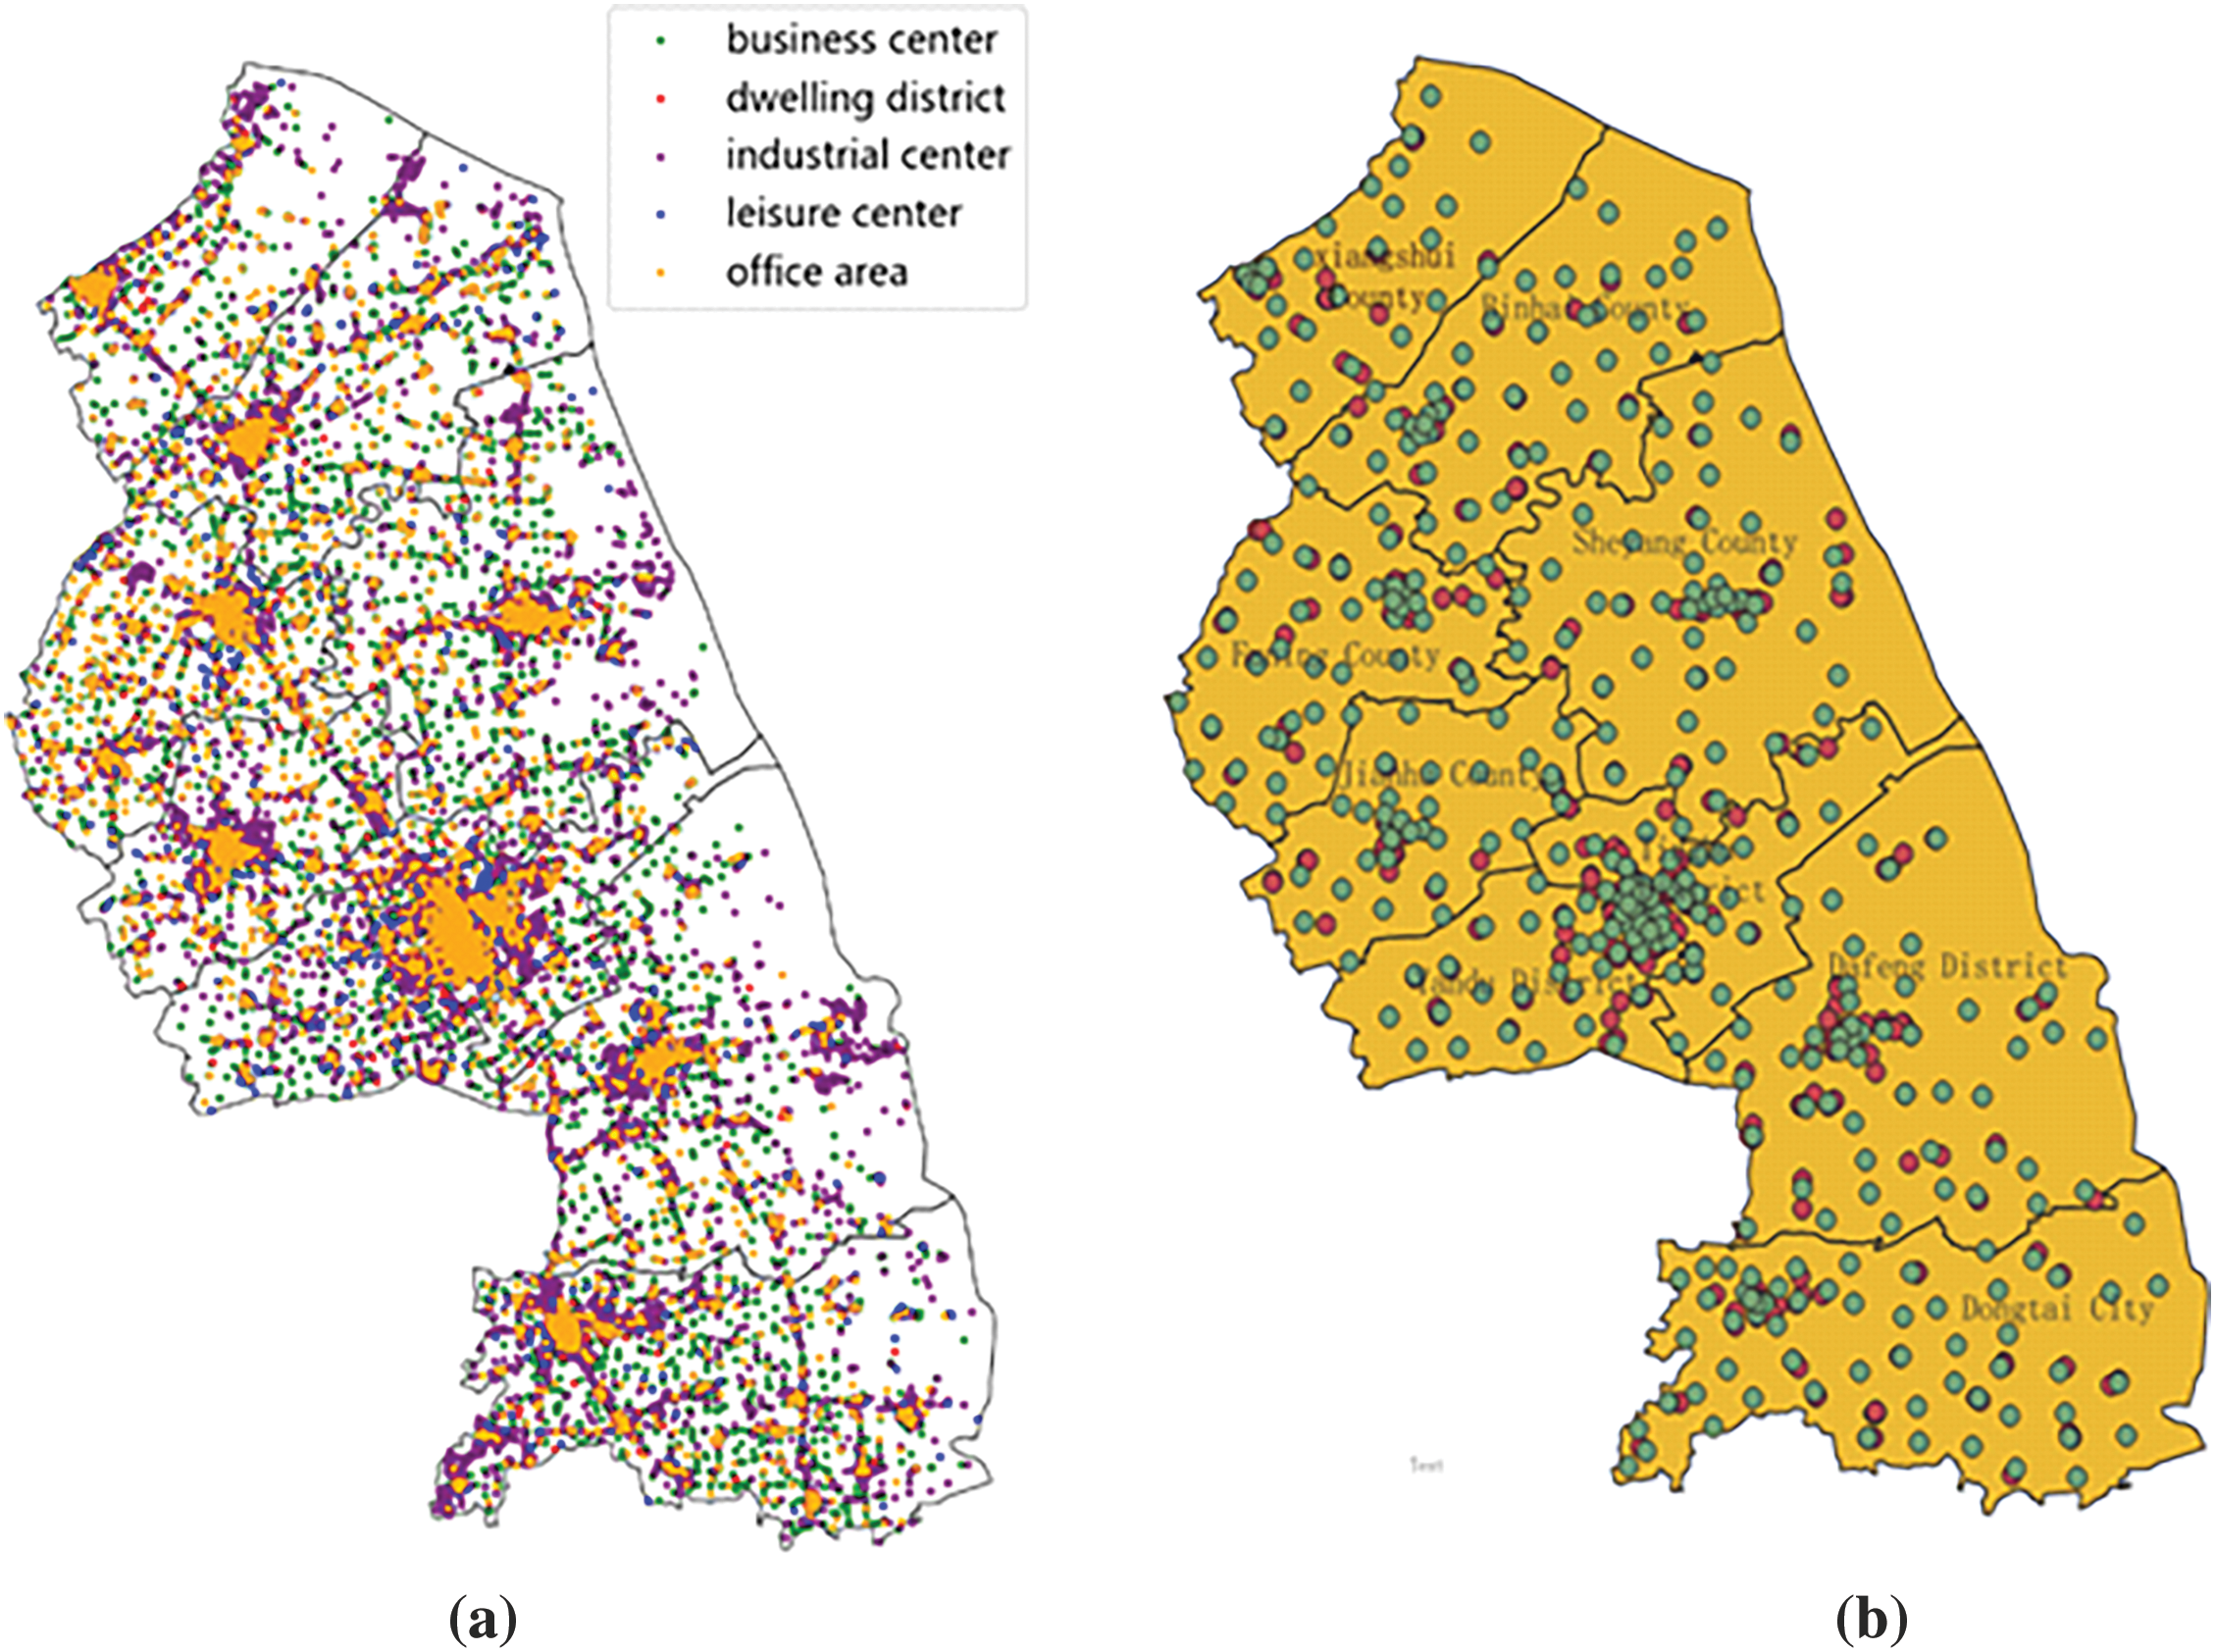
Figure 5: Comparison chart. (a) POI scatter plot of important locations in Yancheng City. (b) Overlay plot highlighting density and clustering patterns
In Fig. 5a, the place where the five colors gather in large numbers should be the place with the largest flow of people and vehicles. The green dot in Fig. 5b is where the POI gathering center of important places in Yancheng City is located, representing the place with the largest flow of people and vehicles in each region of Yancheng City. The red points, that is the points where the original charging station is close to or overlaps a lot with the center of the green cluster, indicate that it is more reasonable to establish the original charging station in places with high POI density. As can be seen from Fig. 5b, Sheyang County has a large geographical area. The layout of charging station facilities in the central area of Sheyang County is relatively reasonable, but the layout of charging station facilities around the central area of Sheyang County is relatively lacking. It is necessary to vigorously strengthen the construction of Sheyang County to meet the needs of the people, followed by the construction of charging stations in Binhai County, Xiangshui County, Funing County, and Jianhu County. Most of the two-color points in Tinghu District and Yandu District are consistent. The original layout is relatively reasonable and there is basically no need for additional construction. However, for Dafeng District and Dongtai City, appropriate additional construction is needed.
As shown in Fig. 6, the optimized location entropy shows a more stable trend, effectively balancing the population size and the distribution of electric vehicle charging stations in each region. After improvements, the layout of charging stations has been significantly enhanced in suburban and remote areas, making it easier for suburban residents to access charging facilities. This optimization not only improves the service coverage of charging stations but also greatly facilitates the daily charging needs of suburban car owners and promotes the balanced development of the charging network.
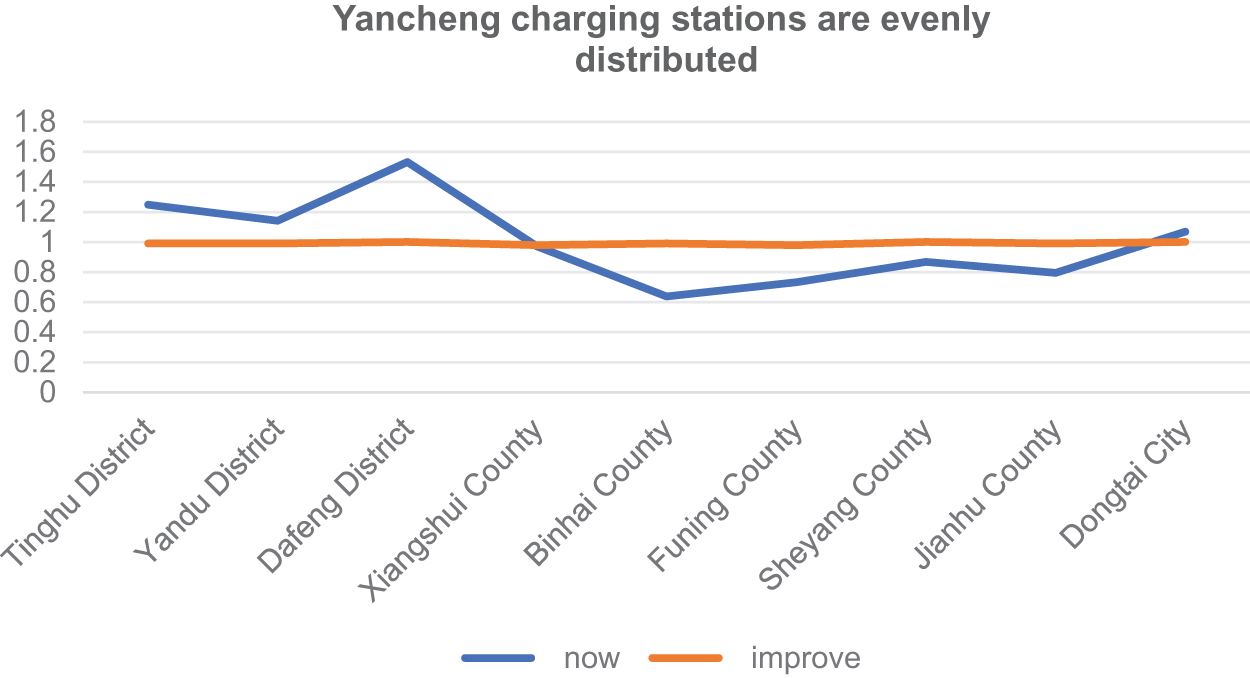
Figure 6: Comparison chart of charging stations in Yancheng City
From the perspective of location entropy, the per capita resource acquisition of charging stations in Tinghu District, Yandu District, Dafeng District, and Dongtai City is higher than the per capita resource acquisition of charging stations in general areas, Xiangshui County, Sheyang County, Funing County, Jianhu County the per capita access to charging station resources in counties and Binhai counties is lower than the per capita access to charging station resources in general areas; and the fairness is poor. In particular, the construction of charging stations in Binhai County must be strengthened. Judging from the original charging stations and aggregation centers in the overlay map, the construction of Sheyang County should be vigorously strengthened, followed by the construction of charging stations in Binhai County, Xiangshui County, Funing County, and Jianhu County. The two-color points in Tinghu District and Yandu District are mostly the same. The original layout is relatively reasonable and there is no need to increase construction. Dafeng District and Dongtai City need to increase construction appropriately. In general, priority should be given to strengthening the construction of charging stations in northern Yancheng, followed by appropriate construction in southern Yancheng.
In order to compare the superiority of the proposed method, this paper uses three data sets to evaluate the fusion clustering method, namely the Moons data set, the Circles data set, and the Blobs data set.
The proposed fused DBSCAN and K-Means method is compared with the pure K-Means method. The results of the fusion of DBSCAN and K-Means methods and the pure K-Means method on three different data sets are shown in Fig. 7. Table 3 shows a comparison of the clustering results of the fusion of the DBSCAN and K-Means methods with the pure K-Means method on different datasets.
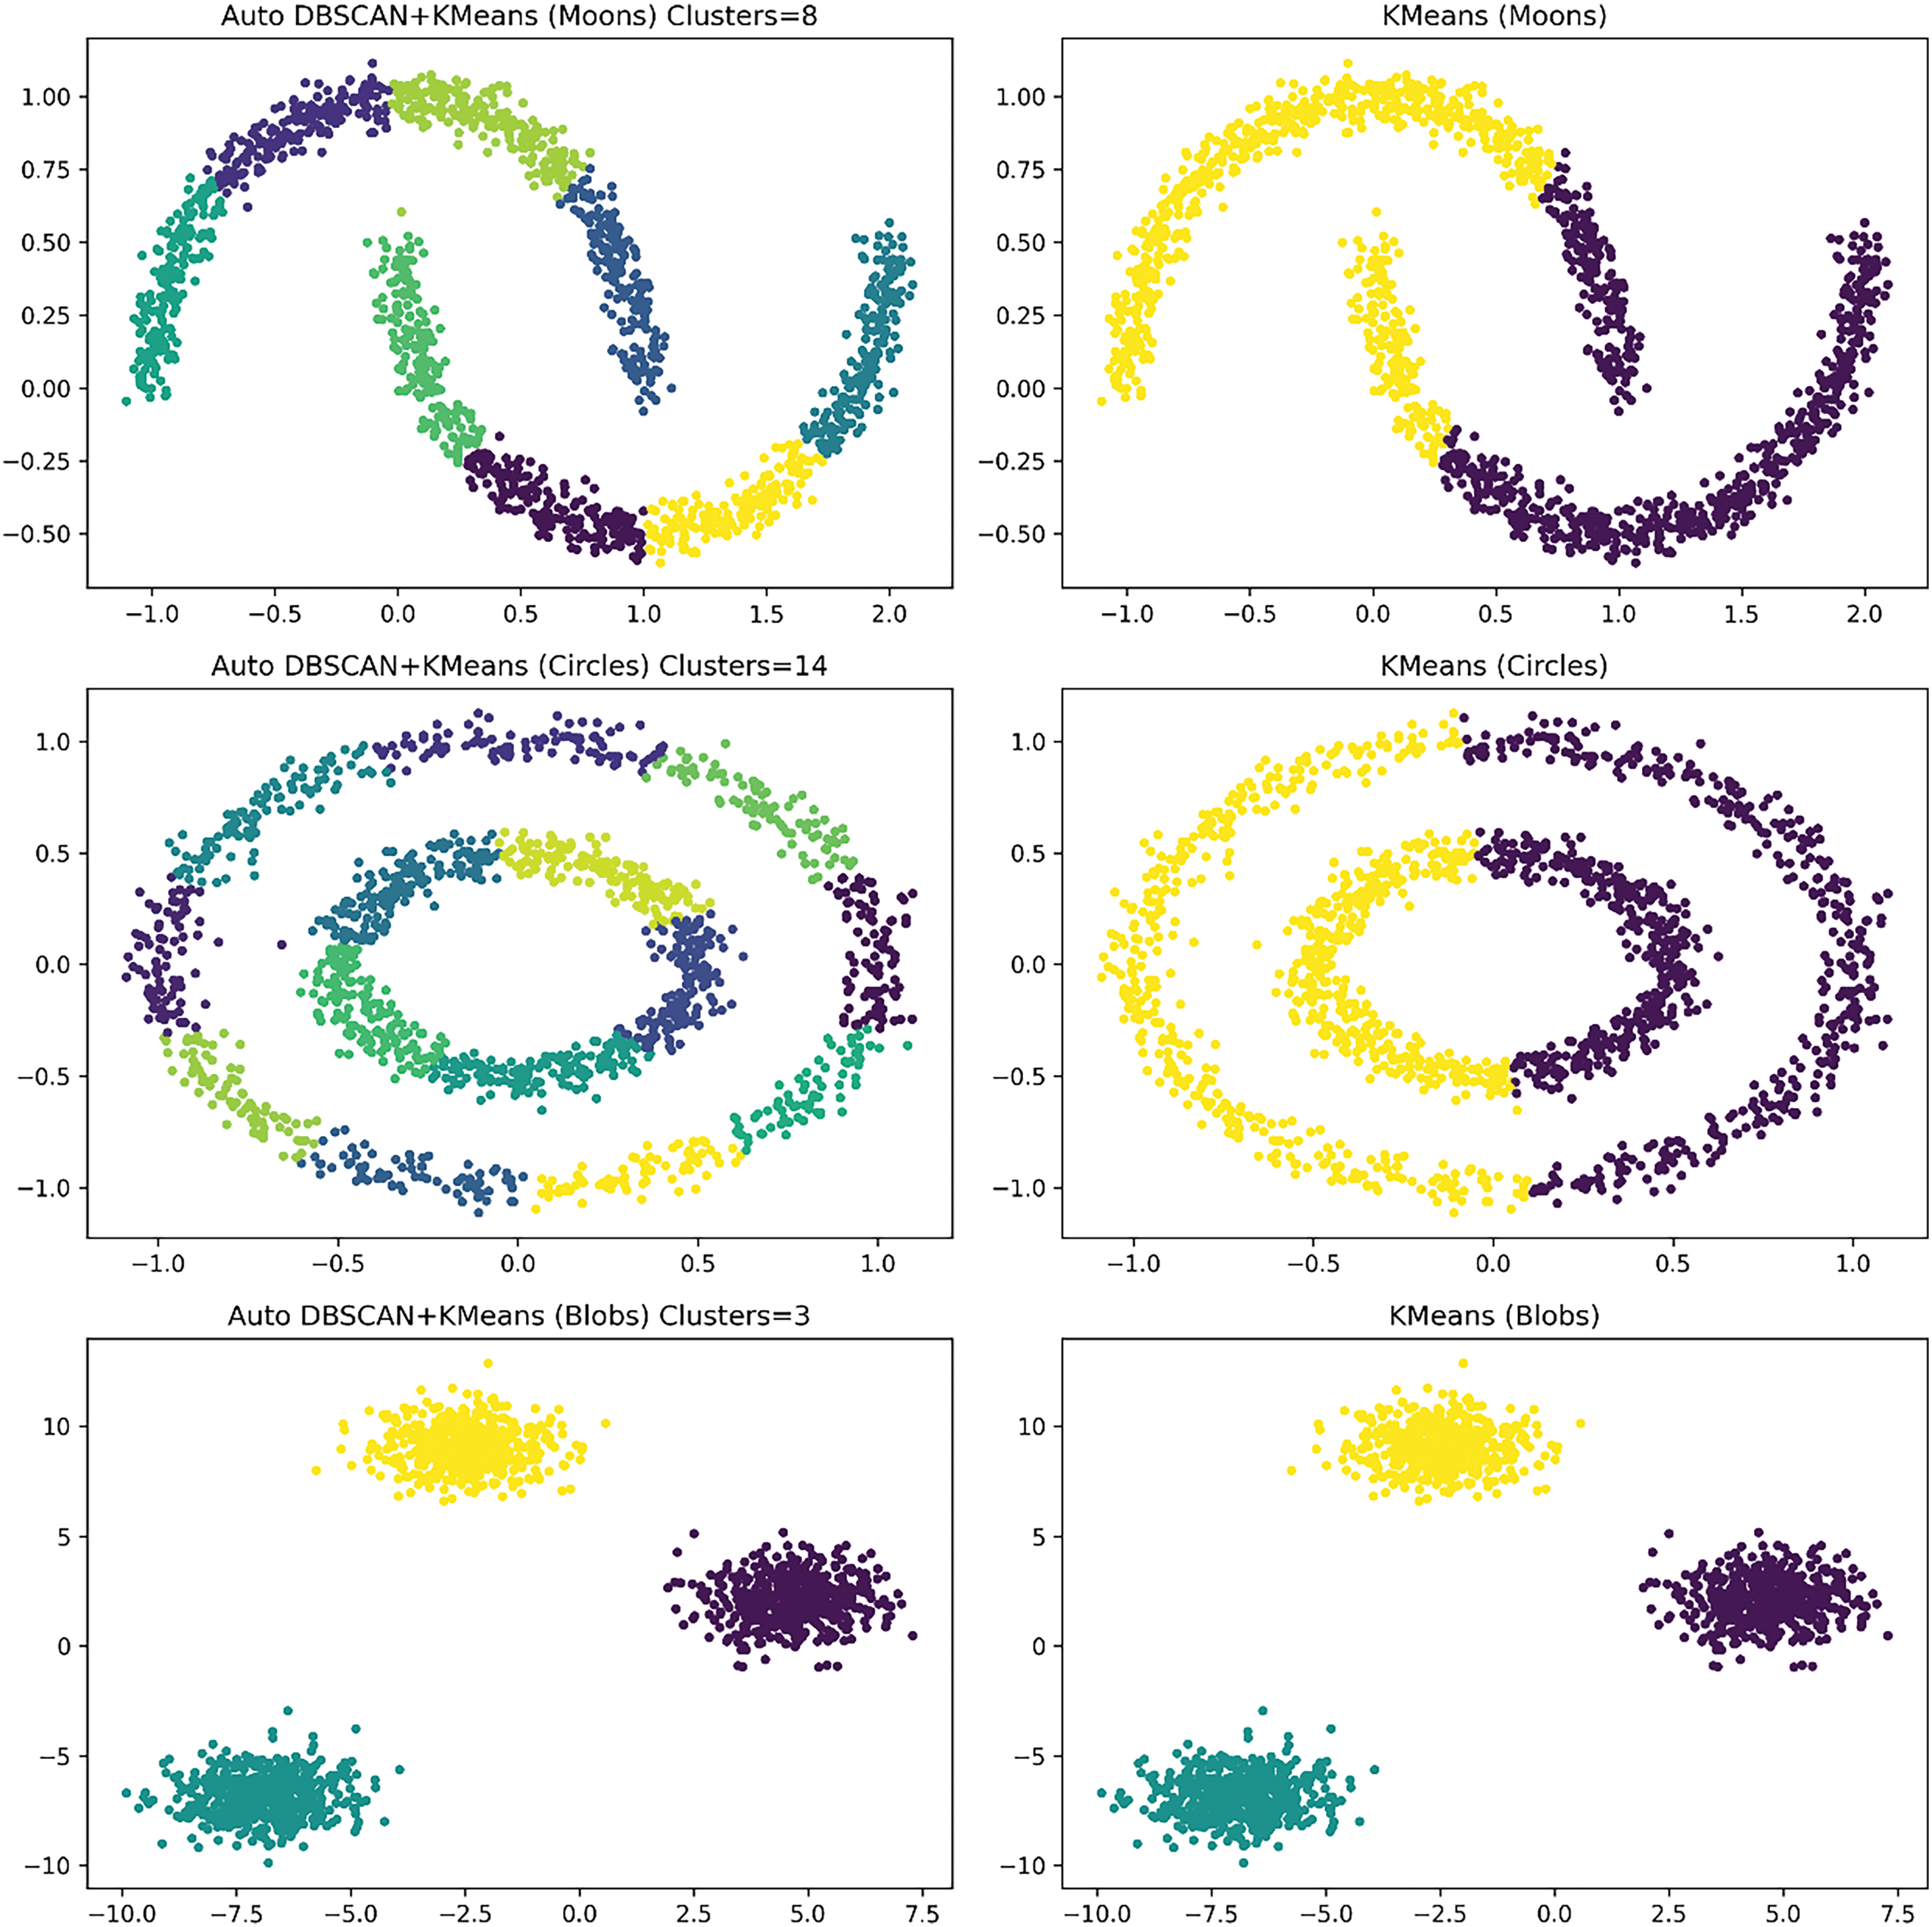
Figure 7: Comparison between the fused DBSCAN and K-Means method and the pure K-Means method
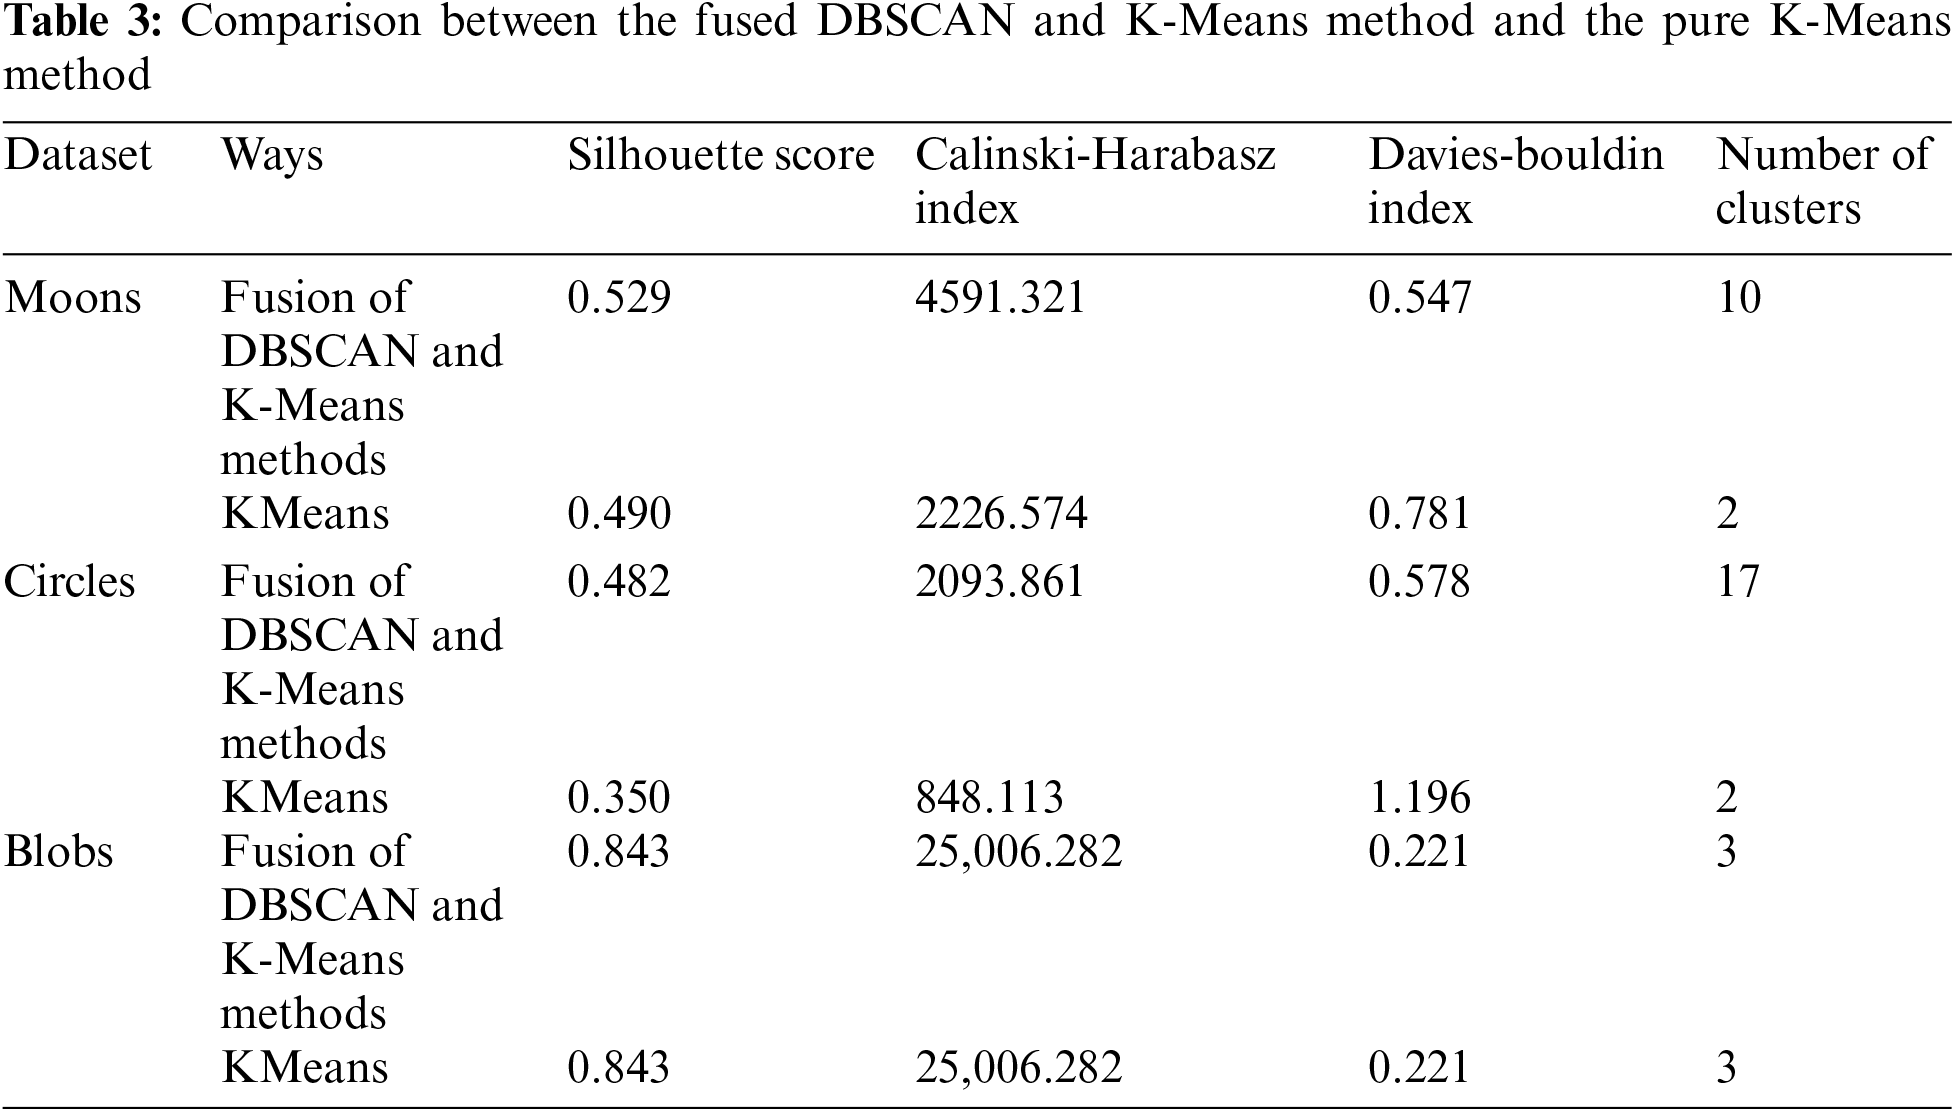
From the results in Table 3, there is a significant difference between the performance of the fused DBSCAN and K-Means method and the pure K-Means method on different datasets, especially on datasets with irregular shapes. For the Moons and Circles datasets, the contour coefficient, Calinski-Harabasz index, and Davies-Bouldin index of the fused method are better than those of the pure K-Means method. On the Moons dataset, the silhouette coefficient of the fusion method is 0.529, while K-Means is only 0.490; on the Circles dataset, the Calinski-Harabasz index of the fusion method is 2093.861, which is much higher than K-Means’ 848.113. In addition, the number of clusters for the fusion method on the Moons and Circles datasets is significantly higher than that for the K-Means method, 10 and 17, respectively, compared to only 2 for K-Means. These results show that the fusion method can better identify more clusters and provide higher-quality clustering results when dealing with datasets of irregular shapes. In contrast, the pure K-Means method performed poorly on these complex datasets. For the Blobs dataset, the two methods performed equally well, but overall, the advantage of the fusion method on complex datasets is significant.
The two pictures in the first row of Fig. 7 show the clustering results of the two methods on the Moons data set. All indicators of the fusion DBSCAN and K-Means method are better than KMeans. A higher Silhouette Score indicates that the data points within the clusters of this method are closer together and the discrimination between clusters is better. At the same time, the Calinski-Harabasz Index is significantly higher than the K-Means, indicating that the fusion of DBSCAN and K-Means methods has greater advantages in the concentration of data points within clusters and the separation between clusters. The lower Davies-Bouldin Index indicates that the fusion of DBSCAN and K-Means methods has stronger intra-cluster tightness and greater inter-cluster distance. Therefore, it can be seen that the fusion of DBSCAN and K-Means methods is more suitable for processing such complex cluster structures with overlapping and curved shapes in the Moons data set. KMeans has difficulty identifying irregular cluster shapes in this case, while the density clustering of DBSCAN the class method can better capture this complex shape. Through further fine-tuning combined with KMeans, the overall clustering effect has been significantly improved.
The two pictures in the second row of Fig. 7 show the clustering results of the two methods on the Circles data set. The performance of the fusion DBSCAN and K-Means method is still better than K-Means. A higher Silhouette Score means that the data points in the cluster are closer and the clustering effect is better; at the same time, the Calinski-Harabasz Index and Davies-Bouldin Index that combine the DBSCAN and K-Means methods are better than K-Means, which shows that DBSCAN can perform well. Identify the structure of concentric circles in the Circles dataset. However, K-Means cannot effectively handle this ring structure, resulting in its various indicators being significantly lower than the fusion of DBSCAN and K-Means methods. Therefore, it can be concluded that the Circles data set can better separate clusters using DBSCAN due to the structural characteristics of its inner and outer rings, and combined with K-Means fine-tuning, can further improve the clustering effect.
The two pictures in the third row of Fig. 7 show the clustering results of the two methods on the Blobs data set. The fused DBSCAN and K-Means method performs the same as K-Means. The values of the Silhouette Score, Calinski-Harabasz Index, and Davies-Bouldin Index are completely consistent, indicating that both methods can achieve the best results on this regular and evenly distributed cluster structure. The cluster structure of the Blobs dataset is well suited to K-Means, itself with uniformly distributed Gaussian clusters, and K-Means is already able to identify cluster boundaries well, so DBSCAN does not bring additional improvement in this scenario.
This paper conducts an in-depth study on the layout optimization of electric vehicle charging stations through the comprehensive application of POI data analysis, geographic information system (GIS) technology, and clustering algorithms. This paper proposes a clustering method that combines the K-Means algorithm and the DBSCAN algorithm to determine the optimization plan for the charging station layout. This method makes full use of the advantages of the K-Means algorithm in processing large-scale data sets and the strong robustness of the DBSCAN algorithm in processing noisy data, effectively identifying areas with dense flow of people and vehicles in the city, and providing a basis for reasonable planning of charging stations. Data support is provided.
Taking Yancheng City, Jiangsu Province in China as an example, the study used the location entropy method to evaluate the social equity of charging facilities. By calculating the number of charging stations constructed in different regions and the population ratio, the distribution balance of charging station services in each region was identified. Finally, through the overlapping analysis method, the existing charging stations were compared with the potential charging station locations obtained by cluster analysis, and the areas that needed to be optimized in the charging station layout were intuitively identified, and targeted optimization suggestions were put forward.
The research in this article not only provides a scientific and systematic methodology for the layout optimization of electric vehicle charging stations but also has important theoretical and practical significance for promoting the healthy development of the electric vehicle industry and improving the service level of charging facilities. By optimizing the layout of charging stations, users’ anxiety about battery life can be effectively alleviated, charging efficiency can be improved, and the widespread application of electric vehicles can be promoted.
Acknowledgement: None.
Funding Statement: This work was supported by the Jiangsu Science and Technology Think Tank Program (Youth) Project (JSKX24085) and the Jiangsu Provincial College Students Innovation and Entrepreneurship Training Plan Project (grant number 202311276097Y).
Author Contributions: The authors confirm contribution to the paper as follows: study conception and design: Annan Yang, Jiawei Zhang, Haojie Yang; data collection: Haojie Yang, Jiawei Zhang; analysis and interpretation of results: Annan Yang, Jiawei Zhang, Haojie Yang; draft manuscript preparation: Keyi Tao, Mengna Xu, Yuyu Zhao. All authors reviewed the results and approved the final version of the manuscript.
Availability of Data and Materials: Not applicable.
Ethics Approval: Not applicable.
Conflicts of Interest: The authors declare no conflicts of interest to report regarding the present study.
References
1. Y. Tao, M. Huang, Y. Chen, and L. Yang, “Review of optimized layout of electric vehicle charging infrastructures,” J. Cent. South Univ., vol. 28, no. 10, pp. 3268–3278, Oct. 2021. doi: 10.1007/s11771-021-4842-3. [Google Scholar] [CrossRef]
2. Z. Yi, B. Chen, X. C. Liu, R. Wei, J. Chen and Z. Chen, “An agent-based modeling approach for public charging demand estimation and charging station location optimization at urban scale,” Comput. Environ. Urban Syst., vol. 101, no. 1, Apr. 2023, Art. no. 101949. doi: 10.1016/j.compenvurbsys.2023.101949. [Google Scholar] [CrossRef]
3. J. Jordán, J. Palanca, E. Del Val, V. Julian, and V. Botti, “Localization of charging stations for electric vehicles using genetic algorithms,” Neurocomputing, vol. 452, pp. 416–423, Sep. 2021. doi: 10.1016/j.neucom.2019.11.122. [Google Scholar] [CrossRef]
4. J. Jia, C. Liu, and T. Wan, “Planning of the charging station for electric vehicles utilizing cellular signaling data,” Sustainability, vol. 11, no. 3, Jan. 2019, Art. no. 643. doi: 10.3390/su11030643. [Google Scholar] [CrossRef]
5. S. Istiqomah and W. Sutopo, “Optimization of network design for charging station placement: A case study,” in 5th North Am. Int. Conf. Indust. Eng. Oper. Manag., 2020. [Google Scholar]
6. Y. Li, W. Pei, Q. Zhang, D. Xu, and H. Ma, “Optimal layout of electric vehicle charging station locations considering dynamic charging demand,” Electronics, vol. 12, no. 8, Apr. 2023, Art. no. 1818. doi: 10.3390/electronics12081818. [Google Scholar] [CrossRef]
7. L. Wang, C. Yang, Y. Zhang, and F. Bu, “Research on multi-objective planning of electric vehicle charging stations considering the condition of urban traffic network,” Energy Rep., vol. 8, pp. 11825–11839, Nov. 2022. doi: 10.1016/j.egyr.2022.08.242. [Google Scholar] [CrossRef]
8. Z. Wang, Q. Yang, C. Wang, and L. Wang, “Spatial layout analysis and evaluation of electric vehicle charging infrastructure in chongqing,” Land, vol. 12, no. 4, Apr. 2023, Art. no. 868. doi: 10.3390/land12040868. [Google Scholar] [CrossRef]
9. F. Chen, M. Feng, B. Han, and S. Lu, “Multistage and dynamic layout optimization for electric vehicle charging stations based on the behavior analysis of travelers,” World Electr. Veh. J., vol. 12, no. 4, Nov. 2021, Art. no. 243. doi: 10.3390/wevj12040243. [Google Scholar] [CrossRef]
10. G. Zhou, Z. Zhu, and S. Luo, “Location optimization of electric vehicle charging stations: Based on cost model and genetic algorithm,” Energy, vol. 247, May 2022, Art. no. 123437. doi: 10.1016/j.energy.2022.123437. [Google Scholar] [CrossRef]
11. B. Sun, “A multi-objective optimization model for fast electric vehicle charging stations with wind, PV power and energy storage,” J. Clean. Prod., vol. 288, Mar. 2021, Art. no. 125564. doi: 10.1016/j.jclepro.2020.125564. [Google Scholar] [CrossRef]
12. L. Lei and P. Liang, “Location planning of electric vehicle charging station based on HPSO-TS,” J. Phys.: Conf. Ser., vol. 1650, no. 2, Oct. 2020, Art. no. 022097. doi: 10.1088/1742-6596/1650/2/022097. [Google Scholar] [CrossRef]
13. A. K. Kalakanti and S. Rao, “Charging station planning for electric vehicles,” Systems, vol. 10, no. 1, Jan. 2022, Art. no. 1. doi: 10.3390/systems10010006. [Google Scholar] [CrossRef]
14. Z. Yao, Y. Fu, B. Liu, Y. Liu, and H. Xiong, “POI recommendation: A temporal matching between POI popularity and user regularity,” in 2016 IEEE 16th Int. Conf. Data Min. (ICDM), Barcelona, Spain, Dec. 2016, pp. 549–558. [Google Scholar]
15. M. Ester, H. -P. Kriegel, J. Sander, and X. Xu, “A density-based algorithm for discovering clusters in large spatial databases with noise,” in Proc. Second Int. Conf. Knowl. Discov. Data Min., KDD’96, Portland, Oregon, AAAI Press, 1996, pp. 226–231. [Google Scholar]
Cite This Article
 Copyright © 2024 The Author(s). Published by Tech Science Press.
This work is licensed under a Creative Commons Attribution 4.0 International License , which permits unrestricted use, distribution, and reproduction in any medium, provided the original work is properly cited.
 Downloads
 Citation Tools