
 Submit a Paper
 Propose a Special lssue
 Open Access
ARTICLE

The intelligence of the Copts of Sudan: A test of norms validation
1 Asbiro University, Lodz, 90-265, Poland
2 Department of Continuing Studies, Mashreq University, Khartoum, 11111, Sudan
3 Department of Psychology, Umeå University, Umeå, 90187, Sweden
4 Department of Educational and Development Psychology, Technical University of Chemnitz, Chemnitz, 09111, Germany
5 College of Education, Department of Psychology, King Saud University, Riyadh, 4545, Saudi Arabia
6 College of Education, Department of Special Education, King Saud University, Riyadh, 4545, Saudi Arabia
7 College of Arts and Applied Sciences, Department of Education, Dhofar University, Salalah, 211, Sultanate of Oman
8 Department of Psychology, Ajman University, Ajman, P.O. Box 346, United Arab Emirates
9 Department of Psychology and Special Education, Princess Alia University College, Al-Balqa Applied University,
Amman, 11191, Jordan
* Corresponding Author: Edward Dutton. Email:
Journal of Psychology in Africa 2025, 35(5), 695-699. https://doi.org/10.32604/jpa.2025.067488
Received 05 May 2025; Accepted 18 September 2025; Issue published 24 October 2025
 View Full Text
 Download PDF
Abstract
This study validated the Standard Progressive Matrices (SPM+) norms in the Sudanese context. A sample of Coptic Sudanese (n = 385, girls = 34.5%) and other Sudanese children (n = 1656, girls = 51.5%) aged between 7 and 10 took the SPM+. Reliability was acceptable (Cronbach’s alpha = 0.755 for the Copts). British Intelligence Quotient (IQ) norms scores from the SPM+ for the Copts were compared to those of the (North) Sudanese, controlling for age. The mean IQ of the Sudanese Copts was 88.92, while that of the other (North) Sudanese was 78.26. This difference is consistent with the higher socioeconomic gradient of the Copts both in Sudan and in various Arab countries, such as Egypt. The 10-point difference is approximately two-thirds of a standard deviation (10/15), and is not, therefore, clinically significant. These findings suggest a need for caution when using the SPM+ with Sudanese school children, and particularly non-Coptic (North) Sudanese.Keywords
Many countries contain ethnic minorities that are relatively socioeconomically elite (Rindermann, 2018). This may be due to differences in average intelligence, modal personality, or other factors. For example, the Ashkenazi Jews constitute an elite ethnic minority in many countries and score on average a standard deviation above the mean on Intelligence Quotient (IQ) test measures (Lynn, 2012). Their General Factor of Personality (a personality g-factor which is marked by being highly socially effective) is particularly high (Dunkel et al., 2015). These higher social gradient IQ scores have been reported in European and South Asian minorities in Sub-Saharan Africa (Lynn, 2006).
The Standard Progressive Matrices (SMP+; Raven, 2008) is a widely used IQ measure in the Sudanese context (Najat, 2016). The validity and reliability study results showed that the vast majority of items in each subtest had strong internal consistency with their respective total subtest scores and the overall test score.
The Sudanese Copts. An elite ethnic minority for whom this hypothesis is yet to be tested is the Sudanese Copts. The Republic of Sudan is the third-largest African country after Algeria and the Democratic Republic of Congo. It is also extremely diverse in terms of its levels of socioeconomic development and in terms of its ethnic composition, including highly distinct groups such as the Sudanese Arabs and the Nilotic Fur in Darfur. Previous IQ test scores studies from that country include those by Irwing et al. (2008), Khaleefa (2011), and Batterjee and Ashria (2015), Estimated IQ scores based on British norms vary from between 65.90 and 84.03, with an unweighted mean of 75.73 (SD = 5.46) or 76.75 if weighted for sample size according to Lynn & Becker (2019). This mean score is congruous with the country’s geographical location between North Africa (Libya with an IQ of around 81, Egypt with an IQ of around 76) and Sub-Saharan Africa (Eritrea with an IQ of around 69, Ethiopia with an IQ of around 68 (Lynn & Becker, 2019). It is also consistent with socioeconomic differences in IQ within the country, where the IQ of children of those in elite professions, such as medicine, has been found to be around 90 or 100 (see Rushton, 1995).
The Sudanese Copts are practitioners of a form of Orthodox Christianity which broke away from the Roman Catholic Church after the Council of Chalcedon in 451, arguing that Christ is “one nature of full humanity and divinity,” with the Catholics arguing that He has “two natures” that are both fully divine and fully human. Since then, the Copts have had their own pope whose seat is in Alexandria (see Meinardus, 2002). The Sudanese Copts are highly genetically distinct from most Northern Sudanese and are extremely genetically similar to Egyptians, having intermarried very little with the Sudanese.
Many of the Sudanese Copts migrated from Egypt to Sudan around two hundred years ago, during the period of Anglo-Egyptian colonial rule. They compose about 1% of the Sudanese population, mainly living in Khartoum and other large cities. They are a mixture, genetically, between Egyptians and broader Arab populations and have about the same European admixture as do Egyptians (Hollfelder et al., 2017). Some Copts are descended from a group that migrated to Sudan when Coptic Christians began to be persecuted in Egypt after it became Islamic in the eighth century (Saleh, 2018). On many measures, the Sudanese Copts are of higher socioeconomic status than the surrounding Sudanese. They tend to be merchants, bankers, and bureaucrats and are regarded as a “privileged minority” (Kramer et al., 2013, p.117). The Copts in Egypt are also very strongly over-represented in elite professions such as medicine and government administration (Rugh, 2016; Pennington, 1982). They also have a historical tax system known as the jizya, experienced between 641 and the beginning of British rule in 1856, which may have encouraged their entrepreneurship and forced the less economically successful to convert to Islam.
The Standard Progressive Matrices (SPM) test was standardized in Sudan on a large sample of individuals aged 7 to 18 years, specifically in Khartoum (Najat, 2016). That study employed factor analysis, showing that the vast majority of items in each subtest had strong internal consistency with their respective total subtest scores and the overall test score. The study also showed that all five sets exhibited internal consistency with one another and with the total test score, indicating that the five test sets measure a single factor, with factor loadings of the five sets ranging between 0.483 and 0.880.
Najat (2016) further estimated statistically significant differences between each set and the subsequent one, reflecting a gradual increase in difficulty across the test sets. The reliability coefficients for the total test score ranged between 0.343 and 0.785. The study recommended using the test for scientific research, educational diagnostics, and counselling within the study population.
Goal of the Study
This study compared the Sudanese Copts and other Sudanese IQ SPM+ scores based on British norms from Raven (2008). We addressed the following question: Do Sudanese Copts and other Sudanese IQ SPM+ scores differ reliably?
The study of the Sudanese Copts was conducted in 2017 and was applied in all Coptic schools in the capital, Khartoum, and in Omdurman. These were Comboni (in Khartoum), Alsalam (in Khartoum North), and the Coptic school; Pastor Comboni, and the Nuns School (in Omdurman). These were representative as 70% of the students participated. The results of the North Sudanese are from Husain et al. (2019), from an administration to a representative sample of Sudanese school children, which took place in 2016. Thus, in both cases, these were representative samples.
Ethical approval for the study was obtained from the Mashreq University Research Board Committee on Research Ethics, ensuring that all procedures complied with established ethical standards for research involving human participants. Prior to data collection, informed consent was obtained from the parents of all participating children, who were provided with detailed information about the purpose, procedures, potential risks, and benefits of the study. Additionally, age-appropriate assent was obtained from the children themselves, ensuring that participation was voluntary and that the children understood their right to withdraw at any time without any negative consequences. All data were treated with strict confidentiality and used solely for research purposes.
In both cases, the SPM+ was administered. This test was developed by Raven et al. (1998) and its British norms were published by Raven (2008). It has been administered to individuals aged 6 to 80 years and is an advanced version of the Standard Progressive Matrices test initially developed by Raven in 1938 and revised in 1956. The test consists of 60 items distributed across five sets (A, B, C, D, and E), with each set containing 12 individual matrices. Each matrix consists of geometric figures or patterns, and the difficulty of the items increases progressively within each set until the end of the test. The version to be adapted into Arabic, i.e., explained to subjects via Arabic, retains the same group names (A, B, C, D, and E) and is suitable for individuals aged 6 to 80 years.
Each test item consists of a rectangle containing drawings or patterns with a missing part. The examinee is required to identify the missing part from six or eight options displayed at the bottom of the rectangle. In sets A and B, there are six options per item, whereas in the remaining sets, there are eight options per item. Set A begins with easy items, requiring simple completion skills, either through basic comparison or straightforward logical reasoning. Similarly, set B progresses in difficulty from easier to harder items, and overall, it is more difficult than set A. The primary focus of measurement in this set is the examinee’s ability to recognize symmetry among shapes.
The difficulty of items in set C increases further, making it more challenging than set B. This set measures the examinee’s ability to recognize systematic changes in shape patterns. Set D features an even greater increase in difficulty compared to set C. The focus in this set is on the examinee’s ability to reorganize or systematically and logically alter shapes.
Set E represents the most challenging level, surpassing set D in difficulty. This set assesses the examinee’s ability to analyse shapes into their components and perceive the logical relationships between these elements. The total score obtained by the examinee in the test serves as an indicator of their general cognitive ability. Additionally, the sub-scores obtained in each test set contribute to assessing the internal consistency of the test. The extent of the differences can, however, be potentially better comprehended by using the ratio scale of IQ differences, based on British norms. Based on this information, we are able to produce weighted mean IQ scores for each sample, to calculate the effect size and see whether it attains significance.
Data were analyzed using IBM SPSS Statistics version 25. Descriptive statistics, including means, standard deviations, and frequency distributions, were computed to summarize the performance of Sudanese Copts and Northern Sudanese participants on the Standard Progressive Matrices Plus (SPM+).
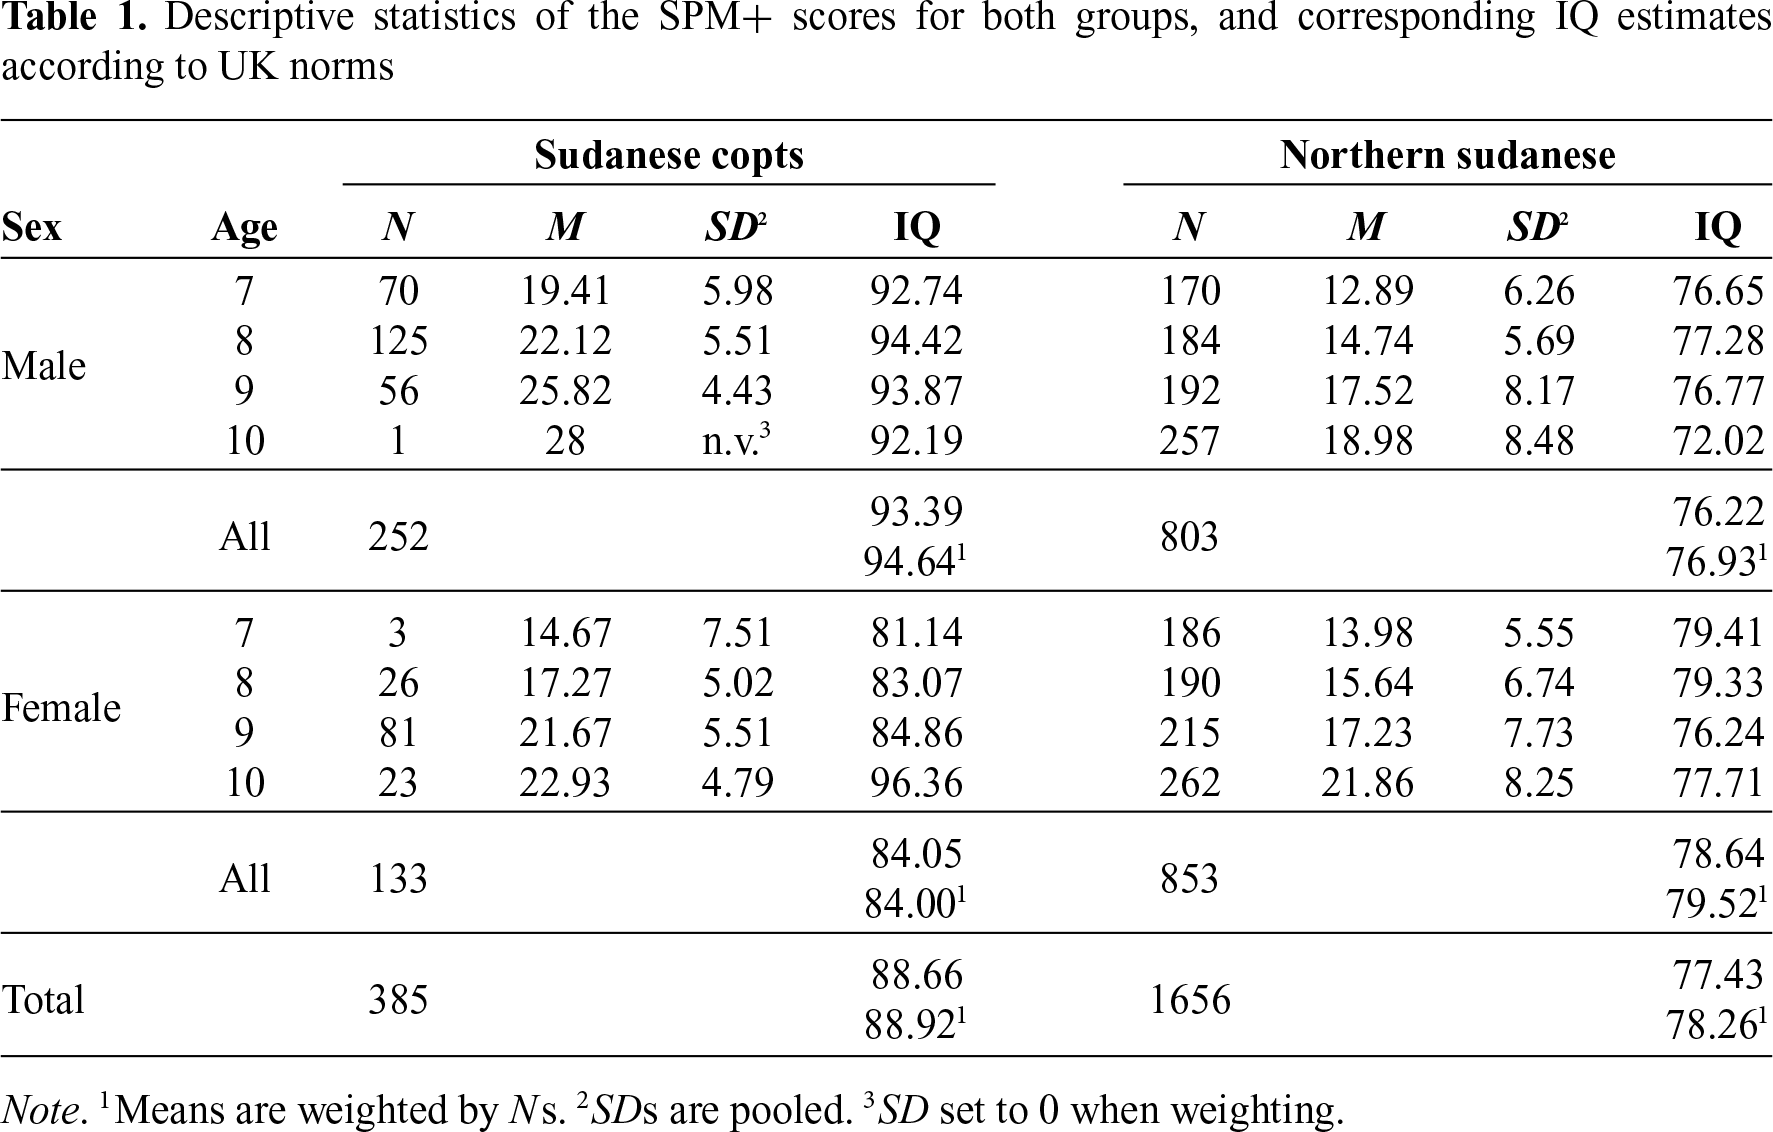
Table 1 summarizes the raw scores on the SPM+ for each ethnic and age group. It shows that the Copts have higher numbers of correct items in every age group, for both sexes. Moreover, boys tend to have higher scores within the Coptic group, whereas girls tend to have higher scores within the Sudanese group. Table 1 also lists the estimated corresponding IQ points for each of these eight groups. These were calculated based on the British scores in Raven (2008). The conversion formulas can be found in Lynn & Becker (2019). Reliability was acceptable at Cronbach’s alpha 0.755 for the Copts; for the Northern Sudanese, we refer to Husain et al. (2019).
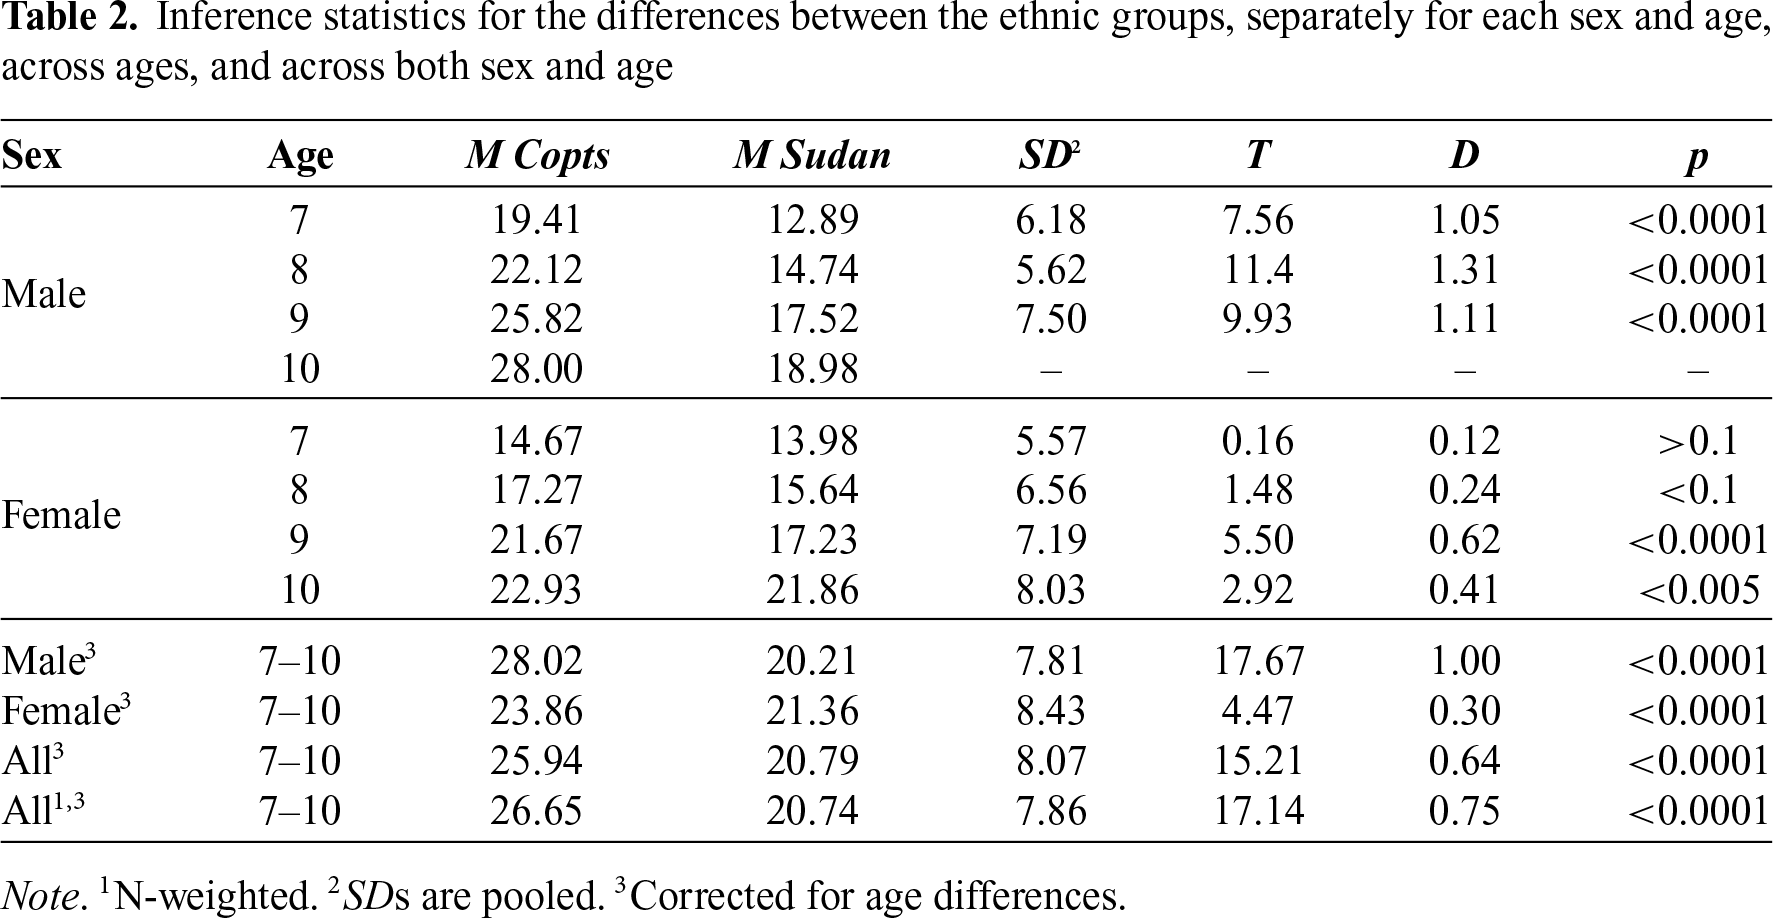
In order to compare the two ethnic groups, we controlled for age. To this end, simple regressions were computed with score as the dependent variable and age as the predictor. Across sex and all ages, the B coefficient was 2.88, which we considered appropriate given that B was in the range 2.53–3.58 for each of the four possible sex x ethnic group combinations. Age-controlled scores were then calculated by adding 2.88 for each year below 10, that is, 8.64 for 7, 5.76 for 8, and 2.88 for 9 years of age. These values were then aggregated across age and sex and used to estimate t and Cohen’s effect size d (Hedges & Olkin, 1985), using the N-weighted pooled standard deviation according to Olejnik and Algina (2000) and degrees of freedom according to the Welch-Satterthwaite equation (Welch, 1947), because of the large differences in sample size. Table 2 shows the age-controlled means, their pooled SD, and t and d estimates for the ethnic group difference, both for each age and sex group separately, each sex aggregated across age, and for the overall difference. It can be seen that all Coptic-Northern Sudanese differences were statistically significant except for the 7 and 8-year-old females and the 10-year-old males (because there was only one Coptic participant in the 10-year group).
As hypothesised, the average IQ of the Sudanese Copts was marginally higher than the average IQ of the Sudanese. The Copts scored 88.92, 11 points lower than British standard norms. This falls within the 15 point standard deviation for what is traditionally understood as normal range intelligence, the cut-off point being 85. The Sudanese scored 78.26, 7 points below this cut-off point and close to 10 points, two-thirds of a standard deviation, lower than the Copts.
With regard to the observed sex differences, the female Copts exhibited a substantial advantage over the male Copts, whereas there was an opposite trend in the Northern Sudanese group. On the one hand, matrix reasoning tests like the Raven’s are known to exhibit a male advantage, possibly because of their spatial format nature (Abdelrasheed et al., 2020; Mosing et al., 2015). On the other hand, this was not the case for the Northern Sudanese, and we can only speculate on why this might be the case. It has been argued that there are significant racial differences in sexual dimorphism (Wells, 2012), including in relation to psychological differences for reasons yet to be determined.
Limitations and future directions
It should be noted that national IQs have been heavily criticised, though when they were recalculated to take these criticisms into account, they correlated with the original IQs at 0.9. Moreover, they strongly correlate, at about 0.8, with national student achievement tests such as PISA (Lynn & Becker, 2019). They have been particularly strongly criticised in a Sudanese context due to the relative poverty of Sudan. Subjects are less likely to be familiar with geometric shapes than Westerners, for example (Dutton et al., 2018). For these reasons, many assessment tests of this kind are questionable as cross-cultural instruments (Greenfield, 1997). Future research should seek to replicate this study’s findings among different Coptic and general Sudanese student populations.
Acknowledgement: Not applicable.
Funding Statement: The authors extend their appreciation to the on-going Research Funding Program, number (ORF2025R705), King Saud University, Riyadh, Saudi Arabia, for funding this work.
Author Contributions: The authors confirm contribution to the paper as follows: study conception, writing and design: Edward Dutton, Salaheldin Farah Attallah Bakhiet; data collection: Salwa Saleh Mohamed Alamein, Yousif Balil Bashir Maki, Nasser Said Gomaa Abdelrasheed; analysis and interpretation of results: Mohammed Ateik Al-Khadher, Guy Madison, David Becker; draft manuscript preparation: Ahmad Mohammad Alzoubi. All authors reviewed the results and approved the final version of the manuscript.
Availability of Data and Materials: Due to the nature of this research, participants of this study did not agree for their data to be shared publicly, so supporting data is not available.
Ethics Approval: Ethical approval for the study was obtained from the Mashreq University Research Board Committee on Research Ethics, ensuring that all procedures complied with established ethical standards for research involving human participants. Prior to data collection, informed consent was obtained from the parents of all participating children, who were provided with detailed information about the purpose, procedures, potential risks, and benefits of the study.
Conflicts of Interest: The authors declare no conflicts of interest to report regarding the present study.
References
Abdelrasheed, N. S. G., Albaraami, Y. A. B., Dutton, E., te Nijenhuis, J., & Qatan, M. B. M. I. (2020). Sex differences in intelligence on the SPM+ in Dhofar in the Sultanate of Oman. Personality and Individual Differences, 159, 109880. [Google Scholar]
Batterjee, A., & Ashria, L. (2015). Intelligence and education: the Sudan case. Mankind Quarterly, 56, 135–166. [Google Scholar]
Dunkel, C., Reeve, C., Woodley of Menie, M. A., & Van der Linden, D. (2015). A comparative study of the general factor of personality in Jewish and non-Jewish populations. Personality and Individual Differences, 78, 63–67. [Google Scholar]
Dutton, E., Becker, D., Osman, H., Bakhiet, S., Essa, Y., et al. (2018). The Raven’s test performance of South Sudanese samples: A validation of criticisms of the utility of Raven’s among sub-saharan Africans. Personality and Individual Differences, 128, 122–126. [Google Scholar]
Greenfield, P. M. (1997). You can’t take it with you: Why ability assessments don’t cross cultures. American Psychologist, 52(10), 1115. https://doi.org/10.1037/0003-066x.52.10.1115 [Google Scholar] [CrossRef]
Hedges, L. V., & Olkin, I. (1985). Statistical methods for meta-analysis. Orlando, FL, USA: Academic Press. [Google Scholar]
Hollfelder, N., Schlebusch, C. M., Günther, T., Babiker, H., Hassan, H. Y., et al. (2017). Northeast African genomic variation shaped by the continuity of indigenous groups and Eurasian migrations. PLOS Genetics, 13(8), e1006976. https://doi.org/10.1371/journal.pgen.1006976. [Google Scholar] [PubMed] [CrossRef]
Husain, N., Meisenberg, G., Becker, D., Bakhiet, S. F., Essa, Y. A. S., & Lynn, R. (2019). Intelligence, family income and parental education in the Sudan. Intelligence, 77(1), 101402. https://doi.org/10.1016/j.intell.2019.101402 [Google Scholar] [CrossRef]
Irwing, P., Hamza, A., Khaleefa, O., & Lynn, R. (2008). Effects of abacus training on the intelligence of sudanese children. Personality and Individual Differences, 45, 694–696. [Google Scholar]
Khaleefa, O. (2011). Norms of standard progressive matrices in Khartoum state. Psychological Studies, 5, 41–76 (In Arabic). [Google Scholar]
Kramer, R., Lobban, A., & Lobban, C. (2013). Copts. In: Historical dictionary of the Sudan. Lanham, MD, USA: Scarecrow Press. [Google Scholar]
Lynn, R. (2006). Race differences in intelligence: an evolutionary analysis. Augusta, GA, USA: Washington Summit Publishing. [Google Scholar]
Lynn, R. (2012). The chosen people: a study of Jewish intelligence and achievement. Whitefish, MT, USA: Washington Summit Publishing. [Google Scholar]
Lynn, R., & Becker, D. (2019). The intelligence of nations. London, UK: Ulster Institute for Social Research. [Google Scholar]
Meinardus, O. (2002). Two thousand years of Coptic Christianity. Cairo, Egypt: American University in Cairo Press. [Google Scholar]
Mosing M., Verweij K., Madison G., Pedersen N. L., Zietsch B., & Ullén F. (2015). Did sexual selection shape human music? Testing hypothesis of music evolution using a genetically informative sample of over 10,000 twins. Evolution and Human Behavior, 36(5), 359–366. https://doi.org/10.1016/j.evolhumbehav.2015.02.004 [Google Scholar] [CrossRef]
Najat, A. M. (2016). Standardization of the advanced standard progressive matrices test in general education schools in Khartoum State [Doctoral dissertation]. Omdurman, Sudan: Omdurman Islamic University. [Google Scholar]
Olejnik, S., & Algina, J. (2000). Measures of effect size for comparative studies: Applications, interpretations, and limitations. Contemporary Educational Psychology, 25, 241–286. [Google Scholar] [PubMed]
Pennington, J. D. (1982). The Copts in modern Egypt. Middle Eastern Studies, 18(2), 158–179. https://doi.org/10.1080/00263208208700503 [Google Scholar] [CrossRef]
Raven, J. (2008). Standard progressive matrices-plus version and Mill Hill vocabulary scale manual. London, UK: Pearson. [Google Scholar]
Raven, J., Styles, I., & Raven, M. (1998). Raven’s progressive matrices: SPM plus sets A–E; parallel and new items. Oxford, UK: Oxford Psychologists Press. [Google Scholar]
Rindermann, H. (2018). Cognitive capitalism: Human capitaland the wellbeing of nations. Cambridge, UK: Cambridge University Press. [Google Scholar]
Rugh, A. (2016). Christians in Egypt: Strategies and survival. New York, NY, USA: Springer. [Google Scholar]
Rushton, J. P. (1995). Race, evolution and behavior: A life history perspective. New Brunswick, NJ, USA: Transaction Publishers. [Google Scholar]
Saleh, M. (2018). On the road to heaven: taxation, conversions, and the Coptic-Muslim socioeconomic gap in MedievalEgypt. Journal of Economic History, 78, 394–434. [Google Scholar]
Welch, B. L. (1947). The generalization of student’s problem when several different population variances are involved. Biometrika, 34, 28–35. https://doi.org/10.1093/biomet/34.1-2.28. [Google Scholar] [PubMed] [CrossRef]
Wells, J. (2012). Sexual dimorphism in body composition across human populations: Associations with climate and proxies for short- and long-term energy supply. American Journal of Human Biology, 24(4), 411–419. https://doi.org/10.1002/ajhb.22223. [Google Scholar] [PubMed] [CrossRef]
Cite This Article
 Copyright © 2025 The Author(s). Published by Tech Science Press.
This work is licensed under a Creative Commons Attribution 4.0 International License , which permits unrestricted use, distribution, and reproduction in any medium, provided the original work is properly cited.
 Downloads
 Citation Tools