
 Submit a Paper
 Propose a Special lssue
 Open Access
ARTICLE
Verification of Depth Adjustment Factor in Eurocode 5 for Tropical Hardwood Timbers
1
School of Civil Engineering, College of Engineering, Universiti Teknologi MARA Malaysia, Shah Alam, Selangor, 40450, Malaysia
2
Institute for Infrastructure Engineering and Sustainable Management (IIESM), Universiti Teknologi MARA Malaysia, Shah Alam,
Selangor, 40450, Malaysia
3
Malaysian Timber Industry Board (MTIB), Cheras, Kuala Lumpur, 56100, Malaysia
* Corresponding Author: Zakiah Ahmad. Email:
(This article belongs to the Special Issue: Advances in Eco-friendly Wood-Based Composites: Design, Manufacturing, Properties and Applications)
Journal of Renewable Materials 2023, 11(9), 3533-3546. https://doi.org/10.32604/jrm.2023.028675
Received 03 January 2023; Accepted 24 March 2023; Issue published 20 July 2023
 View Full Text
 Download PDF
Abstract
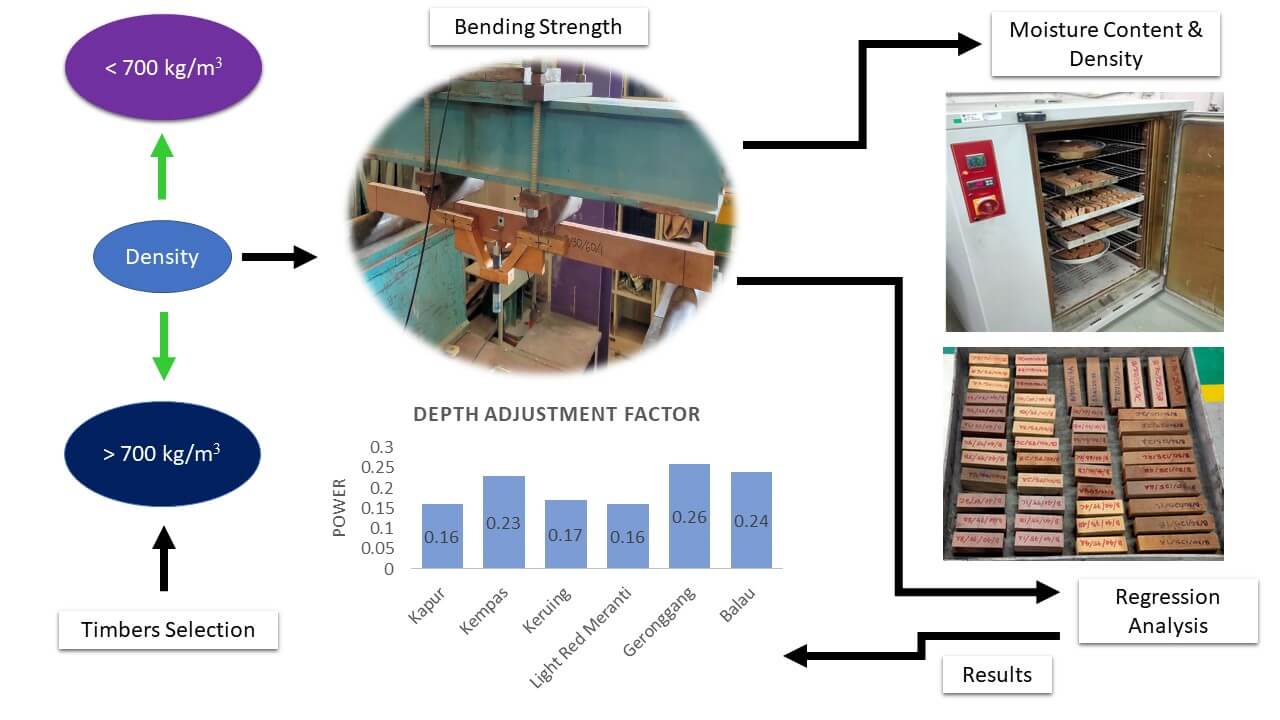
The depth adjustment factor for bending strength stated in Eurocode 5 (EC5) is only applicable to timbers having a characteristic density below 700 kg/m3 . However, most Malaysian timbers are hardwood, some with a characteristic density reaching above 700 kg/m3 . Therefore, the objective of this study was to examine whether the depth adjustment factor stipulated in EC5 is valid for Malaysian hardwood timbers. Six timber species were selected for this study, namely Kapur (Dryobalanops C.F.Gaertn.), Kempas (Koompassia Maingay ex Benth.), Keruing (Dipterocarpus C.F.Gaertn.), Light red meranti (Shorea Roxb. ex C.F.Gaertn.), Geronggang (Cratoxylum Blume) and Balau (Shorea Roxb. ex C.F.Gaertn.). The determination of bending strength and characteristic density was conducted according to BS EN 408: 2010 and BS EN 384: 2016, respectively. A graph for mean bending strength vs. (150/h) was plotted for each timber species. The power function was selected to analyze the relationship between the two variables. The power of the regression equations varied depending on the characteristic density of the timber species. For species with a characteristic density below 700 kg/m3 , such as Kapur, Keruing, and Light red meranti, the power was between 0.16 to 0.17. In contrast, for species having a characteristic density above 700 kg/m3 , namely Kempas and Balau, the power was higher at 0.23 and 0.24, respectively. Geronggang was an exception to this pattern. These values are close to the depth adjustment factor given in EC5, which is 0.2. Based on the results, it can be suggested that the adjustment factor of 0.2 is also applicable to Malaysian hardwood timbers with a characteristic density above 700 kg/m3Graphic Abstract
Keywords
Eurocode 5 (EC5) [1] is a part of the construction-related European Standard (EN) series. It specifies that buildings and civil engineering projects made use of timber should be designed according to the limit state design principle. The advantage of the limit state design principle is that it considers the ultimate strength and serviceability of the structure under different load combinations. Knowing the strength characteristics of timber members is essential for ensuring the structure’s safety and its load-bearing capacity [2]. However, the Malaysian Standard continues to utilize the permissible stress design philosophy for designing timber structures. The permissible stress is determined by multiplying the grade stress by a series of modification factors. The design stresses for tension, compression, shear, and bending, as outlined in MS 544: Part 2: 2017, are derived from the stresses of small clear specimens that was typically determined by standard laboratory testing method. Despite the fact that small clear specimens that are devoid of defects are commonly used in laboratory tests, they do not provide an accurate reflection of the mechanical strength of timber used in structural applications. As a result, the concept of permissible stress design has been disregarded for the past decade. Instead, new approaches, such as those found in the EC5 [1], have been adopted to provide a better evaluation of timber strength. Therefore, it is crucial for local engineers to adopt EC5 [1] in order to guarantee the continuity of design philosophies described in the British code of practice and also to ensure the safety of the timber structures [3].
The characteristic stresses employed in limit state design stipulated in EC5 [1] were derived from structural size specimens. The mechanical properties determined using structural size specimens are known as the characteristic values which are taken as 5% or less of the normal distribution [4,5]. The characteristic values have no built-in safety factors which is different from the grade stresses given in the Malaysian Standard [6,7]. Several studies have been conducted to determine the strength properties of Malaysian hardwood timbers according to EC5 [8–10]. To obtain the characteristic value of a timber species, it is necessary to adjust the strength data using formulae to the standard reference conditions specified in BS EN 384: 2016 [11]. The standard provides means for adjusting the strength data based on moisture content, timber size, and test length. These adjustments are crucial to ensure that the strength data obtained from testing is comparable across different timber species and conditions.
This study focused only on the depth adjustment factor for bending strength. It is worth noting that the depth adjustment factor for bending strength of 0.2, as stated in BS EN 384: 2016, is only applicable to temperate softwoods and hardwoods with a characteristic density of no more than 700 kg/m3 [11]. While some tropical hardwoods are listed in EC5 [1], they might not be sourced from Malaysia but from other countries in Southeast Asia, Burma, India, The Andamans, Sri Lanka, Thailand, South Vietnam, Cambodia, and the Philippines [12]. The characteristics and densities of these species may vary from those found in Malaysia. The density of Malaysian heavy hardwoods and medium hardwoods ranges from 880 to 1200 kg/m3 and 720 to 880 kg/m3, respectively. On the other hand, the density of light hardwoods is less than 720 kg/m3 [6,7]. The lack of an established depth adjustment factor for Malaysian tropical hardwoods prompted this study, which aimed to investigate whether the depth adjustment factor specified in EC5 [1] is also applicable to Malaysian hardwoods with varying densities. Six Malaysian hardwoods, with characteristic densities ranging from 327 to 855 kg/m3, were selected for this study.
Six Malaysian hardwood timbers, namely Kapur (Dryobalanops C.F.Gaertn.), Kempas (Koompassia Maingay ex Benth.), Keruing (Dipterocarpus C.F.Gaertn.), Light red meranti (Shorea Roxb. ex C.F.Gaertn.), Geronggang (Cratoxylum Blume), and Balau (Shorea Roxb. ex C.F.Gaertn.) were selected for this study. The timbers were sourced from three different regions in Malaysia: Pahang, Johor, and Sarawak. The selection of the timber species was based on their common usage and availability from the local sawmill. Prior to testing, the timbers were sawn into structural size specimens in accordance with BS EN 408: 2012 [13]. The different dimensions used in this study are tabulated in Table 1.

Following the sawing process, the specimens were air-dried to a moisture content (MC) less than 19%. The duration required for air-drying varies, depending on the species, density and sizes. After achieving the targeted MC, the specimens were visually graded by professional grader from Malaysian Timber Industry Board (MTIB) into HS grade in accordance with EN 1912: 2012 [14]. The total number of specimens used in this study was 1445 as shown in Table 2.

The test was conducted in accordance with BS EN 408: 2012 [13]. The test method prescribed by the standard represents a 4-point bending with a loading rate adjusted to reach the maximum load within (300 ± 120) s. The bending specimens were subjected to two loads placed at a distance, a = L/3 from the supports, where L is the bending span which was 18 times the specimens’ depth. The load was applied to the specimens in two symmetrical points. The specimens were simply supported as illustrated in Fig. 1. In addition, special bracings as shown in Fig. 2 were needed for specimens with the dimensions of 30 mm × 100 mm × 2000 mm and 30 mm × 125 mm × 2500 mm. These bracings were crucial to keep the specimen in place and to prevent lateral torsion. The dimension of each specimen, i.e., width, thickness and length were recorded prior to the destructive bending test. The bending test was conducted for each specimen until failure [13] and the modulus of rupture (MOR) was then calculated for each specimen. After the test, a section was cut from each specimen to determine its MC and density according to MS 837: 2006 [15].
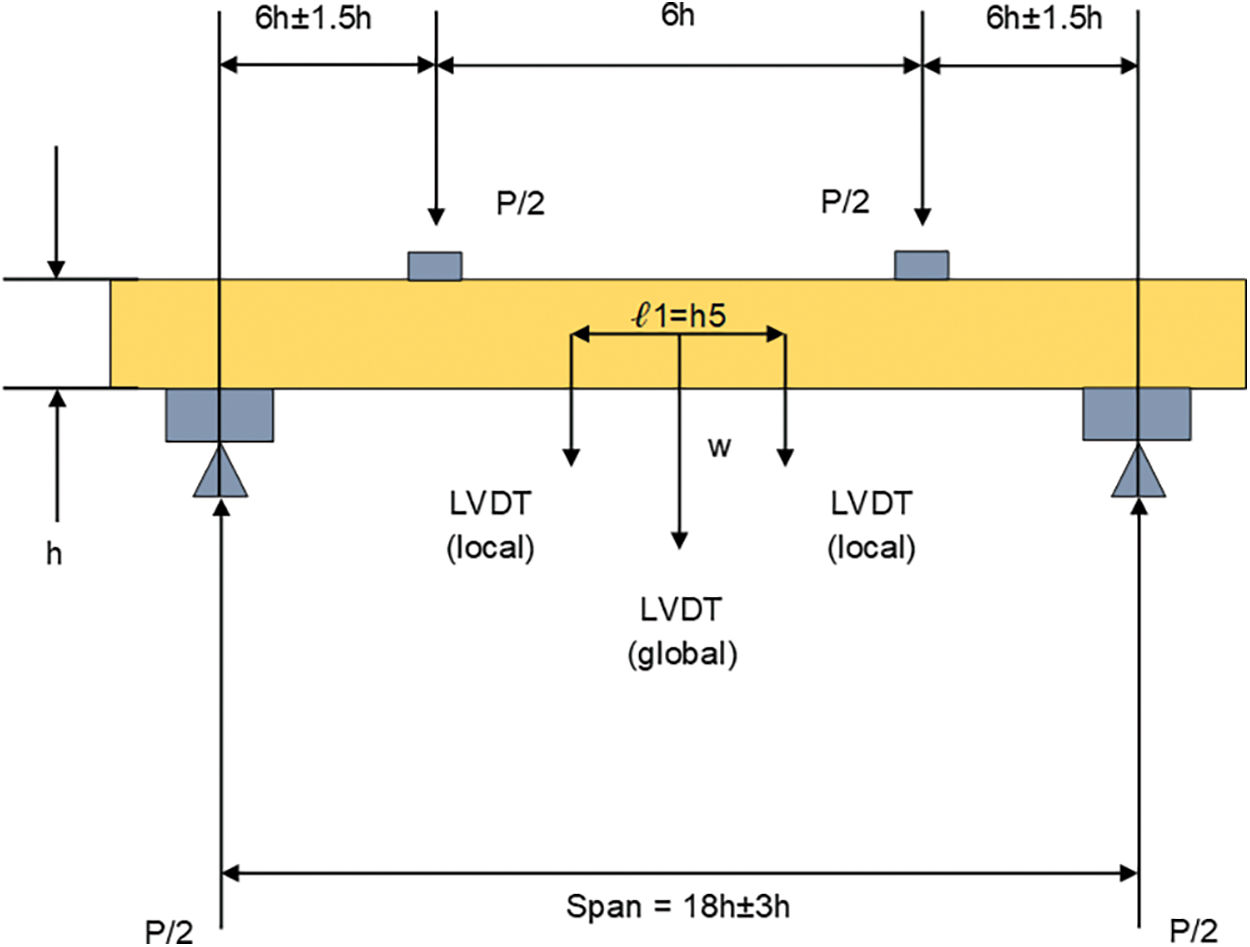
Figure 1: Bending test setup for structural size specimens according to BS EN 408: 2012
where:
P load in newtons;
h beam height in mm;
w deformation direction.
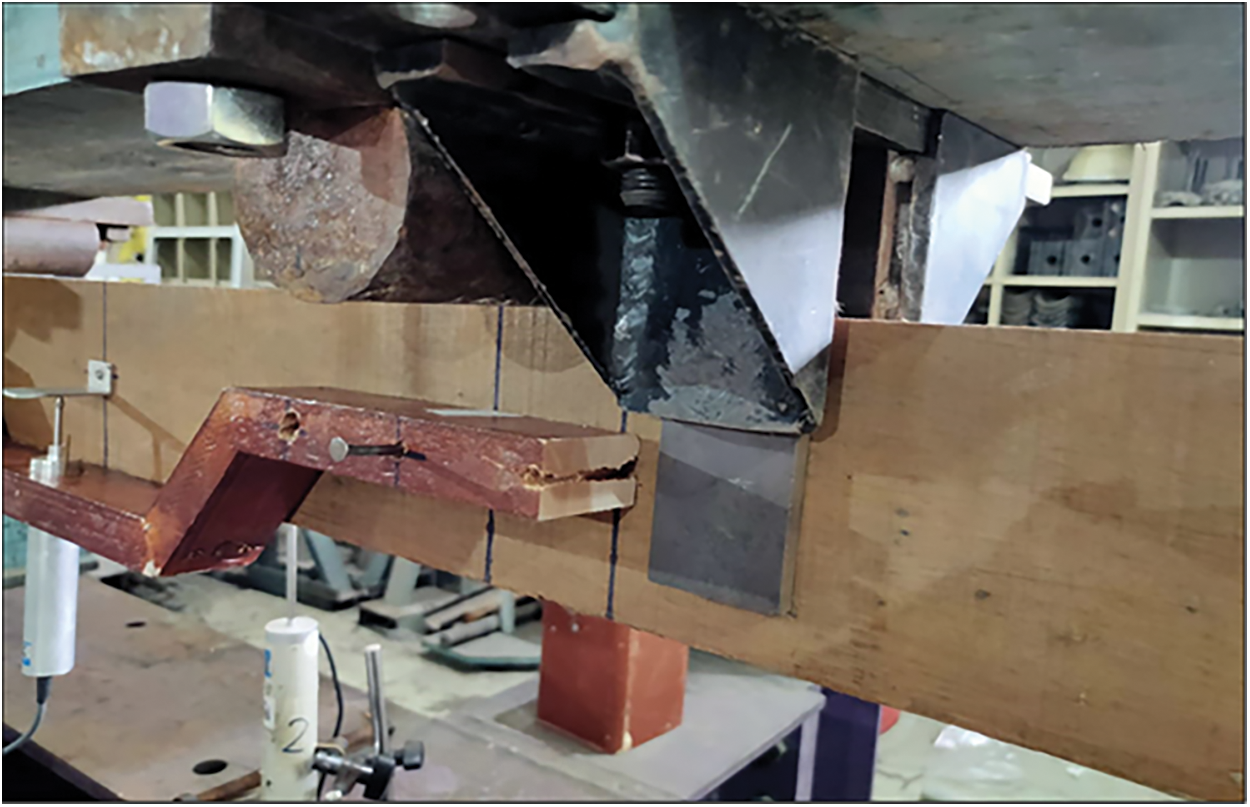
Figure 2: Setup for bending test with bracings for specimens with the length of 2000 and 2500 mm
2.3 Evaluation of Bending Strength
The bending strength was calculated using Eq. (1), which is the classic formula for determining the bending stress in a beam under simple bending.
where:
a distance between a loading point and the nearest support (a = 6 × h);
b beam width in mm;
h beam height in mm;
F load in newtons.
2.4 Determination of Moisture Content and Density
The MC of the bending specimens was determined using oven dry method according to MS 837: 2006 [15]. Three test pieces with a thickness of 25 mm (parallel to the grain) were cut from each bending specimen. The initial weight of each test piece was recorded before it was placed in the oven. The oven temperature was maintained at 103°C ± 2°C. After 24 h, the test pieces were removed from the oven and weighed. Then, test pieces were returned to the oven and reweighted every 2 h until no further weight loss was observed. The weight was measured using an electronic weighing balance with a precision of 0.1 decimal point. The moisture content was calculated using Eq. (2) as follows:
The density for each specimen was determined using the same test pieces used for MC evaluation. Before putting the test pieces in the oven, their dimension was measured. The density was calculated using Eq. (3) as follows:
2.5 The Depth Adjustment Formula
According to BS EN 384: 2016 [11], for specimens tested with a depth less than 150 mm, and a characteristic density less than or equal to 700 kg/m3, the individual bending strength must be adjusted to 150 mm depth by dividing by the factor kh from Eq. (4):
In addition, the bending strength must be divided by factor kI from Eq. (5), if the bending test follows the arrangement as outlined in BS EN 408: 2012 [13], but uses a different span (ℓ) or different distance between the inner load point (af) than 18 and 6 h, respectively.
where:
ℓet effective test length in mm;
ℓ span within the test arrangement;
αf distance between the two inner loading points;
αf and ℓ are the values taken from the test.
2.6 Determination of Characteristic Density
The characteristic density of the specimens was derived from the 5th percentile density value in accordance with BS EN 14358: 2016 [16] and BS EN 384: 2016 [11]. The derivation process of characteristic density is illustrated in Fig. 3.
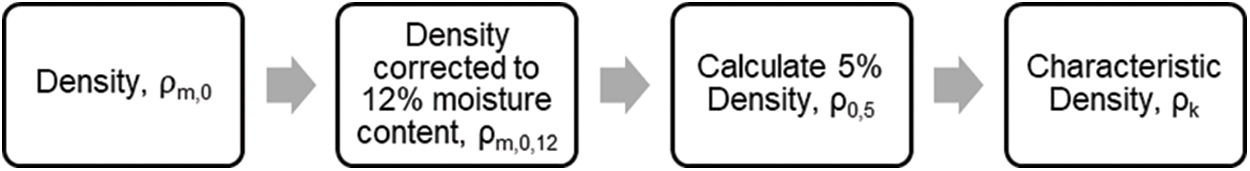
Figure 3: The derivation process of characteristic density
Initially, the density at testing, ρm,0 for all the specimens was determined. Since the specimens used in this study vary in terms of species, cross-section and regions, there was a variation in moisture content value. As a result, the densities were adjusted to the reference MC of 12%, ρm,0,12.
Following the MC adjustments, the 5th percentile values for each sub-sample were determined according to BS EN 14358: 2016 [16]. The sub-samples for this study were the sizes of the specimens tested and denoted as ρ0.5. Then, the characteristic values for density were derived from the 5th percentile density values as outlined in BS EN 384: 2016 [11] and denoted as ρk.
2.7 Evaluation of Density Corrected to 12% Moisture Content
For an accurate evaluation or assessment of the test results, thorough attention must be given to the MC of each specimen. As specified in BS EN 384: 2016 [11], the density of the specimens must be adjusted to the reference MC of 12%, as shown in Eq. (6). When the specimens were tested with MC in the range of 8% to 18%, they were adjusted to 12% moisture content. Meanwhile, for specimens tested above 18% MC, they were adjusted from 18% and not from their actual MC. This modification was carried out to ensure that the value of the strength properties is comparable to their corresponding density at 12% MC.
where:
ρ density
u moisture content at testing (8% ≤ u ≤ 18%)
uref reference moisture content (uref = 12%)
2.8 Evaluation of 5th Percentile Value of Density
After the adjustments of MC were made, the 5th percentile values were calculated for each sub-sample, where the sub-samples for this study were the sizes of the specimens tested. There were 3 sub-samples and 4 sub-samples for each species. The 5th percentile value was determined using the equation given in BS EN 14358: 2016 [16] as shown in Table 3.

where:
y Means of strength after corrected to moisture content
Sy Standard deviations of the strength
ks(n) ks (n) values for strength properties for p = 5% and α = 75% as in Table 1 section 3.2.2 [ref: BS EN 14358: 2016]
2.9 Evaluation of Characteristic Density Value
The characteristic values for density were derived from the 5th percentile density values by using Eq. (7):
where:
ρ0.5,i 5-percentile density of sub-sample i
ρo.5,i,min lowest 5-percentile density of i-sub-samples
ns the number of sub samples
ni the number of specimens in sub sample i
kn factor to adjust for the number of sub-samples as mentioned in Table 1 section 5.5.2.2.1 [ref: BS EN 384: 2016]
To investigate the depth adjustment factor for bending strength, bending tests were conducted on specimens with varying depths of 50, 100, and 125 mm for five different species, namely Kapur, Kempas, Keruing, Light Red Meranti, and Geronggang. Additionally, specimens with a depth of 150 mm were tested for Kapur, Kempas, and Keruing. For Balau, specimens with depths of 60, 75, 100, and 125 mm were tested. Table 4 shows the mean bending strength for each species of timber with different widths and depths.
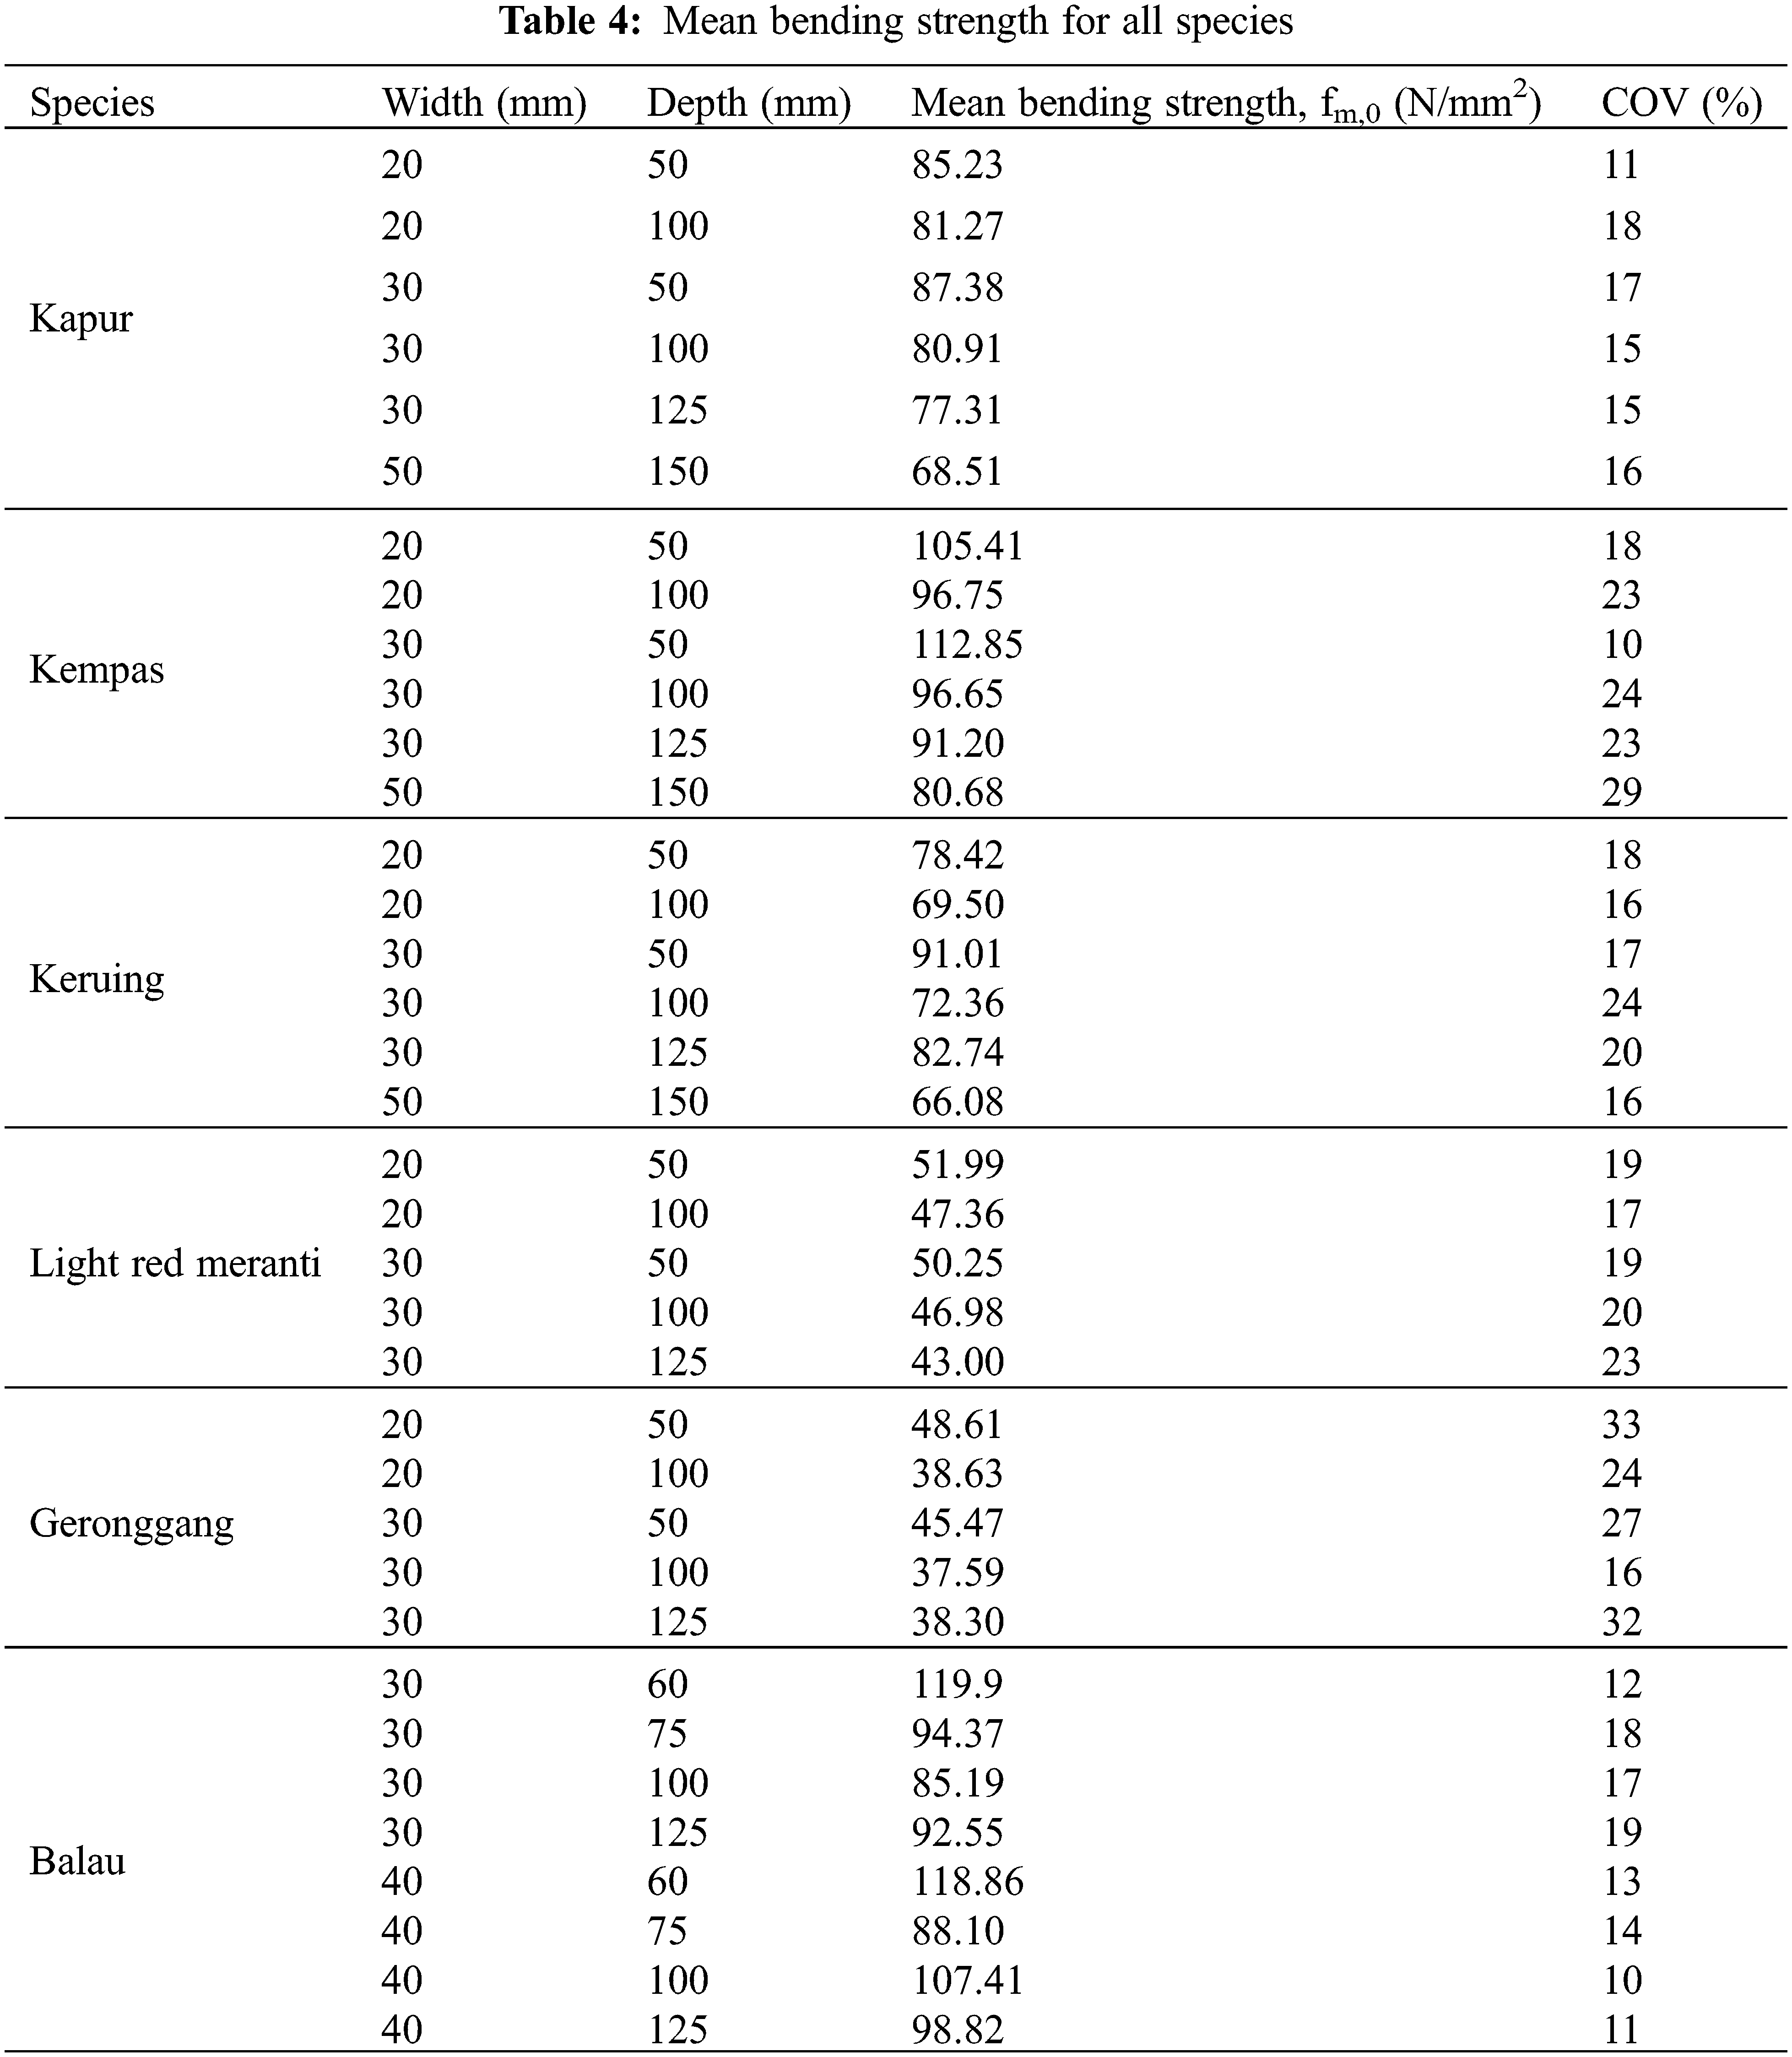
Overall, it can be observed that the strength decreased as the depth increased. Besides that, the size of the specimens also affects the bending strength, especially for Kempas and Light Red Meranti. The bending strength decreased as the size of the specimens increased. However, there was a slight deviation of the general trend for Keruing and Geronggang where the strength decreases when the depth increases from 100 to 125 mm. It is worth noting that there are other factors that influence the strength and the property of timber also vary widely between pieces of the same species [17]. The results suggest that, the size of the specimens can have a significant effect on the bending strength properties either in structural size specimens or small clear specimens due to the dependency of span depth ratio (span length/specimen depth) [18–20].
The size effect on bending strength for timber members has been studied extensively over the last several decades by several researchers. Barrett et al. (1995), Barrett et al. (1990), Bohannan (1996) and Madsen (1990) have laid the foundation of the size effect study for timber [21–24]. However, there are still ongoing debate and discussion among experts about the size effect and its consequences for structural design and safety. Therefore, Vida et al. (2023), Li et al. (2023), Walley and Rogers (2022), Hu et al. (2019) and Nowak et al. (2001) have conducted further researches to address the issue [20,25–28]. Meanwhile, it is widely accepted that the Weibull weakest link theory can effectively represent the size effect in bending, compression and tension [29–32]. According to the weakest link theory, the strength is dependent on the size of the highly stressed volume. Some researchers have discovered that the size effect of clear specimens has been reduced to a depth effect.
BS EN 384: 2016 [11] stated that the bending strength for each specimen needs to be adjusted if the standard reference condition of 150 mm depth is not fulfilled. As a result, a formula for adjusting depth was implemented to ensure that the bending strength, which was determined from specimens of varying depths, remained consistent and comparable. The purpose of this study was to verify the validity of the depth adjustment factor specified in BS EN 384:2016 for six Malaysian hardwood timbers.
The density for Malaysian tropical hardwoods ranged from 720 to 1200 kg/m3 [6]. The density recorded in MS 544: PART 2: 2001 is different from the characteristic density in the EC5 [1]. Fig. 3 depicts the steps involved in determining the characteristic value. The characteristic density value for Kapur, Kempas, Keruing, Light Red Meranti, Geronggang and Balau was calculated and the results are summarised in Table 5.
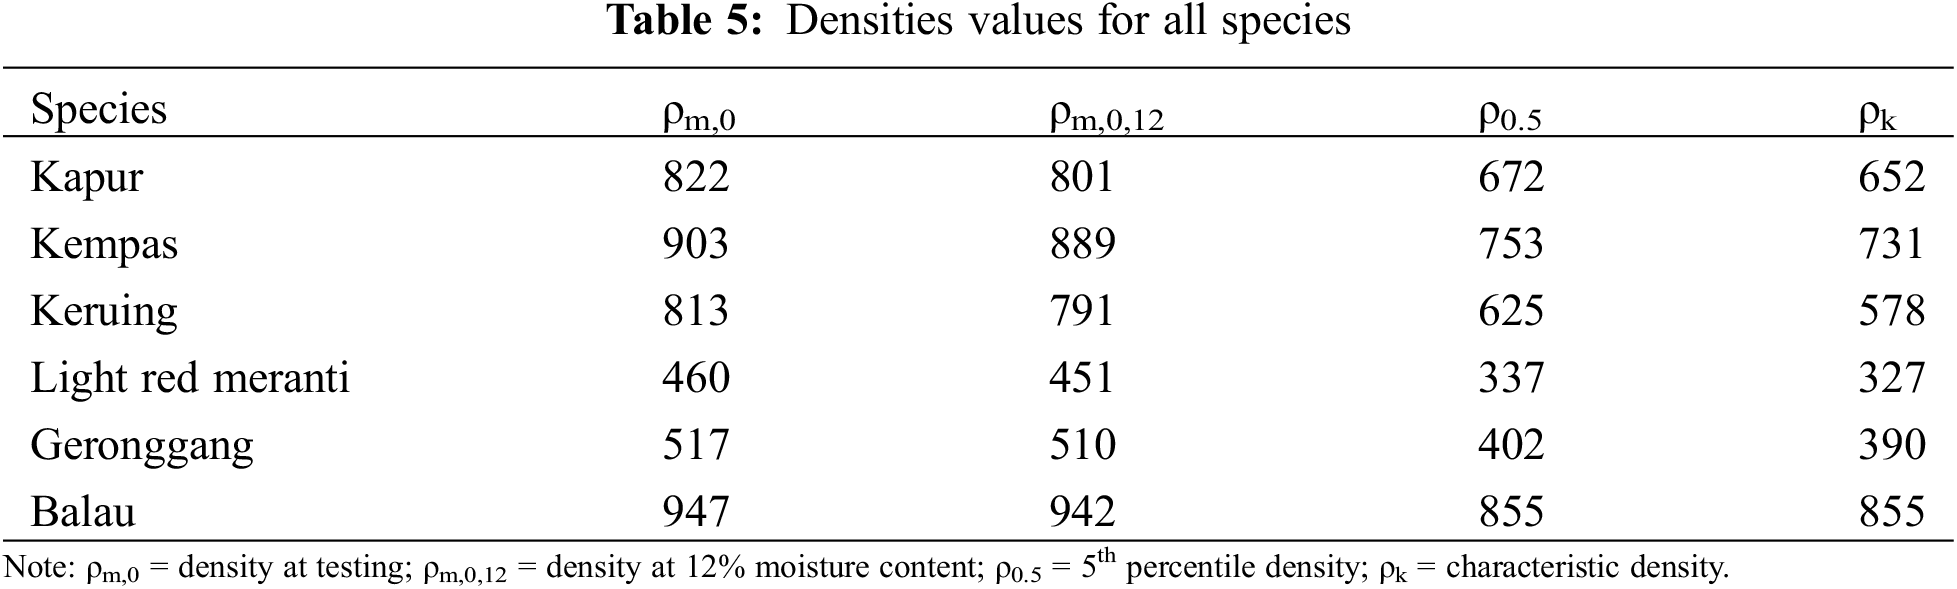
As demonstrated in Table 5, the characteristic density (ρk) for all species is lower than the density (ρm,0). As outlined in BS EN 384: 2016 [11], the depth adjustment formula is only applicable to specimens with a characteristic density less than or equal to 700 kg/m3. Hence, the investigation on the depth adjustment formula was carried out on Kapur, Keruing, Light Red Meranti and Geronggang, which represent the Malaysian hardwood species with a density of less than 700 kg/m3.
It should be noted that Malaysia is also home to hardwood species with a characteristic density exceeding 700 kg/m3, such as Balau, Kempas, Kelat and Resak. To determine whether the depth adjustment formula is applicable to these species, the investigation was extended to include Kempas and Balau, which are representative of the hardwood species with a density greater than 700 kg/m3 as indicated in Table 5.
According to BS EN 384: 2016 [13], for specimens tested with a depth of less than 150 mm, and a characteristic density less or equal to 700 kg/m3, the bending strength must be adjusted to 150 mm depth by dividing with factor kh as shown in Eq. (8).
where:
h depth in mm.
Therefore, the equation of adjusted bending strength to the depth 150 mm are shown in Eq. (9).
To evaluate the applicability of Eq. (9), which represents the depth adjustment formula, for Malaysian hardwoods, graphs were plotted to illustrate the relationship between bending strength and (150/h). Subsequently, a comparison was made between the bending strength equation with adjusted depth (Eq. (10)) and the power trendline equation (Eq. (11)) derived from the plotted graph.
X-axis is 150/h;
Y-axis is bending strength (fm,0);
C is the power value;
When h = 50, 60, 75, 100 and 125 mm.
The power function was selected for the analysis of the graph so that, the power of the equation derived based on the graph can be used to verify with the power of Eq. (10), which is 0.2. Eq. (10) was primarily utilized for comparison with Eq. (11) to determine the power value, rather than for calculating the adjusted bending strength. Fig. 4 shows the individual relationship graphs of bending strength vs. (150/h) for each species. The R2 value, presented in each graph, indicates the degree to which the power function fits the data points for each species, providing valuable information regarding the strength and reliability of the relationship between bending strength and (150/h) for all species.
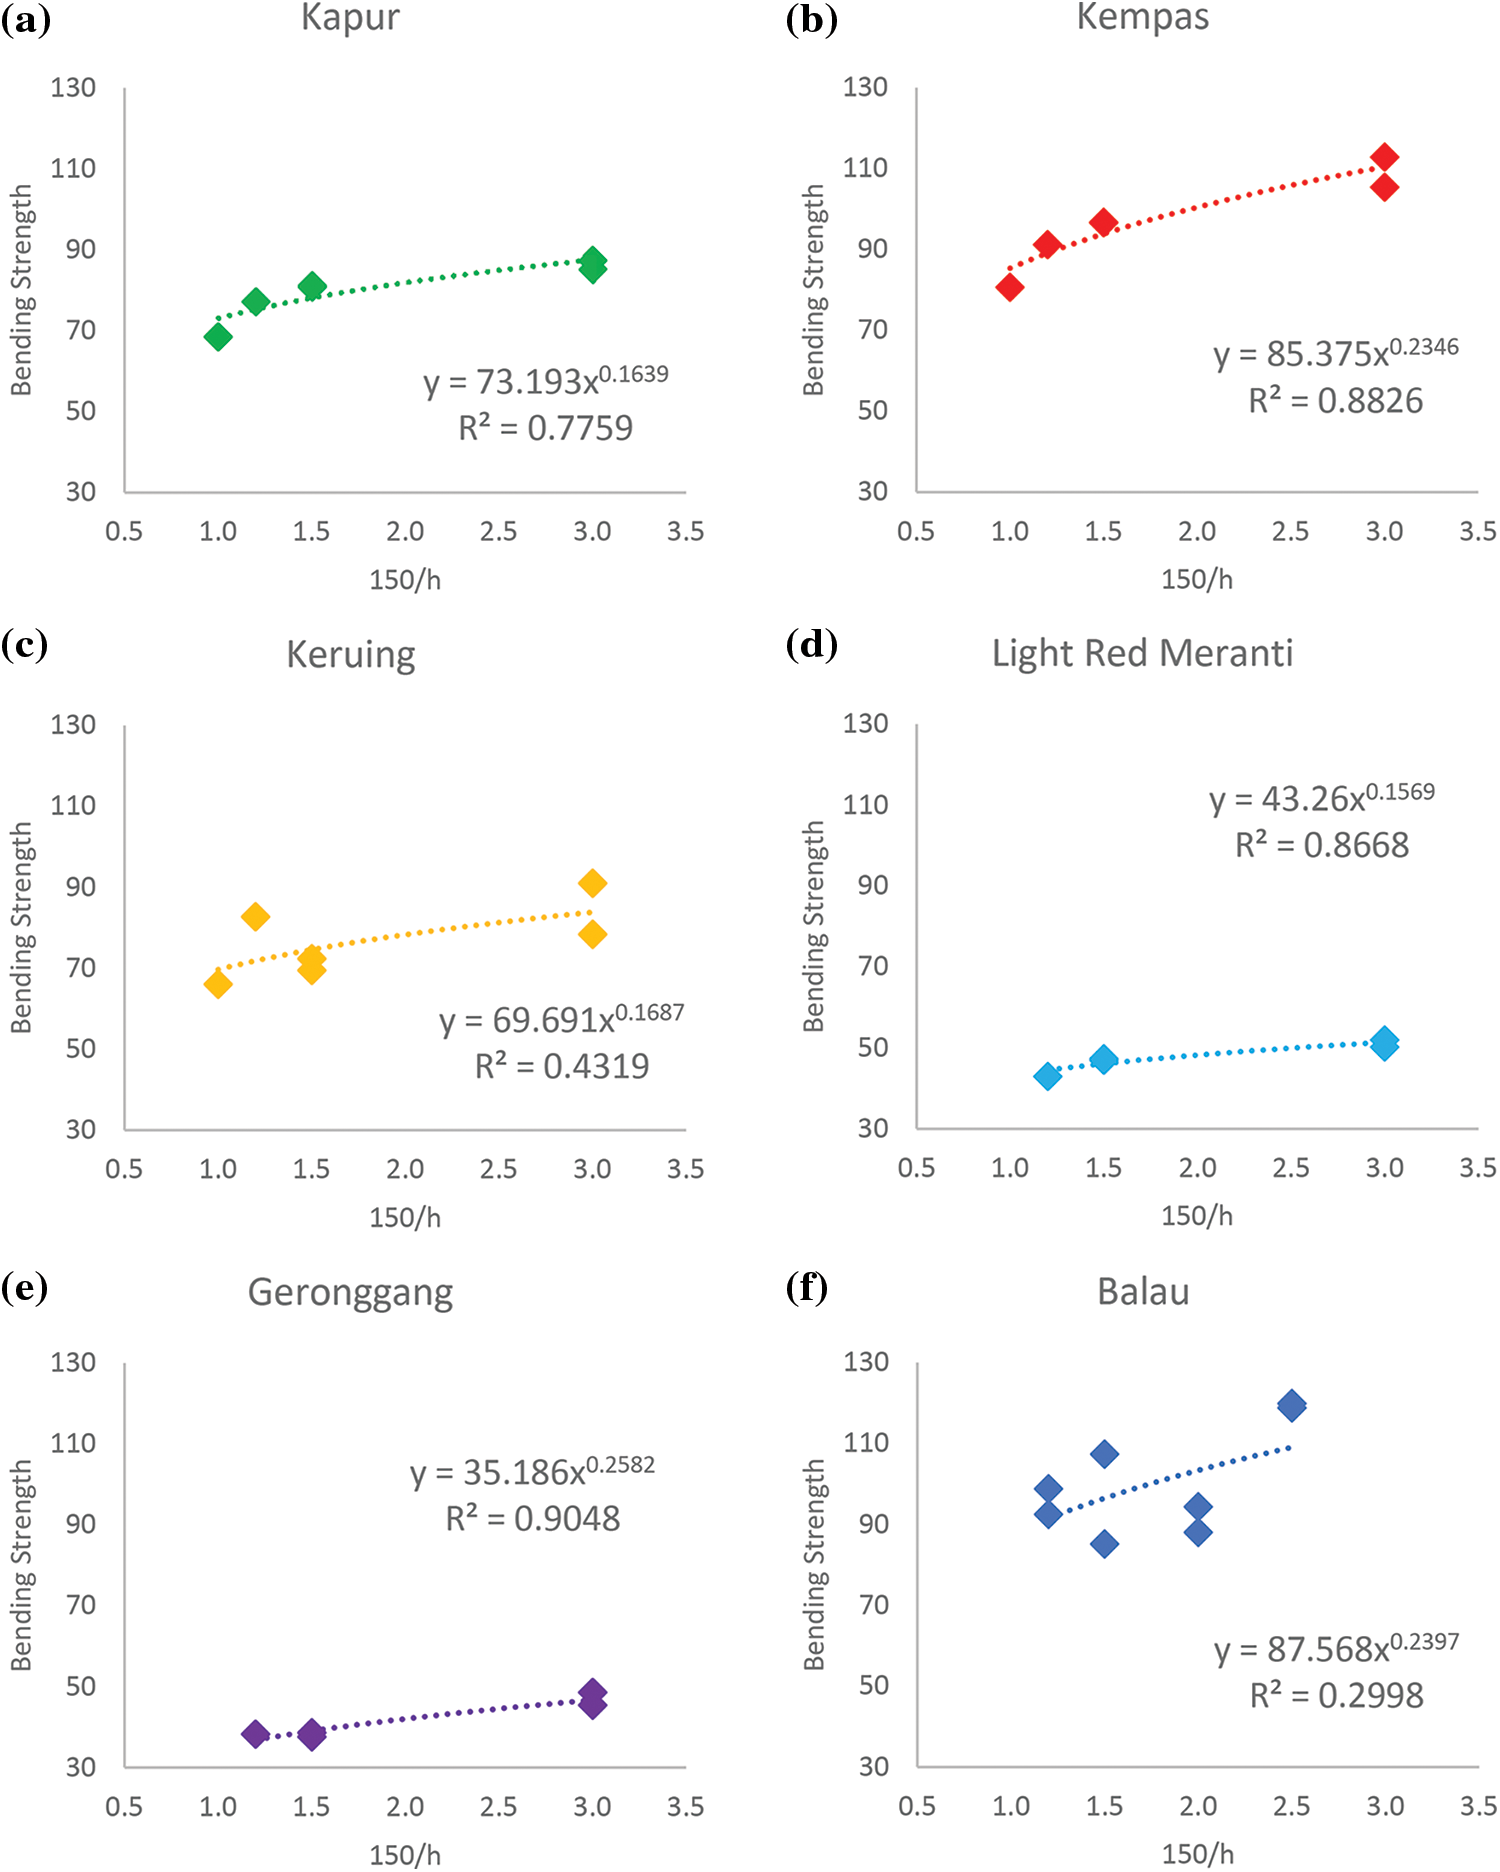
Figure 4: The relationship graph of bending strength vs. (150/h): (a) Kapur; (b) Kempas; (c) Keruing; (d) Light red meranti; (e) Geronggang; (f) Balau
Table 6 displays the power of the regression equation for the depth adjustment formula. Based on Table 6, the power of the regression equations varies by species and ranges from 0.16 to 0.17 for species with characteristic densities lower than 700 kg/m3. It should be noted that Geronggang, while having a characteristic density below 700 kg/m3, displayed a power value of 0.26 which is higher than 0.2. The observed higher power value of Geronggang could be attributed to the high coefficient of variation (COV) in the bending strength data. Consequently, it is possible that the results for Geronggang may not align with the initial hypothesis. Nonetheless, it is worth noting that the depth adjustment formula in EC5 [1] was validated and found to be applicable to Malaysian hardwoods with characteristic density ≤ 700 kg/m3.

In addition, for the Malaysian hardwoods with characteristic densities greater than 700 kg/m3, Kempas and Balau exhibited higher power values than that stated in the standard, at 0.23 and 0.24, respectively. This suggests that, while the power trendline for the data may not precisely match the expected power of 0.2, it is still reasonably close to this value. Therefore, the power equation of 0.2 can be deemed applicable for timber species with a characteristic density greater than 700 kg/m3, even though the specific power value may differ slightly from the expected value. This information can be valuable for researchers and engineers working with timber, as it offers a framework for predicting the adjustment factor of various timber species based on their characteristic density. Based on the results of this study, the adjustment factor of 0.2 can also be applied for timber with a characteristic density greater than 700 kg/m3, but further investigations are necessary to confirm this for a wider range of timber species and characteristic densities.
Barrett et al. [21] reported that, for defect free timber members, the size adjustment factor for depth was 0.25. In another study conducted by Hu et al. [27], the authors discovered that the size factor to the depth of timber for bending was 0.23. Walley et al. [26], in their review, summarised that the value for size effect on bending strength ranged from 0.14 to 0.26. Therefore, based on the analysis of existing literatures on the size effect across various species groups, along with the findings of this study, it can be concluded that a size factor of 0.2 is a suitable value for depth adjustment in relation to bending strength. This value is considered appropriate to be used internationally as well as domestically for the development of standard specifications for wood frame construction in design codes.
Given the extensive research that has been conducted on the depth effect, it is expected that revisions to the depth adjustment factor formula will continue to occur over time. Currently, EC5 [1] specifies a fixed reference depth of 150 mm (h1) and a depth adjustment factor of 0.2 for bending specimens, but only for specimens with a characteristic density of 700 kg/m3 or less. The findings of this study are consistent with the depth adjustment factor formula in EC5 [1] and suggest that it can be applied directly to Malaysian hardwoods, regardless of whether the characteristic density is less than or more than 700 kg/m3.
The depth adjustment formula was investigated using six Malaysian hardwood timbers namely Kapur, Kempas, Keruing, Light red meranti, Geronggang, and Balau. The following are the summary of the key findings of the study:
i) Overall, the bending of the strength of all specimens was observed to decrease as the depth was increased.
ii) The characteristic density of Kapur, Keruing, Light red meranti and Geronggang is less than 700 kg/m3, while Kempas and Balau have a characteristic density of more than 700 kg/m3.
iii) The graphs show that the power of the regression equations for timbers with a characteristic density less than 700 kg/m3, such as Kapur, Keruing, and Light Red Meranti, was 0.16, 0.17 and 0.16, respectively.
iv) While Geronggang also has a characteristic density of less than 700 kg/m3, it has a high power of 0.26 due to large coefficients of variation (COV) in bending strength data.
v) The regression power of Kempas and Balau, both of which have characteristic densities exceeding 700 kg/m3, was found to be higher, with values of 0.23 and 0.24, respectively.
Acknowledgement: Special thanks to the Faculty of Civil Engineering, Universiti Teknologi MARA, Malaysia for providing the experimental facilities, Malaysia Timber Industry Board (MTIB) for sponsoring the article processing charge (APC) and Institute for Infrastructure Engineering and Sustainable Management (IIESM) for their constructive suggestion and full of support.
Funding Statement: This research was funded by Geran Penyelidikan Khas (GPK), (600-RMC/GPK 5/3 (071/2020)).
Conflicts of Interest: The authors declare that they have no conflicts of interest to report regarding the present study.
References
1. EN 1995-1-1: 1995 (1995). Eurocode 5: Design of timber structures. Geneva, Switzerland: European Committee for Standardization. [Google Scholar]
2. Yusoh, A. S., Tahir, P. M., Uyup, M. K. A., Lee, S. H., Husain, H. et al. (2021). Effect of wood species, clamping pressure and glue spread rate on the bonding properties of cross-laminated timber (CLT) manufactured from tropical hardwoods. Construction and Building Materials, 273(3), 121721. https://doi.org/10.1016/j.conbuildmat.2020.121721 [Google Scholar] [CrossRef]
3. Sheikh, S., Ahmad, Y. (2015). Flexural timber design to eurocode 5 and the Malaysian timber code MS 544: 2001. Malaysian Journal of Civil Engineering, 27(1), 207–223. [Google Scholar]
4. Ahmad, Z., Lum, W. C., Lee, S. H., Razlan, M. A., Mohamad, W. H. W. (2017). Mechanical properties of finger jointed beams fabricated from eight Malaysian hardwood species. Construction and Building Materials, 145(9), 464–473. https://doi.org/10.1016/j.conbuildmat.2017.04.016 [Google Scholar] [CrossRef]
5. Arriaga, F., Osuna-Sequera, C., Bobadilla, I., Esteban, M. (2022). Prediction of the mechanical properties of timber members in existing structures using the dynamic modulus of elasticity and visual grading parameters. Construction and Building Materials, 322(3), 126512. https://doi.org/10.1016/j.conbuildmat.2022.126512 [Google Scholar] [CrossRef]
6. MS 544 Part 2: 2001 (2001). Code of Practice for Structural use of Timber—Part 2: Permissible Stress Design of Solid Timber. Department of Standard Malaysia (DSM). [Google Scholar]
7. MS 544 Part 3: 2001 (2001). Code of Practice for Structural Use of Timber—Part 3: Permissible Stress Design of Glued Laminated Timber. Department of Standard Malaysia (DSM). [Google Scholar]
8. Azmi, A., Ahmad, Z., Lum, W. C., Baharin, A., Za’ba, N. I. L. et al. (2022). Compressive strength characteristic values of nine structural sized malaysian tropical hardwoods. Forests, 13(8), 1172. https://doi.org/10.3390/f13081172 [Google Scholar] [CrossRef]
9. Baharin, A., Ahmad, Z., Lum, W. C. (2020). Bending strength properties of keruing and light red meranti in structural size in accordance with Eurocode 5. International Journal of Innovative Technology and Exploring Engineering, 9(4), 1323–1327. https://doi.org/10.35940/ijitee.C8362.029420 [Google Scholar] [CrossRef]
10. Zaba, N. I. L., Ahmad, Z., Lum, W. C. (2019). Tensile strength properties of small clear and structural size specimens of kempas, keruing and light red meranti. Malaysian Construction Research Journal, 28(2), 11–19. [Google Scholar]
11. BS EN 384: 2016 (2016). Structural timber—Determination of characteristic values of mechanical properties and density. The British Standards Instituition. [Google Scholar]
12. Choo, K. T., Gan, K. S., Lim, S. C. (1998). Timber Notes–Light Hardwoods I. Kepong, Kuala Lumpur, Malaysia: Timber Technology Centre (TTCFRIM. https://info.frim.gov.my/infocenter/booksonline/ttb/TTBno9.pdf [Google Scholar]
13. BS EN 408: 2010+A1: 2012 (2012). Timber structures. Structural timber and glued laminated timber. Determination of some physical and mechanical properties. The British Standards Institution. [Google Scholar]
14. EN 1912: 2012 (2012). Structural Timber—Strength Classes—assignment of Visual Grades and Species. Geneva, Switzerland: European Committee for Standardization. [Google Scholar]
15. MS 837: 2006 (2006). Solid Timber—Determination of Moisture Content. Department of Standard Malaysia (DSM). [Google Scholar]
16. BS EN 14358 (2016). Timber Structures—Calculation and Verification of Characteristic Values. The British Standards Instituition. [Google Scholar]
17. Wang, Y., Wang, T., Crocetti, R., Wålinder, M. (2022). Experimental investigation on mechanical properties of acetylated birch plywood and its angle-dependence. Construction and Building Materials, 344, 128277. https://doi.org/10.1016/j.conbuildmat.2022.128277 [Google Scholar] [CrossRef]
18. Schneeweib, G., Felber, S. (2013). Review on the bending strength of wood and influencing factors. American Journal of Materials Science, 3(3), 41–54. [Google Scholar]
19. Gao, D., Chen, B., Wang, L., Tang, C., Yuan, P. (2022). Comparative study on clear specimen strength and member strength of side-pressure laminated bamboo. Advances in Civil Engineering, 2022, 546792. https://doi.org/10.1155/2022/2546792 [Google Scholar] [CrossRef]
20. Vida, C., Lukacevic, M., Hochreiner, G., Füssl, J. (2023). Size effect on bending strength of glued laminated timber predicted by a numerical simulation concept including discrete cracking. Materials & Design, 225, 111550. https://doi.org/10.1016/j.matdes.2022.111550 [Google Scholar] [CrossRef]
21. Barrett, J. D., Lam, F., Member, A. S. C. E., Lau, W. (1995). Size effects in visually graded softwood structural lumber. Journal of Materials in Civil Engineering, 7(1), 19–30. https://doi.org/10.1061/(ASCE)0899-1561(1995)7:1(19) [Google Scholar] [CrossRef]
22. Barrett, J. D., Fewell, A. R. (1990). Size factors for the bending and tension strength of structural lumber. Proceedings of CIB Working Commission W18A—Timber Structures, Lisbon, Portugal. [Google Scholar]
23. Bohannan, B. (1966). Effect of size on bending strength of wood members, Washington DC: U.S. Department of Agriculture, Forest Service, Forest Products Laboratory. [Google Scholar]
24. Madsen, B. (1990). Size effect in defect-free douglas fir. Canadian Journal of Civil Engineering, 17(2), 238–242. https://doi.org/10.1139/l90-029 [Google Scholar] [CrossRef]
25. Li, M., He, M., Li, Z. (2023). Size effects on the bending strength of Chinese larch pine laminated veneer lumber. European Journal of Wood and Wood Products. https://doi.org/10.1007/s00107-023-01933-8 [Google Scholar] [CrossRef]
26. Walley, S. M., Rogers, S. J. (2022). Is wood a material? Taking the size effect seriously. Materials, 15(15), 5403. https://doi.org/10.3390/ma15155403 [Google Scholar] [PubMed] [CrossRef]
27. Hu, W., Wan, H., Guan, H. (2019). Size effect on the elastic mechanical properties of beech and its application in finite element analysis of wood structures. Forests, 10(9), 783. https://doi.org/10.3390/f10090783 [Google Scholar] [CrossRef]
28. Nowak, T., Patalas, F., Karolak, A. (2021). Estimating mechanical properties of wood in existing structures—selected aspects. Materials, 14(8), 1941. https://doi.org/10.3390/ma14081941 [Google Scholar] [PubMed] [CrossRef]
29. Brandner, R., Jantscher, L. (2022). Out-of-plane tensile properties of cross laminated timber (CLT). Buildings, 12(2), 135. https://doi.org/10.3390/buildings12020135 [Google Scholar] [CrossRef]
30. Totsuka, M., Jockwer, R., Aoki, K., Inayama, M. (2021). Experimental study on partial compression parallel to grain of solid timber. Journal of Wood Science, 67(1), 39. https://doi.org/10.1186/s10086-021-01972-w [Google Scholar] [CrossRef]
31. Milner, H. R. (2018). A study of the strength of glued laminated timber. Australian Journal of Structural Engineering, 19(4), 256–265. https://doi.org/10.1080/13287982.2018.1509765 [Google Scholar] [CrossRef]
32. Lei, W. S. (2018). A generalized weakest-link model for size effect on strength of quasi-brittle materials. Journal of Materials Science, 53(2), 1227–1245. https://doi.org/10.1007/s10853-017-1574-8 [Google Scholar] [CrossRef]
Cite This Article
 Copyright © 2023 The Author(s). Published by Tech Science Press.
This work is licensed under a Creative Commons Attribution 4.0 International License , which permits unrestricted use, distribution, and reproduction in any medium, provided the original work is properly cited.
 Downloads
 Citation Tools